 Fabio Giavazzi
 Chiara Malinverno
 Giorgio Scita
 Roberto Cerbino
- 1Department of Medical Biotechnology and Translational Medicine, University of Milan, Milan, Italy
- 2Department of Oncology and Hemato-Oncology-DIPO, University of Milan, Milan, Italy
- 3IFOM, The FIRC Institute of Molecular Oncology, Milan, Italy
A biological tissue is an ensemble of soft cells in close physical contact. Events such as cell-shape changes and, more rarely, cell-divisions and apoptosis continuously occur in a tissue, whose collective behavior is set by the cumulative occurrence of such events. In this complex environment, quantifying the single-cell dynamics is key to extract quantitative information to be used to capture the fundamental ingredients of this collective tissue dynamics for validating the predictions of models and numerical simulations. However, tracking the motion of each cell in a dense assembly, even in controlled in vitro settings, is a demanding task, because of a combination of different factors, such as poor image quality, cell shape variability and cell deformability. Here we show that Differential Dynamic Microscopy (DDM), an approach that provides a characterization of the sample structure and dynamics at various spatial frequencies (wave-vectors), can be used successfully to extract quantitative information about a confluent monolayer of Madin-Darby Canine Kidney (MDCK) epithelial cells. In particular, combining structural and dynamical information obtained at different wave-vectors, we show that DDM can provide the single-cell mean squared displacement and the cell division rate at various stages during the temporal evolution of the monolayer. In contrast with tracking algorithms, which require expert supervision and a considerate choice of the analysis parameters, DDM analysis can be run in an automated fashion and yields an unbiased quantification of the dynamic processes under scrutiny, thus providing a powerful means to probe the single-cell dynamics within dense cell collectives.
1. Introduction
With or without fluorescent labeling, optical microscopy is widely used to map in space and time the shape, structure and dynamics of cells in isolation, as well as in large groups. Through quantitative microscopy, it has become clear in the last years that cells in a collective tend to behave very differently from isolated cells. In particular, confluent epithelial cell monolayers were found to exhibit a range of states that resemble the liquid and solid states of inert soft matter, with the liquid state being favored at small cell densities and the solid one emerging at larger densities [1]. While the transition between the liquid-like and solid-like states of monolayers might be an expected mechanical response of tissues, which are constantly subjected to physical stresses, it has been shown to be governed by a variety of biophysical and biochemical interactions and characterized by peculiar states and emerging collective properties [2, 3]. The latter might have strong implications not only for interpreting fundamental biological processes, but also in determining the outcome of diseases, first and foremost in cancer dissemination [4].
In this frame, being able to quantify the motility of individual cells at an arbitrary density but particularly in a dense, confluent tissue remains of key importance not only for characterizing and understanding the tissue but also to obtain accurate estimates of biophysical quantities to be compared with theoretical models and simulations [5]. However, several factors make this quantification very difficult and, whenever possible, quite time-consuming and rarely operator-free. One limiting factor is that cells are very deformable objects, whose shape is not prescribed, which leads to the impossibility of using standard shape-matching or correlation based approaches. Another problem is that the optical quality of microscope images does not always ensure a proper signal-to-noise ratio to enable a sufficiently accurate and automated reconstruction of the features of the cell assembly. In practice, this implies that the reconstruction e.g., of cell positions as a function of time is a task that often requires to be operator-supervised. Additionally, repeating this operation over several image frames of a time-lapse recording often entails an overwhelming amount of work to ensure the required quality of typical outputs, such as the mean squared displacement (MSD) of cells as a function of time.
In principle, an alternative approach to probe cells is represented by Differential Dynamic Microscopy (DDM), a quantitative method that analyzes intensity fluctuations in microscope images by using a combination of spatial Fourier transforms and differences of the acquired images [6]. DDM, which has been successfully used in the past ten years with a variety of biological and non-biological systems, probes samples as a function of the Fourier wave-vector q thus enabling a multi-scale characterization of their structural and dynamical properties [7]. Being DDM equivalent to a scattering technique [8, 9], the multi-scale information extracted from it is in general revealing of the collective effects on the system. For instance, DDM performed on Brownian colloidal particles mostly probes their collective dynamics rather than the self one, which is usually the result of real-space particle tracking approaches [10]. However, while for inert colloidal particles a theoretical framework exists [11] that enables to extract a large amount of information about the particle-particle interactions from the q resolved scattering information extracted by DDM [12], using a similar approach with cell monolayers is a challenging feat. In fact, a general theoretical framework to treat collective effects in cells is currently lacking, although few remarkable studies have been performed, in which collective density or velocity fluctuations in confluent monolayers were effectively characterized by studying their correlation properties in the Fourier space [1, 13, 14].
Here we address successfully a simpler problem, as we show for the first time that, by a combined use of structural and dynamical q-resolved information, DDM provides single-cell motility information without need of tedious real space tracking of the moving cells. Our experiments are performed with confluent monolayers of Madin-Darby Canine Kidney (MDCK) cells during time. We acquire data both with phase-contrast microscopy, in which the cell membrane and different organelles are visible, as well as with wide-field fluorescence microscopy of EGFP-H2B expressing cells, which highlights the cell nuclei. As far as the fluorescence movies are concerned, we first extract the nuclei MSD with standard particle-tracking algorithms [15], as a function of time as the monolayer ages. For each stage, we find a super-diffusive behavior for large delay times Δt, whereas for shorter times the MSD exhibits a milder Δt-dependence. As the monolayer ages, the dynamics slows down, as expected for jamming monolayers [1, 16]. We then apply our DDM methodology to analyze the nuclei dynamics only for those wave-vectors q for which the effect of interactions is suppressed, by focusing only on those wave-vectors for which the structure factor of the monolayer, which encodes the interactions, is equal to one. When these data are converted into q-dependent MSD we find that they do not collapse on a single master curve, coincident with the MSD determined by real-space tracking. We show that this apparent discrepancy is the result of nuclei undergoing other events (e.g., rotations, internal dynamics, mitosis events) that introduce a q-dependent dynamics. By extrapolating the MSD to q → 0 we recover the same result of tracking and we can isolate the spurious dynamics, which is found to be mainly dominated by cell division events, in particular for young monolayers. In addition, we also analyze the phase-contrast movies, on which standard tracking approaches are not easily applicable: DDM analysis gives MSD identical to the ones obtained with the nuclei only for large times (i.e., in the super-diffusive regime), whereas the short-time dynamics is found to contain additional information likely originated from sub-cellular dynamics of portions of the cells other than the nuclei.
Our results prove that microscopy-based scattering-like experiments may indeed be very useful for assessing single-cell properties of dense cell monolayers, a situation in which the use of standard light scattering methods has been in the past very limited [17–19], mainly because of technical challenges arising when using them with cells. Our work also paves the way to the DDM study of the interplay between single-cell dynamics, structural properties and collective effects in dense cell monolayers, which will be addressed in the future.
2. Materials and Methods
2.1. Cell Culture
MDCK cells were maintained in Dulbeccos Modified Eagle Medium medium (Lonza) supplemented with 5% fetal bovine serum (Sigma Aldrich) and 1% L-Glutamine (EuroClone). Constitutive expression of EGFP-H2B was achieved by retroviral infection. The plasmid pBABE-puromycin (puro)- EGFP-H2B was provided by IFOM-Imaging Facility. Packaging of retroviruses was performed following standard protocols. Viral supernatant was collected and filtered through 0.45 μm filters. Cells were subjected to four cycles of infection and selected using the appropriate antibiotic (1.5 μg/ml puromycin).
2.2. Microscopy Observation
Cells were seeded in a 6-well plate (1.5·106 cells/well) in complete medium and cultured until a uniform monolayer had formed. Cell medium has been refreshed 16 h before performing the experiment by adding fresh complete media and the day after before starting imaging. Olympus IX81 inverted microscope with 10x objective was used to acquire images (both in wide-field fluorescence and in phase contrast) every 60 s over a 24 h period (Supplementary Movies SM1, SM2). Six independent fields-of-views (FOVs) are considered. The assay was performed using an environmental microscope incubator set to 37°C and 5% CO2 perfusion. Under the above-described experimental conditions, the entire available space is occupied evenly by the cells, that form a dish-spanning monolayer. The analysis of cell motion is then performed across different, randomly positioned FOVs. This protocol is aimed at minimizing inhomogeneity and anisotropy in cell density and shape and at preventing any directional bias in the motility pattern of the monoloayer.
2.3. Image Processing
The acquired images are processed with a combination of different image processing tools to obtain a characterization of the monolayer in direct space (with particle tracking) and reciprocal space (with DDM). In all cases, in order to follow the time evolution of the monolayer dynamics, each image sequence (composed of about 1,400 frames, acquired at 1 frame/min) is divided into 13 evenly spaced and partially overlapping sub-sequences, each one composed by 200 consecutive frames. Each sub-sequence is analyzed separately, under the implicit assumption of stationarity of the statistical properties within a 200 min time window.
2.3.1. Particle Tracking
Single particle tracking (PT) is performed on fluorescence image sequences by using the ImageJ [20, 21] MosaicSuite plugin. Details on the tracking algorithm can be found in Sbalzarini et al. [15]. Thanks to the fair monodispersity and circularity of the fluorescent nuclei and to their high contrast, only a minimal preprocessing (smoothing of the images with a Gaussian filter with standard deviation of 0.5 pixels) was necessary before running the tracking algorithm (Figure 1A). The tracking algorithm identifies the positions of all “particles” in each frame and links the positions of the same particle in consecutive frames to reconstruct its trajectory (Figure 1B). The tracking routine provides thus the position xn(t) of the centroid of each nucleus as a function of time. The output of the tracking software is loaded by a custom code developed in MATLAB that performs statistical analysis of the data. In particular, we calculate the mean square displacement (MSD) of the nuclei as
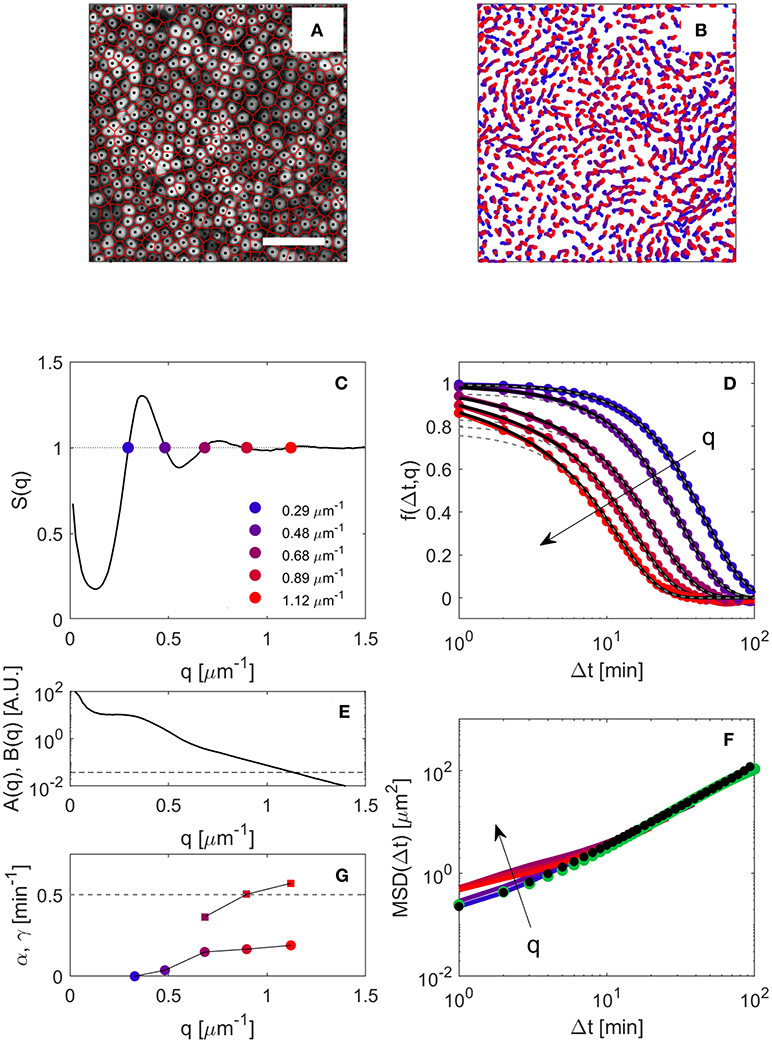
Figure 1. (A) Representative wide-field fluorescence microscopy image of a highly-confluent MDCK monolayer. Bar corresponds to 100 μm. Black dots indicate the positions of the nuclei, as obtained from PT. The red network is the Voronoi diagram of the nuclei. (B) Trajectories of the nuclei over a time interval of 200 min, about 3 h after the beginning of the experiment. (C) Structure factor S(q) of the monolayer about 3 h after the beginning of the experiment, obtained as an average over 6 independent FOVs. Colored points are drawn in correspondence of the five smallest wave-vector qi for which S(q) = 1. (D) ISF obtained from DDM analysis for the five wave-vectors outlined in (C), with the same color code. Continuous black lines are fits to the data with the model given in Equation (11) (see text for details). The slowest decay obtained from the fit is also shown as dashed gray lines. (E) Signal amplitude A(q) (continuous line) and noise baseline B(q) (dashed line), as obtained from Equations (5, 6). (F) Continuous lines: MSD 〈|Δx|2〉 extracted from direct inversion the ISFs shown in (D) using (Equation 10) (color code as in C,D), black dots, low-q limit of the MSD; green dots, MSD obtained from PT. (G) Relative amplitude α and correlation rate γ of the fast decay obtained by fitting the ISFs shown in (D) with Equation (11). The dashed horizontal line corresponds to γ = 0.5 min−1.
Here the angular brackets 〈·〉n,t0 indicates an average over all nuclei n and initial time points t0 such that both t0 and t0+Δt are comprised in the considered time window. In the calculation of MSD, we consider only nuclei whose reconstructed trajectory is fully connected and longer than 50 time steps.
2.3.2. Obtaining Structural Information About the Monolayer
The cell spatial arrangement is determined by the direct interactions, which are encoded in the static structure factor
where N0 is the total number of cells in the FOV, xn the position of the n-th cell (identified as the centroid of its nucleus) and 〈·〉 indicates an average over different experimental realizations and, in the case of a stationary system, over a prescribed time window. Since in our experiments the monolayers dynamics exhibit a structural isotropy, we define and use the isotropically-averaged static structure factor S(q) ≡ 〈S(q)〉|q| = q, which is obtained as the orientational average 〈·〉|q| = q of S(q). In this work, S(q) at different stages of the monolayer evolution is estimated via (Equation 2) by using the cell positions provided by PT analysis of fluorescence images. The average is performed over 10 different frames (uniformly distributed within the 200 consecutive frame subsequence) and over six independent FOVs.
2.3.3. Differential Dynamic Microscopy
DDM is a simple yet powerful tool to analyze time-lapse microscopy experiments and extract quantitative information about the structure and dynamics of a large class of microscope samples. As of today, DDM was applied successfully to a wide variety of physical and biological systems [7], including dilute isotropic [6, 22] and anisotropic [23, 24] colloidal particles, dense colloidal suspensions [12, 25, 26], molecular [27] and complex [28, 29] fluids, motile microorganisms [12, 30, 31], sub-cellular structures [32, 33], and microrheology [34, 35]. DDM offers numerous advantages [9], such a simple implementation based on optical microscopes, low sensitivity to normal amounts of dirt or multiple scattering, and the possibility of using a variety of image-contrast mechanisms: bright field [6], dark-field [22], phase contrast [30], wide field fluorescence [36], polarized [24, 29], differential interference contrast [32], light sheet [37], and confocal microscopy (ConDDM) [12, 25, 26, 38]. The image processing algorithm on which DDM is based, described in detail in Croccolo et al. [39], Cerbino and Trappe [6], Giavazzi et al. [40], and Giavazzi and Cerbino [9] is here only briefly recalled. A sequence of N digital images I(x, t) is acquired, where x = dpix(nx, ny) and t = nΔt0. Here dpix is the effective pixel size (the physical pixel size divided by the objective magnification), nx, ny are integer numbers comprised between 1 and the image size M (expressed in pixels and assumed to be the same for both dimensions) and Δt0 is the time interval between two consecutive images. The dynamical information is extracted from the image structure function D(q, Δt), which is calculated as
where FFT indicates the the Fast Fourier Transform operation and q = q0(mx, my), with mx,my integers comprised between and and . The expectation value 〈·〉 is taken over time and, possibly, over different replicas of the same experiment. For a linear space-invariant imaging process, the image structure function takes the form [40]
where A(q) is an amplitude term that depends on the spatial intensity correlations present in the images and B(q) accounts for the noise of the detection chain. The function f(q, Δt) coincides with the normalized intermediate scattering function (ISF) probed by Dynamic Light Scattering [9, 41]. We note that if all the time-independent, additive spurious contributions to the image intensity (due for example to stray light, out of plane fluorescence, dirt in the optical path) are negligible, the amplitude of the structure function coincides, up to an additive noise term, with twice the mean value of the Fourier spectrum of a single image [9]:
This is relation is found to hold with very good approximation for the experiments presented in this work, for both the employed imaging conditions (wide-field fluorescence and phase contrast). In a typical imaging condition, the most relevant contributions to the fluctuating noise in a digital image come from the “readout” noise (associated with the camera electronic circuit) and from the “shot” noise (due Poissionan fluctuations in the number of sensed photons) [42]. In both cases, the random intensity fluctuation is substantially uncorrelated over different pixels, leading to a “white” spatial noise power spectrum B(q) ≃ const ≡ B. Under this assumption, a simple mean to estimate B is provided by Equation (5) that, in the limit of large q, (where A(q) → 0) reads [43]:
If the conditions under which Equations (5, 6) hold are fulfilled, A and B can be unambiguously estimated from static measurements. This enables extracting the ISF directly from the structure function as:
without assuming a priori any model nor performing any curve fitting procedure, as typically done when the above condition are not met [9]. A number of high performance DDM software packages has been developed and made freely available from different authors in the last years. The interested reader could consider, for example, one the following resources: https://github.com/peterlu/ConDDM [12], https://github.com/MathieuLeocmach/DDM [44], or https://engineering.ucsb.edu/~helgeson/ddm.html [22].
2.3.4. Characterizing the Dynamics of the Monolayer
The dynamics of the monolayer at different length scales is captured by the ISF f(q, Δt), which we estimate from DDM analysis by using (Equations 4, 7). For a system of identical particles with no internal degrees of freedom, f can be written as
In this expression, the ISF f is expressed as a sum of its self part fs, that involves only single particles displacements Δxn, and its distinct part, that depends of mutual displacements of different particles. In particular, for all wave-vectors q such that S(q) = 1, f coincides with its self part fs that, for a system of identical particles with no internal degrees of freedom, is equal to the Fourier transform of the single particle displacement probability density function P(Δx, Δt) [9, 11, 45]
A special case is the one where, for a given Δt, P(Δx, Δt) is a Gaussian function of Δx, with zero mean and variance 〈|Δx|2〉. In this case, the ISF reads [35]
Equations (9, 10) are valid under the assumption that the only relevant degree of freedom contributing the optical signal is the one associated with the displacement of the centroids of the particles. In particular, the particles should maintain their shape and orientation over time. For the sample under study, this is only approximately true. In particular, during cell division, the nucleus suddenly shrinks and elongates and its shape changes dramatically. This effect is particularly striking when the monolayer is observed in fluorescence microscopy, while in phase contrast it has a milder optical signature (see Supplementary Movie SM3). We incorporate this effect in the ISF by assuming the following form
where g is a function describing the dynamics of cell shape fluctuation and α is a relative amplitude associated with such a fluctuation. In fact, neglecting for simplicity noise and stray light contributions, each image of the monolayer can be written as , where the sum is performed over all cells within the field of view. ψn(x, t) is the intensity distribution associated with the n-th cell or nucleus, that can be thought as the sum of a time-independent term and a fluctuating one with zero time average ψn(x, t) = 〈ψn(x, t)〉t+δψn(x, t). Assuming that translational dynamics (encoded in xn) and shape fluctuations (encoded in δψn) are statistically independent, it can be shown that Equation (11) holds, with and , where the symbol indicates the two-dimensional Fourier Transform. We note that, tacking into account that shape changes are “impulsive” in nature [that is, for a given cell, δψn(t) is significantly different from 0 only during the short duration of a division event], the coefficient α is expected to be proportional to the number m of events per unit time per cell: . Here J is a constant given by average integrated power associated with a single duplication event: . Since the total intensity associated with a fluorescent nucleus is approximately conserved, we expect: α(0) ≃ 0. From the expressions above, it is also clear that g(q, Δt) is a decreasing function of the delay time Δt, with g(q, 0) = 1 and . The characteristic decay time of g should reflect the average duration of a shape change event.
3. Results and Discussion
3.1. Structure Factor of the Monolayer
The spatial structure of the monolayer is characterized by calculating the structure factor S(q) of the centroids of the nuclei, as described in detail in subsection 2.3.2. A typical structure factor obtained in the first stages of the experimental observation is shown in Figure 1C. Qualitatively, the overall shape of S(q) is very similar to the one of a dense fluid phase, as previously reported for a different epithelial cell line [2]. For q → 0 a significant increase in S(q) is observed. This feature is indicative of large-scale density fluctuations within the monolayer and has been attributed to the presence of activity-driven, non-equilibrium clusters of cells [1, 2]. The structure factor is found to be substantially constant over time. Only a moderate shift in the peaks to larger q-values is observed as a consequence of the progressive increase (of about 25% from the beginning to the end of the experiment) in the cell number density due to cell divisions. At each stage of the monolayer evolution, the wave-vectors qi (i = 1, 2, …) for which S(q) = 1 are determined by linear interpolation of S(q) (Figure 1C).
3.2. Self-Intermediate Scattering Functions
At each stage of the monolayer evolution, the image structure function D(q, Δt) is obtained from DDM analysis of both fluorescence and phase-contrast image sequences. The amplitude A(q) and the noise baseline B of the image structure function, evaluated from the statics as described in subsection 2.3.3 are shown in Figure 1E as a continuous and a dashed line, respectively. As it can be appreciated from the figure, which refers to the case of fluorescence imaging, a good signal-to-noise ratio is obtained for q≾1.3 μm−1. The so-obtained A and B are then used to extract the ISF from D(q, Δt) via Equation (7).
In Figure 1D the ISF obtained in the early stages of the experiment for different values of qi (i = 1, .., 5) is shown as filled symbols. The color code is the same of Figure 1C, where the corresponding values of qi are marked with filled circles. We observe that, while for the lowest q-values the ISF presents a well defined single decay, a faster secondary decay is observed for larger q. To separate these two contributions, we adopt the following self-consistent procedure. By using (Equation 10), we obtain for each qi a first estimate of the MSD, as
As also shown in Figure 1F the obtained MSDs do not collapse on a single curve, showing instead and a systematic spread, in particular for short delay times. We attribute the spurious speed-up of the short-time dynamics observed for large qs to the presence of other processes (like cell divisions). According to the discussion in section 2.3.4, the relative weight of these non-translational contributions to the ISF is expected to be a monotonically decreasing function of q and to vanish for q = 0. A reliable estimate of the “true” MSD 〈|Δx|2〉 can be thus obtained, for each given Δt, by extrapolating to q = 0 the sequence . As it can be also appreciated in Figure 1D, the result of this procedure turns out to be very close to the value obtained by direct inversion of the ISF for the lowest q-value for which S(q) = 1. We also note that, for this q-value, the effect of shape changes and cell divisions on the ISF is minimal and, compared to larger q, there is an excellent signal to noise ratio, as the signal amplitude A(q) is a monotonically decreasing function of q (see Figure 1G). These observations suggest that a simpler, albeit less general, way to estimate the single-cell MSD could be directly via . Nevertheless, in this work, we did not rely on this simplified procedure and single-cell MSDs were always estimated by using the above-described extrapolation scheme. We then fit the obtained MSD with a model function of the form
that is found to accurately describe the data over all the investigated range of delay times. Using this analytic expression, and assuming a simple exponential decay for the shape correlation function g(q, Δt) = exp(−γ(q)Δt) we fit all the ISF f(qi, Δt) (i = 1, …, 5) with Equation (11), the only free parameters being the amplitude α(q) of the fast decay and its characteristic decorrelation rate γ(q). The best fitting curves obtained with this procedure are shown as thick continuous black lines in Figure 1F, while the purely translational part (1−α)exp(−q2Δx2/4) of the ISF is shown as a dashed line. The good agreement between model and data supports the overall consistency of the described procedure. The values of α and γ obtained from the fit are shown in Figure 1G. As expected from subsection 2.3.4, the relative amplitude of the fast decay α is found to be an increasing function of q, while the estimated shape decorrelation rate γ, although affected by a large uncertainty (of about 50 %) does not seem to depend strongly on q. A more in-depth discussion of these results is provided in subsection 3.2.3.
3.2.1. Impact of Non-gaussianity of Cellular Displacements on DDM Analysis
Apparently, our procedure, by making use of Equation (10), relies of the relatively strong assumption that cellular displacements follow a Gaussian probability distribution function (PDF). Inspection of the experimental PDFs obtained from PT, immediately indicates that this not the case for the system under study (Figure 2). Indeed, for all the investigated delay times, the PDFs show systematic deviations from a simple Gaussian behavior, clearly displaying exponential tails, a recurring feature in the dynamics of a variety of soft and bio-soft materials [46]. Nevertheless, and quite strikingly, our approach leads to an estimate of the MSD which is in almost perfect agreement with the one measured with PT, as discussed in more detail in the next section. This apparent paradox can be explained by considering that, in our case, the inversion of Equation (10) is extrapolated to asymptotically low q, a regime where the following general identity holds [47]
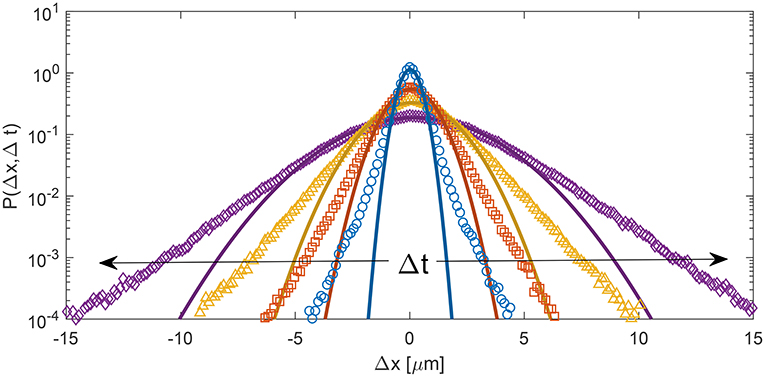
Figure 2. Symbols: PDF P(Δx, Δt) of cellular displacements for different delay times (blue circles: Δt = 2 min, orange squares: Δt = 10 min, yellow triangles: Δt = 20 min, purple diamonds: Δt = 40 min) obtained from PT analysis over a time interval of 200 min, about 3 h after the beginning of the experiment. Continuous lines correspond to best fitting Gaussian curves. For all delay times, the PDF displays a marked deviation from a Gaussian behavior, with exponential-like tails.
where d is the number of spatial dimensions (d = 2, in our case). In qualitative terms, Equation (14) indicates that, if the density fluctuation induced by the particle's motion during a given time interval Δt is evaluated on a spatial length scale much larger than the typical displacement, than (Equation 10) still accurately describes the initial relaxation of f(q, Δt), even if the MSD does not follow a Gaussian distribution, and can be thus used to obtain an unbiased estimate of the MSD.
3.2.2. Cellular Mean-Squared Displacement
Single cell MSD were obtained from DDM analysis according to the procedure described at the beginning of section 3.2. Inspection of Figure 1F shows that an excellent agreement is found with the MSD obtained with tracking (Equation 1), once the latter is properly corrected for the particle localization error [48]. Overall, the phenomenological model in Equation (13), is found to provide a very good description of the data over the whole investigated range of delay times. For large delay times the MSD displays a clear super-diffusive scaling with exponent β very close to 1.5. The short time behavior is well-described by assuming a finite plateau for Δt → 0. This plateau is reminiscent of the one observed during microrheology experiments with inert soft materials, a case in which it often has an elastic origin (see for instance Cicuta and Donald [49]). The application of the described procedure to different image sub-sequences enables the time-resolved estimate of the nuclear MSD over the course of the experiment. The qualitative behavior of the MSD (Figure 3A) is conserved over time. In particular, the exponent describing the long-time scaling of the MSD remains very close to 1.5 for the whole duration of the experiment (Figure 3B). The main effect of aging is the progressive change in the “effective diffusivity” Deff, decreasing by a factor of about 2 from the beginning to the end of the experimental observation (Figure 3C). At the same time, a slight increase of the short-time plateau is also observed (see Figure S1), which is not surprising in view of the fact that the monolayer is gradually approaching a jammed state [1]. We note that extracting the MSD from DDM rather than from PT could be advantageous, in terms of computational cost, in particular when the number of tracked particles in the image is very large. In that case, building the trajectories from the particles positions becomes extremely time-consuming, to the point of making unpractical the analysis of large, crowded FOVs with PT. By contrast, for a given image size, the duration of DDM analysis does not depend at all on the number of particles, which makes DDM an ideal tool for the automated analysis of large FOVs. As a representative example, PT analysis performed on an image sequence of 200 frames with a resolution of 672 x 512, including about 2,800 cells, required approximately 30 min, while a full DDM processing of the same data, was completed in about 2 min on the same computer.
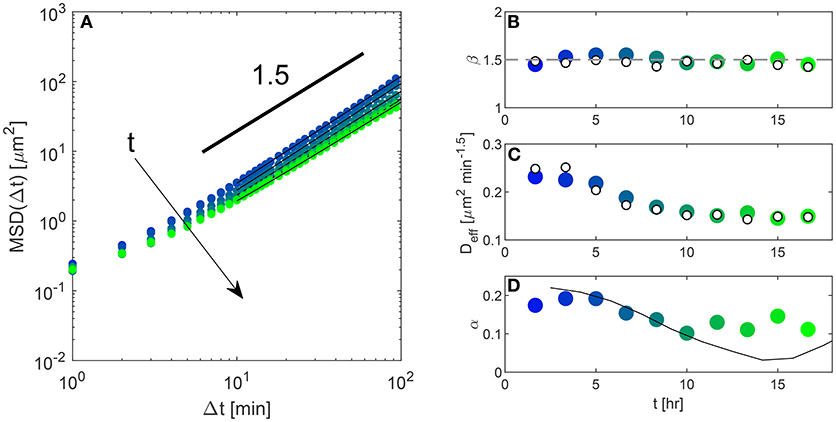
Figure 3. (A) Symbols: mean squared displacement MSD obtained from DDM analysis (wide-field fluorescence imaging), performed over a time window of 200 min, at different time points over the course of the experiment. Continuous lines are best fitting curves to the date with the model given in Equation (13). (B) Temporal evolution of the exponent β describing the long-time scaling of the MSD (see Equation 13). Empty symbols are obtained from PT, filled symbols from DDM. (C) Temporal evolution of the prefactor Deff of the power-law describing the asymptotic behavior of the MSD (see Equation 13). Empty symbols are from PT, filled symbols from DDM. (D) The relative amplitude α of the faster decay in the ISF (filled symbols) is compared with the fractional division rate (black continuous line). The latter is estimated by nuclear counting and has been rescaled by an arbitrary factor to make the comparison easier.
3.2.3. Mitotic Division Rate
As anticipated in section 3.2, for large wave-vectors (i.e., for q much larger than the first peak in the structure factor) the self-ISF shows a two-step decay. While the slowest decay is due to the translational dynamics of the nuclei (see previous section), we attribute the fast decay mainly to the mitotic activity of the cell. This hypothesis is corroborated by the following observations. Firstly, we find that the characteristic decorrelation rate is roughly q-independent: γ(q) ≃ 0.5 min−1 (Figure 1G) and its value is in good agreement with the inverse duration of the duplication events (Supplementary Movie SM3). Moreover, the temporal evolution of the amplitude α(t0) of the fast decay of the ISF (for a given qi, i = 3, 4, 5) is qualitatively similar to the fractional proliferation rate (N(t0+Δt) − N(t0))/(N(t0)Δt), where N(t) is the number of nuclei within the FOV at time t, that we estimate from PT (Figure 3D) This correspondence gets partially lost during the monolayer aging. Our interpretation is that contact inhibition of proliferation induces a marked decrease in the proliferation rate [50], which in turn makes the amplitude α too small to be reliably quantified.
3.2.4. Phase-Contrast Experiments
We have shown how DDM can be used to probe the MSD and the mitotic division rate in dense monolayers by using the optical signal of the nuclei. Although with the fluorescent movies DDM already showed its potential compared to PT, an interesting question is if and how well DDM works with the phase contrast movies obtained with the same cells, a case for which standard PT is extremely difficult, if not impossible.
Already from visual inspection of the movies, it is clear that they contain a richer set of contributions: for instance, shape changes and membrane fluctuations are clearly visible. In addition, we observe some artifacts that were not present in the fluorescence microscopy movies. Typical examples are dead cells detached from the monolayer rapidly traversing the FOV and variations over time of the optical contrast.
Despite all these issues, when applying the same data analysis procedure described above, we can recover a MSD (by inverting the low-q limit of the self-ISF) that closely mirrors the one obtained from PT or DDM on fluorescence movies. Results obtained for the MSD at different monolayer ages, and portrayed in Figure 4A, show that only the short-time limit of the experimental MSD is affected by the above-mentioned effects, whereas the long-time behavior coincides with the one extracted from PT of the nuclei. The agreement with PT can be appreciated in more detail in Figures 4B,C where we plot the power-law exponent β and the value of Deff, respectively. The data obtained from the DDM analysis of the phase contrast movies (filled symbols) are in excellent agreements with the ones obtained by PT of the nuclei (empty symbols) in the fluorescence movies. This agreement shows that simpler experiments with unlabeled cells can still be very informative about the long-time behavior of the monolayer, which is a key observable to discriminate liquid-to-solid or solid-to-liquid changes of behavior, both in experiments [51, 52] and simulations [3, 53].
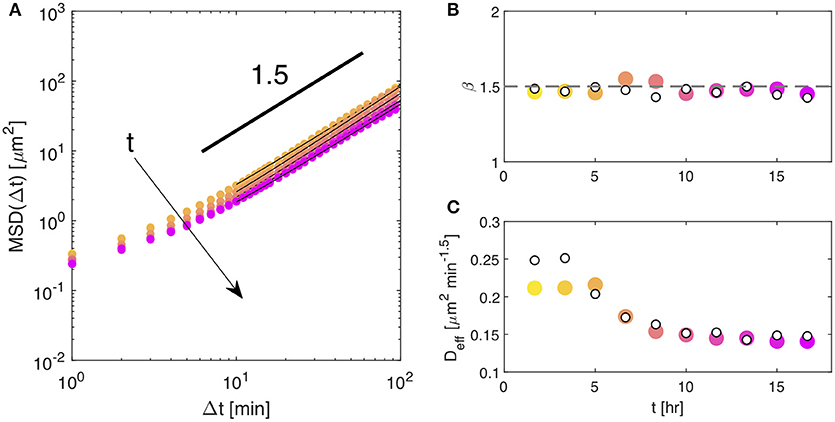
Figure 4. (A) Symbols: mean squared displacement MSD obtained from DDM analyisis (phase contrast imaging), performed over a time window of 200 min, at different time points over the course of the experiment. Continuous lines are best fitting curves to the date with the model given in Equation (13). (B) Temporal evolution of the exponent β describing the long-time scaling of the MSD (see Equation13). Empty symbols are obtained from PT, filled symbols from DDM. (C) Temporal evolution of the prefactor Deff of the power-law describing the asymptotic behavior of the MSD (see Equation 13). Empty symbols are from PT, filled symbols from DDM.
As far as cell division is concerned, we could not unambiguously isolate its contribution to the self-ISF. In particular, the ISF does not display a clear two-step decay and this makes fitting the data to the simple model described by Equation 11 unreliable. This could be probably due to the superposition of multiple processes contributing to the short-time dynamics (membrane fluctuations, internal rearrangements,.) and to the milder optical signal associated with cell division.
4. Conclusion
In this work, we have used DDM for the first time as a quantitative probe of the self dynamics of dense epithelial cell monolayers. In particular, we have combined structural and dynamical information to extract the self-ISF of an epithelial monolayer for different values of the wave-vector q. This multi-q DDM analysis of the single cell dynamics highlights two different contributions: in the q → 0 limit, the self-ISF can be inverted to provide a tracking-free estimate of the cell MSD as a function of time, whereas for q≠0 substantial contributions from cell division are also encoded in the ISFs. As far as the cell MSD is concerned, we find that, whenever the DDM analysis is performed on movies obtained with fluorescent nuclei, the DDM results are in excellent agreement with the PT results for all time delays. However, in contrast with PT, DDM can also be used to extract the cell MSD on phase-contrast movies, in which the signal from the nuclei is mixed to the one coming for all the cell components that de-phase light: in that case, the DDM-obtained MSD is in agreement with the one obtained for the nuclei only for large time delays, showing that in a crowded environment DDM can be safely used to determine the long-time MSD of the center of mass of cells, a typical output of numerical simulations of cell collectives [3, 53]. For short time delays, the MSD determined by DDM differs from the one of the nuclei, as a consequence of the non-negligible, fast, and high frequency relaxation processes of other cellular components, such as the cellular membrane, cytoplasmic vesicles and other organelles. In general, compared to real-space based methods like PT, DDM has the advantage of being less conditioned from operator-dependent choices, less affected by cell-to-cell variability in the optical properties and computationally more efficient, in particular in the case of tissues comprising a very large number of cells. These results show that DDM can be used as a high-throughput probe of the single cell dynamics in the complex environment of confluent monolayers and pave the way to a more complex q-dependent analysis of collective effects, which in this work were not addressed.
Data Availability Statement
The datasets generated and analyzed for this study and the custom MATLAB software used for data analysis will be made available upon reasonable request to qualified researchers.
Author Contributions
FG and RC conceived the project. GS and RC coordinated the experimental and data analysis activity. CM performed experiments. FG analyzed data. RC and FG wrote the first draft of the manuscript. All authors contributed to manuscript revision, read, and approved the submitted version.
Funding
This work has been supported by: the Associazione Italiana per la Ricerca sul Cancro (AIRC) to GS (IG 18621); the Italian Ministry of Health (RF-2013-02358446) to GS. Regione Lombardia and CARIPLO foundation (Project 2016-0998) to RC; CM and FG are partially supported by fellowships from the University of Milan.
Conflict of Interest Statement
The authors declare that the research was conducted in the absence of any commercial or financial relationships that could be construed as a potential conflict of interest.
Supplementary Material
The Supplementary Material for this article can be found online at: https://www.frontiersin.org/articles/10.3389/fphy.2018.00120/full#supplementary-material
References
1. Angelini TE, Hannezo E, Trepat X, Marquez M, Fredberg JJ, Weitz DA. Glass-like dynamics of collective cell migration. Proc Natl Acad Sci USA. (2011) 108:4714–9. doi: 10.1073/pnas.1010059108
2. Giavazzi F, Malinverno C, Corallino S, Ginelli F, Scita G, Cerbino R. Giant fluctuations and structural effects in a flocking epithelium. J Phys D Appl Phys. (2017) 50:384003. doi: 10.1088/1361-6463/aa7f8e
3. Giavazzi F, Paoluzzi M, Macchi M, Bi D, Scita G, Manning ML, et al. Flocking transitions in confluent tissues. Soft Matter (2018) 14:3471–7. doi: 10.1039/C8SM00126J
4. Palamidessi A, Malinverno C, Frottoli E, Corallino S, Barbieri E, Sigismund S, et al. Unjamming overcomes kinetic and proliferation arrest in terminally differentiated cells and promotes collective motility of carcinoma. bioRxiv [Preprint]. (2018). doi: 10.1101/388553
5. Trepat X, Sahai E. Mesoscale physical principles of collective cell organization. Nat Phys. (2018) 14:671–82. doi: 10.1038/s41567-018-0194-9
6. Cerbino R, Trappe V. Differential dynamic microscopy: probing wave vector dependent dynamics with a microscope. Phys Rev Lett. (2008) 100:188102. doi: 10.1103/PhysRevLett.100.188102
7. Cerbino R, Cicuta P. Perspective: differential dynamic microscopy extracts multi-scale activity in complex fluids and biological systems. J Chem Phys. (2017) 147:110901. doi: 10.1063/1.5001027
8. Cerbino R, Vailati A. Near-field scattering techniques: Novel instrumentation and results from time and spatially resolved investigations of soft matter systems. Curr Opin Colloid Interface Sci. (2009) 14:416–25. doi: 10.1016/j.cocis.2009.07.003
9. Giavazzi F, Cerbino R. Digital Fourier microscopy for soft matter dynamics. J Opt. (2014) 16:083001. doi: 10.1088/2040-8978/16/8/083001
10. Cerbino R. Quantitative optical microscopy of colloids: the legacy of Jean Perrin. Curr Opin Colloid Interface Sci. (2018) 34:47–58. doi: 10.1016/j.cocis.2018.03.003
12. Lu PJ, Giavazzi F, Angelini TE, Zaccarelli E, Jargstorff F, Schofield AB, et al. Characterizing concentrated, multiply scattering, and actively driven fluorescent systems with confocal differential dynamic microscopy. Phys Rev Lett. (2012) 108:218103. doi: 10.1103/PhysRevLett.108.218103
13. Zehnder S, Suaris M, Bellaire M, Angelini T. Cell volume fluctuations in MDCK monolayers. Biophys J. (2015) 108:247–50. doi: 10.1016/j.bpj.2014.11.1856
14. Zehnder SM, Wiatt MK, Uruena JM, Dunn AC, Sawyer WG, Angelini TE. Multicellular density fluctuations in epithelial monolayers. Phys Rev E. (2015) 92:032729. doi: 10.1103/PhysRevE.92.032729
15. Sbalzarini IF, Koumoutsakos P. Feature point tracking and trajectory analysis for video imaging in cell biology. J Struct Biol. (2005) 151:182–95. doi: 10.1016/j.jsb.2005.06.002
16. Garcia S, Hannezo E, Elgeti J, Joanny JF, Silberzan P, Gov NS. Physics of active jamming during collective cellular motion in a monolayer. Proc Natl Acad Sci USA. (2015) 112:15314–9. doi: 10.1073/pnas.1510973112
17. Brunel B, Blanch C, Gourrier A, Petrolli V, Delon A, Joanny JF, et al. Structure and dynamics of multicellular assemblies measured by coherent light scattering. New J Phys. (2017) 19:073033. doi: 10.1088/1367-2630/aa7b0f
18. Suissa M, Place C, Goillot E, Berge B, Freyssingeas E. Dynamic light scattering as an investigating tool to study the global internal dynamics of a living cell nucleus. Europhys Lett. (2007) 78:38005. doi: 10.1209/0295-5075/78/38005
19. Suissa M, Place C, Goillot E, Freyssingeas E. Internal dynamics of a living cell nucleus investigated by dynamic light scattering. Eur Phys J E (2008) 26:435. doi: 10.1140/epje/i2007-10346-5
20. Rueden CT, Schindelin J, Hiner MC, DeZonia BE, Walter AE, Arena ET, et al. ImageJ2: ImageJ for the next generation of scientific image data. BMC Bioinformatics (2017) 18:529. doi: 10.1186/s12859-017-1934-z
21. Schindelin J, Arganda-Carreras I, Frise E, Kaynig V, Longair M, Pietzsch T, et al. Fiji: an open-source platform for biological-image analysis. Nat Methods (2012) 9:676. doi: 10.1038/nmeth.2019
22. Bayles AV, Squires TM, Helgeson ME. Dark-field differential dynamic microscopy. Soft Matter (2016) 12:2440–52. doi: 10.1039/C5SM02576A
23. Reufer M, Martinez VA, Schurtenberger P, Poon WCK. Differential dynamic microscopy for anisotropic colloidal dynamics. Langmuir (2012) 28:4618–24. doi: 10.1021/la204904a
24. Giavazzi F, Haro-Pérez C, Cerbino R. Simultaneous characterization of rotational and translational diffusion of optically anisotropic particles by optical microscopy. J Phys: Condens Matter (2016) 28:195201. doi: 10.1088/0953-8984/28/19/195201
25. Sentjabrskaja T, Zaccarelli E, Michele CD, Sciortino F, Tartaglia P, Voigtmann T, et al. Anomalous dynamics of intruders in a crowded environment of mobile obstacles. Nat Commun. (2016) 7:11133. doi: 10.1038/ncomms11133
26. Kodger TE, Lu PJ, Wiseman GR, Weitz DA. Stable, fluorescent PMMA particles for long-term observation of slow colloidal dynamics. Langmuir (2017) 33:6382. doi: 10.1021/acs.langmuir.7b00852
27. Giavazzi F, Fornasieri A, Vailati A, Cerbino R. Equilibrium and non-equilibrium concentration fluctuations in a critical binary mixture. Eur Phys J E (2016) 39:103. doi: 10.1140/epje/i2016-16103-9
28. Giavazzi F, Savorana G, Vailati A, Cerbino R. Structure and dynamics of concentration fluctuations in a non-equilibrium dense colloidal suspension. Soft Matter (2016) 12:6588–600. doi: 10.1039/C6SM00935B
29. Giavazzi F, Crotti S, Speciale A, Serra F, Zanchetta G, Trappe V, et al. Viscoelasticity of nematic liquid crystals at a glance. Soft Matter (2014) 10:3938–49. doi: 10.1039/C4SM00145A
30. Wilson LG, Martinez VA, Schwarz-Linek J, Tailleur J, Bryant G, Pusey P, et al. Differential dynamic microscopy of bacterial motility. Phys Rev Lett. (2011) 106:018101. doi: 10.1103/PhysRevLett.106.018101
31. Martinez VA, Besseling R, Croze OA, Tailleur J, Reufer M, Schwarz-Linek J, et al. Differential dynamic microscopy: a high-throughput method for characterizing the motility of microorganisms. Biophys J. (2012) 103:1637–47. doi: 10.1016/j.bpj.2012.08.045
32. Drechsler M, Giavazzi F, Cerbino R, Palacios IM. Active diffusion and advection in Drosophila oocytes result from the interplay of actin and microtubules. Nat Commun. (2017) 8:1520. doi: 10.1038/s41467-017-01414-6
33. Feriani L, Juenet M, Fowler CJ, Bruot N. Assessing the collective dynamics of motile cilia in cultures of human airway cells. Biophys J. (2017) 113:109–19. doi: 10.1016/j.bpj.2017.05.028
34. Bayles AV, Squires TM, Helgeson ME. Probe microrheology without particle tracking by differential dynamic microscopy. Rheol Acta (2017) 56:863–9. doi: 10.1007/s00397-017-1047-7
35. Edera P, Bergamini D, Trappe V, Giavazzi F, Cerbino R. Differential dynamic microscopy microrheology of soft materials: a tracking-free determination of the frequency-dependent loss and storage moduli. Phys Rev Mater. (2017) 1:073804. doi: 10.1103/PhysRevMaterials.1.073804
36. He K, Spannuth M, Conrad JC, Krishnamoorti R. Diffusive dynamics of nanoparticles in aqueous dispersions. Soft Matter (2012) 8:11933–8. doi: 10.1039/c2sm26392k
37. Wulstein DM, Regan KE, Robertson-Anderson RM, McGorty R. Light-sheet microscopy with digital Fourier analysis measures transport properties over large field-of-view. Opt Express. (2016) 24:20881–94. doi: 10.1364/OE.24.020881
38. Cohen AP, Alesker M, Schofield AB, Zitoun D, Sloutskin E. Photo-crosslinkable colloids: from fluid structure and dynamics of spheres to suspensions of ellipsoids. Gels (2016) 2:29. doi: 10.3390/gels2040029
39. Croccolo F, Brogioli D, Vailati A, Giglio M, Cannell DS, Sadhal SS. Effect of gravity on the dynamics of nonequilibrium fluctuations in a free-diffusion experiment. Ann N Y Acad Sci. (2006) 1077:365–79. doi: 10.1196/annals.1362.030
40. Giavazzi F, Brogioli D, Trappe V, Bellini T, Cerbino R. Scattering information obtained by optical microscopy: differential dynamic microscopy and beyond. Phys Rev E (2009) 80:031403. doi: 10.1103/PhysRevE.80.031403
41. Berne BJ, Pecora R. Dynamic Light Scattering: With Applications to Chemistry, Biology, and Physics. Mineola, NY: Dover Publications (2000).
42. Pawley J. Handbook of Biological Confocal Microscopy. New York, NY: Springer Science & Business Media (2010).
43. Escobedo-Sanchez M, Segovia-Gutiérrez J, Zuccolotto-Bernez A, Hansen J, Marciniak C, Sachowsky K, et al. Microliter viscometry using a bright-field microscope: η-DDM. Soft Matter (2018) 14:7016–25. doi: 10.1039/C8SM00784E
44. Germain D, Leocmach M, Gibaud T. Differential dynamic microscopy to characterize Brownian motion and bacteria motility. Am J Phys. (2016) 84:202–10. doi: 10.1119/1.4939516
45. Segrè PN, Meeker SP, Pusey PN, Poon WCK. Viscosity and structural relaxation in suspensions of hard-sphere colloids. Phys Rev Lett. (1995) 75:958–61. doi: 10.1103/PhysRevLett.75.958
46. Wang B, Kuo J, Bae SC, Granick S. When Brownian diffusion is not Gaussian. Nat Mater. (2012) 11:481. doi: 10.1038/nmat3308
48. Crocker JC, Grier DG. Methods of digital video microscopy for colloidal studies. J Colloid Interface Sci. (1996) 179:298–310. doi: 10.1006/jcis.1996.0217
49. Cicuta P, Donald AM. Microrheology: a review of the method and applications. Soft Matter (2007) 3:1449–55. doi: 10.1039/b706004c
50. Stoker M, Rubin H. Density dependent inhibition of cell growth in culture. Nature (1967) 215:171.
51. Park JA, Kim JH, Bi D, Mitchel JA, Qazvini NT, Tantisira K, et al. Unjamming and cell shape in the asthmatic airway epithelium. Nat Mater. (2015)14:1040. doi: 10.1038/nmat4357
52. Malinverno C, Corallino S, Giavazzi F, Bergert M, Li Q, Leoni M, et al. Endocytic reawakening of motility in jammed epithelia. Nat Mater. (2017) 16:587. doi: 10.1038/nmat4848
Keywords: cell motility, epithelial monolayers, optical techniques, differential dynamic microscopy, structure factor, intermediate scattering function
Citation: Giavazzi F, Malinverno C, Scita G and Cerbino R (2018) Tracking-Free Determination of Single-Cell Displacements and Division Rates in Confluent Monolayers. Front. Phys. 6:120. doi: 10.3389/fphy.2018.00120
Received: 27 July 2018; Accepted: 04 October 2018;
Published: 26 October 2018.
Edited by:
Giancarlo Ruocco, Istituto italiano di Tecnologia (IIT), Center for Life NanoScience, ItalyReviewed by:
Andrea Pagnani, Politecnico di Torino, ItalyThomas Angelini, University of Florida, United States
Copyright © 2018 Giavazzi, Malinverno, Scita and Cerbino. This is an open-access article distributed under the terms of the Creative Commons Attribution License (CC BY). The use, distribution or reproduction in other forums is permitted, provided the original author(s) and the copyright owner(s) are credited and that the original publication in this journal is cited, in accordance with accepted academic practice. No use, distribution or reproduction is permitted which does not comply with these terms.
*Correspondence: Giorgio Scita, Z2lvcmdpby5zY2l0YUB1bmltaS5pdA==
Roberto Cerbino, cm9iZXJ0by5jZXJiaW5vQHVuaW1pLml0