 Ewald Moser1,2,3*
 Csaba Szántay Jr.4,5
- 1Center for Medical Physics and Biomedical Engineering, Medical University of Vienna, Vienna, Austria
- 2MR Center of Excellence, Medical University of Vienna, Vienna, Austria
- 3Department of Psychiatry, Perelman School of Medicine, University of Pennsylvania, Philadelphia, PA, United States
- 4Spectroscopic Research Department, Gedeon Richter Plc., Budapest, Hungary
- 5Faculty of Chemical Technology and Biotechnology, Budapest University of Technology and Economics, Budapest, Hungary
Backround
As argued in part I [1], our scientific descriptions of the world inevitably contain some subjective “beliefs” weaved into the “knowledge” that stems from what we consider to be “objective experimental evidence”—hence our off-the-wall term “beliefedge” introduced therein. Besides being important drivers of science, our hidden or “unmanaged” beliefs are also a major source of the “mental traps” that can all too easily derail human judgment even in the most eminent minds [2]. Indeed, despite the solid—or apparently solid—and well-accepted theoretical foundations of natural sciences, there are a number of traps that notoriously and secretly keep hijacking scientists' reasoning when designing and running experiments as well as during data processing and interpretation. In part II we aim to illustrate these ideas, with a touch of personal flair, through a few examples that we deem to be instructive and relevant in various fields of analytical nuclear magnetic resonance (NMR), magnetic resonance spectroscopy (MRS) and magnetic resonance imaging (MRI) or functional magnetic resonance imaging (fMRI) applications. First, we shall consider some basic steps to ensure that data quality is sufficient for reliable scientific work employing magnetic resonance (MR)—based measurement techniques. When discussing various examples in some detail below, we shall also mention related artifacts and how to avoid or reduce them. We will finish by summarizing some important aspects of practical belief-management.
Some Notes Concerning Quality Control in (f)MRI, MRS, and NMR Studies
In science, and here we are not considering quality control (QC) in routine, medical applications of (f)MRI or MRS performed by technicians, each scientist is personally responsible for the QC of the various aspects of an ongoing experiment. This includes hardware performance; the function and quality of developed or modified measurement sequences; the estimation of sample-specific parameters; the quality of the data acquired and processed; the quality and performance of data analysis tools whether taken from a software library or developed in the laboratory. It goes without saying that any in vivo experiment—animal or human—requires appropriate ethics approval obtained from the local ethics committee. However, quite often neither the need for such QC, nor the personal responsibility associated with it is recognized, because the issue is concealed by the strong and very comforting belief that the NMR/MRI system is running at a constant level of performance which should make it eminently suitable for any research done on the system. This belief-based assumption is simply wrong. Let us expand on these points in a little more detail.
The QC of the hardware components includes the basic performance of the MRI scanner as well as all radio-frequency (RF) coils employed in the particular experiment for various nuclei and sample sizes. This is typically tested via appropriate phantoms, usually provided by the manufacturer and/or vendor of the scanner, or specifically manufactured in the laboratory [3]. Such tests include not only signal-to-noise ratio (SNR) measurements, but also, particularly in larger, inhomogeneous RF coils, the SNR homogeneity across the sample volume [4–12]. Even more challenging would be the QC of hybrid systems like, e.g., PET/MRI [13].
The QC of measurement sequences includes all aspects relevant to a particular experiment, such as slice thickness, slice warp, the homogeneity of the RF field, spatial resolution, relaxation times T1 and T2–whether for contrast-to-noise ratio (CNR) or absolute quantification of parameters, diffusion, perfusion, metabolite concentrations, etc., depending on the type of study and protocol. QC protocols should also be adapted to the requirements, e.g., accuracy and precision, of the study in planning [4, 14].
Data QC should not only be performed on phantom data, but also on real (in vivo) data, as they may contain not only technical artifacts but additional sample-specific artifacts coming from magnetically inhomogeneous regions and/or physiological motions (e.g., breathing, heartbeat, involuntary bowel movements, etc.—and mixtures of those [15–20]. Only if the data quality obtained from healthy volunteers seems to be sufficient for the study statistics to enable valid patient data and group statistics, should the measurements be continued with patient groups [21]. Otherwise, QC measurements should be repeated after improving the hardware and software performance. This may be done by the manufacturer's service personnel or, if possible, by the scientists themselves [22].
The QC of pre- and post-processing software should be performed by using mathematical phantoms (with varying noise levels) and in vivo data taken from international databases [23–26]. The latter typically also provides results from established data analyses performed by experienced scientists using established software packages [27–29]. However, be aware that specific features of the data structure and quality may lead to different results even if using commercial software packages.
Finally, we would like to add that the scanner hardware should not change during the whole study, and performance should be tested at least three times, i.e., at the beginning, in the middle, and at the end of the study (assuming a sufficiently stable hardware). This implies that in vivo studies should not take much longer than 6–8 months, posing a limit to longitudinal studies (be aware that regular service checks by the vendor may also change the performance). Of course, prolonged longitudinal studies may be performed, however, only with caution and by carrying out extra QC experiments to document any severe performance changes (note: in addition to hardware replacements by the service personnel, do not assume that any technical device, even if regularly serviced, performs exactly the same way over time).
Much of what has been said about the quality of data-measurement and data-processing for MRI and MRS is also valid for the analytical use (meaning, in the present context, molecular structure determination and quantitation) of high-resolution liquid-state NMR. As for structure elucidation, experimental data that is ambiguous or misleading in a way that goes unnoticed, but is believed to be correct by the spectroscopist, can lead to structural misassignments or (often hidden) structural uncertainties in both small molecules and biomolecules [2, 30]. Similarly, ensuring the proper data quality brings up extremely subtle issues having a major impact on the deduced results in quantitative NMR applications, which are increasingly employed in many areas such as in the determination of the purity of the marketed drug substances [31–35].
Examples
Structure Determination by NMR
As already noted in part I, reference 2 contains several sophisticated examples of the mental traps “in action,” in both the physical theory behind NMR and in the application of liquid-state high-resolution NMR in small-molecule structure determination, so the reader is referred to that source for some in-depth discussions along those lines. Herein, however, as a case in point I (CS) wish to provide an almost outrageously simple example of a structure determination problem involving a similarly simple mental trap that I encountered quite a long time ago. In fact, it is probably the apparent easiness of this problem that makes it especially instructive, because, on the one hand, it illustrates how simplicity itself can be deceptive, and on the other hand it foreshadows the potential difficulties of identifying mental traps in much more complicated situations. Historically, this particular example was one of the first mental traps that I encountered in the field of structure determination (which was later followed by much more subtle ones), and it had a huge influence on my views about, and my conduct of, the “scientific method” (besides teaching me a lesson about humility—probably one of the most important traits of a scientist). Although the story is old, it involves essentially the same NMR and MS methods as would be used today, and conceptually it is as relevant now as ever. Also, the story being somewhat personal, I am taking the liberty of using the first-person singular in this short and in many ways sketchy narrative.
In the mid-1990s, a synthetic chemist colleague of mine carried out the reaction shown in Figure 1, with the specific aim of preparing compound 1.
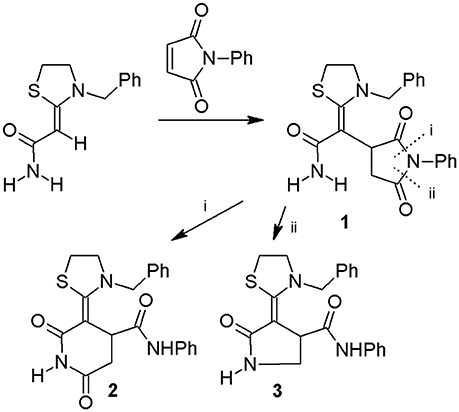
Figure 1. A chemical reaction aimed at obtaining compound 1. Ph = phenyl.
The chemistry involved was thought to be robust with no expected surprises, so the obtained substance was submitted to our department for routine structure verification by NMR, MS, and IR spectroscopy. As an operative NMR spectroscopist I recorded the usual routine spectra (1H, 13C, COSY, HSQC), which all proved to be in eminent agreement with the expected structure 1. Having had already acquired a significant experience in the NMR structure determination of vastly more complicated structures, I regarded the interpretation of the NMR data as a purely routine and unchallenging “job,” the only slightly interesting feature being the fact that the amide protons gave separate 1H signals—which of course can well be expected due to slow amide rotamerism. The MS and IR data also fully agreed with this structure, so I returned the official structural report to the chemist with our approval of structure 1. However, parallel to the spectroscopic investigation, the chemist also submitted the substance for classical analysis, which at that time was done by a dedicated analytical expert in a separate department. It appeared to me that the use of that analytical service was cultivated only by very few “old-school” chemists who were somewhat uncomfortable with, and also skeptical about, modern NMR and MS methods. Surprisingly, the chemist and the classical-analytical expert came back to me with the news that the pertinent substance could be titrated with AgNO3, indicating that the compound must have an imide (-CO-NH-R) instead of an amide (-CO-NH2) moiety as in 1. They therefore posed the question if I was absolutely certain that we had structure 1 in hand? Since the question triggered in me a reflexive, reputation-protective, NMR-chauvinistic self-defense mechanism which was further boosted by the notion that the reliability and structural resolving power of classical analysis is clearly a million miles below that of NMR spectroscopy, my passionate, indignant, but firm answer was: yes! The case seemed to have been settled, but after a few days the chemist returned again with the following idea. What if, he said, the reaction had not stopped where he had expected (i.e., at structure 1), but as a result of a spontaneous ring cleavage occurring in 1 as indicated but the dotted lines i or ii in Figure 1, it had progressed via a rearrangement to yield either compound 2 or 3, which both happen to be imides? I was stunned! It was immediately obvious that all three constitutional isomers 1, 2, and 3 must have extremely similar NMR spectra (the same number of 1H and 13C resonances, the same type of 1H spin systems, etc.), and it came as a shock to realize that all of my (quite detailed!) NMR data obtained so far were in fact entirely consistent with all three structures, so I could not rule out the possibility of 2 or 3, i.e., I could no longer be certain about 1! Having thus gained an entirely new (and quite embarrassingly so) perspective of the problem, I could apply some more special NMR experiments involving the measurement of selective 13C{1H} NOEs and long-range 13C-1H coupling correlations that could unambiguously prove that the structure in hand was in fact 3, in agreement with the results of classical analysis. If it hadn't been for the titration experiments, this error might have very easily gone unnoticed—a humbling realization for an NMR spectroscopist!
Note that no deductive mistake had been made as far as the interpretation of the initial set of NMR data is concerned, and yet a mental trap involving confirmation bias yielded the wrong structure which was even further entrenched in my mind by an instinctual response to a status-quo-threatening and apparently inferior piece of experimental evidence. In hindsight, this may be called a typical example of poor belief management. At the end of the day, this little affair with compounds 1–3 gave me the shocking revelation that no matter how much I knew about NMR, that technical knowledge did not prevent me from making this kind of mistake, and averting such error requires a different kind of skill, a competency that we are not typically “trained” for. By reflecting again on the film “The Matrix” already alluded to in part I, the whole scenario is perhaps best represented by the single sentence that Morpheus tells Neo when the latter is learning Kung Fu and is repeatedly failing in fights in spite of having already acquired all the necessary technical proficiencies: “Your weakness is not your technique.” In other words, possessing the required technical skills is a necessary but insufficient condition for being a good practitioner of the “scientific method.” To avail in the latter, one also has to develop a competence that we might call an attitude-skill involving belief-management—an aspect of being a scientist which is largely ignored by the scientific community.
Since (and partly as a result of) this early story, by constantly striving to develop an acute awareness of the mental traps, me and my team have experienced numerous similar situations within our own laboratory as well as in the literature. Quite intriguingly, although most of such NMR structural misassignments prove to stem not from a lack of technical methodology or human technical expertise, but from a lack of such attitude-skill, except from rare examples the latter issue is almost never addressed in the NMR scientific literature, in NMR educational material, or at NMR conferences.
31P MRS In Vivo During Exercise in Skeletal Muscle
Early metabolic studies of human skeletal and heart muscle were performed using 31P-MRS as this technique was available already in the early 1980s and provided more specific data than proton-based MRI [36]. However, due to the limited sensitivity of the instrument (B0 = 1.5T−2T), simple surface coils were used to collect data from muscle tissue during rest and exercise. Despite its early success, this led to partial volume effects reducing the specificity (also, it was assumed erroneously that mechanical exercise, e.g., plantar flexion, would activate the m. gastrocnemius only, and other muscles would be metabolically silent). Only after localization techniques (STEAM, PRESS, LASER), higher field strengths (i.e., 3T and now 7T), and more sensitive RF-coils [37] became available, did sensitivity and specificity increase [38, 39]. Based on these improvements, Fiedler and co-workers applied localized 31P-MRS with sufficient temporal resolution (ca. 30 s) to investigate differences in m. gastrocnemius and m. soleus during and after mechanical exercise [40, 41]. This clearly revealed that the originally assumed splitting of the Pi peak into intra- and extracellular components was just an artifact due to leg motion and partial volume effect (m. gastrocnemius and m. soleus). Also, testing established models was only possible after significant improvements in both SNR and temporal resolution. Additional improvements include simultaneous and interleaved acquisition of various NMR signals [42, 43] enabling data collection of pH, lactate, and muscle perfusion after a single exercise bout [44–46], i.e., without averaging several exercise sessions.
Why So Many fMRI Studies Are Flawed? An Example From Emotion Research
Although it was obvious from the early days of blood-oxygen (BOLD)-based fMRI that contributions of large, draining veins may dominate in data collected with gradient-echo based MRI sequences [47–50] at 1.5T, or later 3T, this has been largely ignored by neuroscientists and clinicians running a multitude of fMRI studies during the last 25 years. Although increasing the nominal spatial resolution and brain coverage did help to reduce the number of voxels contaminated by large veins, this did not solve the problem. Furthermore, simple correlation of signal fluctuations in various brain voxels combined with statistical thresholds to extract “significantly” activated brain regions even worsen the problem. In addition, a multitude of different data processing strategies exist which severely reduce comparability and reliability [51–55]. Here we discuss the application of fMRI in emotion research, specifically involving the amygdalae. As the amygdalae are small (ca. 1 cm3 each), symmetrically placed structures located in a brain region prone to be affected by strong susceptibility changes as well as a strong motion of the nearby brainstem, it took quite some time before significant amygdala activation could be published at all. However, it turned out that results were quite variable so further improvements had to be awaited [56]. More recently, we found that the assumed amygdala activation due to visual stimulation with emotional faces was heavily contaminated by strong stimulus-correlated signals from a draining vein [57], the so-called vein of Rosenthal. This particular vein drains the temporal lobe, i.e., brain regions where face processing is performed, and runs down toward and around the amygdalae. The distance between the origin of the stimulus-specific signal fluctuations, i.e., fusiform face area in the temporal lobe, and the amygdalae amounts to several centimeters, questioning the specificity of stimulus-correlated signal fluctuations near the amygdalae as being related to emotion processing (of course, it cannot be ruled out that a certain amount of the signal fluctuations detected may stem from the amygdalae itself). However, using standard EPI protocols at 3T, the stronger component definitely arises from the draining vein. Therefore, based on such data it is not possible to differentiate between face processing and emotion processing, both resulting from the photos of (emotional) faces presented to the subjects during the fMRI experiment. There are several strategies to reduce the contribution of large, draining veins to specific brain regions and even cortical layers. This includes the use of higher magnetic field strengths and dedicated pulse sequences [58], but most of the MRI systems used in neuroscience operate at 3T. Therefore, fMRI protocols should be optimized for 3T [59, 60], reducing various artifacts (e.g., physiological motion, flow, susceptibility related) and dedicated analyses could help to identify contaminated voxels [61, 62]. In summary, it should be clear that in order to reduce or eliminate false inferences made from the experimental data due to belief-based mental traps, such as the confirmation bias, only a full package of optimized, dedicated strategies may help to improve the data quality and reliability of fMRI applications in neurosciences in general [63], and particularly in certain regions such as the frontal lobe and the ventral brain.
Main Belief-Management Points (Summary)
Our “beliefedge” is that the ideas put forward in both parts of the present opinion paper should be of interest to all researchers active in natural sciences, irrespective of whether they are seasoned scientists or are just starting their research careers. At the very least, for those in the former category who may already be harboring similar thoughts we may have been able to show that they are not alone. As for those who have not yet contemplated such “darker” aspects of science and human thinking, we hope that by guiding them through a process of “endarkenment,” we have also facilitated their “enlightenment” about how to become advanced practitioners of the “scientific method.” In order to maintain that mental state, here is a quick summary of the main points of our theme.
1) Be aware of the nature and magnitude of your in-process beliefs and the belief components in your “beliefedges.”
2) Make a clear mental distinction between your pre- and post-conclusion beliefs.
3) When solving a problem by using a set of input information, make sure to distinguish between unambiguous data and belief-based data.
4) Be meticulous about considering all possibilities before coming to a conclusion.
5) Learn to live with leaving some questions open (i.e., to extend the pre-conclusion process) without jumping to conclusions. However, reasons for why a question should be left open should be explicitly stated if possible.
6) Become flexible about revising your “beliefedges” if new ideas or evidence require a change.
In other words, whatever your personal instructor, supervisor, or professor is telling you, or whatever you read in the literature, regard this as an opinion which should be either verified by yourself, or treated with creative skepticism until you judge it to be true. Be capable of modifying that judgment in the face of subsequent new information. Also, be perceptive of instances when you do not have adequate information to make such judgment. Develop the faculty of not arriving at strong conclusions in such situations, and of being comfortable with that kind of uncertainty in your mind.
Furthermore, be always aware that perhaps your scientific achievements will not solve open issues, but will contribute to a “higher level of confusion”—which is a very natural way of how science progresses. Also, in case there are two (different) schools or theories, accept that, at the end of the day, neither of them may win over the other, but both may have their merits under certain circumstances.
Author Contributions
EM invited coauthor CS, wrote a first draft and they continued to work on this manuscript together. Both agreed on the final version.
Conflict of Interest Statement
The authors declare that the research was conducted in the absence of any commercial or financial relationships that could be construed as a potential conflict of interest.
Acknowledgments
We are grateful to all our students and colleagues (incl. referees) who have questioned our work and this way helped us to improve. One of us (CS) particularly thanks his past colleagues at Gedeon Richter Plc., the late Dr. Kálmán Harsányi, and the late Dr. Ferenc Trischler, who, respectively, carried out the synthesis reaction shown in Figure 1 and the titration experiment which revealed that structure 1 might be erroneous.
References
1. Szántay C Jr, Moser E. Self-managed belief as part of the scientific method': part I - a guide on mental modus operandi as exemplified by research in nuclear magnetic resonance. Front Phys. (2018) 6. doi: 10.3389/fphy.2018.00068
2. Szántay C Jr. (ed.). Anthropic Awareness: The Human Aspects of Scientific Thinking in NMR Spectroscopy and Mass Spectrometry. New York, NY: Elsevier (2015).
3. Yoshimaru E, Totenhagen J, Alexander GE, Trouard TP. Design, manufacture, and analysis of customized phantoms for enhanced quality control in small animal MRI systems. Magn Reson Med. (2014) 71:880–4. doi: 10.1002/mrm.24678
4. Lerski RA, de Certaines JD. Performance assessment and quality control in MRI by eurospin test objects and protocols. Magn Reson Imaging. (1993) 11:817–33.
5. Barker PB, Hearshen DO, Boska MD. Single-voxel proton MRS of the human brain at 1.5T and 3.0T. Magn Reson Med. (2001) 45:765–9. doi: 10.1002/mrm.1104
6. Gonen O, Gruber S, Li BS, Mlynárik V, Moser E. Multivoxel 3D Proton Spectroscopy in the Brain at 1.5 Versus 3.0 T: Signal-to-Noise Ratio and Resolution Comparison. Am J Neuroradiol. (2001) 22:1727–31.
7. Qiao H, Zhang X, Zhu X-H, Du F, Chen W. In vivo 31P MRS of human brain at high/ultrahigh fields: a quantitative comparison of nmr detection sensitivity and spectral resolution between 4 T and 7 T. Magn Reson Imaging. (2006) 24:1281–6. doi: 10.1016/j.mri.2006.08.002
8. Giovannetti G, Frijia F, Menichetti L, Milanesi M, Ardenkjaer-Larsen JH, De Marchi D, et al. Hyperpolarized 13C MRS surface coil: design and signal-to-noise ratio estimation. Med Phys. (2010) 37:5361–269. doi: 10.1118/1.3491437
9. Arteaga de Castro CS, van den Bergen B, Luijten PR, van der Heide UA, van Vulpen M, Klomp DW. Improving SNR and B1 Transmit Field for an Endorectal Coil in 7 T MRI and MRS of Prostate Cancer. Magn Reson Med. (2012) 68:311–8. doi: 10.1002/mrm.23200
10. Lin IT, Yang HC, Chen JH. Enlargement of the field of view and maintenance of a high signal-to-noise ratio using a two-element high-Tc superconducting array in a 3T MRI. PLoS ONE (2012) 7:e42509. doi: 10.1371/journal.pone.0042509
11. Hall EL, Stephenson MC, Price D, Morris PG. Methodology for improved detection of low concentration metabolites in MRS: optimized combination of signals from multi-element coil arrays. Neuroimage (2014) 86:35–42. doi: 10.1016/j.neuroimage.2013.04.077
12. van de Bank BL, Orzada S, Smits F, Lagemaat MW, Rodgers CT, Bitz AK, et al. Optimized (31)P MRS in the Human Brain at 7 T with a Dedicated RF Coil Setup. NMR Biomed. (2015) 28:1570–8. doi: 10.1002/nbm.3422
13. Delso G, Fürst S, Jakoby B, Ladebeck R, Ganter C, Nekolla SG, et al. Performance Measurements of the siemens mMR integrated whole-body PET/MR scanner. J Nucl Med. (2011) 52:1914–22. doi: 10.2967/jnumed.111.092726
14. Seo Y, Wang ZJ, Morriss MC, Rollins NK. Minimum SNR and acquisition for bias-free estimation of fractional anisotropy in diffusion tensor imaging - a comparison of two analytical techniques and field strengths. Magn Reson Imaging (2012) 30:1123–33. doi: 10.1016/j.mri.2012.04.015
15. Blumenthal JD, Zijdenbos A, Molloy E, Giedd JN. Motion artifact in magnetic resonance imaging: implications for automated analysis. Neuroimage (2002) 16:89–92. doi: 10.1006/nimg.2002.1076
16. Chen HH, Boykin RD, Clarke GD, Gao JH, Roby JW III. Routine testing of magnetic field homogeneity on clinical MRI systems. Med Phys. (2006) 33:4299–306. doi: 10.1118/1.2359229
17. Firbank MJ, Harrison RM, Williams ED, Coulthard A. Quality assurance for MRI: practical experience. Br J Radiol. (2000) 73:376–83. doi: 10.1259/bjr.73.868.10844863
18. Gedamu EL, Collins DL, Arnold DL. Automated quality control of brain MR images. J Magn Reson Imaging (2008) 28:308–19. doi: 10.1002/jmri.21434
19. Krüger G, Glover GH. Physiological noise in oxygenation-sensitive magnetic resonance imaging. Magn Reson Med. (2001) 46:631–7. doi: 10.1002/mrm.1240
20. Soher BJ, Wu WE, Tal A, Storey P, Zhang K, Babb JS, et al. Automated whole-brain n-acetylaspartate proton MRS quantification. NMR Biomed. (2014) 27:1275–84. doi: 10.1002/nbm.3185
21. Okada T, Sakamoto S, Nakamoto Y, Kohara N, Senda M. Reproducibility of magnetic resonance spectroscopy in correlation with signal-to-noise ratio. Psychiatry Res. (2007) 156:169–74. doi: 10.1016/j.pscychresns.2007.03.007
22. Peltonen JI, Mäkelä T, Sofiev A, Salli E. An automatic image processing workflow for daily magnetic resonance imaging quality assurance. J Digit Imaging (2017) 30:163–71. doi: 10.1007/s10278-016-9919-4
23. Schöpf V, Kasess CH, Lanzenberger R, Fischmeister F, Windischberger C, Moser E. Fully exploratory network ICA (FENICA) on resting-state fMRI data. J Neurosci Methods (2010) 192:207–13. doi: 10.1016/j.jneumeth.2010.07.028
24. Schöpf V, Windischberger C, Robinson S, Kasess CH, Fischmeister FP, Lanzenberger R, et al. Model-free fMRI group analysis using FENICA. Neuroimage (2011) 55:185–93. doi: 10.1016/j.neuroimage.2010.11.010
25. Kalcher K, Huf W, Boubela RN, Filzmoser P, Pezawas L, Biswal B, et al. Fully Exploratory network independent component analysis of the 1000 functional connectomes database. Front Hum Neurosci. (2012) 6:301. doi: 10.3389/fnhum.2012.00301
26. Wang N, Zeng W, Chen L. SACICA: a sparse approximation coefficient-based ICA model for functional magnetic resonance imaging data analysis. J Neurosci Methods (2013) 216:49–61. doi: 10.1016/j.jneumeth.2013.03.014
27. Cox RW. AFNI: software for analysis and visualization of functional magnetic resonance neuroimages. Comput Biomed Res. (1996) 29:162–73.
28. Simmons A, Moore E, Williams SC. Quality control for functional magnetic resonance imaging using automated data analysis and shewhart charting. Magn Reson Med. (1999) 41:1274–8.
29. Rosen AFG, Roalf DR, Ruparel K, Blake J, Seelaus K, Villa LP, et al. Quantitative assessment of structural image quality. Neuroimage (2017) 169:407–18. doi: 10.1016/j.neuroimage.2017.12.059
30. Kiss R, Fizil Á, Szántay C Jr. What NMR can do in the biopharmaceutical industry. J Pharm Biomed Anal. (2018) 147:367–77. doi: 10.1016/j.jpba.2017.07.004
31. Weber M, Hellriegel C, Rueck A, Wuethrich J, Jenks P. Using high-performance 1H NMR (HP-qNMR) for the certification of organic reference materials under accreditation guidelines—describing the overall process with focus on homogeneity and stability assessment. J Pharm Biomed Anal. (2014) 93:102–10. doi: 10.1016/j.jpba.2013.09.007
32. Pauli GF, Gödecke T, Jaki BU, Lankin DC. Quantitative 1H NMR. development and potential of an analytical method: An update. J Nat Prod. (2012) 75:834–51. doi: 10.1021/np200993k
33. Pauli GF, Chen SN, Simmler C, Lankin DC, Gödecke T, Jaki BU, et al. Importance of purity evaluation and the potential of quantitative 1H NMR as a purity assay. J Med Chem. (2014) 57:9220–31. doi: 10.1021/jm500734a
34. Malz F, Jancke H. Validation of quantitative NMR. J Pharm Biomed Anal. (2005) 38:813–23. doi: 10.1016/j.jpba.2005.01.043
35. Pauli GF, Jaki BU, Lankin DC. A routine experimental protocol for qHNMR illustrated with taxol. J Nat Prod. (2007) 70:589–95. doi: 10.1021/np060535r
36. Radda GK. The use of NMR spectroscopy for the understanding of disease. Science (1986) 233:640–5.
37. Goluch S, Kuehne A, Meyerspeer M, Kriegl R, Schmid AI, Fiedler GB, et al. A Form-fitted three channel 31P, two channel 1H transceiver coil array for calf muscle studies at 7 T. Magn Reson Med. (2015) 73:2376–89. doi: 10.1002/mrm.25339
38. Meyerspeer M, Scheenen T, Schmid AI, Mandl T, Unger E, Moser E. Semi-LASER localized dynamic 31P magnetic resonance spectroscopy in exercising muscle at ultra-high magnetic field. Magn Reson Med. (2011) 65:1207–15. doi: 10.1002/mrm.22730
39. Meyerspeer M, Robinson S, Nabuurs CI, Scheenen T, Schoisengeier A, Unger E, et al. Comparing localized and nonlocalized dynamic 31p magnetic resonance spectroscopy in exercising muscle at 7 T. Magn Reson Med. (2012) 68:1713–23. doi: 10.1002/mrm.24205
40. Fiedler GB, Meyerspeer M, Schmid AI, Goluch S, Schewzow K, Laistler E, et al. Localized Semi-LASER dynamic 31P magnetic resonance spectroscopy of the soleus during and following exercise at 7 T. Magn Reson Med. (2015) 28:493–501. doi: 10.1007/s10334-015-0484-5
41. Fiedler GB, Schmid AI, Goluch S, Schewzow K, Laistler E, Niess F, et al. Skeletal muscle ATP synthesis and cellular H(+) handling measured by localized 31P-MRS during exercise and recovery. Sci Rep. (2016) 26:32037. doi: 10.1038/srep32037
42. Meyerspeer M, Magill AW, Kuehne A, Gruetter R, Moser E, Schmid AI. Simultaneous and interleaved acquisition of NMR signals from different nuclei with a clinical MRI scanner. Magn Reson Med. (2016) 6:1636–41. doi: 10.1002/mrm.26056
43. Niess F, Fiedler GB, Schmid AI, Goluch S, Kriegl R, Wolzt M, et al. Interleaved multivoxel 31 P MR spectroscopy. Magn Reson Med. (2017) 77:921–7. doi: 10.1002/mrm.26172.
44. Meyerspeer M, Kemp GJ, Mlynárik V, Krssák M, Szendroedi J, Nowotny P, et al. Direct noninvasive quantification of lactate and high energy phosphates simultaneously in exercising human skeletal muscle by localized magnetic resonance spectroscopy. Magn. Reson. Med. (2007) 57:654–60. doi: 10.1002/mrm.21188
45. Schewzow K, Fiedler GB, Meyerspeer M, Goluch S, Laistler E, Wolzt M, et al. Dynamic ASL and T2-weighted MRI in exercising calf muscle at 7 T: a feasibility study. Magn Reson Med. (2015) 73:1190–5. doi: 10.1002/mrm.25242
46. Schmid AI, Meyerspeer M, Robinson SD, Goluch S, Wolzt M, Fiedler GB, et al. Dynamic PCr and pH imaging of human calf muscles during exercise and recovery using 31P gradient-echo MRI at 7 Tesla. Magn Reson Med. (2016) 75:2324–31. doi: 10.1002/mrm.25822
47. Lai S, Hopkins AL, Haacke EM, Li D, Wasserman BA, Buckley P, et al. Identification of vascular structures as a major source of signal contrast in high resolution 2D and 3D functional activation imaging of the motor cortex at 1.5T: preliminary results. Magn Reson Med. (1993) 30:387–92.
48. Frahm J, Merboldt KD, Hanicke W, Kleinschmidt A, Boecker H. Brain or vein-oxygenation or flow? on signal physiology in functional mri of human brain activation. NMR Biomed. (1994) 7:45–53.
49. Kim SG, Hendrich K, Hu X, Merkle H, Ugurbil K. Potential pitfalls of functional MRI using conventional gradient-recalled echo techniques. NMR Biomed. (1994) 7:69–74.
50. Delon-Martin C, Roth M, Morand S, Massarelli R, Belle V, Decety J, et al. MRI measurement of the functional blood flow changes in a large superficial vein draining the motor cortex. NMR Biomed. (1999) 12:107–14.
51. Ioannidis JPA. Why most published research findings are false. PLoS Med. (2005) 2:e124. doi: 10.1371/journal.pmed.0020124
52. Simmons JP, Nelson LD, Simonsohn U. False-positive psychology: undisclosed flexibility in data collection and analysis allows presenting anything as significant. Psychol. Sci. (2011) 22:1359–66. doi: 10.1177/0956797611417632
53. Carp J. On the plurality of (methodological) worlds: estimating the analytic flexibility of fMRI experiments. Front Neurosci. (2012) 6:149. doi: 10.3389/fnins.2012.00149
54. Vul E, Pashler H. Voodoo and circularity errors. Neuroimage (2012) 62:945–8. doi: 10.1016/j.neuroimage.2012.01.027
55. Eklund A, Nichols TE, Knutsson H. Cluster Failure: Why fMRI Inferences for Spatial Extent Have Inflated False-Positive Rates. Proc Nat Acad Sci USA. (2016) 113:7900–05. doi: 10.1073/pnas.1602413113
56. Robinson S, Windischberger C, Rauscher A, Moser E. Optimized 3 T EPI of the amygdalae. Neuroimage (2004) 22:203–10. doi: 10.1016/j.neuroimage.2003.12.048
57. Boubela RN, Kalcher K, Huf W, Seidel EM, Derntl B, Pezawas L, et al. fMRI measurements of amygdala activation are confounded by stimulus correlated signal fluctuation in nearby veins draining distant brain regions. Sci Rep. (2015) 2:10499. doi: 10.1038/srep10499
58. Bandettini PA, Bowtell R, Jezzard P, Turner R. Ultrahigh field systems and applications at 7 T and beyond: progress, pitfalls, and potential. Magn Reson Med. (2012) 67:317–21. doi: 10.1002/mrm.23151.
59. Lutti A, Thomas DL, Hutton C, Weiskopf N. High-resolution functional MRI at 3 T: 3D/2D echo-planar imaging with optimized physiological noise correction. Magn Reson Med. (2013) 69:1657–64. doi: 10.1002/mrm.24398
60. Boubela RN, Kalcher K, Nasel C, Moser E. Scanning fast and slow: current limitations of 3 tesla functional MRI and future potential. Front Phys. (2014) 2:00001. doi: 10.3389/fphy.2014.00001
61. Nencka AS, Rowe DB. Reducing the unwanted draining vein BOLD contribution in fMRI with statistical post-processing methods. Neuroimage (2007) 37:177–88. doi: 10.1016/j.neuroimage.2007.03.075
62. Kalcher K, Boubela RN, Huf W, Našel C, Moser E. Identification of voxels confounded by venous signals using resting-state fmri functional connectivity graph community identification. Front Neurosci. (2015) 9:472. doi: 10.3389/fnins.2015.00472
Keywords: science, bias, NMR spectroscopy, MRS spectroscopy, fMRI neuroimaging
Citation: Moser E and Szántay C Jr (2018) Self-Managed Belief as Part of the “Scientific Method”: Part II—Examples From Published Scientific Work. Front. Phys. 6:70. doi: 10.3389/fphy.2018.00070
Received: 09 March 2018; Accepted: 13 June 2018;
Published: 10 July 2018.
Edited by:
Alex Hansen, Norwegian University of Science and Technology, NorwayReviewed by:
Federico Giove, Centro Fermi - Museo Storico Della Fisica e Centro Studi e Ricerche Enrico Fermi, ItalyCopyright © 2018 Moser and Szántay. This is an open-access article distributed under the terms of the Creative Commons Attribution License (CC BY). The use, distribution or reproduction in other forums is permitted, provided the original author(s) and the copyright owner(s) are credited and that the original publication in this journal is cited, in accordance with accepted academic practice. No use, distribution or reproduction is permitted which does not comply with these terms.
*Correspondence: Ewald Moser, ewald.moser@meduniwien.ac.at