- 1PoreLab, Department of Physics, Norwegian University of Science and Technology, Trondheim, Norway
- 2PoreLab, Department of Chemistry, Norwegian University of Science and Technology, Trondheim, Norway
We study three different time integration methods for a dynamic pore network model for immiscible two-phase flow in porous media. Considered are two explicit methods, the forward Euler and midpoint methods, and a new semi-implicit method developed herein. The explicit methods are known to suffer from numerical instabilities at low capillary numbers. A new time-step criterion is suggested in order to stabilize them. Numerical experiments, including a Haines jump case, are performed and these demonstrate that stabilization is achieved. Further, the results from the Haines jump case are consistent with experimental observations. A performance analysis reveals that the semi-implicit method is able to perform stable simulations with much less computational effort than the explicit methods at low capillary numbers. The relative benefit of using the semi-implicit method increases with decreasing capillary number Ca, and at Ca ~ 10−8 the computational time needed is reduced by three orders of magnitude. This increased efficiency enables simulations in the low-capillary number regime that are unfeasible with explicit methods and the range of capillary numbers for which the pore network model is a tractable modeling alternative is thus greatly extended by the semi-implicit method.
1. Introduction
Different modeling approaches have been applied in order to increase understanding of immiscible two-phase flow in porous media. On the pore scale, direct numerical simulation approaches using e.g. the volume of fluid method [1] or the level-set method [2, 3] to keep track of the fluid interface locations, have been used. The lattice-Boltzmann method is another popular choice, see e.g. Ramstad et al. [4]. These methods can provide detailed information on the flow in each pore. They are, however, computationally intensive and this restricts their use to relatively small systems.
Pore network models have proven to be useful in order to reduce the computational cost [5], or enable the study of larger systems, while still retaining some pore-level detail. In these models, the pore space is partitioned into volume elements that are typically the size of a single pore or throat. The average flow properties in these elements are then considered, without taking into account the variation in flow properties within each element.
Pore network models are typically classified as either quasi-static or dynamic. The quasi-static models are intended for situations where flow rates are low, and viscous pressure drops are neglected on the grounds that capillary forces are assumed to dominate at all times. In the quasi-static models by Lenormand et al. [6], Willemsen [7], and Blunt [8], the displacement of one fluid by the other proceeds by the filling of one pore at the time, and the sequence of pore filling is determined by the capillary entry pressure alone.
The dynamic models, on the other hand, account for the viscous pressure drops and thus capture the interaction between viscous and capillary forces. As three examples of such models, we mention those by Hammond and Unsal [5], Joekar-Niasar et al. [9], and Aker et al. [10]. A thorough review of dynamic pore network models was performed by Joekar-Niasar and Hassanizadeh [11].
The pore network model we consider here is of the dynamic type that was first presented by Aker et al. [10]. Since the first model was introduced, it has been improved upon several times. Notably, it was extended to include film and corner flow by Tørå et al. [12]. The model considered here does not contain this extension. This class of models, which we call the Aker-type models, is different from the majority of other pore network models [5, 9] in that both the pore body and pore throat volumes are assigned to the links, and no volume is assigned to the nodes. Fluid interface locations are tracked explicitly as they move continuously through the pore space. This is in contrast to the model by Hammond and Unsal [5], where interfaces are moved through whole volume elements at each time step, and to the model of Joekar-Niasar et al. [9], where interface locations are only implicitly available through the volume element saturation. One of the advantages of the Aker-type model is that a detailed picture of the fluid configuration is provided at any time during a simulation. Dynamic phenomena, such as the retraction of the invasion front after a Haines jump [13–16], are thus easily resolved.
Since 1985, numerical instabilities at low capillary numbers have been known to occur for various types of dynamic pore network models [17]. A whole section is devoted to the topic in the review by Joekar-Niasar and Hassanizadeh [11]. It is important to address such stability problems rigorously, as many of the practical applications of two-phase porous media flow are in the low capillary number regime. Examples include most parts of the reservoir rock during CO2 sequestration, flow of liquid water in fuel cell gas diffusion layers and studies of Haines jump dynamics, see e.g. Armstrong and Berg [15].
When Aker-type pore network models are used, the numerical instabilities are observed as oscillations in the positions of the fluid interfaces. Some efforts to avoid these oscillations have been made by introduction of modifications to the model. Medici and Allen [18] used a scheme where water was allowed to flow in the forward direction only in order to study water invasion in fuel cell gas diffusion layers. While this approach led to interesting results, it has some downsides. First, the interface movement is artificially restricted, and certain dynamic effects can not be resolved. This includes e.g. invasion front retraction after a Haines jump. Second, the method can only be used in cases with transient invasion. Studies of steady-state flow, such as those performed by Knudsen et al. [21] and Savani et al. [19], are not possible.
Because the oscillations originate in the numerical methods, rigorous attempts to remove them should focus on these methods rather than the models themselves. Joekar-Niasar et al. [9] followed this avenue and achieved stabilization using a linearized semi-implicit method. Their work, however, concerned a different type of pore network model than that considered here.
In this work, we present three numerical methods that can be utilized to perform stable simulations of two-phase flow in porous media with pore network models of the Aker type. The stability problems previously observed are thus solved without the need to resort to model modifications that restrict interface movement or preclude steady-state flow simulations. Two explicit methods are discussed, the forward Euler method and the midpoint method. These are stabilized by a new time step criterion derived herein. The third method is a new semi-implicit method. Thorough verifications of all methods are performed, confirming correct convergence properties and stability. Finally, we compare the methods in terms of performance.
The rest of this paper is structured as follows. Section 2 contains background information on the pore network model. Section 3 presents briefly the nomenclature, used in subsequent sections to describe the time integration methods. In section 4, we recapitulate how the forward Euler method is used to integrate the model and we present a new time step criterion that stabilizes both forward Euler and the midpoint method at low capillary numbers. We briefly review the midpoint method in section 5. The new semi-implicit method is described in detail in section 6. Some remarks about the numerical implementation are made in section 7. Section 8 contains a description of the cases simulated. Numerical experiments, including a Haines jump case, that show convergence and stability are given in section 9 and a comparison of the method performances are made in section 10. Section 11 summarizes and concludes the paper.
2. Pore Network Model
We consider incompressible flow of two immiscible fluids in a porous medium, where one fluid is more wetting toward the pore walls than the other. We call the less wetting fluid non-wetting (n) and the more wetting fluid we call wetting (w). The porous medium is represented in the model by a network of N nodes connected by M links. Each node is given an index i ∈ [0, N − 1], and each link is identified by the indices of the two nodes it connects. An example pore network is shown in Figure 1. The nodes are points that have no volume and, consequently, all fluid is contained in the links. The links therefore represent both the pore and the throat volumes of the physical porous medium. In this respect, the pore network model studied here differ from most other pore network models [11]. Each fluid is assumed to fill the entire link cross section. The interface positions are therefore each represented in the model by a single number, giving its location along the link length.
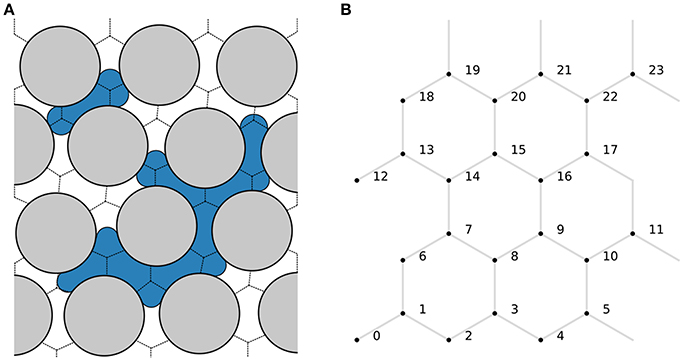
Figure 1. Illustration of (A) a physical pore network with wetting (white) and non-wetting fluid (blue) and (B) its representation in the pore network model. The void space volumes separated by dashed lines in (A) are each represented as one link in (B). The node points in the model representation (B) is assumed to be located at the intersection points of the dashed lines in (A). Each fluid is assumed to fill the entire link cross section. The interface positions are therefore each represented in the model by a single number, giving its location along the link length.
The flow in each link is treated in a one-dimensional manner, where the flow is averaged over the link cross section. As we consider flow in relatively small cross sections only, we neglect any inertial effects and the volume flow rate (m3 s−1) from node j to node i through the link connecting then is given by Washburn [20]
Herein, pi (Pa) is the pressure in node i, gij (m3 s-1 Pa−1) is the link mobility, cij (Pa) is the link capillary pressure and zij (m) is a vector containing the positions of any fluid interfaces present in the link. Both the link mobility and the capillary pressure depend on the fluid interface positions in the link. If two nodes i and j are not connected by a link, then gij = 0. Due to mass conservation, the net flow rate into every node i is zero
While the mobilities are symmetric with respect to permutation of the indices, the capillary pressures are anti-symmetric,
Introducing this into Equation (1), we obtain the immediately intuitive result
The cross-sectional area of link ij is denoted aij (m2). Interface positions are advected with the flow according to
when they are sufficiently far away from the nodes. Near the nodes, however, the interfaces are subject to additional modeling to account for interface interactions in the pores. This is discussed further in section 2.3.
The form of the expressions for the mobilities and capillary pressures depends on the shape of the links, and many different choices and modeling approaches are possible. Here, we will use models similar to those previously presented and used by e.g. Knudsen et al. [21] and Aker et al. [10]. However, the treated time integration methods are more general and can be applied to other models as well.
2.1. Link Mobility Model
We apply a cylindrical link model when computing the mobilities, so that
Here, rij (m) is the link radius and Lij (m) is the link length. The viscosity μij (Pa s) is the volume-weighted average of the fluid viscosities and can be computed from the wetting and non-wetting fluid viscosities μw and μn and the wetting fluid saturation sij,
2.2. Capillary Pressure Model
In each link ij, there may be zero, one or more interfaces present. These are located at the positions specified in zij. As the interfaces may be curved, there may be a discontinuity in pressure at these interface locations. The capillary pressure cij is the sum of interfacial pressure discontinuities in the link ij. When computing the capillary pressures, we assume that the links are wide near each end, and therefore that interfaces located near a link end have negligible curvature and no pressure discontinuity, while the links have narrow throats in the middle. The link capillary pressures are thus modeled as
The interfacial tension between the fluids is denoted σwn (N m-1) and
The χij-function ensures zones of length αrij at both ends of each link with zero capillary pressure across any interface located there. Choosing α = 0 is equivalent to replacing χij with z/Lij in (9).
2.3. Fluid Interface Interaction Models
The equations discussed so far in this section describe how the fluids and the fluid interfaces move through the links. In addition, we rely on models for how they behave close to the nodes. The purpose of these are to emulate interface interactions in the pore spaces.
The following is assumed about the fluid behavior near the nodes and is accounted for by the fluid interface interaction models.
• The mass of each fluid is conserved at every node. This means that at all times, all wetting and non-wetting fluid flowing into a node from one subset of its neighboring links must flow out into another disjoint subset of its neighboring links.
• The network nodes in the model have no volume. However, due to the finite size of the physical pore void spaces, wetting fluid flowing into a pore space must be able to flow freely past any non-wetting fluid occupying the node point if the non-wetting fluid does not extend far enough into the pore void space cut the wetting fluid off. An example is illustrated in Figure 2. We consider a link ij to be cut off from free outflow of wetting fluid if the non-wetting fluid continuously extends a length at least αrij into the link. Non-wetting fluid may freely flow past wetting fluid, or not, the same manner.
• In each link ij, interfacial tension will prevent droplets with length smaller than αrij from forming by separation from larger droplets. An example is illustrated in Figure 3.
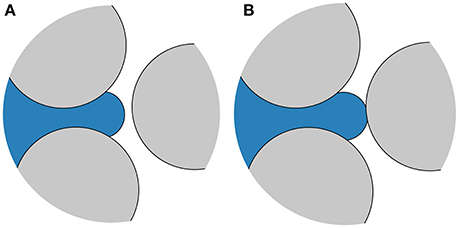
Figure 2. Network node connected to three links. The node point, located near the middle of the pore space, is occupied by non-wetting fluid (blue). (A) The non-wetting fluid extends only a short distance into the links containing wetting fluid (white). The wetting fluid therefore remains connected and may flow freely through the pore space. (B) Non-wetting fluid protrudes far enough into all links to block the pore space for wetting fluid. The wetting fluid must now displace the non-wetting fluid in order to flow through.

Figure 3. (A) Small non-wetting bubble (blue) whose volume is small compared to the link volumes and is prevented from splitting by interfacial tension. This limits the minimum size of non-wetting bubbles, which will either (B) be stuck or (C) move through one of the links without splitting.
2.4. Boundary Conditions
We consider only networks where the nodes and links can be laid out in the two-dimensional x-y plane. These networks will be periodic in both the x- and y-direction. However, the model is also applicable to networks that extend in three dimensions [22], and the presented numerical methods are also compatible both with networks in three dimensions and with other, non-periodic boundary conditions [23].
We will here apply two types of boundary conditions to the flow. With the first type, a specified pressure difference ΔP (Pa) will be applied across the network in the y-direction. This pressure difference will be equal to the sum of all link pressure differences in any path spanning the network once in the y-direction, ending up in the same node as it started. With the other type of boundary condition, we specify a total flow rate Q (m3 s−1) across the network. This flow rate will be equal to the sum of link flow rates flowing through any plane drawn through the network normal to the y-axis.
3. Temporal Discretization
In the following three sections, we describe the different time integration methods considered. These methods are applied to Equation (6), where evaluation of the right hand side involves simultaneously solving the mass conservation equation (2) and the constitutive equation (1) to obtain all unknown link flow rates and node pressures.
The discretized times (s) are denoted with a superscript where n is the time step number,
The time step Δt(i) is the difference between t(i + 1) and t(i) and the time t(0) is the initial time in a simulation. Similarly, quantities evaluated at the discrete times are denoted with time step superscripts, e.g.
Mobilities and capillary pressures with superscripts are evaluated using the interface positions at the indicated time step,
4. Forward Euler Method
The forward Euler method is the simplest of the time integration methods considered here and is the one used most frequently in previous works, see e.g. Knudsen et al. [21] and Sinha and Hansen [24]. We include its description here for completeness and to provide context for the proposed new capillary time step criterion that is introduced to stabilize the method at low capillary numbers.
The ordinary differential equation (ODE) (6) is discretized in a straightforward manner for each link ij using forward Euler,
The flow rates are calculated by inserting Equation (1), evaluated with the current known interface positions,
into the mass conservation equation (2). This results in the a system of linear equations consisting of one equation,
for each node i with unknown pressure. This linear system can be cast into matrix form,
where the vector x contains the unknown node pressures, e.g.
The matrix elements are
and the elements of the constant vector are
The node pressures are obtained by solving this linear equation system. The flow rates are subsequently evaluated using Equation (16) and the interface positions are then updated using Equation (15) and the interface interaction models.
4.1. Time Step Restrictions
In previous works [10, 21], the time step length was chosen from a purely advective criterion,
The parameter Ca corresponds to the maximum fraction of a link length any fluid interface is allowed to move in a single forward Euler time step. The value of Ca must be chosen based on the level of accuracy desired from the simulation.
However, selecting the time step based on the advective criterion only, often results in numerical instabilities at low capillary numbers, where viscous forces are small relative to the capillary forces. This is demonstrated in section 9.2. The origins of the numerical instabilities can be identified by performing analysis on a linearized version of the governing equations. This is done in Appendix A. This analysis also leads to a new time step criterion, whereby the time step length is restricted by the sensitivity of the capillary forces to perturbations in the current interface positions,
For the particular choice of capillary pressure model given by (9), we obtain
According to the linear analysis, numerical instabilities are avoided if the parameter Cc is chosen such that 0 < Cc < 1. However, we must regard (23) as an approximation when we apply it to the full non-linear model in simulations and, consequently, we may have to chose Cc conservatively to ensure stability for all cases.
At each step in the simulation, the time step used is then taken as
to comply with both the advective and the capillary time step criteria. The capillary time step restriction (23) is independent of flow rate. It therefore becomes quite severe, demanding relatively fine time steps, when flow rates are low.
4.2. Boundary Conditions
The periodic boundary conditions, specifying a total pressure difference ΔP across the network, can be incorporated directly into the linear equation system (18). For each node i, a term is added to or subtracted from bi for any link ij that crosses the periodic boundary.
With the specified ΔP condition implemented, we can use it to obtain the node pressures and link flow rates corresponding to a specified total flow rate Q. Due to the linear nature of the model, the total flow rate is linear in ΔP [10], so that
for some unknown coefficients C1 and C2, that are particular to the current fluid configuration.
We choose two different, but otherwise arbitrary, pressure drop values ΔP1 and ΔP2 and, using the above procedure, we solve the network model once for each pressure difference and calculate the corresponding total flow rates Q1 and Q2. The coefficients C1 and C2 are then determined by,
The pressure difference ΔP required to obtain the specified flow rate Q is determined by solving Equation (26) for ΔP. Subsequently, the network model is solved a third time with pressure drop ΔP to obtain the desired node pressures and link flow rates.
5. Midpoint Method
The forward Euler method is first-order accurate in time. To obtain smaller numerical errors, methods of higher order are desirable. We therefore include in our discussion the second-order midpoint method. This method is identical to that used by Aker et al. [10], except with respect to choice of time step length.
The ODE (6) is discretized as
where is the flow rate at the midpoint in time between point n and n + 1. This flow rate is calculated in the same manner as described in section 4. The interface positions at n + 1/2 are obtained by taking a forward Euler step with half the length of the whole time step,
5.1. Time Step Restrictions
Since the forward Euler stability region is contained within the stability region for the midpoint method, we use the same time step restrictions for the midpoint method as for forward Euler, see section 4.1.
5.2. Boundary Conditions
Both the specified ΔP and the specified Q boundary conditions are incorporated into the midpoint method by applying the procedures described in section 4.2 for each evaluation of the right hand side of Equation (6).
6. Semi-Implicit Method
To avoid both the numerical instabilities and the time step restriction (23), which becomes quite severe at low flow rates, we here develop a new semi-implicit time stepping method. Simulation results indicate that this method is stable with time steps determined by the advective criterion (22) only, and much longer time steps are therefore possible than with the forward Euler and midpoint methods at low capillary numbers.
The ODE (6) is now discretized according to
The semi-implicit nature of this discretization comes from the flow rate used,
Herein, the link mobility is evaluated at time step n, while the node pressures and the capillary pressure are evaluated time step n + 1.
The link mobilities could of course also have been evaluated at time step n + 1, thus creating a fully implicit backward Euler scheme. As is shown in Appendix A, we may expect backward Euler to be stable with any positive Δt(n). The backward Euler scheme may therefore seem like a natural choice for performing stable simulations with long time steps. However, to evaluate the mobilities at time step n + 1 complicates the integration procedure and was found to be unnecessary in practice. A semi-implicit alternative is therefore preferred.
To obtain the node pressures, we solve the mass conservation equations,
Again, we have one equation for each node i with unknown pressure. However, because the capillary pressures now depend on the flow rates,
the mass conservation equations are now a system of non-linear equations, rather than a system of linear equations. This system can be cast in the form
where x contains the unknown pressures, e.g.
In order to solve Equation (35) using the numerical method described in section 7, it is necessary to have the Jacobian matrix of F. Details on how the Jacobian matrix is calculated are given in Appendix B.
The calculation of link flow rates from node pressures, and thus every evaluation of F and its Jacobian, involves solving one non-linear equation for each link flow rate,
The derivative of Gij with respect to is
The procedure for updating the interface positions with the semi-implicit method may be summarized as follows. The non-linear equation system (35) is solved to obtain the unknown node pressures. In every iteration of the solution procedure, the flow rates are evaluated by solving Equation (37) for each link. When a solution to Equation (35) is obtained, the interface positions are updated using Equation (31) and the interface interaction models.
6.1. Time Step Restrictions
We aim to select the time steps such that
However, to solve the non-linear system (35) is challenging in practice and requires initial guess values for the link flow rates and node pressures that lie sufficiently close to the solution. For this purpose, we here use values from the previous time step. This turns out to be a sufficiently good choice for most time steps, but our numerical solution procedure does not always succeed. As the link flow rates and node pressures at two consecutive points in time become increasingly similar as the time interval between them is reduced, we may expect the guess values to lie closer to the solution if we reduce the time step. Thus, if our solution procedure is unable to succeed, our remedy is to shorten Δt(n). This will sometimes lead to time steps shorter than . If, for a given time step, Δt(n) must be reduced to less than twice the time step length allowed by the explicit methods, we revert to forward Euler for that particular step. As we demonstrate in section 10, however, this does not prevent the semi-implicit method from being much more efficient than the explicit methods at low capillary numbers.
6.2. Boundary Conditions
As with the explicit methods, the specified ΔP boundary condition can be incorporated directly into the mass balance equation system, in this case Equation (35). This is done by adding to or subtracting from the right hand sides of Equation (32) and Equation (37) a term for each link ij crossing the periodic boundary.
The specified flow rate boundary condition is incorporated by including ΔP as an additional unknown and adding an additional equation
to the non-linear equation system (35). Herein, Ω is the set of links crossing the periodic boundary, with i being the node on the downstream side and j being the node on the upstream side. Thus, Equation (40) is satisfied when the total flow rate through the network is equal to Q.
7. Implementation
The non-linear equation system (35) is solved using a Newton-type solution method that guarantees convergence to a local minimum of F·F, see Press et al. [25, p. 477]. However, a local minimum of F·F is not necessarily a solution to Equation (35), and good initial guess values for the node pressures and link flow rates are therefore crucial. For this purpose, we use the values from the previous time step and reduce the length of the current time step if the solution method fails, as discussed in section 6.1.
Solving Equation (37) is done using a standard Newton solver [26]. For robustness, a bisection solver [26] is used if the Newton solver fails.
The Newton-type solver for non-linear systems and the explicit time integration methods require methods for solving linear systems of equations. We use the conjugate gradient method in combination with the LU preconditioner implemented in the PETSc library, see Balay et al. [27]. An introduction to solving systems of Kirchhoff-type equations numerically can be found in Batrouni and Hansen [28].
8. Case Descriptions
In this section, we describe the two simulated cases. One is a test case where a single bubble is contained in a network consisting of links connected in series, while the other is designed to capture a single Haines jump in a small network where fluids flow at a specified rate.
8.1. Links-In-Series Test Case
The verification will include comparison of results from the various numerical methods applied to a test case. The test case is chosen such that it can be set up as a single ODE with a closed expression for the right-hand side. An accurate reference solution can thus be easily obtained using a high-order Runge–Kutta method. As our test case, we consider a network consisting of M = 3 identical links connected in series. The network contains a single bubble of length ℓ (m) with center position z (m). In the capillary pressure model, we choose α = 0. The ODE (6) can then be restated as an equivalent equation for the bubble position,
where Q is the flow through the network and a is the link cross-sectional area. The model equations can be reduced to the following expression for flow rate.
Here, g is the mobility of a single link, L = 1.0·10−3 m is the length of a single link and r = 1.0·10−4 m is the link radius. The bubble has length ℓ = 4.8·10−4 m and is initially located at z = 2.4·10−4 m. The fluid parameters used in all simulations are given in Table 1. The pressure difference ΔP will be stated for each simulation.

Table 1. Fluid properties corresponding to water (w) and decane (n) at atmospheric pressure and 298 K.
8.2. Haines Jump Case
The Haines jump was first reported almost 90 years ago [13]. It refers to the sudden drops in driving pressure observed in drainage experiments when non-wetting fluid breaks through a throat and invades new pores. This process was studied experimentally and numerically by Måløy et al. [16] and, more recently, it was imaged directly and analyzed in detail by Armstrong and Berg [15] for flow in a micromodel and by Berg et al. [14] for flow in a sample of Berea sandstone. The Haines jump case simulated here captures one such break-through and subsequent pressure drop.
Among the findings in the study by Måløy et al. [16] was that pore drainage is a non-local event, meaning that as one pore is drained, imbibition occurs in nearby neck regions. This was also observed by Armstrong and Berg [15], and was explained as follows. When the imposed flow rates are low, the non-wetting fluid that fills the newly invaded pores needs to be supplied from nearby locations rather than the external feed. Armstrong and Berg [15] also found, for their range of investigated parameters, that pore drainage occurred on the same time-scale, regardless of the externally imposed flow rate.
We consider a hexagonal network consisting N = 24 nodes and M = 36 links. All links have length 1.0 · 10−3 m, while the link radii are drawn randomly from a uniform distribution between 0.1 and 0.4 link lengths. In the capillary pressure model, we choose α = 1. The fluid parameters μw, μn and σwn are the same as in the links-in-series test case, see Table 1. With these fluid parameters and network length scales, the case mimics the flow of water (w) and decane (n) in a Hele-Shaw cell filled with glass beads similar to those used in e.g. Måløy et al. [16, 31] and Tallakstad et al. [32]. The linear dimensions are ~10 times bigger in this network compared to the micromodel of Armstrong and Berg [15]. Initially, the fluids are distributed in the network as shown in Figure 4, with the non-wetting fluid in a single connected ganglion.
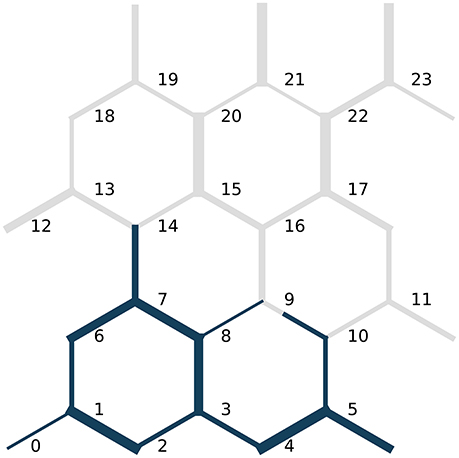
Figure 4. Initial fluid configuration in the Haines jump case. The non-wetting fluid is blue while the wetting fluid is gray. The link radii are not drawn to scale with the link lengths. Node indices are indicated in black.
Simulations are run at different specified flow rates Q until a net fluid volume equivalent to 5% of the total pore volume has flowed through the network. The flow dynamics will, of course, depend upon the specified flow rate. At low flow rates, however, the flow will exhibit some relatively fast fluid redistribution events and one relatively slow pressure build-up and subsequent Haines jump event. The Haines jump will occur as the non-wetting fluid breaks through the link connecting nodes 9 and 16 and invades node 16, see Figure 4.
It was mentioned by Armstrong and Berg [15] that the large local flow velocities that they observed as a pore was filled with non-wetting fluid during a Haines jump has implications for how such processes must be numerically simulated. Specifically, the time resolution of the simulation needs to be fine enough during these events to capture them. This poses a challenge when externally applied flow rates are low and there is thus a large difference in the large time scale that governs the overall flow of the system and the small time scale than governs the local flow during Haines jumps.
9. Verification
In this section, we verify that the time integration methods presented correctly solve the pore network model equations and that the time step criteria presented give stable solutions.
9.1. Convergence Tests
All time integration methods presented should, of course, give the same solution for vanishingly small time steps. Furthermore, the difference between the solution obtained with a given finite time step and the fully converged solution should decrease as the time steps are refined, and should do so at a rate that is consistent with the order of the method. In this section, we verify that all three time integration methods give solutions that converge to the reference solution for the links-in-series test case and thus that the methods correctly solve the model equations for this case.
We choose the pressure difference to be ΔP = −3200 Pa. This value is large enough to overcome the capillary forces and push the non-wetting bubble through the links. We therefore expect a flow rate Q that varies in time, but is always positive.
As measures of the numerical error, we consider both the relative error in the flow rate Q and the relative error in bubble position z between the numerical solutions and reference solutions at the end of the simulation. Time integration is performed from t = 0 s to t = 0.001 44 s. To have control over the time step lengths, we ignore all time step criteria for now and instead set a constant Δt for each simulation.
In Figure 5, flow rates are plotted for each of the time integration methods. Results using a coarse time step, Δt = 4·10−5 s, and a fine time step, Δt = 1·10−5 s, are shown along with the reference solution.
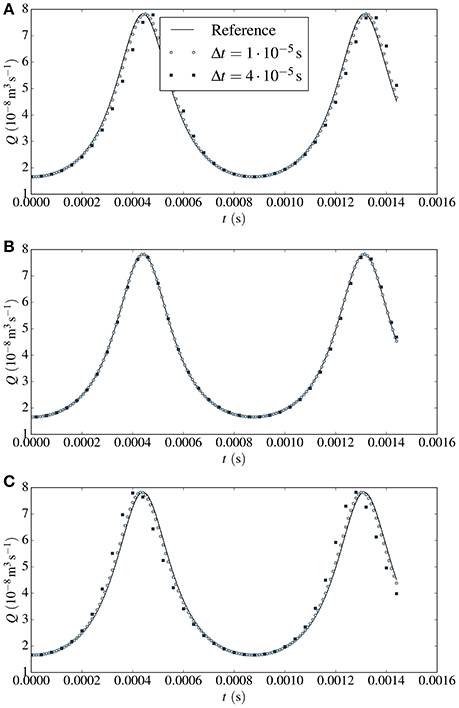
Figure 5. Flow rates Q plotted against time for two different time steps Δt for the links-in-series test case with Δ P = −3200Pa. Results from the forward Euler method are given in (A), results from the midpoint method in (B) and results from the semi-implicit method in (C). The solid line represents the reference solution.
For the forward Euler and the semi-implicit method, there is considerable discrepancy between the numerical and the reference solution with the coarse time step. The flow rate obtained from forward Euler lags behind the reference solution, while that from the semi-implicit method lies ahead of it. This may be expected, however, since forward Euler at each time step uses current information in the right hand side evaluation, whereas the semi-implicit method uses a combination of current and future information. With the fine time step, there is less difference between the reference and the numerical solutions. With the more accurate midpoint method, the coarse-stepped numerical solution lies only marginally ahead of the reference solution while there is no difference between the fine-stepped numerical solution and the reference solution at the scale of representation.
The convergence of the numerical solutions to the reference solution upon time step refinement is quantified in Tables 2–4. Herein, the numerical errors and estimated convergence orders are given for the forward Euler, midpoint and semi-implicit method, respectively. For all methods considered, the numerical errors decrease when the time step is refined and do so at the rate that is expected. The forward Euler and the semi-implicit method exhibit first-order convergence, while the midpoint method shows second-order convergence. We note that the errors in both z and Q are similar in magnitude for the forward Euler and the semi-implicit method. The errors obtained with the midpoint method are smaller. The difference is one order of magnitude for Δt = 1·10−5 s.

Table 2. Relative errors in bubble position z and flow rate Q at t = 0.001 44 s and estimated convergence orders for the links-in-series test case computed with the forward Euler method.

Table 3. Relative errors in bubble position z and flow rate Q at t = 0.001 44 s and estimated convergence orders for the links-in-series test case computed with the midpoint method.

Table 4. Relative errors in bubble position z and flow rate Q at t = 0.001 44 s and estimated convergence orders for the links-in-series test case computed with the semi-implicit method.
In summary, we have verified that the presented time integration methods correctly solve the pore network model equations for the links-in-series test case and that the numerical errors decrease upon time step refinement at the rate that is consistent with the expected order of the methods.
9.2. Stability Tests
In this section, we demonstrate that the proposed capillary time step criterion (23) stabilizes the forward Euler method and the midpoint method at low flow rates. We simulated two different cases and varied Cc. Simulations run with low Cc turned out to be free of spurious oscillations, indicating that the proposed criterion stabilizes the methods, while simulations run with Cc significantly larger than unity produced oscillations, indicating that the proposed criterion is not unnecessarily strict.
First, consider the links-in-series test case with ΔP = 0 Pa. With no applied pressure difference, the flow is driven purely by the imbalance of capillary forces on the non-wetting bubble. Therefore, there should only be flow initially and the bubble should eventually reach an equilibrium position where both interfaces experience the same capillary force and the flow rate is zero. Simulations were run with Ca = 0.1 and Cc equal to 2.0, 1.0, and 0.5. Results from forward Euler are shown in Figure 6A and results from the midpoint method are shown in Figure 6B. In both figures, the reference solution is also shown.
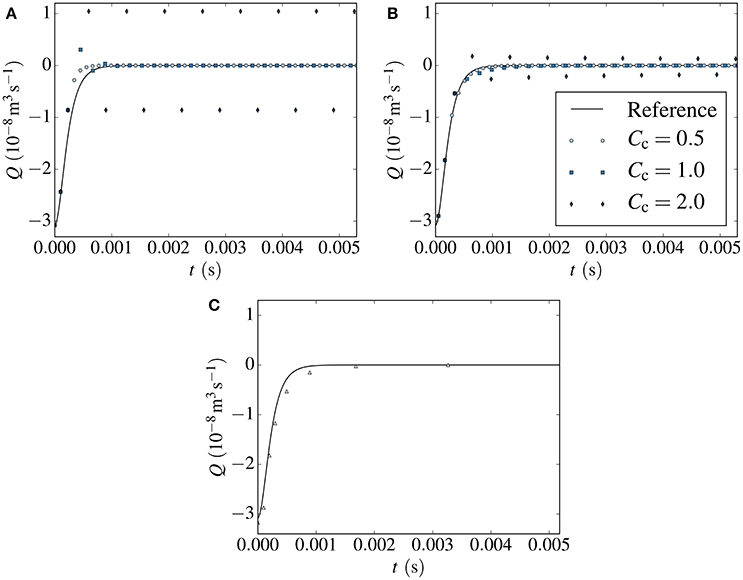
Figure 6. Flow rate plotted against time in the link-in-series test case with ΔP = 0 Pa. Results from the forward Euler method (A) and the midpoint method (B) are shown for different values of Cc. Severe numerical instabilities arise when Cc = 2.0. Results from the semi-implicit method are shown are shown in (C). These are stable, even if the capillary time step criterion is not used. The solid black line represents a reference solution.
The forward Euler results are stable and qualitatively similar to the reference solution with Cc = 0.5. With Cc = 1.0, there are some oscillations initially that are dampened and eventually vanish. From comparison with the reference solution, it is clear that such oscillations have no origin in the model equations and are artifacts of the numerical method. With Cc = 2.0, the oscillations are severe and do not appear to be dampened by the method. Instead the non-wetting bubble keeps oscillating around its equilibrium position in a manner that is clearly unphysical.
The results from the midpoint method in Figure 6B follow a qualitatively similar trend as those from forward Euler with regard to stability. Results computed with Cc = 0.5 are stable and results with Cc = 2.0 exhibit severe oscillations. Still, the results from the midpoint method lie much closer to the reference solution than the results from the forward Euler method, as we would expect since the midpoint method is second-order. Both methods are, however, unstable with Cc = 2.0, indicating that the while the midpoint method has improved accuracy over forward Euler, it is unable to take significantly longer time steps without introducing oscillations. This is consistent with the analysis in Appendix A, since the two methods have identical stability regions in real space.
Next, consider the Haines jump case with Q = 10−9 m3 s−1, corresponding to Ca = 1.2·10−5. This case was run using the forward Euler method, Ca = 0.1 and three different values of Cc, equal to 4.0, 2.0, and 1.0. The required pressure difference to drive the flow at the specified rate is shown in Figure 7A. Figure 7B shows the pressure from Figure 7A in greater detail.
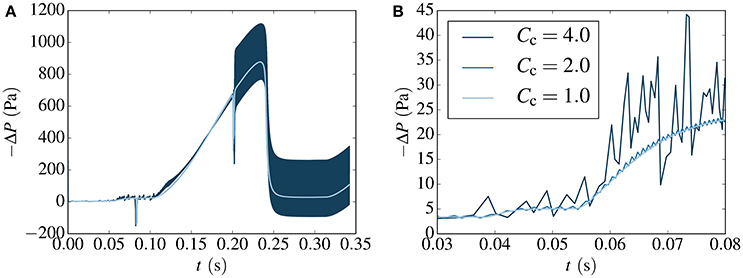
Figure 7. Pressure difference required to drive the flow in the Haines jump case at a rate of Q = 10−9 m3 s−1, corresponding to Ca = 1.2·10−5. In (B), the results from (A) are shown in greater detail. Results are computed with the forward Euler method for different values of the capillary time step restriction parameter Cc. Numerical instabilities are seen to occur for Cc>1.
For all three values of Cc, the main qualitative features of the flow are captured. We observe short transient pressure drops at t ≈ 0.08 s and t ≈ 0.20 s. These correspond to fluid redistribution events on the upstream side of the non-wetting ganglion, where the fluid rearranges itself to a more stable configuration with little change to the interface positions on the downstream side. The event at t ≈ 0.20 s is illustrated in Figure 8. The fluid redistribution is driven by capillary forces and less external pressure is therefore required to drive the flow during these events.
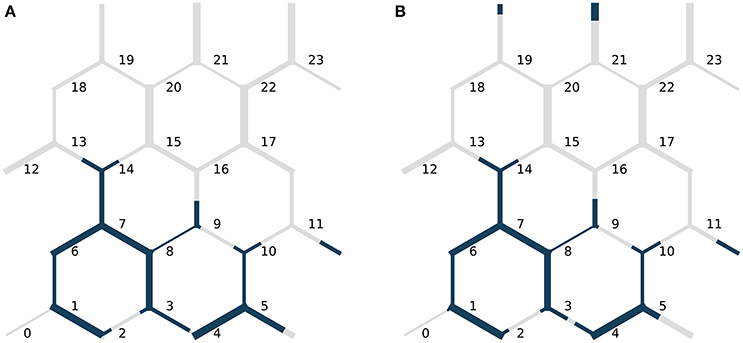
Figure 8. Fluid distribution in the Haines jump case, (A) at t = 0.19 s and (B) at t = 0.21 s, before and after the fluid redistribution event at t ≈ 0.20 s. The link radii are not drawn to scale with the link lengths. Node indices are indicated in black.
We also observe the slow pressure build-up from t ≈ 0.10 s to t ≈ 0.23 s, when the driving pressure becomes large enough to overcome the capillary forces and cause break-through of non-wetting fluid in the link connecting nodes 9 and 16, and we observe the subsequent Haines jump. The fluid configurations before and after the Haines jump are shown in Figure 9. Notice also that non-wetting fluid at the downstream end of the moving ganglion retracts during the Haines jump in links near to where the break-through occurs. This is seen e.g. in the links downstream of nodes 10 and 14. That such local imbibition occurs near the drained pore is in agreement with the observations of Armstrong and Berg [15], and shows that the model is able to capture the non-local nature of pore drainage events in a numerically stable manner when the new numerical methods are used.
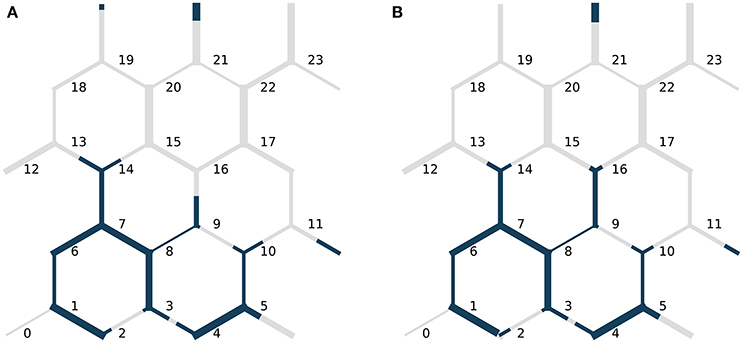
Figure 9. Fluid distribution in the Haines jump case (A) at t = 0.23 s and (B) at t = 0.27 s, before and after the Haines jump. During the jump, non-wetting fluid breaks-through the link connecting nodes 9 and 16 and invades node 16. Also, non-wetting fluid in other links at the downstream end of the moving ganglion retracts. This is seen e.g. in the links downstream of nodes 10 and 14. The link radii are not drawn to scale with the link lengths. Node indices are indicated in black.
As in the links-in-series case, the solution exhibits oscillations for the values of Cc that are larger than unity. With Cc = 1.0, the results are free from oscillations and appear stable. This indicates that the stability criterion (23) is valid and not unnecessarily strict also for a network configuration that is much more complex than links in series.
Both the links-in-series case and the Haines jump case were simulated with the semi-implicit method and produced stable results with the advective time step criterion (22) only. The results from the links-in-series test case are shown in Figure 6C. For brevity, the results from the Haines jump case are omitted here. The reader is referred to Figure 10A in section 10, where stable results are shown for a lower flow rate.
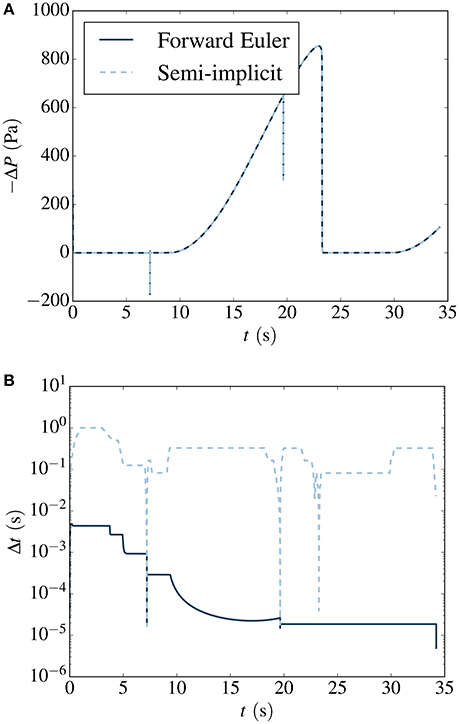
Figure 10. (A) Pressure difference required to drive the flow at Q = 10−11m3 s−1, corresponding to Ca = 1.2 · 10−7, in the Haines jump case. Results are plotted for the forward Euler method (solid dark blue) and the semi-implicit method (dashed light blue). These lines coincide at the scale of representation. The time steps lengths used by each method are plotted in (B).
To summarize, both the forward Euler and midpoint methods produce stable results for the cases considered when the capillary time step criterion (23) is used in addition to Equation (22) to select the time step lengths. By running simulations with different Cc, we have observed a transition from stable to unstable results for values of Cc near 1, in order of magnitude. In the Haines jump case, all methods presented are able to capture both the fast capillary-driven fluid redistribution events, and the slow pressure build-up before a Haines jump.
10. Performance Analysis
In this section, we analyze and compare the performance of the time integration methods. In doing so, we consider the number of time steps and the wall clock time required to perform stable simulations of the Haines jump case with each of the methods at different specified flow rates Q. The flow rates simulated were 10−7 m3 s−1, 10−8 m3 s−1, 10−9 m3 s−1, 10−10 m3 s−1, 10−11 m3 s−1, and 10−12 m3 s−1. The accuracy of the methods was studied Section 9.1, and will not be part of the performance analysis. Instead, stable simulations are considered sufficiently accurate.
First, we look more closely at the results for Q = 10−11 m3 s−1, corresponding to Ca = 1.2·10−7. The pressure difference required to drive the flow is shown in Figure 10A, and the time step lengths used are shown in Figure 10B. From the latter Figure, we see that the semi-implicit method is able to take longer time steps than forward Euler for most of the simulation. During the pressure build-up phase, the difference is four orders of magnitude. During the fast capillary-driven fluid redistribution events, however, the length of the semi-implicit time steps drop to the level of those used by forward Euler. This is because we here have relatively large flow rates in some links, even though Q is low, and the advective time step criterion (22) becomes limiting for both the semi-implicit method and forward Euler.
It was mentioned by Armstrong and Berg [15] that any accurate numerical simulation on the pore scale must have a time resolution fine enough to capture the fast events. The semi-implicit method accomplishes this by providing a highly dynamic time resolution, which is refined during the fast events. The method is therefore able to resolve these events, while time resolution can be coarsened when flow is governed by the slow externally applied flow rate, saving computational effort.
The time duration of the Haines jump pressure drops for all except the two largest externally applied flow rates were around 10 ms. This is in qualitative agreement with the results presented by Armstrong and Berg [15]. They found that, for their investigated range of parameters, pores were drained on the millisecond time scale regardless of externally applied flow rate. However, we stress that although we consider the same fluids, the pore network used here was approximately one order of magnitude larger in the linear dimensions than that of Armstrong and Berg [15].
The number of time steps and wall clock time required to simulate the Haines jump case at different specified flow rates Q are shown in Figures 11A,B, respectively.
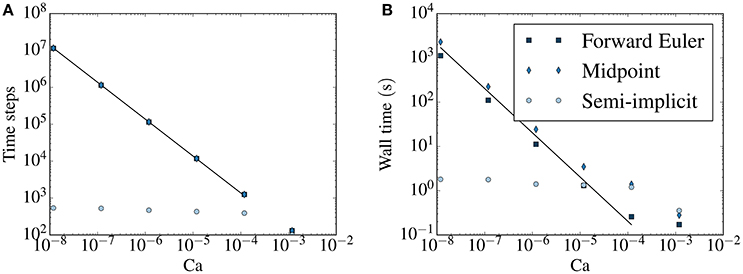
Figure 11. (A) Number of time steps and (B) wall clock time required to simulate the Haines jump case at at different specified flow rates. In each simulation, the same volume of fluid (5% of the pore volume) flows through a network. Results from the forward Euler method (squares), the midpoint method (diamonds) and the semi-implicit method (circles) are shown. In (A,B), the black lines are inversely proportional to Ca.
For the explicit methods, both the number of time steps and the wall time are proportional to Ca−1 at low capillary numbers. This is because the capillary time step criterion (23) dictates the time step at low capillary numbers (except during fast fluid redistribution events). The criterion depends on the fluid configuration, while it is independent of the flow rate. At low enough flow rates, the system will pass through roughly the same fluid configurations during the simulation, regardless of the applied Q. The speed at which the system passes through these configurations, however, will be inversely proportional to Q and therefore, so will the required wall time and number of time steps. As the forward Euler and the midpoint method are subject to the same time step criteria, these require roughly the same number of time steps at all considered flow rates. However, since the midpoint method is a two-step method, the wall time it requires is longer and approaches twice that required by the forward Euler for long wall times.
For the semi-implicit method, on the other hand, the number of time steps required to do the simulation becomes effectively independent of the specified flow rate at capillary numbers smaller than approximately 10−4. The result is that low-capillary number simulations can be done much more efficiently than with the explicit methods, in terms of wall time required to perform stable simulations. This is seen in Figure 11B. At Ca ~ 10−5, the computational time needed by all three methods are similar in magnitude. The relative benefit of using the semi-implicit method increases at lower capillary numbers. For the lowest capillary number considered, the difference in wall time between the explicit methods and the semi-implicit is three orders of magnitude.
The increased efficiency of the semi-implicit method over explicit methods at low capillary numbers means that one can use the semi-implicit method to perform simulations in the low capillary number regime that are unfeasible with explicit methods. Thus, the range of capillary numbers for which the pore network model is a tractable modeling alternative is extended to much lower capillary numbers. This includes e.g. simulations of water flow in fuel cell gas diffusion layers, where capillary numbers are can be 10−8 [33].
Finally, to study the effect of an increase in network size on the wall time required by the semi-implicit method, the Haines jump case was run on three scaled-up versions of the network with N = 24 nodes considered so far, illustrated in Figure 4. All simulations were run at Ca ~ 10−7. In Figure 12 the wall clock time time required is plotted against the number of nodes N for the different networks. The wall time is seen to increase proportionally to N2.
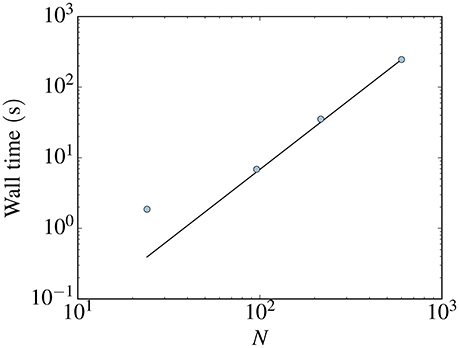
Figure 12. Wall clock time time required to simulate the Haines jump case with the semi-implicit method for different network sizes. All simulations were run at Ca ~ = 10−7 and N denotes the number of nodes in the network. The wall time is seen to increase proportionally to N2 for the three largest networks.
11. Conclusion
We have studied three different time integration methods for a pore network model for immiscible two-phase flow in porous media. Two explicit methods, the forward Euler and midpoint methods, and a new semi-implicit method were considered. The explicit methods have been presented and used in other works [10, 21, 24], and were reviewed here for completeness. The semi-implicit method was presented here for the first time, and therefore in detail.
The explicit methods have previously suffered from numerical instabilities at low capillary numbers. Here, a new time-step criterion was suggested in order to stabilize them and numerical experiments were performed demonstrating that stabilization was achieved.
It was verified that all three methods converged to a reference solution to a selected test case upon time step refinement. The forward Euler and semi-implicit methods exhibited first-order convergence and the midpoint method showed second-order convergence.
Simulations of a single Haines jump were performed. These showed that the all three methods were able to resolve both pressure build-up events and fluid redistribution events, including interfacial retraction after a Haines jump, which may occur at vastly different time scales when capillary numbers are low. The results from the Haines jump case were consistent with experimental observations made by Armstrong and Berg [15]. Fluid redistribution events cannot be properly captured when using solution methods that have previously been used at low capillary numbers that e.g. do not allow backflow [18].
A performance analysis revealed that the semi-implicit method was able to perform stable simulations with much less computational effort than the explicit methods at low capillary numbers. For the case considered, the computational time needed was approximately the same for all three methods at Ca ~ 10−5. At lower capillary numbers, the computational time needed by the explicit methods increased inversely proportional to the capillary number, while the time needed by the semi-implicit method was effectively constant. At Ca ~ 10−8, the computational time needed by the semi-implicit methods was therefore three orders of magnitude smaller than those needed by the explicit methods.
The superior efficiency of the new semi-implicit method over the explicit methods at low capillary numbers enables simulations in this regime that are unfeasible with explicit methods. Thus, the range of capillary numbers for which the pore network model is a tractable modeling alternative is extended to much lower capillary numbers. This includes e.g. simulations of water flow in fuel cell gas diffusion layers, where capillary numbers are can be 10−8 [33].
In summary, use of Aker-type pore network models were previously restricted to relatively high capillary numbers due to numerical instabilities in the explicit methods used to solve them. With the new time step criterion presented here, these stability problems are removed. However, simulations at low capillary numbers still take a long time and the computational time needed increases inversely proportional to the capillary number. This problem is solved by the new semi-implicit method. With this method, the computational time needed becomes effectively independent of the capillary number, when capillary numbers are low.
Author Contributions
To pursue low capillary number simulations with Aker-type pore network models was proposed by SK, MG, and AH in collaboration. MV developed the particular variation of the pore network model used. MG developed the new numerical methods and performed the simulations. MG wrote the manuscript, aided by comments and suggestions from MV, SK, and AH.
Conflict of Interest Statement
The authors declare that the research was conducted in the absence of any commercial or financial relationships that could be construed as a potential conflict of interest.
Acknowledgments
The authors would like to thank Dick Bedeaux, Santanu Sinha, and Knut Jørgen Måløy for fruitful discussions. Special thanks are also given to Jon Pharoah for inspiring discussions and comments. This work was partly supported by the Research Council of Norway through its Centres of Excellence funding scheme, project number 262644.
Supplementary Material
The Supplementary Material for this article can be found online at: https://www.frontiersin.org/articles/10.3389/fphy.2018.00056/full#supplementary-material
References
1. Raeini AQ, Blunt MJ, Bijeljic B. Modelling two-phase flow in porous media at the pore scale using the volume-of-fluid method. J Comput Phys. (2012) 231:5653–68. doi: 10.1016/j.jcp.2012.04.011
2. Jettestuen E, Helland JO, Prodanović M. A level set method for simulating capillary-controlled displacements at the pore scale with nonzero contact angles. Water Resour Res. (2013) 49:4645–61. doi: 10.1002/wrcr.20334
3. Gjennestad MA, Munkejord ST. Modelling of heat transport in two-phase flow and of mass transfer between phases using the level-set method. Energy Proc. (2015) 64:53–62. doi: 10.1016/j.egypro.2015.01.008
4. Ramstad T, Øren PE, Bakke S. Simulation of two-phase flow in reservoir rocks using a lattice Boltzmann method. SPE J. (2010) 15:917–27. doi: 10.2118/124617-PA
5. Hammond PS, Unsal E. A dynamic pore network model for oil displacement by wettability-altering surfactant solution. Transport Porous Media (2012) 92:789–817. doi: 10.1007/s11242-011-9933-4
6. Lenormand R, Touboul E, Zarcone C. Numerical models and experiments on immiscible displacements in porous media. J Fluid Mech. (1988) 189:165–87. doi: 10.1017/S0022112088000953
7. Wilkinson D, Willemsen JF. Invasion percolation: a new form of percolation theory. J Phys A Math Gen. (1983) 16:3365. doi: 10.1088/0305-4470/16/14/028
8. Blunt MJ. Physically-based network modeling of multiphase flow in intermediate-wet porous media. J Petroleum Sci Eng. (1998) 20:117–25. doi: 10.1016/S0920-4105(98)00010-2
9. Joekar-Niasar V, Hassanizadeh SM, Dahle H. Non-equilibrium effects in capillarity and interfacial area in two-phase flow: dynamic pore-network modelling. J Fluid Mech. (2010) 655:38–71. doi: 10.1017/S0022112010000704
10. Aker E, Måløy KJ, Hansen A, Batrouni GG. A two-dimensional network simulator for two-phase flow in porous media. Transport Porous Media (1998) 32:163–86. doi: 10.1023/A:1006510106194
11. Joekar-Niasar V, Hassanizadeh S. Analysis of fundamentals of two-phase flow in porous media using dynamic pore-network models: a review. Crit Rev Environ Sci Technol. (2012) 42:1895–976. doi: 10.1080/10643389.2011.574101
12. Tørå G, Øren PE, Hansen A. A dynamic network model for two-phase flow in porous media. Transport Porous Media (2012) 92:145–64. doi: 10.1007/s11242-011-9895-6
13. Haines WB. Studies in the physical properties of soil. v. the hysteresis effect in capillary properties, and the modes of moisture distribution associated therewith. J Agric Sci. (1930) 20:97–116. doi: 10.1017/S002185960008864X
14. Berg S, Ott H, Klapp SA, Schwing A, Neiteler R, Brussee N, et al. Real-time 3D imaging of Haines jumps in porous media flow. Proc Natl Acad Sci USA (2013) 110:3755–9. doi: 10.1073/pnas.1221373110
15. Armstrong RT, Berg S. Interfacial velocities and capillary pressure gradients during haines jumps. Phys Rev E (2013) 88:043010. doi: 10.1103/PhysRevE.88.043010
16. Måløy KJ, Furuberg L, Feder J, Jøssang T. Dynamics of slow drainage in porous media. Phys Rev Lett. (1992) 68:2161. doi: 10.1103/PhysRevLett.68.2161
17. Koplik J, Lasseter T. Two-phase flow in random network models of porous media. Soc Petrol Eng J. (1985) 25:89–100. doi: 10.2118/11014-PA
18. Medici E, Allen J. The effects of morphological and wetting properties of porous transport layers on water movement in PEM fuel cells. J Electrochem Soc. (2010) 157:B1505–14. doi: 10.1149/1.3474958
19. Savani I, Sinha S, Hansen A, Bedeaux D, Kjelstrup S, Vassvik M. A Monte Carlo algorithm for immiscible two-phase flow in porous media. Transport Porous Media (2017) 116:869–88. doi: 10.1007/s11242-016-0804-x
20. Washburn EW. The dynamics of capillary flow. Phys Rev. (1921) 17:273. doi: 10.1103/PhysRev.17.273
21. Knudsen HA, Aker E, Hansen A. Bulk flow regimes and fractional flow in 2D porous media by numerical simulations. Transport Porous Media (2002) 47:99–121. doi: 10.1023/A:1015039503551
22. Sinha S, Bender AT, Danczyk M, Keepseagle K, Prather CA, Bray JM, et al. Effective rheology of two-phase flow in three-dimensional porous media: experiment and simulation. Transport Porous Media (2017) 119:77–94. doi: 10.1007/s11242-017-0874-4
23. Erpelding M, Sinha S, Tallakstad KT, Hansen A, Flekkøy EG, Måløy KJ. History independence of steady state in simultaneous two-phase flow through two-dimensional porous media. Phys Rev E (2013) 88:053004. doi: 10.1103/PhysRevE.88.053004
24. Sinha S, Hansen A. Effective rheology of immiscible two-phase flow in porous media. Europhys Lett. (2012) 99:44004. doi: 10.1209/0295-5075/99/44004
25. Press WH, Flannery BP, Teukolsky SA, Vetterling WT. Numerical Recipes: The Art of Scientific Computing, 3rd Edn. New York, NY: Cambridge University Press (2007).
26. Süli E, Mayers D. An Introduction to Numerical Analysis. Cambridge: Cambridge University Press (2006).
27. Balay S, Abhyankar S, Adams MF, Brown J, Brune P, Buschelman K, et al. PETSc Web Page (2016). Available online at: http://www.mcs.anl.gov/petsc
28. Batrouni GG, Hansen A. Fourier acceleration of iterative processes in disordered systems. J Stat Phys. (1988) 52:747–73. doi: 10.1007/BF01019728
29. Linstrom P, Mallard W (eds.). NIST Chemistry WebBook, NIST Standard Reference Database Number 69. Gaithersburg, MD: National Institute of Standards and Technology (2017).
30. Zeppieri S, Rodríguez J, López de Ramos A. Interfacial tension of alkane + water systems. J Chem Eng Data (2001) 46:1086–8. doi: 10.1021/je000245r
31. Måløy KJ, Feder J, Jøssang T. Viscous fingering fractals in porous media. Phys Rev Lett. (1985) 55:2688. doi: 10.1103/PhysRevLett.55.2688
32. Tallakstad KT, Knudsen HA, Ramstad T, Løvoll G, Måløy KJ, Toussaint R, et al. Steady-state two-phase flow in porous media: statistics and transport properties. Phys Rev Lett. (2009) 102:074502. doi: 10.1103/PhysRevLett.102.074502
Keywords: porous media, two-phase flow, pore network model, numerical methods, time integration, stability, low capillary number
Citation: Gjennestad MA, Vassvik M, Kjelstrup S and Hansen A (2018) Stable and Efficient Time Integration of a Dynamic Pore Network Model for Two-Phase Flow in Porous Media. Front. Phys. 6:56. doi: 10.3389/fphy.2018.00056
Received: 19 January 2018; Accepted: 17 May 2018;
Published: 13 June 2018.
Edited by:
Romain Teyssier, Universität Zürich, SwitzerlandReviewed by:
Daniele Chiappini, Università degli Studi Niccolò Cusano, ItalyChristian F. Klingenberg, Universität Würzburg, Germany
Copyright © 2018 Gjennestad, Vassvik, Kjelstrup and Hansen. This is an open-access article distributed under the terms of the Creative Commons Attribution License (CC BY). The use, distribution or reproduction in other forums is permitted, provided the original author(s) and the copyright owner are credited and that the original publication in this journal is cited, in accordance with accepted academic practice. No use, distribution or reproduction is permitted which does not comply with these terms.
*Correspondence: Magnus Aa. Gjennestad, bWFnbnVzQGFhc2hhbW1lci5uZXQ=
 Magnus Aa. Gjennestad
 Morten Vassvik
 Signe Kjelstrup
 Alex Hansen