 Wendy A. McDougald
 Richard Collins
 Mark Green3
 Adriana A. S. Tavares
95% of researchers rate our articles as excellent or good
Learn more about the work of our research integrity team to safeguard the quality of each article we publish.
Find out more
ORIGINAL RESEARCH article
Front. Phys. , 13 October 2017
Sec. Medical Physics and Imaging
Volume 5 - 2017 | https://doi.org/10.3389/fphy.2017.00050
This article is part of the Research Topic Multimodality Molecular Imaging View all 8 articles
Obtaining accurate quantitative measurements in preclinical Positron Emission Tomography/Computed Tomography (PET/CT) imaging is of paramount importance in biomedical research and helps supporting efficient translation of preclinical results to the clinic. The purpose of this study was two-fold: (1) to investigate the effects of different CT acquisition protocols on PET/CT image quality and data quantification; and (2) to evaluate the absorbed dose associated with varying CT parameters.
Methods: An air/water quality control CT phantom, tissue equivalent material phantom, an in-house 3D printed phantom and an image quality PET/CT phantom were imaged using a Mediso nanoPET/CT scanner. Collected data was analyzed using PMOD software, VivoQuant software and National Electric Manufactures Association (NEMA) software implemented by Mediso. Measured Hounsfield Unit (HU) in collected CT images were compared to the known HU values and image noise was quantified. PET recovery coefficients (RC), uniformity and quantitative bias were also measured.
Results: Only less than 2 and 1% of CT acquisition protocols yielded water HU values < −80 and air HU values < −840, respectively. Four out of 11 CT protocols resulted in more than 100 mGy absorbed dose. Different CT protocols did not impact PET uniformity and RC, and resulted in <4% overall bias relative to expected radioactive concentration.
Conclusion: Preclinical CT protocols with increased exposure times can result in high absorbed doses to the small animals. These should be avoided, as they do not contributed toward improved microPET/CT image quantitative accuracy and could limit longitudinal scanning of small animals.
The continued increased usage of Positron Emission Tomography/Computed Tomography (PET/CT) imaging in preclinical research has fostered efforts to develop protocol standardization and to evaluate optimal acquisition and reconstruction protocols. MicroPET/CT is a key non-invasive imaging tool in biomedical research, because it allows for reduction of the number of animals used, while simultaneously improving statistical power by allowing each animal to work as its own control in longitudinal studies, with consequential scientific benefit [1]. Moreover, diagnostic and therapeutic agents can be developed and tested on identical platforms, accelerating the translational process to humans [2]. Hence, efforts toward optimization of microPET/CT acquisition and reconstruction protocols will have a widespread impact across several biomedical fields, including: biomarker research [1, 3–5], and research in neurodegenerative diseases, cardiovascular diseases [6–10], metabolic diseases, musculoskeletal disorders and oncology [11–14].
Literature reporting clinical PET/CT protocol optimization, image co-registration and CT attenuation-based corrections of PET data is vast, e.g., [15–17]. Conversely, the majority of studies addressing microPET/CT optimization of protocols have been performed primarily using the manufacturers default protocol or slight variations thereof [18, 19]. Therefore, the impact of varying microCT parameters on microPET/CT data and preclinical research results is poorly defined and not fully understood. Furthermore, the significance of different microCT parameters on radiation exposure to small laboratory animals is scarcely described in the literature [20], in particular cumulative severity for longitudinal studies. Given that cumulative radiation doses can become increasingly toxic [21], accurate microCT absorbed dose measurements are essential when undertaking longitudinal preclinical research. This is most relevant and obvious when working with rodent tumor models in order to assure a clear distinction between diagnostic radiation imaging and radiotherapy [22].
The imaging community is currently undertaking efforts toward developing guidelines on microPET/CT acquisition and reconstruction methods [18, 23, 24]. While these guidelines admirably address animal handling and preparation, National Electric Manufactures Association (NEMA) testing and scanner quality control testing, there still remains a knowledge gap on evaluation and selection of preclinical PET/CT acquisition and reconstruction for routine use locally and across sites. Specifically, research aiming to identify the optimal protocols in order to improve not only image quality and quantification, but also the impact of absorbed microCT dose to small laboratory animals.
In this paper, we evaluate all the microCT acquisition protocols available on a microPET/CT scanner and how this impacts image quality and quantitation for the CT and PET components, as well as, the CT radiation exposure to small laboratory animals. This is done with the intent to optimize microCT imaging protocols for the avoidance of high radiation exposure while addressing any impact that varying microCT protocols has on microPET imaging.
All images were acquired and reconstructed on a second generation Mediso microPET/CT scanner (nanoPET/CT, Mediso, Hungary) at the Edinburgh Preclinical Imaging (EPI) Laboratory. This scanner is a two-ring microPET system with a flat screen microCT component (configuration based on previously described methods [25, 26]). The scanner's microCT x-ray source (tube and high voltage generator) is the Source-ray, Inc. (Ronkonkoma, NY, USA) SB-80-1K. Quality assurance was performed daily on the Mediso nanoPET/CT for both the PET and CT components. Daily quality assurance testing was also conducted on the Capintec CRC-25R (New Jersey, USA) dose calibrator. Mediso's scanner software generates the attenuation maps, per pixel value, from the CT in which HU values are converted to the linear attenuation coefficients for application to the PET data.
A microCT air/water phantom (CT QC Phantom, mouse size, Mediso, Hungary) was placed at the frontend of a mouse bed, positioned inside the bore at the isocenter, aligning sagittal, axial and coronal planes. MicroCT images were obtained by systematically varying the following parameters: binning [1:1 (1 × 1), 1:4 (2 × 2) and 1:16 (4 × 4)]; exposure time (170, 300, and 450 ms); tube voltage (35, 50, and 70 kVp); zoom (maximum field of view (FOV), medium zoom and maximum zoom); number of projections (360, 480, and 720 projections); and type of trajectory (semi-circular with full or half trajectory; or helical with pitches of 0.5, 1, and 1.5). Depending on the parameters used for binning and zoom, the matrices varied from 54 × 54 (maximum FOV, binned 1:16) to 556 × 556 (maximum zoom, binned 1:1).
Images were analyzed using PMOD image analysis software (PMOD Technologies, Zurich, Switzerland). A cylindrical volume of interest (VOI) was drawn at the center of the phantom away from boundary areas and used on all microCT images to quantify the mean Hounsfield unit (HU) values. Quantification accuracy was defined as bias between measured HU relative to known HU values for air and water. Measured standard deviation per VOI was used to evaluate image noise. The Tukey box and whisker plot was used to evaluate of HU values distribution, including spread, skewness and outliers for air and water HU values of 945 different microCT images. The box whiskers are calculated as 1.5x interquartile. Mild outliers (M, Equation 1) and extreme outliers (E, Equation 2) are calculated as follows:
where, q1, q3, and qi represent the 1st quartile, 3rd quartile and the interquartile, respectively.
A subset of 11 microCT acquisition protocols were selected for further analysis with the microCT Model-91 Tissue Equivalent Material (TEM) phantom, (Computerized Imaging Reference Systems, Inc. (CIRS), VA, USA). This is a water-filled phantom with polymer materials representing lung, muscle, adipose tissue, and hydroxyapatite rod compositions with varying densities aiming to mimic bone tissue. The subset of 11 microCT protocols selected for further analysis was based on: maximum and minimum measured HU bias relative to expected HU in air/water phantom; maximum and minimum image noise in air/water phantom; predicted maximum and minimum absorbed dose (based on total X-ray tube energizing time per protocol) and two default protocols routinely used in the EPI lab. The CT parameters are labeled in and will be referred to throughout this paper as indicated in Table 1. For example, protocol 1 is labeled “low dose” to reflect the low amount of ionized radiation being emitted for the duration of the scan; another example, protocol 3 is considered “worst water” base on the calculated bias between expected and measured HU values. These labels were added to each scan method for ease of reading this study's findings.
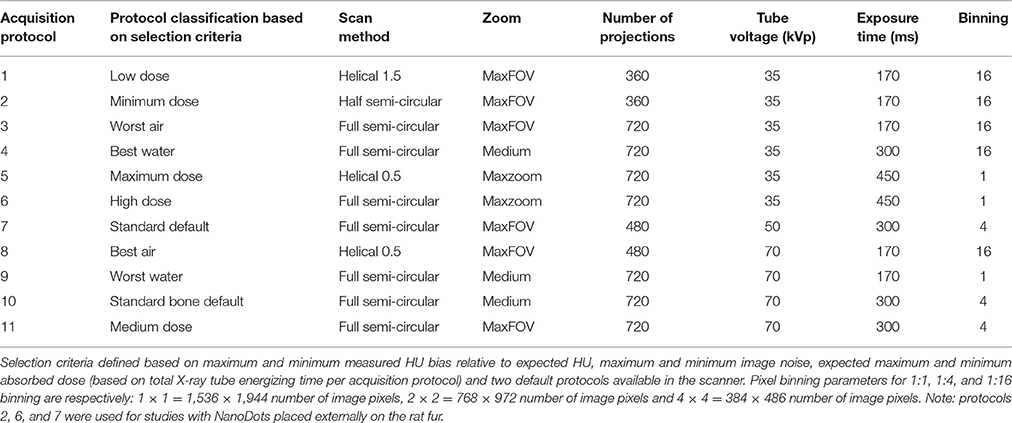
Table 1. List of selected microCT acquisition protocols for evaluation of absorbed doses and TEM imaging outcomes.
The TEM phantom was positioned as described above for the air/water phantom. A VOI template was used for analysis of all CT images. This template included 11 different cylindrical VOIs, each placed in the center of the tissue rod and away from boundaries. VOI results were extracted for analysis using PMOD software. Standard deviation was used for evaluation of image noise. Measured HU values for different TEM rods were compared with the accepted HU range for a given TEM per the literature [27].
A 3D-printed rat phantom prototype (Supplementary Figure 1) was developed and scanned using 11 different acquisition protocols (Table 1) for evaluation of microCT absorbed doses. A Scheduled 1 killed adult male Sprague-Dawley rat was also scanned using the same acquisition protocols.
An ionization chamber probe (detection range 100 nGy-516 Gy, Radcal, California, USA) was inserted into the 3D-printed rat phantom's abdomen for real-time measurement of the absorbed doses from 11 different microCT protocols. For comparison and validation, lithium fluoride (TLDs) dosimeters (NanoDots®, Landauer, Oxford, UK) were surgically placed inside the rat abdomen to estimate deep tissue absorbed doses and three additional TLDs were placed externally on the rat fur to estimate surface/skin absorbed doses. The scanning protocols chosen for external placement of the dosimeters were those deemed to yield the lowest and highest absorbed doses, based on the ion chamber readings, and the standard scanner protocol (Table 1). In addition, for comparison six NanoDots were inserted in the 3D-printed rat phantom (protocols: 2, 4, 6, 7, 8, and 11). Reading of the NanoDots was outsourced to Landauer, Oxford, UK.
The microPET/CT NEMA phantom (NEMA PET IQ Phantom, Mediso, Hungary) was filled with 22 mL of distilled water containing 18F-Sodium Fluoride (6.63 ± 3.7 MBq, mean ± standard deviation, n = 3).
The phantom was placed in the mouse bed and was scanned using a whole-body PET protocol over 30 min with 1:5 coincidence 3D list mode. At the end of the microPET protocol, 11 different microCT images were acquired (as per protocols in Table 1). CT images were used for generation of attenuation maps. CT protocol 5 was scanned immediately post-microPET scanning (hot phantom) and then 7 h later post-microPET scanning (cold phantom). For statistical analysis housekeeping and graphing the second scanning (cold phantom) was labeled protocol 12.
Binary linear attenuation correction maps generated from the microCT data were extracted for all protocols using the Mediso Nucline software. NEMA software implemented by Mediso was used in the quantification of the microPET image quality, including; uniformity, recovery coefficient (RC) and spill over ratio (SOR). Quantitative bias was determined as scanner measured radioactive concentration determined using VivoQuant whole FOV analysis (VivoQuant, InviCRO, Boston, MA, USA) relative to dose calibrator measured radioactive concentration. PET image horizontal and vertical profiles (H-profile and V-profile, respectively) were obtained using PMOD image profile tool.
Of the 945 acquired images, measured HU outliers in air were within a 20% difference from the mean and <191.5 HU absolute difference from conventional −1000 HU value for air (Figure 1A). Less than 2% of microCT protocols yielded out of range (< −80HU) HU values in air. Water HU outliers, though not as many compared with air HU dataset, were 98% difference from the mean and displayed <155 HU absolute difference compared with conventional value for water of 0 HU (Figure 1B). Representative CT images collected with protocols yielding results based on the measured greatest and least bias relative to expected HU (defined as worst/best air or water) vs. standard protocol are shown in Figure 2.
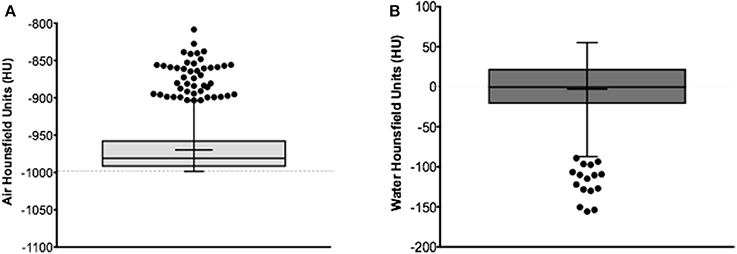
Figure 1. Measured HU values in air (A) and water (B) using the microCT air/water phantom. Median based Tukey plot displaying measured HU for the entire set of 945 acquired microCT images. Supplementary Table 1 displays the Turkey box plot mean, median, minimum, maximum, whiskers and quartiles values.
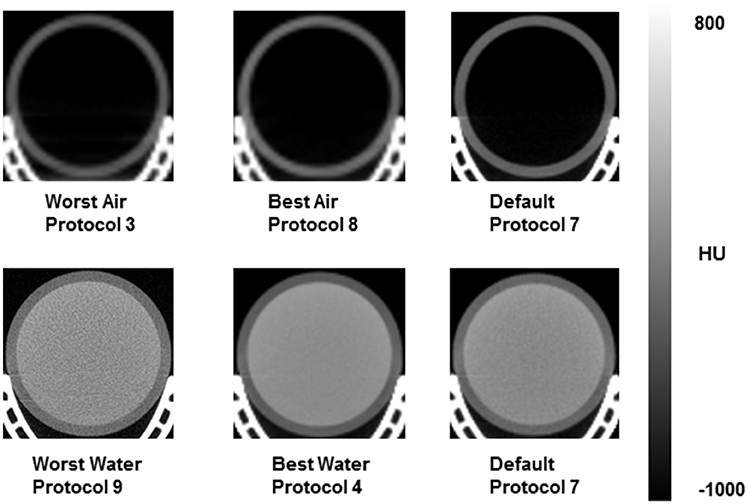
Figure 2. Representative microCT image sections for scanning protocols yielding best/worst results based on measured HU values in air and water, and standard vendor default protocol.
The HUs measured with the TEM phantom showed high coefficients of variance and spread of outcomes for different TEM rods (Tables 2, 3). The greatest difference for measured mean HU for the lung, adipose and muscle rods was 17% (low dose protocol 1 vs. high dose protocol 6), 56% (minimum dose protocol 2 vs. best air protocol 8) and 420% (low dose protocol 1 vs. maximum dose protocol 5), respectively. Greatest differences for measured mean HU for 0 mg/mL, 50 mg/mL, 250 mg/mL and 750 mg/L hydroxyapatite were 63% (medium dose protocol 2 vs. best air protocol 8), 111% (low dose protocol 1 vs. best water protocol 4), 55% (best water protocol 4 vs. medium dose protocol 11) and 60% (best water protocol 4 vs. best air protocol 8), respectively. Overall, TEM image quality degraded as scanner dose decreased (Figure 3).
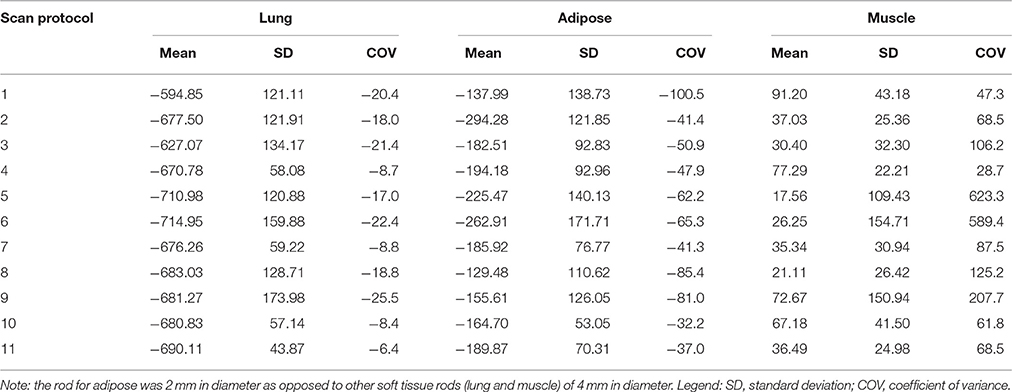
Table 2. Measured HU values for lung, adipose and muscle rods in the TEM phantom.
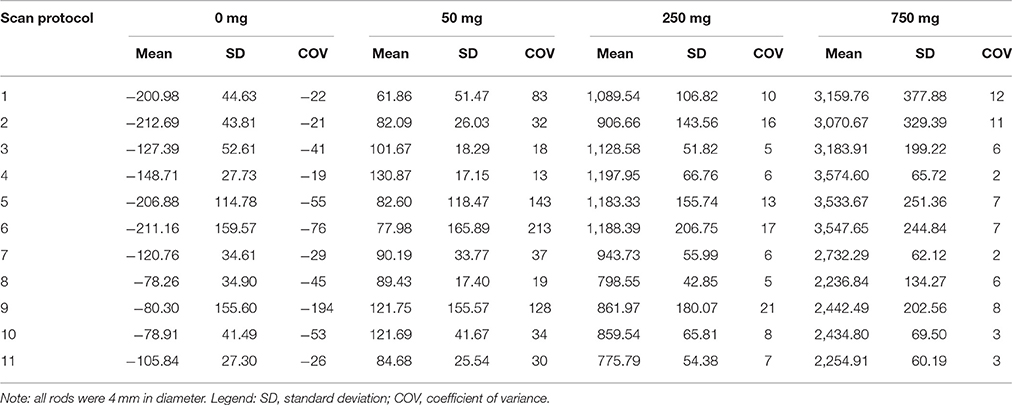
Table 3. Measured HU values for 0, 50, 250, 750 mg/ml hydroxyapatite rods in the TEM phantom.
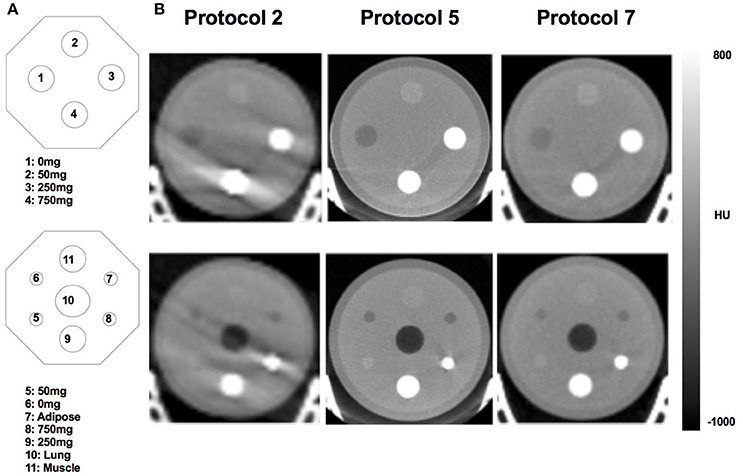
Figure 3. Schematics (A) and correspondent microCT images (B) of the TEM phantom used to quantify HU values of different TEM rods. The microCT images represent scanning protocols classified as low dose (Protocol 2) and high dose (Protocol 5) and the standard vendor default (Protocol 7). 0 mg = 0 mg/mL hydroxyapatite; 50 mg = 50 mg/mL hydroxyapatite; 250 mg = 250 mg/mL hydroxyapatite; 750 mg = 750 mg/mL hydroxyapatite.
Four out of 11microCT protocols resulted in >100 mGy absorbed dose (Figure 4A). As expected, absorbed dose was linearly dependent on total scan duration (Supplementary Figure 2). Measured absorbed doses at surface/skin were on average 87% higher than deep tissue absorbed dose (Figure 4A) with highest difference measured for protocol 6 (externally placed NanoDots received a dose 138% higher than internally placed NanoDots).
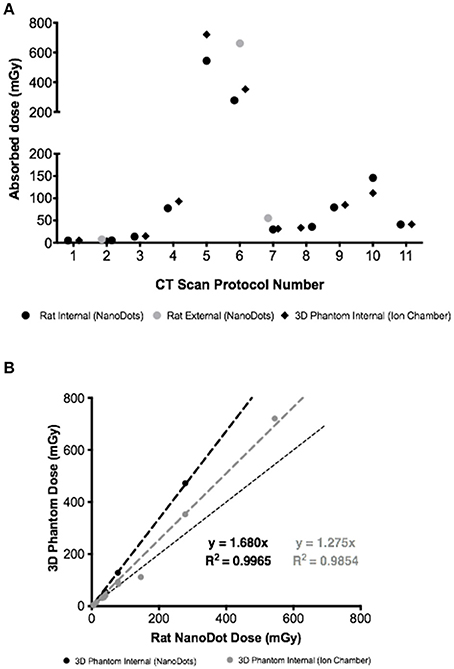
Figure 4. (A) Absorbed doses measured using three different approaches (NanoDots and Ion chamber) and eleven different scanning protocols. (B) Correlation between NanoDots absorbed doses measured in the rat with NanoDot and ion chamber readings from 3D rat phantom.
A strong correlation was measured across different methods used to quantify absorbed dose, albeit overestimations were observed when comparing the NanoDots readings in the rat carcass with 3D-printed rat phantom readings (Figure 4B).
The microCT attenuation correction (AC) maps used for reconstruction of the microPET data are displayed in Figure 5. These binary maps showed differences in air/water segmentation of acquired microCT images. Low dose CT (protocol 2) yielded the worst segmentation of all AC maps. CT protocols 5 and 6 also performed poorly, regardless of maximum and high dose delivered, respectively.
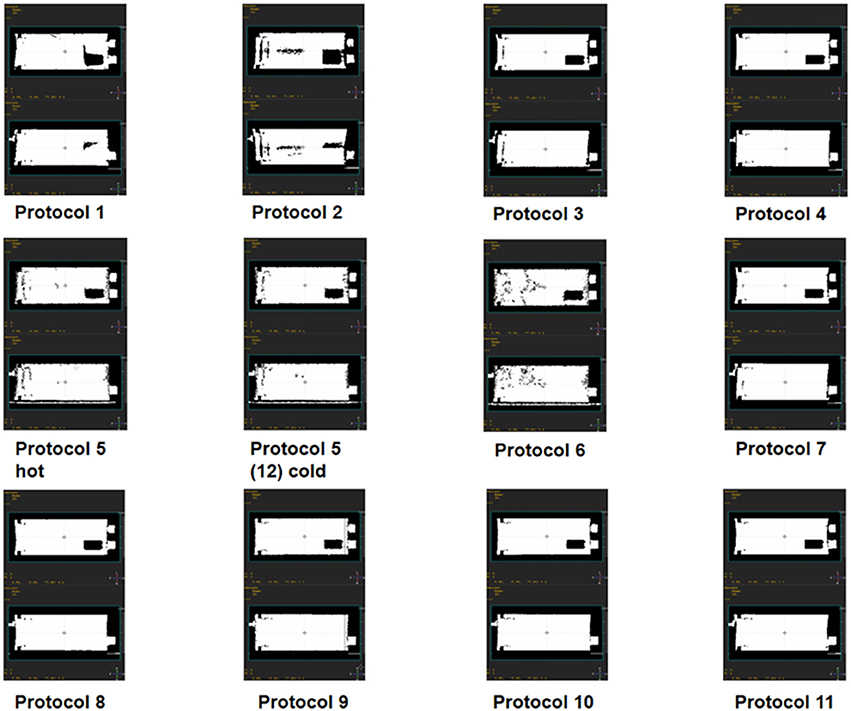
Figure 5. Binary attenuation maps for all microCT acquisition protocols. Each attenuation map includes top and side view sections at phantom isocenter for different microCT scans used to reconstruct a single microPET scan.
Despite differences in CT-based AC maps, similar microPET vertical and horizontal profiles were measured (V-profile and H-profile, respectively, Figure 6). Uniformity analysis using NEMA testing also showed similar values across microPET reconstructions. Measured uniformity values were well within acceptance tolerance of <15% (ranging between 9.67 and 10.23%). Quantitative bias analysis demonstrated that the measured activity in the IQ PET phantom was consistently minimally overestimated (average 4%) relative to dose-calibrator, though well within 10%. PET activity quantification with CT protocol 5 compared to itself after the activity in the IQ PET phantom decayed by 3.5 half-lives (labeled as protocol 12) showed an underestimation of 9%. The RCs were consistently overestimated as the cylinder size increased (values > 1) regardless of CT protocol used for PET reconstruction (Figure 7). The SOR values were well within the quality control acceptable values of <0.15 for air and water, varying between 0.08 and 0.09 across all CT protocols investigated for PET data reconstruction.
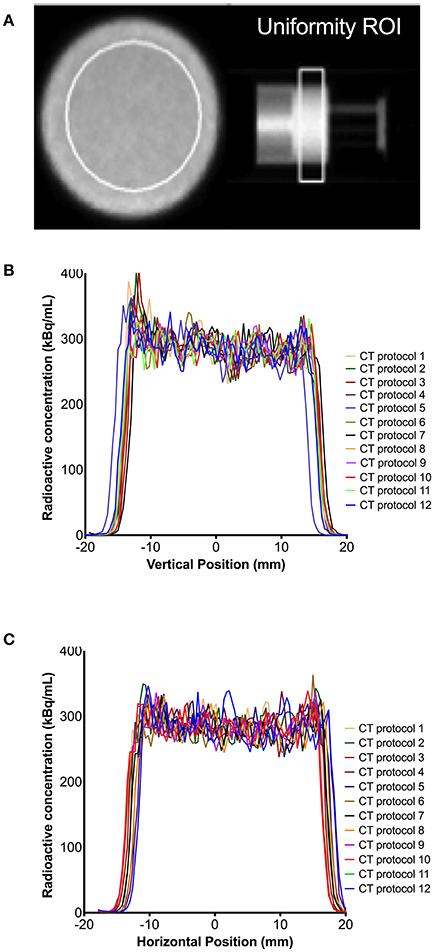
Figure 6. Uniformity of microPET data reconstructed using different microCT protocols. (A) Phantom uniformity chamber with region of interest (ROI); and correspondent vertical profile (B) and horizontal profile (C) at that image slice.
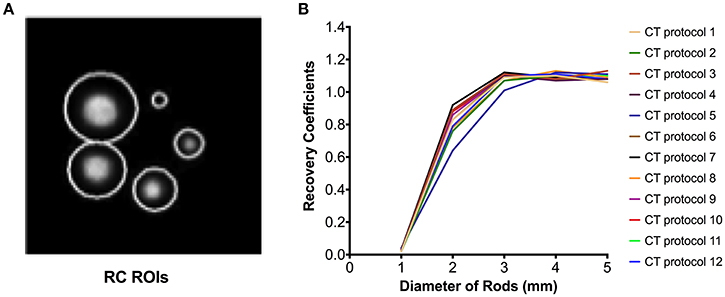
Figure 7. Recovery coefficients (RC) of microPET data reconstructed using different microCT protocols. (A) Phantom cylinder chamber with regions of interest (ROIs) and correspondent RC profiles (B).
CT acquisition protocols available on the Mediso nanoPET/CT scanner were evaluated; and the impact each protocol had on image quality, quantitation and the CT radiation exposure to small laboratory animals was assessed. Additionally, the impact of different microCT protocols on microPET reconstructed data was investigated.
Using the air/water phantom, a wide spread of measured HUs was observed, depending on the acquisition protocol used. This informed on the best and worst microCT protocols based on bias and image noise. Based on collected data, protocol 4 provided a good compromise between air and water quantification and image noise, based on HU bias. This protocol also resulted in low levels of noise using the TEM phantom, but delivered a relatively high absorbed dose of about 100 mGy. In comparison with the default settings (i.e., protocol 7), protocol 4 performed marginally better in air, water, muscle and low density bone; but resulted in higher absorbed dose. These differences are likely due to scanning duration being higher for protocol 4 compared with 7, consequence of higher number of projections (480 vs. 720 projections); distance of x-ray source relative to object (medium zoom and maximum FOV) and differences in voltage where high voltage (protocol 7) performed better than low voltage (protocol 4) in high density tissues, such as bone. Protocols 3 and 9 performed worst in terms of bias and image noise. Notably, protocol 3 resulted in low absorbed doses (approximately 15 mGy), while protocol 9 yielded relatively high absorbed doses (about 85 mGy). The highest absorbed dose was measured for protocol 5 (about 700 mGy) and the lowest was measured for protocol 2 (about 4 mGy). Although these values are well below therapeutic thresholds for rodents x-ray irradiation (typically > 6 Gy), the appearance of chromosomal aberrations in mammals has been reported with doses of 250–300 mGy [28–30].
Using computational simulation, Taschereau et al. and Boone et al. investigated the effects microCT parameters on absorbed doses [31, 32]. They predicted that for a whole body scan, the dose could vary between 80 and 133 mGy. Recently, Vande Velde et al. [33], using a SkyScan Bruker microCT scanner (parameters: 50 kVp and 120 ms; 50 kVp and 450 ms) and adult mice, reported absence of radiation induced lung damage even at a high dose protocol of 450 ms, despite measured skin doses as high as 1,104 mGy and lung doses of 813 mGy. They suggested that high dose microCT is safe for longitudinal lung studies, but recognized the current limited understanding among the scientific community on the impact of high absorbed doses in small animal longitudinal studies. Unfortunately this study didn't report measures of image quality or quantitative bias, which would have assisted in establishing whether high dose scans effectively, translate into high quality and quantitatively more accurate scans. In 2011, Kersemans et al. reported DNA damage as a result of high absorbed doses CT scanning of >150 mGy. They also reported absence of damaging effects when using low dose CT protocol (8.3 mGy), without compromising image quality. Notwithstanding, the impact high dose CT has on longitudinal experimental results remains controversial. Studies often report opposing findings from no effects regarding dose delivered to tumors during longitudinal studies to results indicating high doses can induce tumor inhibition [19, 20, 34–36]. Using a Mediso nanoPET/CT scanner, we found that for both the air/water and the TEM phantoms, decreasing CT dose resulted in visual image quality degradation and high noise, but had a relatively minimal impact on HU quantification, while adversely increasing small animal absorbed dose. Furthermore, this highlights the importance of assessing the trade-off between image resolution and absorbed dose per application and scanning platform. This current work also demonstrated that combinations of microCT parameters, not simply exposure time or tube voltage, but also scanner trajectory, impacted the absorbed dose. This new data can help informing future scanner developments.
Here we reported the use of a prototype 3D-printed phantom for absorbed dose measurements and compared the ionization chamber results with NanoDots. Collected data showed strong correlations with the absorbed dose measured using NanoDots in a rat cadaver, albeit biased by 4–27%. Bias in commercial phantom materials can also be observed, therefore our phantom results provide encouraging proof of concept data for further development of the prototype model with improved printing materials and polymers. Ultimately, the development of 3D-printed phantoms has potential for replacement of the use of animals for preclinical PET/CT protocol development.
Although different microCT acquisition protocols resulted in visually different attenuation maps, this negligibly impacted microPET image uniformity, RC, SOR and quantitative accuracy. Attenuation correction errors in small animal PET imaging are likely minimal, which may explain the obtained results. The 9% average measured difference for protocol 5 between microPET images reconstructed when the PET phantom was radioactive vs. non-radioactive (hot/cold phantom) could be due to the scatter correction used or count rate. This data can help with deciding protocol sequence (i.e., PET first then CT or vice-versa) when conducting dynamic PET/CT imaging. Moreover knowing this bias can support potential data corrections of PET data for CT attenuation map bias.
The measured RCs were consistently overestimated (average 1.12), suggesting overcorrection during the process of PET image reconstruction using the iterative proprietary default methods implemented in this dual-ring PET/CT system. Previous microPET/CT studies have reported RC values > 1.0 in the 5 mm cylinder. Using the NEMA NU 4-2008 methodology, a TriFoil system RC for the 5 mm cylinder was 1.02 RC [37]. RCs of 0.93 and 0.99 have been reported for the Siemens Iveon [38] and the first generation Mediso nanoPET/CT scanners [25], respectively. Here we report, for the first time, the RCs for the new Mediso nanoPET/CT system with two-ring configuration vs. first single ring systems [25], which could explain differences in measured RCs (1.12 vs. 0.99). However, RCs can also vary depending on the reconstruction algorithm applied and the radionuclide used for testing [23]. This data supports further development and improvement of available reconstruction tools.
This seminal work conducted on a single PET/CT scanner platform clearly demonstrates the importance of assessing available parameters for image acquisition. It provides valuable information for the community of imagers using the Mediso PET/CT scanning platforms, as well as scanner developers, and highlights the importance of extending this analysis to other platforms.
Protocols with increased CT scanning durations, consequently leading to an increase in small animal absorbed doses from X-rays, do not directly translate onto improved image noise nor impacts onto measured HUs. These findings can be particularly pertinent information when conducting longitudinal microPET/CT studies. Different CT protocols minimally impact PET data quantification. Our results support the need to investigate imaging outcomes from different protocols and scanners prior to selection of PET/CT methods for routine use, in order to avoid quantitative spurious comparisons and minimize radiation exposure to small laboratory animals.
This study was carried out in accordance with the recommendations of the Home Office under the Animals (Scientific Procedures) Act 1986 and the local University of Edinburgh animal ethics committee. The protocol was approved by the local University of Edinburgh animal ethics committee.
WM collected all data, conducted data analysis and drafted the manuscript. AT assisted in the interpretation of the data and the revising of the manuscript. RC assisted in the design, development and printing of the 3D-printed rat phantom prototype. MG assisted in the collection and measurements of the ion chamber microCT data. All authors participated in the conception of the study and design. All authors read and approved the final manuscript.
This work was funded by the school of Biomedical Sciences, University of Edinburgh. WM is funded by the NC3Rs (studentship grant NC/P00170X/1) and AT is funded by the British Heart Foundation (RG/16/10/32375). The British Heart Foundation is greatly acknowledge for providing funding toward establishment of the preclinical PET/CT laboratory (RE/13/3/30183). The authors thank the radiochemistry team within the Edinburgh Imaging Queen's Medical Research Institute (QMRI) Facility for their efforts to supply the radiotracers used in this study.
The authors declare that the research was conducted in the absence of any commercial or financial relationships that could be construed as a potential conflict of interest.
The reviewer FH and handling Editor declared their shared affiliation.
The Supplementary Material for this article can be found online at: https://www.frontiersin.org/articles/10.3389/fphy.2017.00050/full#supplementary-material
1. Koba W, Jelicks LA and Fine EJ. MicroPET/SPECT/CT imaging of small animal models of disease. Am J Pathol. (2013) 182:319–24. doi: 10.1016/j.ajpath.2012.09.025
2. Massoud TF and Gambhir SS. Molecular imaging in living subjects: seeing fundamental biological processes in a new light. Genes Dev. (2003) 17:545–80. doi: 10.1101/gad.1047403
3. Haylock AK, Spiegelberg D, Mortensen AC, Selvaraju RK, Nilvebrant J, Eriksson O, et al. Evaluation of a novel type of imaging probe based on a recombinant bivalent mini-antibody construct for detection of CD44v6-expressing squamous cell carcinoma. Int J Oncol. (2016) 48:461–70. doi: 10.3892/ijo.2015.3290
4. Fodero-Tavoletti MT, Okamura N, Furumoto S, Mulligan RS, Connor AR, McLean CA, et al. 18F-THK523: a novel in vivo tau imaging ligand for Alzheimer's disease. Brain (2011) 134:1089–100. doi: 10.1093/brain/awr038
5. Zhang C, Pan J, Lin K-S, Dude I, Lau J, Merkens H, et al. Improved 68Ga-labelled truncated peptides targeting the neuropeptide Y1 receptor for cancer imaging by positron emission tomography. J Nucl Med. (2016) 57:1160. doi: 10.1021/acs.molpharmaceut.6b00464
6. Chapman SE, Diener JM, Sasser TA, Correcher C, González AJ, Avermaete TV, et al. Dual tracer imaging of SPECT and PET probes in living mice using a sequential protocol. Am J Nucl Med Mol Imaging. (2012) 2:405–14. Available online at: www.ajnmmi.us.
7. Manook A, Yousefi BH, Willuweit A, Platzer S, Reder S, Voss A, et al. Small-animal PET imaging of amyloid-beta plaques with [11c]PiB and its multi-modal validation in an APP/PS1 mouse model of Alzheimer's disease. PLoS ONE (2012) 7:e31310. doi: 10.1371/journal.pone.0031310
8. Nie X, Laforest R, Elvington A, Randolph GJ, Zheng J, Voller T, et al. PET/MRI of hypoxic atherosclerosis using 64Cu-ATSM in a rabbit model. J Nucl Med. (2016) 57:2006–11. doi: 10.2967/jnumed.116.172544
9. Hartwig H, Silvestre-Roig C, Hendrikse J, Beckers L, Paulin N, Van der Heiden K, et al. Atherosclerotic plaque destabilization in Mice: a comparative study. PLoS ONE (2015) 10:e0141019. doi: 10.1371/journal.pone.0141019
10. Saraste A, Laitinen I, Weidl E, Wildgruber M, Weber AW, Nekolla SG, et al. Diet intervention reduces uptake of 3 integrin-targeted PET tracer 18F-galacto-RGD in mouse atherosclerotic plaques. J Nucl Cardiol. (2012) 19:775–84. doi: 10.1007/s12350-012-9554-5
11. Tremoleda JL and Kerton A and Gsell W. Anaesthesia and physiological monitoring during in vivo imaging of laboratory rodents: considerations on experimental outcomes and animal welfare. EJNMMI Res. (2012) 2:44. doi: 10.1186/2191-219X-2-44
12. McGirr R, Hu S, Yee SP, Kovacs MS and Lee TY and Dhanvantari S. Towards PET imaging of intact pancreatic beta cell mass: a transgenic strategy. Mol Imaging Biol. (2011) 13:962–72. doi: 10.1007/s11307-010-0435-5
13. Fushiki H, Miyoshi S, Noda A, Murakami Y, Sasaki H, Jitsuoka M, et al. Pre-clinical validation of orthotopically-implanted pulmonary tumor by imaging with 18f-fluorothymidine-positron emission tomography/computed tomography. Anticancer Res. (2013) 33:4741–9. Available online at: http://ar.iiarjournals.org/content/33/11/4741.abstract
14. Palner M, Shen B, Jeon J, Lin J and Chin FT and Rao J. Preclinical kinetic analysis of the caspase-3/7 PET tracer 18F-C-SNAT: quantifying the changes in blood flow and tumor retention after chemotherapy. J Nucl Med. (2015) 56:1415–21. doi: 10.2967/jnumed.115.155259
15. Kinahan PE, Townsend DW, Beyer T and Sashin D. Attenuation correction for a combined 3D PET/CT scanner. Med Phys Med Phys Med Phys Phys. (1998) 25:2046–53. doi: 10.1118/1.4930251
16. Burger C, Goerres G, Schoenes S, Buck A, Lonn A and Von Schulthess G. PET attenuation coefficients from CT images: experimental evaluation of the transformation of CT into PET 511-keV attenuation coefficients. Eur J Nucl Med. (2002) 29:922–27. doi: 10.1007/s00259-002-0796-3
17. Xia T, Alessio AM, Man B De. Manjeshwar R, Asma E and Kinahan PE. Ultra-low dose CT attenuation correction for PET/CT. Phys Med Biol. (2012) 57:309–28. doi: 10.1088/0031-9155/57/2/309
18. Osborne DR, Kuntner C, Berr S and Stout D. Guidance for efficient small animal imaging quality control. Mol Imaging Biol. (2017) 19:485–98. doi: 10.1007/s11307-016-1012-3
19. Kersemans V, Thompson J, Cornelissen B, Woodcock M, Allen PD, Buls N, et al. Micro-CT for anatomic referencing in PET and SPECT: radiation dose, biologic damage, and image quality. J Nucl Med. (2011) 52:1827–33. doi: 10.2967/jnumed.111.089151
20. Willekens I, Buls N, Lahoutte T, Baeyens L, Vanhove C, Caveliers V, et al. Evaluation of the radiation dose in micro-CT with optimization of the scan protocol. Contrast Media Mol Imaging. (2010) 5:201–7. doi: 10.1002/cmmi.394
21. Wagner LK, Eifel PJ and Geise RA. Potential biological effects following high X-ray dose interventional procedures. J Vasc Interv Radiol. (1994) 5:71–84. doi: 10.1016/S1051-0443(94)71456-1
22. Perks JR, Lucero S, Monjazeb AM and Li JJ. Anthropomorphic phantoms for confirmation of linear accelerator-based small animal irradiation. Cureus (2015) 7:e254. doi: 10.7759/cureus.254
23. Vanhove C, Bankstahl JP, Krämer SD, Visser E, Belcari N, Vandenberghe S, et al. Accurate molecular imaging of small animals taking into account animal models, handling, anaesthesia, quality control and imaging system performance. EJNMMI Phys. (2015) 2:31. doi: 10.1186/s40658-015-0135-y
24. Kuntner C and Stout D. Quantitative preclinical PET imaging: opportunities and challenges. Front Phys. (2014) 2:1–12. doi: 10.3389/fphy.2014.00012
25. Szanda I, Mackewn J, Patay G, Major P, Sunassee K, Mullen GE, et al. National electrical manufacturers association NU-4 performance evaluation of the PET component of the NanoPET/CT preclinical PET/CT scanner. J Nucl Med. (2011) 52:1741–7. doi: 10.2967/jnumed.111.088260
26. Jakab G, Racz A, and Nagy K. High Quality Cone-beam CT Reconstruction on the GPU. (2017) Available online at: https://www.researchgate.net/publication/267774594
27. Schneider W, Bortfeld T and Schlegel W. Correlation between CT numbers and tissue parameters needed for Monte Carlo simulations of clinical dose distributions. Phys Med Biol. (2000) 45:459–78. doi: 10.1088/0031-9155/45/2/314
28. Appelbe OK, Zhang Q, Pelizzari CA, Weichselbaum RR and Kron SJ. Image-guided radiotherapy targets macromolecules through altering the tumor microenvironment. Mol Pharm. (2016) 13:3457–67. doi: 10.1021/acs.molpharmaceut.6b00465
29. Miyahara N, Kokubo T, Hara Y, Yamada A, Koike T and Arai Y. Evaluation of X-ray doses and their corresponding biological effects on experimental animals in cone-beam micro-CT scans (R-mCT2). Radiol Phys Technol. (2016) 9:60–8. doi: 10.1007/s12194-015-0334-1
30. Williams JP, Brown SL, Georges GE, Hauer-Jensen M, Hill RP, Huser AK, et al. Animal models for medical countermeasures to radiation exposure. Radiat. Res. (2010) 173:557–78. doi: 10.1667/RR1880.1
31. Taschereau R, Chow PL and Chatziioannou AF. Monte Carlo simulations of dose from microCT imaging procedures in a realistic mouse phantom. Med Phys. (2006) 33:216–24. doi: 10.1118/1.2148333
32. Boone JM, Velazquez O and Cherry SR. Small-animal X-ray dose from micro-CT. Mol Imaging. (2004) 3:149–58. doi: 10.1162/1535350042380326
33. Vande Velde G, De Langhe E, Poelmans J, Bruyndonckx P, d'Agostino E, Verbeken E, et al. Longitudinal in vivo micro-computed tomography of mouse lungs: no evidence for radiotoxicity. Am J Physiol Lung Cell Mol Physiol. (2015) 309:ajplung.00098.2015. doi: 10.1152/ajplung.00098.2015
34. Carlson SK, Classic KL, Bender CE and Russell SJ. Small animal absorbed radiation dose from serial micro-computed tomography imaging. Mol Imaging Biol. (2007) 9:78–82. doi: 10.1007/s11307-007-0080-9
35. Foster WK and Ford NL. Investigating the effect of longitudinal micro-CT imaging on tumour growth in mice. Phys Med Biol. (2011) 56:315–26. doi: 10.1088/0031-9155/56/2/002
36. Cavanaugh D, Johnson E, Price RE, Kurie J, Travis EL and Cody DD. In vivo respiratory-gated micro-CT imaging in small-animal oncology models. Mol Imaging. (2004) 3:55–62. doi: 10.1162/153535004773861723
37. Disselhorst JA, Brom M, Laverman P, Slump CH, Boerman OC, Oyen WJ, et al. Image-quality assessment for several positron emitters using the NEMA NU 4-2008 standards in the Siemens Inveon small-animal PET scanner. J Nucl Med. (2010) 51:610–7. doi: 10.2967/jnumed.109.068858
Keywords: preclinical PET/CT, hounsfield units, absorbed dose, recovery coefficient, attenuation coefficients
Citation: McDougald WA, Collins R, Green M and Tavares AAS (2017) High Dose MicroCT Does Not Contribute Toward Improved MicroPET/CT Image Quantitative Accuracy and Can Limit Longitudinal Scanning of Small Animals. Front. Phys. 5:50. doi: 10.3389/fphy.2017.00050
Received: 02 August 2017; Accepted: 28 September 2017;
Published: 13 October 2017.
Edited by:
Zhen Cheng, Stanford University, United StatesReviewed by:
Frezghi Habte, Stanford University, United StatesCopyright © 2017 McDougald, Collins, Green and Tavares. This is an open-access article distributed under the terms of the Creative Commons Attribution License (CC BY). The use, distribution or reproduction in other forums is permitted, provided the original author(s) or licensor are credited and that the original publication in this journal is cited, in accordance with accepted academic practice. No use, distribution or reproduction is permitted which does not comply with these terms.
*Correspondence: Wendy A. McDougald, czE1NzU1MzhAc21zLmVkLmFjLnVr
Disclaimer: All claims expressed in this article are solely those of the authors and do not necessarily represent those of their affiliated organizations, or those of the publisher, the editors and the reviewers. Any product that may be evaluated in this article or claim that may be made by its manufacturer is not guaranteed or endorsed by the publisher.
Research integrity at Frontiers
Learn more about the work of our research integrity team to safeguard the quality of each article we publish.