- 1Molecular Spectroscopy Group, Max Planck Institute for Polymer Research, Mainz, Germany
- 2Department of Chemistry, Tohoku University, Sendai, Japan
- 3Department of Chemical Engineering, University of Washington, Seattle, WA, USA
Insulin is a widely used peptide in protein research and it is utilized as a model peptide to understand the mechanics of fibril formation, which is believed to be the cause of diseases such as Alzheimer and Creutzfeld-Jakob syndrome. Insulin has been used as a model system due to its biomedical relevance, small size and relatively simple tertiary structure. The adsorption of insulin on a variety of surfaces has become the focus of numerous studies lately. These works have helped in elucidating the consequence of surface/protein hydrophilic/hydrophobic interaction in terms of protein refolding and aggregation. Unfortunately, such model surfaces differ significantly from physiological surfaces. Here we spectroscopically investigate the adsorption of insulin at lipid monolayers, to further our understanding of the interaction of insulin with biological surfaces. In particular we study the effect of minor mutations of insulin's primary amino acid sequence on its interaction with 1,2-Dipalmitoyl-sn-glycero-3-phosphoglycerol (DPPG) model lipid layers. We probe the structure of bovine and human insulin at the lipid/water interface using sum frequency generation spectroscopy (SFG). The SFG experiments are complemented with XPS analysis of Langmuir-Schaefer deposited lipid/insulin films. We find that bovine and human insulin, even though very similar in sequence, show a substantially different behavior when interacting with lipid films.
1. Introduction
The interaction of proteins with lipid membranes is a ubiquitous phenomenon in biology. Proteins interact with cell membranes for signaling purposes, for nutrition, cell division and many other critical processes [1]. Proteins can refold at membranes and eventually aggregate [2]. This occurrence is, if uncontrolled, undesired and is likely linked to the onset of a family of diseases known as amyloidosis [3].
Alzheimer's and Parkinson's syndromes and type 2 diabetes mellitus are well known examples. These diseases are induced by the formation of fibril in the brain and pancreas respectively. For example, in the case of Alzheimer's syndrome, the illness is associated to the denaturation and aggregation of the amyloid-β-protein (Aβ). The presence of Aβ aggregates has been discovered to be toxic to cultured neuronal cell, and to cause membrane depolarization [4]. Similarly, the Parkinson disease is associated with the formation of fibrils after α-synuclein protein denaturate, and aggregate in the so called Lewy bodies in the brain. Generally speaking, numerous proteins with varying size, shape and chemical composition are likely involved in amyloidosis [5]. While the amyloid-hypothesis is well studied and supported by the majority of the biomedical community, details regarding the underlying mechanism of fibril formation are still under debate [6, 7].
The complexity of proteins is itself a limiting factor in understanding the exact mechanisms by which amyloid formation occurs [3]. Therefore, the need of a model system to mimic the formation of amyloids has become prominent. Amongst others, insulin has gained popularity as model peptide for studying the fibril-formation problem. Insulin is a globular protein, with a relatively simple structure, and small size. It consists of 51 amino acids arranged in two chains (A and B chains). The secondary structure is mostly α−helical in the native form, and unfolding and aggregation can be controlled by changing protein solution concentration, pH or by adding divalent metal ions (such as Zn2+).
Moreover, insulin's primary sequence contains a so called amyloidogenic amino acid sequence at sites B11–B17: LVEALYL. This sequence has been shown to promote the formation of fibrils [8, 9]. Insulin fibrils formation is quite well studied and the role of the various insulin oligomeric forms has been clarified in bulk solutions. Sluzky et al. [10] have shown that only insulin monomers are involved in the formation of amyloids, and explained this observation with specific hydrophobic interactions between individual monomers.
Because of the lack of experimental techniques which are at the same time surface specific and sensitive to protein structure, only few studies have focused on the effect of surfaces and interfaces on the process of formation of insulin fibrils [11, 12]. Recent works have shown, that fibril formation can be initiated by the presence of lipid surfaces [13–15]. The interaction of insulin with biologically relevant lipid membranes surfaces has not been investigated yet.
In the present study, we aim at understanding the adsorption behavior of human and bovine insulin at DPPG lipid layers. In bulk solutions bovine and human insulin are known to aggregate on different time scales as reported by Brange et al. [16]. Both insulin variants are characterized by the same tertiary structure, however their primary sequences differ by 3 amino-acids (A8, A10, and B30). Despite the seemingly small difference in amino acid composition we report a significant difference in binding to the lipid layers. We probe the insulin/lipid interface using surface sensitive sum frequency generation (SFG) spectroscopy, which has previously been used to study proteins at interfaces [17, 18]. We employ SFG to compare the binding and aggregation state of human and bovine insulin at lipid monolayers.
2. Materials and Methods
2.1. Protein Solutions and Sample Preparation
Bovine insulin has been bought from Sigma Aldrich. Human insulin has been kindly provided by Sanofi GmbH (Frankfurt, Germany) Both bovine and human insulin are used without further purification. 0.7 mM (4 mg/ml) insulin solution at pH 4 have been prepared in D2O/HCl. The 1,2-dipalmitoyl-sn-glycero-3-(phospho-rac-1-glycerol) (DPPG) lipid was purchased from Avanti Polar Lipids Inc. (Alabama, AL), and used without further purification. The lipid is dissolved in a mixture (70:30 v/v) of chloroform and methanol to a total concentration of ~ 1.4 mM. The initial surface pressure was set between 20 and 25 mNm−1. A teflon trough is cleaned by successively rinsing it with dichloromethane, acetone and methanol. Finally the trough is rinsed with a copious amount of milli-Q water (~ 18.2 MΩ). Cleanness of the trough is checked by measuring SF spectra of pure D2O in the -CH stretching region, to ensure no contaminations are present in the trough before starting the experiment.
2.2. SFG Spectroscopy
SFG spectroscopy is a second order nonlinear spectroscopy method capable of providing infrared spectra of sub-monolayers of molecules at surfaces [19].
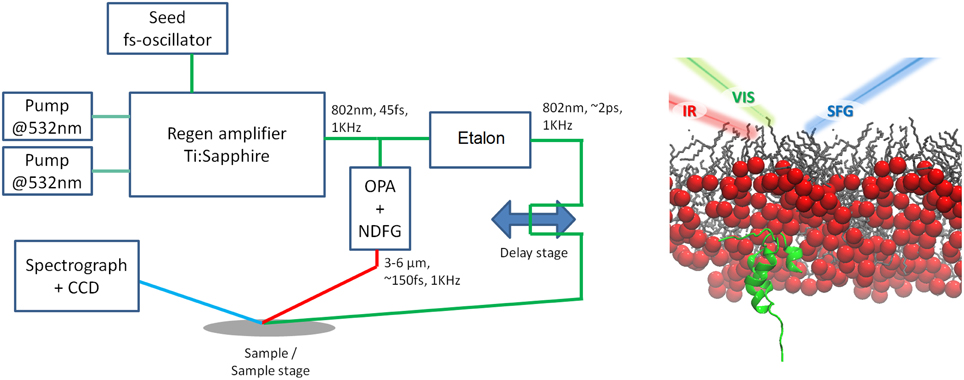
The femtosecond setup used here has been described elsewhere [11]. Briefly, a femtosecond pulse train at 800 nm wavelength (~ 45 fs, 1 kHz repetition rate) is generated by a Ti:Sapphire amplifier (Spitfire ACE, SpectraPhysics), seeded by a Ti:Sapphire oscillator (MaiTai, SpectraPhysics). One part is sent to an etalon (SLS optics), to obtain a picosecond visible beam with a spectral resolution of ~ 15 cm−1. The second part was used to pump an OPA (TOPAS-C, LightConversion) to generate broadband tunable IR light. The average power of the visible beam was 20 and 2 mW for the IR beam (at 6 μm). The visible beam is focused loosely with a 20 cm focal length lens at the air/water interface. The IR beam is tightly focused with a 5 cm focal length CaF2 lens. The two beams are temporally and spatially overlapped at the interface. The SF is then detected with a spectrograph and an intensified CCD camera (Newton EMCCD 971P-BV, Andor).
SFG intensity is proportional to the second order nonlinear susceptibility where χ(2) can be written as:
The polarization of all three beams can be controlled by a combination of a half waveplate and a polariser. The experimental stage was purged with nitrogen. The laser setup is shown in Figure 1-left. All spectra are collected using ssp polarization combination. The spectrograph was calibrated to the energy position of the 1730 cm−1 ester resonance of 1,2-Dipalmitoyl-sn-glycero-3-phosphoglycerol lipid monolayer at the air/D2O interface (see Figure 2). This lipid monolayer is characterized by the presence of a single peak at 1730 cm−1.

Figure 1. Left: Static SFG experimental setup. Right: sketch of SFG experiment. IR, visible and SF beam are shown respectively in red, green and blue.

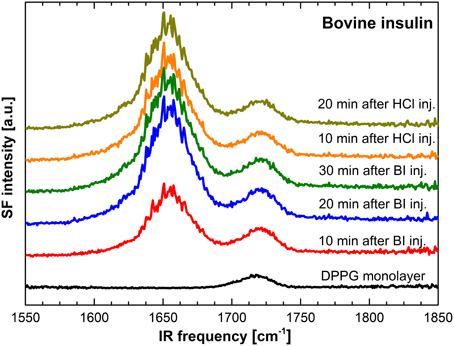
Figure 2. Spectra of bovine insulin at DPPG lipid monolayers. From bottom to top: only DPPG monolayer (black), spectra after injection of BI acquired at intervals of 10 min (red, blue, green), spectra after HCl injection at 10 min. intervals (orange, olive green).
Each spectrum is acquired for 10 min. The DPPG spectra are acquired allowing 10 min to the system to equilibrate. The first SF spectrum of insulin is acquired 10 min after injection. Afterwards, spectra are taken every 10 min.
2.3. X-ray Photoemission Spectroscopy
Langmuir-Schaefer deposition of lipid layers, and protein/lipid layers was performed using polystyrene coated gold surfaces. The substrates were prepared by evaporating first a 1.2 nm layer of Cr on glass slides, followed by evaporation of a 30 nm thick layer of gold. Surfaces prepared as such are afterwards spin coated with polystyrene (~ 50 nm) The air-water interface assembly was performed analogous to the SFG experiment.
XPS spectra are collected using a Kratos AXIS Ultra DLD instrument using a monochromatic Al Kα x-ray source. A survey spectrum is collected for each sample. High resolution spectra were collected for the N 1s, S 2p, C 1s and O 1s transitions. The spectra were analyzed using CasaXPS software.
3. Results
3.1. Bovine Insulin Adsorbed to DPPG
The interaction of bovine insulin with DPPG lipids was determined by SFG spectroscopy. The spectrum of the pure DPPG monolayer shows a peak at 1730 cm−1, confirming the presence of an ordered lipid monolayer [20]. Following injection of bovine insulin an additional feature in the amide I region at 1653 cm−1 becomes visible. This feature is commonly assigned to the α−helical domains of the insulin structure. This is a clear indication of an ordered insulin monomer layer at the lipid layer surface [11, 21]. The amide signal intensity increases going from 10 min assembly time to 20 min, but remains constant after that. This means that the system reaches equilibrium within 20 min or less.
pH changes can affect the aggregation of insulin and other proteins. To determine whether insulins packing at the DPPG surface is affected by pH we inject 100 μl of 120 mM HCl to lower the pH from 4 to 2. It has been shown that lowering the pH influences the relative monomer/dimer composition of the protein solution. At pH 2 the composition of bulk solution is mostly monomeric [22]. After the injection of HCl we did not record any spectral change nor any intensity change (see Figure 2).
Monomers are the only oligomeric form of insulin capable of aggregation, and a low pH should favor the formation of fibrils. Interestingly, our experimental data do not show any change in the recorded SF spectra at pH 2. Refolding and interfacial aggregation would significantly reduce the signal intensity and alter observed SFG spectra [11]. The constant signal indicates that BI bound to a lipid surface, unlike BI in solution forms a stable layer, and maintains its native fold even under low pH conditions.
3.2. Human Insulin/DPPG
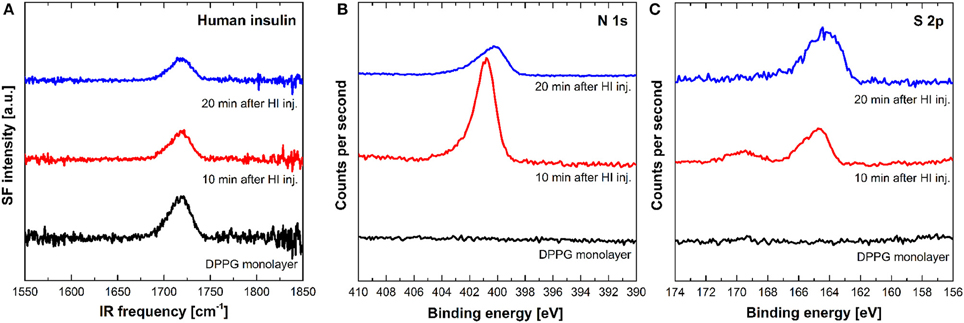
To study the effect of changes in the insulin sequence, we repeated the experiment with human insulin. In analogy to the experiments with bovine insulin, Figure 3 displays spectra of the DPPG monolayer before and after injection of HI into the subphase of the trough. The spectra recorded following the protein injection did not differ significantly from the pure DPPG monolayer signal - even after a total assembly time of 20 min. SFG is sensitive to the order and relative orientation of interfacial species. The loss of signal can therefore be explained either by absence of HI at the DPPG surface or a binding geometry which leads to signal cancelation [23]. To determine the amount of HI present at the DPPG surface, we perform an XPS analysis of the DPPG/HI films deposited onto gold surfaces using Langmuir-Schaefer method. We quantified the amount of HI by tracking the presence of sulfur (6 sulfur atoms are present in each insulin monomer) and nitrogen, which are both not present in DPPG.

Figure 3. (A) SF spectra of human insulin at DPPG lipid monolayers. (B) N 1s XPS spectra. (C) S 2p XPS spectra. From bottom to top: only DPPG monolayer (black), spectra after injection of BI acquired at intervals of 10 min (red, blue).
Figure 3 shows the XPS spectra before and after HI adsorption. The pure DPPG spectra did not show any detectable nitrogen or sulfur emissions. After HI is injected, clear sulfur and nitrogen signals are measured. This clearly shows a significant amount of HI is present at the DPPG layer, already after 10 min. It is worth noting that the intensity of the N 1s peak decreases after 20 min adsorption time. This counter intuitive observation might indicate that the protein layer undergoes structural changes following adsorption, which lead to a decrease of the surface density of HI, but needs to be investigated in more details. The S 2p spectra also change over time. Initially two different species related to disulfide and oxidized sulfur (at 168 and 162 eV respectively) are observed. After 20 min assembly time only, a single species related to disulfide bonds is visible. The initial, two-feature state could be explained by a temporary, heterogeneous adsorption state which then evolves into a more homogeneous film, most likely consisting of monomers.
Future experiments with dried lipid layer/protein samples may help elucidating the partial restructuring of HI in this particular condition. Most importantly, the XPS results show that HI is binding to the DPPG surface. At the same time, since the intensity of SFG depends on the order and symmetry of a protein layer, the lack of detectable SFG signal indicates human insulin forms interfacial structures which are very different from bovine insulin films.
4. Discussion
4.1. Bovine vs. Human Insulin: How the Amino Acid Sequence Affects Protein Binding
Bovine and human insulin differ by 3 amino acids sites: A8, A10, and B30.
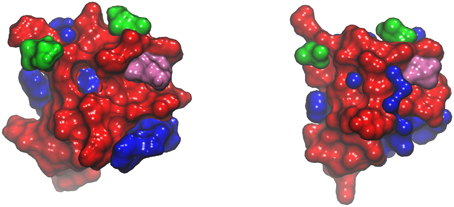
In Figure 4 we plot bovine and human insulin (.pdb identifiers 4BS3 and 2JV1 respectively) oriented in the same manner to highlight the position of residues A8 and B51.

Figure 4. Right: human insulin. Left: bovine insulin. Hydrophilic residues are shown in red. Hydrophobic residues are shown in blue. Residue A8 (top right) and B30 (top left) are shown in green. Residue A10 is shown in pink.
Brange et al. [16] and Brange [24] have described the role of amino acid A8 in the aggregation process of insulin. The side chain of this alanine/threonine site is exposed at the protein surface, and it has a strong influence on the formation of insulin aggregates. According to these studies, A8 plays an important role directing the assembly of insulin monomers during the formation of fibrils, via hydrophobic interactions. It has been shown that the formation of insulin fibrils occurs on different time scales for bovine and human insulin; BI aggregates are formed within 123 h, while HI aggregates within 474 h. This behavioral difference is likely caused by the different hydrophobicity of residue A8 (see Figure 4). The aggregation of insulin is in fact driven by hydrophobic interaction: the same hydrophobic interaction is also likely the driving force orienting insulin monomers at lipid surfaces. The DPPG model used in our experiment is negatively charged and insulin, on the other hand, is positively charged in the pH range used during the experiment. While the initial binding of insulin to the DPPG layer occurs via electrostatic interactions, it is likely that the proteins interfacial structure is also influenced by the exposure of hydrophobic patches within the protein to the hydrophobic core of the lipid layer.
A first scenario which can explain the observed differences of how bovine and human insulin bind to DPPG surfaces is that bovine insulin BI monomers form an ordered layer at the DPPG layer, likely with the α-helix in the B-chain parallel to the lipid surface [11], while HI binding results in a disordered interfacial layer. It is possible that differences in residue B30 located at the B-chain can play an important role for the structure of the two different insulin films. Amino acids at the end of the B-chain have a great impact on the solubility and aggregation of insulin. As an example, insulin glargine, which is an insulin analog containing two extra arginines at the end of the B-chain is significantly less soluble in solution at physiological pH and shows different aggregation patterns compare to others [25]. The greater hydrophobicity of bovine insulin, determined by the mutation of residues A8, A10, and B30, would allow stronger and more ordered binding. The SFG intensity depends on the order of proteins at interfaces and a disordered layer will not generate a detectable net signal. This would explain why no SFG is detected for HI while the presence of the protein could be verified by XPS. A second possible scenario is that human insulin films consist of dimers or oligomers at the lipid surface. Mauri et al. have predicted, that insulin dimers and other oligomers are SFG inactive because of the local symmetry within the proteins tertiary structure [11]. Based on works by Brange et al. it is unlikely that human insulin will aggregate more readily in solution than bovine insulin, it is likely that such an oligomerization would be initiated by the presence of the lipid interface [24]. Such surface induced oligomerization has been observed before [14, 18].
In summary, our experiments show that there are marked differences in the interaction of human and bovine insulin with DPPG model membranes. This underlines the sensitivity of the insulin aggregation behavior observed for the solution state is also observed at surfaces. Most importantly our findings show that great care has to be taken when using bovine insulin as a model system for insulin aggregation in humans. Interfacial behavior observed for bovine insulin can differ dramatically from the human analog.
Author Contributions
All authors have designed the experiment. SM and TW have written the manuscript, SM prepared the samples for XPS, RP and IR have performed the SF experiments, HL did XPS measurements and analysis. SM, RP, and IR contributed equally to this manuscript. All authors discussed the data, conclusions and proof read the manuscript.
Conflict of Interest Statement
The authors declare that the research was conducted in the absence of any commercial or financial relationships that could be construed as a potential conflict of interest.
Acknowledgments
SM and TW thank the Deutsche Forschungsgemeinschaft (WE4478/4-1) and European Union Marie Curie Program for support of this work (CIG grant #322124). This work is part of the research program of the Max Planck Society. HL and TW thank Paul Blom for support of this work. We acknowledge Sanofi GmbH (Frankfurt, Germany) for providing human insulin.
References
1. Cutrecasas P. Perturbation of the insulin receptor of isolated fat cells with proteolytic enzymes. Direct measurement of insulin-receptor interactions. J Biol Chem. (1971) 246:6522–31.
2. Gorbenko GP, Ioffe VM, Kinnunen PKJ. Binding of lysozyme to phospholipid bilayers: evidence for protein aggregation upon membrane association. Biophys J. (2007) 93:140–53. doi: 10.1529/biophysj.106.102749
3. Ross CA, Poirier MA. Protein aggregation and neurodegenerative disease. Nat Med. (2004) 10(Suppl.):S10–7. doi: 10.1038/nm1066
4. Walsh DM, Selkoe DJ. Aβ Oligomers - A decade of discovery. J Neurochem. (2007) 101:1172–84. doi: 10.1111/j.1471-4159.2006.04426.x
5. Chiti F, Dobson CM. Protein misfolding, functional amyloid, and human disease. Annu Rev Biochem. (2006) 75:333–66. doi: 10.1146/annurev.biochem.75.101304.123901
6. Hardy J. The amyloid hypothesis for Alzheimer's disease: a critical reappraisal. J Neurochem. (2009) 110:1129–34. doi: 10.1111/j.1471-4159.2009.06181.x
7. Tanzi RE, Bertram L. Twenty years of the Alzheimer's disease amyloid hypothesis: a genetic perspective. Cell (2005) 120:545–55. doi: 10.1016/j.cell.2005.02.008
8. Tzotzos S, Doig AJ. Amyloidogenic sequences in native protein structures. Protein Sci. (2010) 19:327–48. doi: 10.1002/pro.314
9. Hua Qx, Weiss Ma. Mechanism of insulin fibrillation: the structure of insulin under amyloidogenic conditions resembles a protein-folding intermediate. J Biol Chem. (2004) 279:21449–60. doi: 10.1074/jbc.M314141200
10. Sluzky V, Tamada Ja, Klibanov aM, Langer R. Kinetics of insulin aggregation in aqueous solutions upon agitation in the presence of hydrophobic surfaces. Proc Natl Acad Sci USA. (1991) 88:9377–81. doi: 10.1073/pnas.88.21.9377
11. Mauri S, Weidner T, Arnolds H. The structure of insulin at the air/water interface: monomers or dimers? Phys Chem Chem Phys. (2014) 16:26722–4. doi: 10.1039/C4CP04926H
12. Nault L, Guo P, Jain B, Bréchet Y, Bruckert F, Weidenhaupt M. Human insulin adsorption kinetics, conformational changes and amyloidal aggregate formation on hydrophobic surfaces. Acta Biomater. (2013) 9:5070–9. doi: 10.1016/j.actbio.2012.09.025
13. Campioni S, Carret G, Jordens S, Riek R. The presence of an air water interface affects formation and elongation of α synuclein fibrils. J Am Chem Soc. (2014) 136:2866–75. doi: 10.1021/ja412105t
14. Rzeźnicka II, Pandey R, Schleeger M, Bonn M, Weidner T. Formation of lysozyme oligomers at model cell membranes monitored with sum frequency generation spectroscopy. Langmuir (2014) 30:7736–44. doi: 10.1021/la5010227
15. Schleeger M, vandenAkker CC, Deckert-Gaudig T, Deckert V, Velikov KP, Koenderink G, et al. Amyloids: from molecular structure to mechanical properties. Polymer (2013) 54:2473–88. doi: 10.1016/j.polymer.2013.02.029
16. Brange J, Andersen L, Laursen ED, Meyn G, Rasmussen E. Toward understanding insulin fibrillation. J Pharm Sci. (1997) 86:517–25. doi: 10.1021/js960297s
17. Weidner T, Castner DG. SFG analysis of surface bound proteins: a route towards structure determination. Phys Chem Chem Phys. (2013) 15:12516–24. doi: 10.1039/c3cp50880c
18. Fu L, Liu J, Yan ECY. Chiral sum frequency generation spectroscopy for characterizing protein secondary structures at interfaces. J Am Chem Soc. (2011) 133:8094–7. doi: 10.1021/ja201575e
19. Zhuang X, Miranda P, Kim D, Shen Y. Mapping molecular orientation and conformation at interfaces by surface nonlinear optics. Phys Rev B (1999) 59:12632–40. doi: 10.1103/PhysRevB.59.12632
20. Garidel P, Blume A, Hubner W. A fourier transform infrared spectroscopic study of the interaction of alkaline earth cations with the negatively charged phospholipid 1,2-dimyristoyl-sn-glycero-3-phosphoglycerol. Biochim Biophys Acta (2000) 1466:245–59. doi: 10.1016/S0005-2736(00)00166-8
21. Bouchard M, Zurdo J, Nettleton EJ, Dobson CM, Robinson CV. Formation of insulin amyloid fibrils followed by FTIR simultaneously with CD and electron microscopy. Protein Sci. (2000) 9:1960–7. doi: 10.1110/ps.9.10.1960
22. Whittingham JL, Scott DJ, Chance K, Wilson A, Finch J, Brange J, et al. Insulin at pH 2: structural analysis of the conditions promoting insulin fibre formation. J Mol Biol. (2002) 318:479–90. doi: 10.1016/S0022-2836(02)00021-9
23. Baugh L, Weidner T, Baio JE, Nguyen PCT, Gamble LJ, Stayton PS, et al. Probing the orientation of surface-immobilized protein G B1 using ToF-SIMS, sum frequency generation, and NEXAFS spectroscopy. Langmuir (2010) 26:16434–41. doi: 10.1021/la1007389
24. Brange J. Galenics of insulin: The Physico-chemical and Pharmaceutical Aspects of Insulin and Insulin Preparations. Berlin: Springer-Verlag (1987).
Keywords: insulin, sum frequency generation, lipid monolayer, lipid membranes, protein adsorption
Citation: Mauri S, Pandey R, Rzeźnicka I, Lu H, Bonn M and Weidner T (2015) Bovine and human insulin adsorption at lipid monolayers: a comparison. Front. Phys. 3:51. doi: 10.3389/fphy.2015.00051
Received: 02 April 2015; Accepted: 06 July 2015;
Published: 24 July 2015.
Edited by:
Franca Fraternali, King's College London, UKReviewed by:
Christian Douglas Lorenz, King's College London, UKMichele Cascella, University of Oslo, Norway
Copyright © 2015 Mauri, Pandey, Rzeźnicka, Lu, Bonn and Weidner. This is an open-access article distributed under the terms of the Creative Commons Attribution License (CC BY). The use, distribution or reproduction in other forums is permitted, provided the original author(s) or licensor are credited and that the original publication in this journal is cited, in accordance with accepted academic practice. No use, distribution or reproduction is permitted which does not comply with these terms.
*Correspondence: Tobias Weidner, Molecular Spectroscopy Group, Max Planck Institute for Polymer Research, Ackermannweg 10, 55128 Mainz, Germany,d2VpZG5lckBtcGlwLW1haW56Lm1wZy5kZQ==
†Present Address: Ravindra Pandey, Department of Chemistry, University of Texas, Austin, USA
 Sergio Mauri
 Ravindra Pandey
 Izabela Rzeźnicka2
 Mischa Bonn
 Tobias Weidner