 Giulia Maffeis1*
 Nicola Serra1
 Alessandro Bossi1,2Elisabetta Avanzi1Alberto Dalla Mora1Laura Di Sieno1Rinaldo Cubeddu1Antonio Pifferi1,3
 Paola Taroni1,3
- 1Dipartimento di Fisica, Politecnico di Milano, Milan, Italy
- 2Dipartimento di Meccanica, Politecnico di Milano, Milan, Italy
- 3Istituto di Fotonica e Nanotecnologie, Consiglio Nazionale delle Ricerche, Milan, Italy
Monitoring lungs functions is key for detecting several morbidities and pathologies. Photons in the 600–1,300 nm range might have the potential to reach lungs and provide compositional and functional information. Yet, few optical techniques have been challenged non-invasively so far. In this paper, we investigate the conditions to probe lungs using Time Domain Diffuse Optical Spectroscopy (TD-DOS). Counterintuitively, from Monte Carlo simulations we discovered that a higher absorption coefficient in the chest wall as compared to lungs increases sensitivity to deeper structures. In vivo measurements on the thorax of healthy volunteers during a forced breathing protocol, complemented with information on lung composition and previously evaluated in vivo spectra of porcine lung, suggest that this condition occurs above 1,100 nm. Multiple experimental setups were exploited to cover the 600–1,300 nm spectral range and test different source-detector distances (3–7 cm). All measurements exhibit oscillations consistent with the breathing rhythm, suggesting detection of lung expansion and compression. However, marked differences for different subjects and a complex dependence of the detected signal on the photon time-of-flight seem to allure to a non-trivial role of photon propagation through lungs, related–for instance–to the presence of alveoli and perhaps also to the overlying heterogeneous tissues. The unceasing development of time-resolved single-photon detectors with increasing performances above 1,000 nm, and a better understanding of lung optics–e.g., anomalous diffusion models–will help unravel the information from late, deep-travelling photons and lead to a novel photonic tool to probe the lungs non-invasively.
Introduction
The persistence as the leading cause of cancer death since 1981 and the recent outbreak of COVID-19 pandemic underscore the broad benefit that a non-invasive, reliable and low-cost tool for the diagnosis of pulmonary diseases would provide (Dattani et al., 2024).
Currently, lung diseases are primarily detected through function tests, x-ray-based imaging procedures or biopsy. Spirometry and pulse oximetry measure the breath capacity and the oxygen saturation, but the origin (e.g., emphysema, oedema or lung cancer) of lung-related symptoms is investigated through Computed Tomography (CT) and chest x-ray imaging (Hollings and Shaw, 2002; Dong et al., 2021). However, they involve high doses of radiation exposure and CT is expensive, preventing these techniques from being performed on a routine basis. Besides, they cannot provide physiological insight that is essential for efficient identification and monitoring of the disease. Thus, imaging is often combined with lung needle biopsy or bronchoscopy, which are invasive procedures that could lead to complications like pneumonia or pneumothorax, and require hospitalization (Vetrugno et al., 2024), besides being very distressing for the patient.
As a result, the interest in developing optical techniques for diagnostic and monitoring applications has rapidly grown, driven by the attractive potential of non-invasive lung characterization (Zeng, McWilliams, and Lam, 2004). However, the challenge of accessing the lungs deep within the thorax often lead to pairing these techniques with endoscopic imaging and biopsy procedures to overcome their limited penetration depth or low signal level, thus jeopardizing their non-invasiveness. For instance, autofluorescence imaging and near-infrared Raman spectroscopy can be coupled to endoscopy to improve the localization of early lung cancer (Zaric et al., 2013; He et al., 2013; Hohert et al., 2020; Chen et al., 2021). Also, a pilot study has proven the feasibility of an OCT (Optical Coherence Tomography) probe during bronchoscopy to provide images of bronchial tumors (Michel et al., 2010; Quirk et al., 2011; Long et al., 2023). Furthermore, if combined to needle biopsy diffuse reflectance spectroscopy can discriminate between cancerous and healthy tissue (Costa et al., 2024; Spliethoff et al., 2016).
Two promising techniques that could fully exploit their non-invasive potential are Gas in Scattering Media Absorption Spectroscopy (GASMAS) and Time Domain Diffuse Optics Spectroscopy (TD-DOS). GASMAS proved promising in detecting oxygen in new-born piglets’ and healthy infants’ lungs (Pacheco et al., 2020; Svanberg et al., 2016), but is still quite limited in applicability to adults, and lacks quantitation due to the difficulty of evaluating photons pathlengths scattered in lungs’ alveolar structure.
Our group has recently proposed TD-DOS as a potential non-invasive approach to probe the lungs transcutaneously (Pifferi et al., 2024). TD-DOS has previously yielded significant findings in characterizing breast (Poplack et al., 2023; Grosenick et al., 2016), brain (Quaresima and Ferrari, 2019; Fantini et al., 2018; Torricelli et al., 2014), muscle (Hamaoka et al., 2011; Hamaoka and McCully, 2019; Perrey and Ferrari, 2018) and other tissues (Hoshi and Yamada, 2016; Langhout et al., 2015; de Koning et al., 2020; Mimura et al., 2021). Simulations (Mojahed et al., 2022; Liao et al., 2018; Durkee et al., 2018), tests on tissue phantoms (Pacheco et al., 2020; Listewnik et al., 2021; Pacheco et al., 2021) and on ex vivo samples (Beek et al., 1997; Lacerenza et al., 2020; Bossi et al., 2024) were conducted to explore photon migration in lungs. In a first study on healthy volunteers, we detected changes in TD-DOS signals strongly related to lungs expansion in a protocol of forced breathing. Yet, many issues were raised due to scrambled results due to intersubject variability, leaving an unsettled question on the real capabilities to reach the lungs transcutaneously.
The goal of the present study is to open a new frontier in the non-invasive investigation of lungs by exploring a new research path to unleash the potential of TD-DOS. The technique can characterize biological tissues in terms of composition and microstructure down to several centimeters of depth interpreting the propagation of picosecond light pulses through tissue, especially when a large source-detector distance
Building on the findings of our previous study, we understood the importance of assessing the chest and lung absorption spectra in vivo, of evaluating the chest thickness and of specifying the type of breathing. These key insights gained from experience guided us in tailoring the next steps of our research.
As a first step of the present study, Monte Carlo (MC) simulations were run to identify the most favorable setting for probing lungs. The thorax was modelled with a simplified approach as a bilayered medium, where the bulk represents pulmonary tissue and the upper layer gathers all overlying chest tissues. Different scenarios of the absorption and scattering coefficients of both layers were considered (i.e., keeping the upper layer properties fixed and testing higher, similar and lower values in the bulk), to understand when TD-DOS measurements would be most sensitive to the optical properties (and consequently composition and structure) of the bulk.
Secondly, the chest and lungs absorption spectra were assessed in vivo over a broad spectral range (600–1,300 nm) to understand where the optimal conditions previously identified are best met. The chest spectrum was evaluated through TD-DOS measurements with a small source-detector distance (2 cm). The lungs spectrum was derived from previous measurements performed in contact with the organ in vivo on swine (Spinelli et al., 2011).
Finally, healthy volunteers were measured to sense the lung transcutaneously. A forced breathing (i.e., hyperpnea) protocol was used to verify the sensitivity to lung optical properties under controlled conditions. To better isolate the most impactful factors on the outcomes, multiple measurement campaigns were conducted testing different probe positions on the thorax, measurement protocols and wavelengths. Indeed, multiple experimental setups were assembled and exploited to cover the whole spectral range of interest and test different source-detector distances, based on the available laser power and detector sensitivity.
The results derived from simulations, spectra assessment and in vivo measurements identify a complex situation that requires further investigation, but hints at the significant potential of TD-DOS to probe lungs non-invasively.
Materials and methods
Monte Carlo simulations
MC simulations were run to assess the best experimental conditions to probe lungs non-invasively, using the open access platform MCX (Fang and Boas, 2009).
As it can be inferred from Figure 1a, thorax anatomy is very complex: the presence of skin, subcutaneous adipose tissue, muscles ribs, pleural membranes and fluid (with possible waveguide effect), and the depth and alveolar nature of pulmonary tissue complicates the description of photon propagation through thorax. As an initial approach to model it, we assumed the simplest geometry, i.e., a bilayered medium, where the superficial layer collectively represents the chest wall, while the bulk stands for pulmonary tissue, regarded as a homogeneous medium, thus not taking into account its alveolar structure. As regard the lung position, the strength of TD-DOS consists in coding the depth reached by photons into a “delay” (Pifferi et al., 2016). Different time gates of the output pulse are sensitive to different layers of the tissue at exam, with later time gates corresponding to deeper layers, as depicted in Figure 1a. This occurs because the longer the permanence of photons in the medium, the longer their trajectory through it and, consequently, the higher the probability to be absorbed.
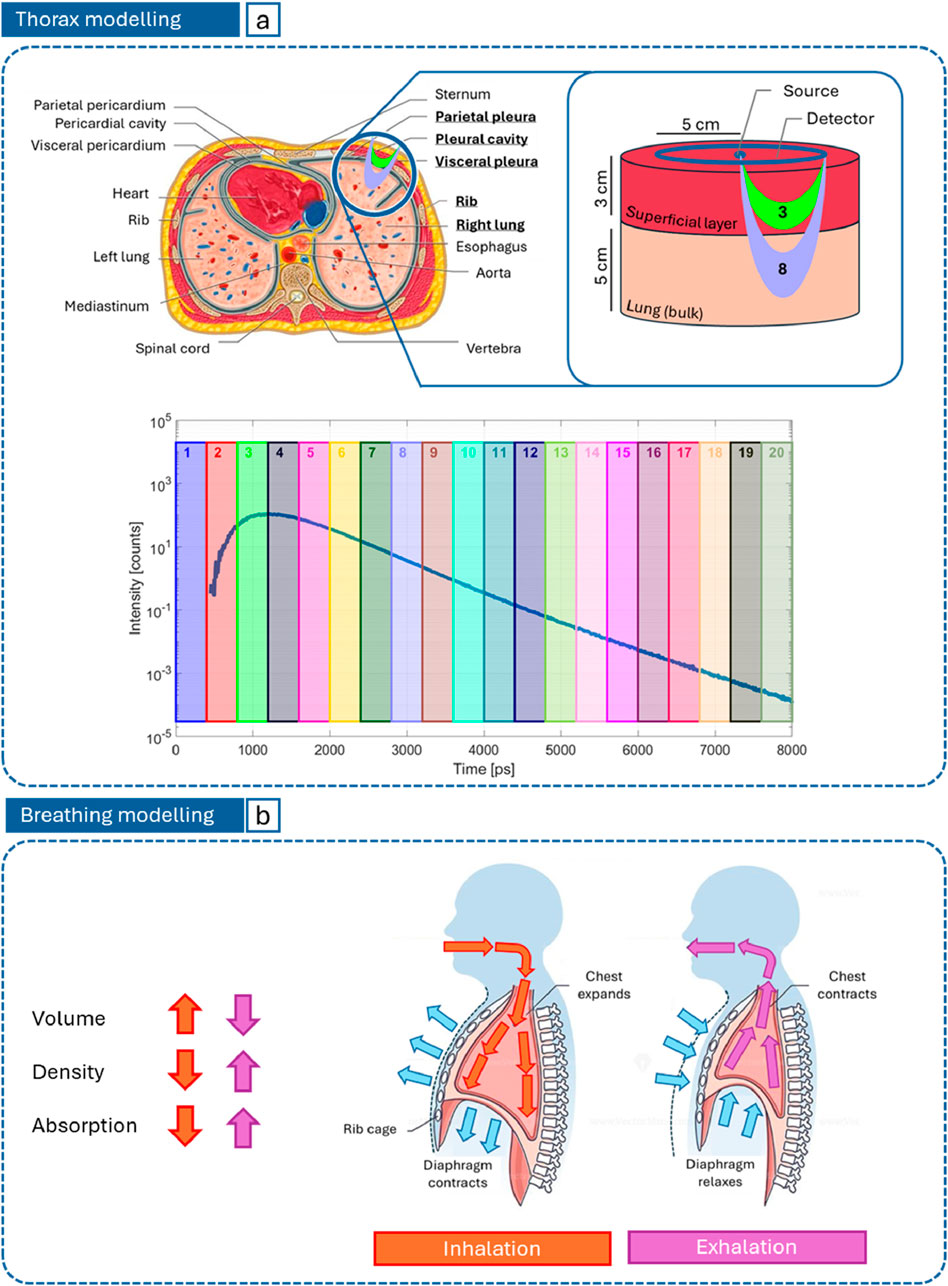
Figure 1. (a) Bilayered thorax model used to run MC simulations and region of photon propagation (banana shape) for different time gates on the DTOF; (b) Representation of how forced inhalation (orange) and exhalation (purple) affect lung absorption.
Unlike the superficial layer, the lungs are expected to undergo relevant variations between inhalation and exhalation phases, as schematized in Figure 1b. While inhaling, the chest expands and the diaphragm contracts, thus the volume of lungs increases and, for a given mass and composition, density and, consequently, absorption and scattering are expected to reduce. The opposite occurs during exhalation.
The medium was modelled as a bilayered cylinder with radius of 8 cm. The thickness of the superficial layer (3 cm) was fixed according to average chest wall values measured by CT (Kang et al., 1993). The bulk thickness (5 cm) was chosen to guarantee a semi-infinite description of the medium. The source-detector distance (5 cm) was chosen based on the maximum penetration depth of photons, as a function of the superficial layer thickness, to ensure the bulk is reached (Martelli et al., 2023). The cylindrical symmetry was exploited by locating a single pencil source on its axis, and multiple microscopic circular detectors (9 mm2 area each) distributed continuously with a contact point between first neighbors (as in a pearl necklace) to obtain a macroscopic single collective ring detector with an average radius of 5 cm. The ring detector is coaxial and coplanar to the source, to enable a reflectance measurement mode (Figure 1a). The output Distribution of Times Of Flight (DTOF) was computed as the sum of 30 repetitions, in order to increase the signal-to-noise ratio. The number of launched photons per simulation was 106, the anisotropy factor 0.89 (Sarid and Abookasis, 2022), the refractive index 1.45 (Sarid and Abookasis, 2022; Khan et al., 2021) for both layers, and the time span of the DTOF 8 ns, with a time bin of 8 ps.
Absorption (
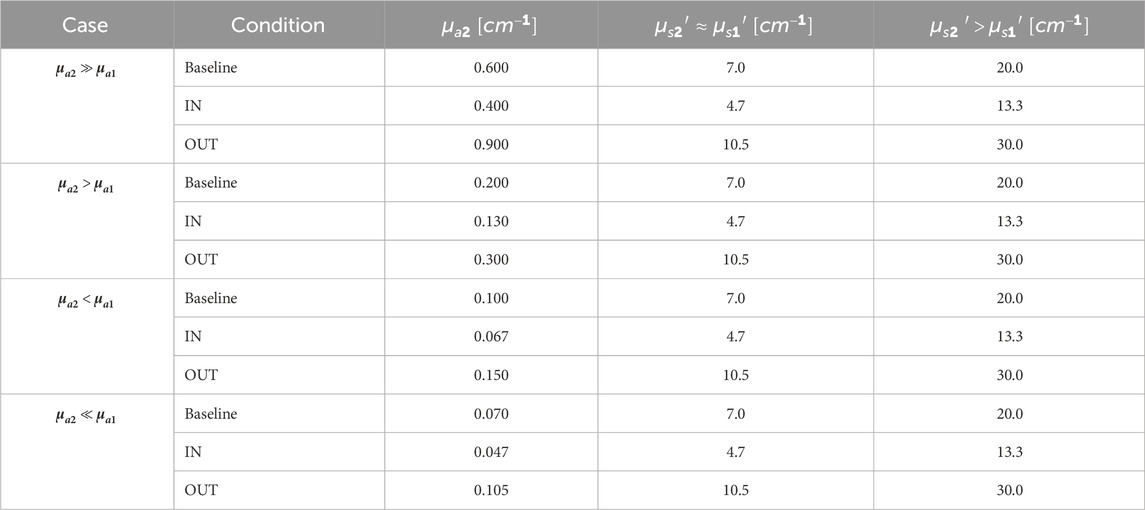
Table 1. Optical properties of the bulk tested with MC simulations. For the superficial layer:
Experimental setups
Three different time-resolved diffuse optical setups were employed, according to the specific goal of each measurement campaign.
Setup A (Figure 2a) was used to measure the absorption and reduced scattering spectra of the superficial layer of the thorax in vivo from 600 to 1,100 nm. It includes a supercontinuum pulsed laser (SuperK Extreme, NKT Photonics A/S, Denmark) operating at 40 MHz. Single wavelengths are selected using a rotating Pellin-Broca prism. Light is attenuated through a variable Neutral Density filter for signal optimization and is conveyed to and collected from the subject through optical fibers (100 μm core for injection and 1 mm core for collection). The interfiber distance is fixed to 2 cm with a custom-made probe. The average power injected into the tissue is around 2 mW all through the 600–1,100 nm range. The detector is a fiber-based custom-made single-photon detector module based on a SiPM (S13362-1350DG, Hamamatsu Photonics K.K., Japan) with an active area equal to 1.3 × 1.3 mm2 (Martinenghi et al., 2016). The output DTOF is reconstructed with a Time-Correlated Single Photon Counting (TCSPC) board (SPC-130, Becker & Hickl GmbH, Germany). The width of temporal channels is set to 3.05 ps.
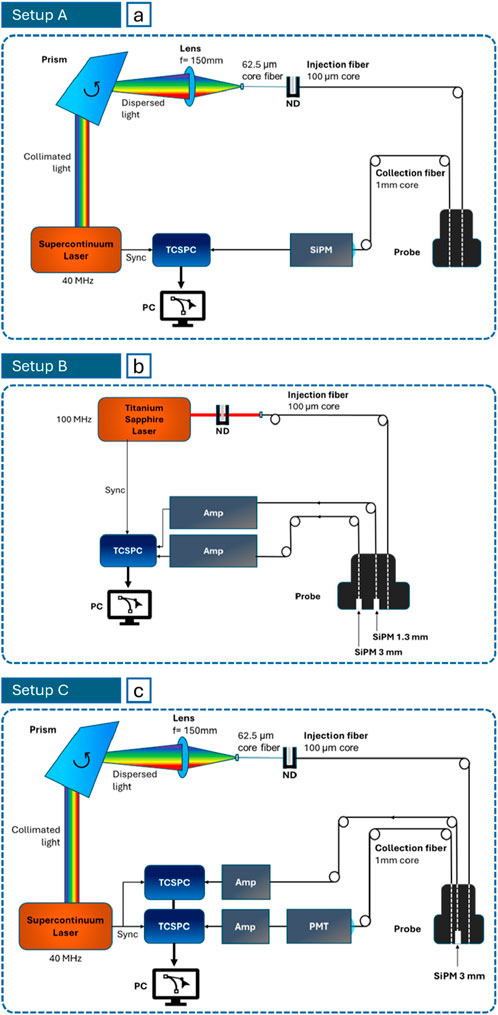
Figure 2. Schemes of the setups for in vivo measurements: (a) Setup (a) to assess the superficial layer spectra (Campaign A, 600–1,100 nm); (b) Setup (b) for large source-detector distance measurements (Campaign B, 1,080 nm); (c) Setup (c) for broadband measurements (Campaign C, 700–1,000 nm for SiPM and 1,100–1,300 for PMT).
Setup B (Figure 2b) was exploited to perform large source-detector distance measurements in vivo. The source is an actively mode-locked Titanium:Sapphire laser, that, optimally attenuated, reaches a power of about 10 mW at the distal end of the injection fiber. To comply with safety limits, the power density was reduced below the Maximum Permissible Exposure, by broadening the beam. The repetition rate is 100 MHz and the light wavelength was tuned to 1,080 nm (longest available wavelength of stable lasing). Two probe-hosted SiPMs with front-end electronics were put directly in contact with the subject’s skin to maximize the light harvesting capability. A 1.3 mm-side SiPM (S13360-1350CS, Hamamatsu Photonics K.K., Japan, (Avanzi et al., 2023)) is located at 5.5 cm from the source and a 3 mm-side one (S13360-3075CS) at 7 cm. These detectors require an amplification stage (gain: 200, model: VT120A, Ortec/Ametek Inc., United States of America) before the TCSPC processing (MultiHarp 150 16P, PicoQuant GmbH, Germany), that has a time bin of 5 ps.
Finally, Setup C (Figure 2c) was employed to carry out broadband measurements in vivo. It resembles Setup A (even in injected power), except for the laser model (SuperK Fianium FIR20, NKT Photonics A/S, Denmark) and the detection chain. SiPMs alone cannot cover efficiently the whole 600–1,300 nm spectrum, then a photomultiplier tube (PMT) module (H10330A-45, Hamamatsu Photonics K.K., Japan) was added, with optimal operating range spanning from 950 to 1,400 nm. Also, in this case the SiPM is 3 mm-side and directly in contact with the subject skin, to improve the light harvesting capability. Both collection devices were placed at 3 cm from the source. The SiPM was used at 700, 800 and 1,000 nm, and the PMT at 1,100, 1,140, 1,260, 1,300 nm.
In vivo measurements
Three measurement campaigns were accomplished, corresponding to the 3 setups just described.
Campaign A aimed at assessing the optical properties of the thoracic superficial layer, from 600 to 1,100 (10 nm step) nm at
The measurements were approved by the Ethical Committee of Politecnico di Milano, and they were conducted in compliance with the Declaration of Helsinki. All subjects signed a written informed consent.
Measurement protocol
In Campaign A, the full spectrum was acquired while the subject was at rest, without performing any task. Two positions of the injection/collection fibers were probed: parallel and orthogonal to ribs. The acquisition of a single spectrum took about 90 s, using an integration time of 1 s/wavelength, including processing time.
In Campaign B and C, the hypothesis of photon propagation through lungs was tested with a rhythmed, deep breathing protocol, where a positive response is indicated by variations in optical parameters synchronous with breathing. The rhythm consists in a series of 5 deep inhalation-exhalation cycles of 20 s each, preceded and followed by 20 s of normal breathing, for a total of 140 acquisitions of 1 s each. The subject was asked to transit from one phase to the next as quickly as possible and to hold breath at each stage, so as to grant stable measurement conditions. The protocol was repeated in series at separate wavelengths (B: 1,080 nm, C: 700, 800, 1,000, 1,100, 1,140, 1,260, 1,300 nm). In particular, two versions of the protocol were applied sharing the same time pattern:
1. Thoracic breathing: inhalation and exhalation manifest especially at the upper part of the chest;
2. Diaphragmatic breathing: inhalation and exhalation manifest especially at stomach level and lower.
The probe was always held by an operator, to mimic the configuration of a standard ultrasound exam in the radiology unit, orthogonally to the ribs, to comply with the probe size when using long source-detector distances. In all campaigns, the probe was placed on the right part of the chest, to avoid potential interference of the heartbeat and of the heart tissue itself. In Campaigns B and C, the source side of the probe was placed between the nipple and the sternum, at the nipple height; the detector side extended longitudinally towards the clavicle, thus crossing ribs.
Study population
The work presented here is the result of investigations performed over months. Critical or unclear aspects that emerged test by test led to the design of the following measurement campaign in terms of experimental setup and protocol. Due to this spread over time, a systematic and rigorous in vivo assessment on a fixed cohort proved not feasible. Study population of each campaign depended on the current availability of subjects.
Table 2 lists the features of all the healthy volunteers that participated in the study. The column “Campaign” reports in which measurement sessions they participated. The overall average age was 33 ± 12 years. Campaign A involved 6 subjects, Campaign B 8, and Campaign C 4. Subject #1 was excluded as it was used as a mock session for defining the protocol.

Table 2. Details of the subjects that participated in Campaign A, B and C.
Data analysis
Four types of analysis methods were applied.
In Campaign A, the absorption and reduced scattering coefficients over the experimental spectral range (600–1,100 nm, “experimental range”) were derived from the analytical solution of the diffusion equation for a homogeneous semi-infinite medium, with extrapolated boundary conditions (Martelli et al., 2009). The theorical curve is convolved with the Instrument Response Function (IRF) and best-fitted to the measured DTOF (Pirovano et al., 2020).
Still in Campaign A, the extension of the spectrum up to 1,300 nm (“fitting range”) exploited the Lambert-Beer law and an empirical approximation to Mie theory (Martelli et al., 2009), which allow one to relate absorption with constituent concentrations and reduced scattering with amplitude (
In MC simulations and in Campaigns B and C, gated contrasts
where
Finally, the fourth analysis method, applied exclusively to the results of Campaign B, involves calculating the variation in the absorption coefficient
where
Results
Monte Carlo simulations for a bilayered medium
The first stage of our research to characterize lungs non-invasively through TD-DOS consists in modelling the thorax anatomy and breathing mechanism in optical terms. This is useful to define the forward problem for MC simulations and test different possible scenarios (e.g., distribution of optical properties) to identify which is the one that conveys most effective information about lungs tissue. Such action is propaedeutic for the choice of the experimental setting and, consequently, of the system that best meets the identified optimal conditions, mainly in terms of operating wavelength and detected signal level at large source-detector distances, as well as for interpreting the results of the diffuse optical measurements.
Figure 3a (
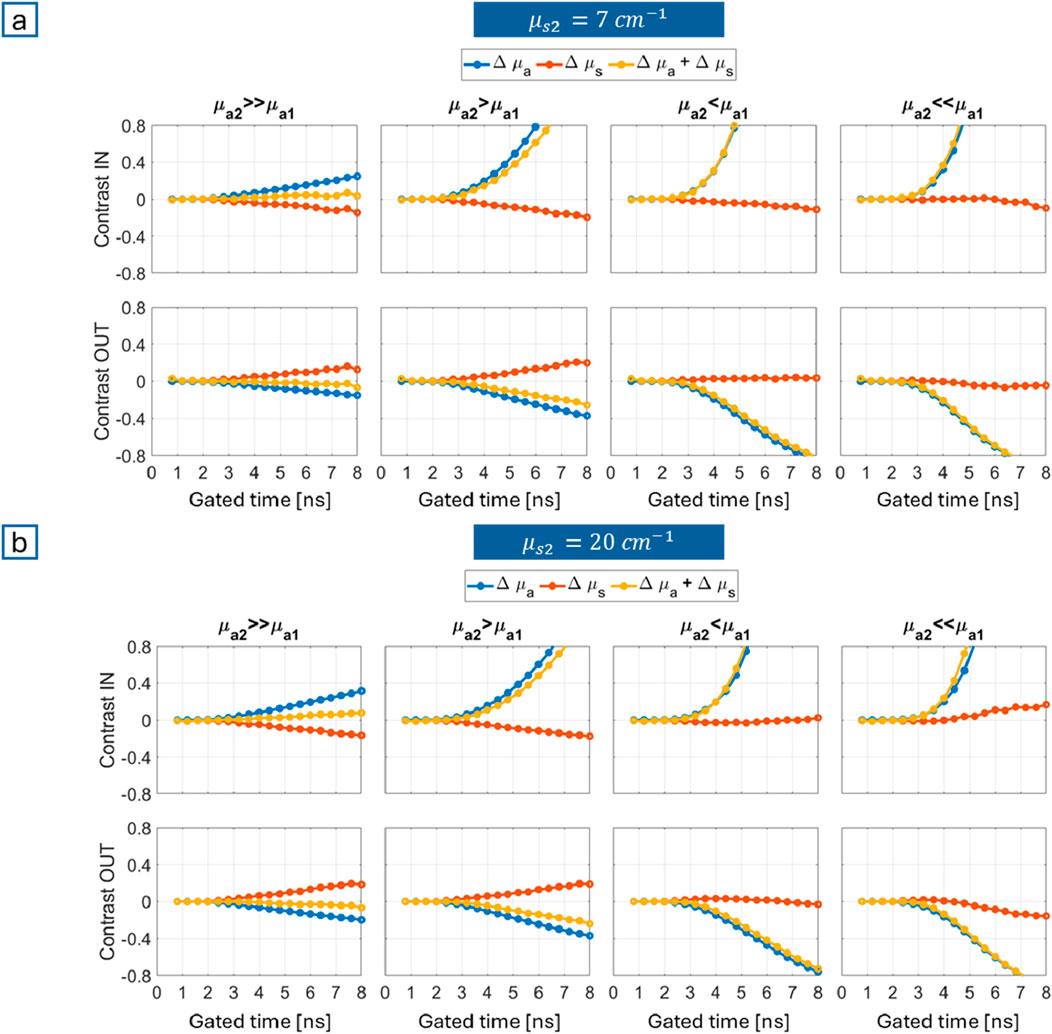
Figure 3. Gated contrasts obtained from MC simulations for different combinations of absorption properties (columns) and breathing phases (rows, where “IN” stands for inhalation and “OUT” for exhalation): (a)
In vivo spectra of the thorax
After identifying the most favorable combination of optical properties to probe lungs (
Campaign A: superficial layer spectra
As anticipated, short source-detector distance measurements (2 cm) were conducted to assess the average optical properties of the superficial layer. The average thickness of the chest is about 3 cm. Thus, we believe that a source-detector distance of 2 cm is adequate to probe the superficial layer, granting a reliable estimate of both absorption and reduced scattering. At shorter distances, reduced scattering often suffers from artifacts. An estimate over wavelengths and subjects was chosen to set the corresponding values for Monte Carlo simulations in the previous section. Acquisitions were carried out on 6 healthy subjects (Campaign A in “In vivo measurements” section), from 600 to 1,100 nm, with the time-resolved system labelled as “Setup A” in section “Experimental setups”.
Two positions on the chest were probed: parallel and orthogonal to ribs (Figure 4a). The corresponding absorption and reduced scattering coefficients were retrieved with a homogeneous solution of the diffusion equation, thus averaging over the optical properties of the heterogeneous tissues that we collectively identify as “superficial” layer. As can be inferred from Figure 4, ribs do affect the spectral line shapes. While the profiles remain substantially unchanged, absorption (Figure 4b) and reduced scattering (Figure 4c) spectra are respectively lower and higher in absolute values in orthogonal position (orange curve) than in parallel position (blue curve) along the whole spectral range.

Figure 4. (a) Most relevant experimental parameters of Setup A (left), representation of probe positioning during in vivo measurements: parallel (middle) and orthogonal (right) to ribs Average and standard deviation (shadowed area) over 6 subjects of the absorption (b) and reduced scattering (c) spectra of the chest obtained with the two probe positions.
As a final remark, we underline that in the previous section we ran multiple sets of MC simulations and the one we described represents the worst-case scenario, where
Lung spectra
For the sake of robustness, the in vivo absorption spectrum of the lung was obtained in two different ways. The former relies on literature information on the nutritional values to quantify lung main constituents. The latter refers to past measurements performed on an anesthetized pig (Spinelli et al., 2011), directly in contact with the organ (Figure 5c).

Figure 5. (a) Extinction coefficients of the major constituents in arbitrary units; (b) Superficial layer and lung absorption spectra calculated from literature concentration values; Absorption spectra (c) and reduced scattering spectra (d) of the superficial layer (in blue, from in vivo measurements on humans) and of the lung(in orange, from in vivo measurements on swine) LB stands for Lambert-Beer law and M for Mie theory. Dashed lines are the experimental results; solid lines are results extended to 1,300 nm using the 2-step method with LB for absorption and with M for reduced scattering.
In most conditions tissue constituents contribute linearly to the overall absorption of tissue, as discussed hereafter, while they contribute to tissue scattering in a more complex way. Then, only an experimental estimate of the reduced scattering properties was obtained.
The literature-based absorption spectrum of the lung (Figure 5b) was derived by applying the Lambert-Beer law with known extinction coefficients and constituents’ concentrations. The absorption properties of pure constituents (e.g., oxy, deoxy-hemoglobin, water, lipids, collagen, as available in the literature, are illustrated in Figure 5a. The concentrations (Table 3, “Literature composition”) come from tabulated values for bovine lungs (water, lipids, collagen (Camilli and Marletta, 2019)), and estimates for the average blood volume in human lungs (about 0.45 L (Hall, 2011)). Indeed, considering that the molecular weight of hemoglobin is 64,500 g/mol and its average concentration per liter of blood is 150 g/L, its molar concentration is about 1,000
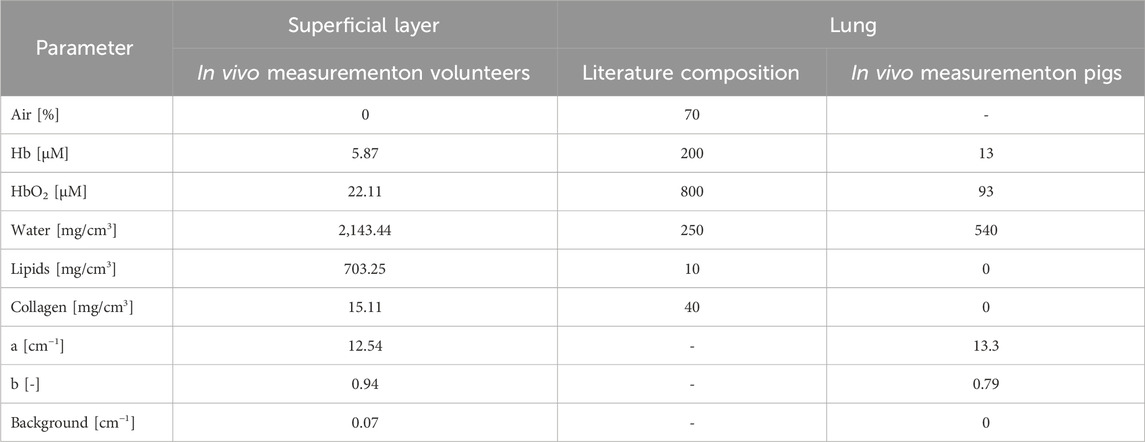
Table 3. Constituent concentrations used to calculate the absorption spectra of superficial layer and lung tissue up to 1,300 nm.
The experimental absorption spectrum was measured in the 600–1,000 nm range (dashed curve). The complete range up to 1,300 nm was estimated applying a two-step procedure. The first step consists in quantifying constituent concentrations using the Lambert-Beer law based on the absorption data in the available spectral range (Table 3, “In vivo measurement on pigs”). The second step requires again to exploit the Lambert-Beer law, this time with
Figure 5 depicts the absorption (panels b and c) and reduced scattering (Figure 5d) spectra of both the lung (orange curve) and the superficial layer (blue curve), to facilitate their comparison. The superficial layer composition (the same for Figures 5b, c) results from an average of the estimations obtained for parallel and orthogonal probe positions, as described previously. The spectral extension was obtained exploiting the same hybrid method as applied for lung.
The spectrum based on literature composition (Figure 5b) reflects the significantly higher amount of blood (Table 3) in the absorption tail of Hb at short wavelengths and in the broad absorption band of HbO2 at 800–1,000 nm. Instead, the spectrum measured in vivo (Figure 5c) reveals the higher water content in the more marked absorption peaks around 975 and 1,200 nm. This notwithstanding, the two absorption spectra exhibit a certain degree of similarity, and in both cases the optimal condition “
Breathing exercise
As assessed through simulations, with reference to a bilayered geometry, the output pulses yield more information about the lung (i.e., bulk) when it is less absorbing than the superficial layer. Then, measurements on the thorax led us to identify that this takes place for 1,150 nm
Campaign B: measurements at 1,080 nm with large source-detector distances (ρ = 5.5 and 7 cm)
Campaign B focuses on large source-detector distance measurements. The use of an actively mode-locked Titanium:Sapphire laser, combined with large-area Silicon PhotoMultipliers (SiPMs in Setup B), allowed us to reach
Figure 6 shows the results obtained for 3 exemplary subjects and 3 measurement configurations: thoracic breathing at
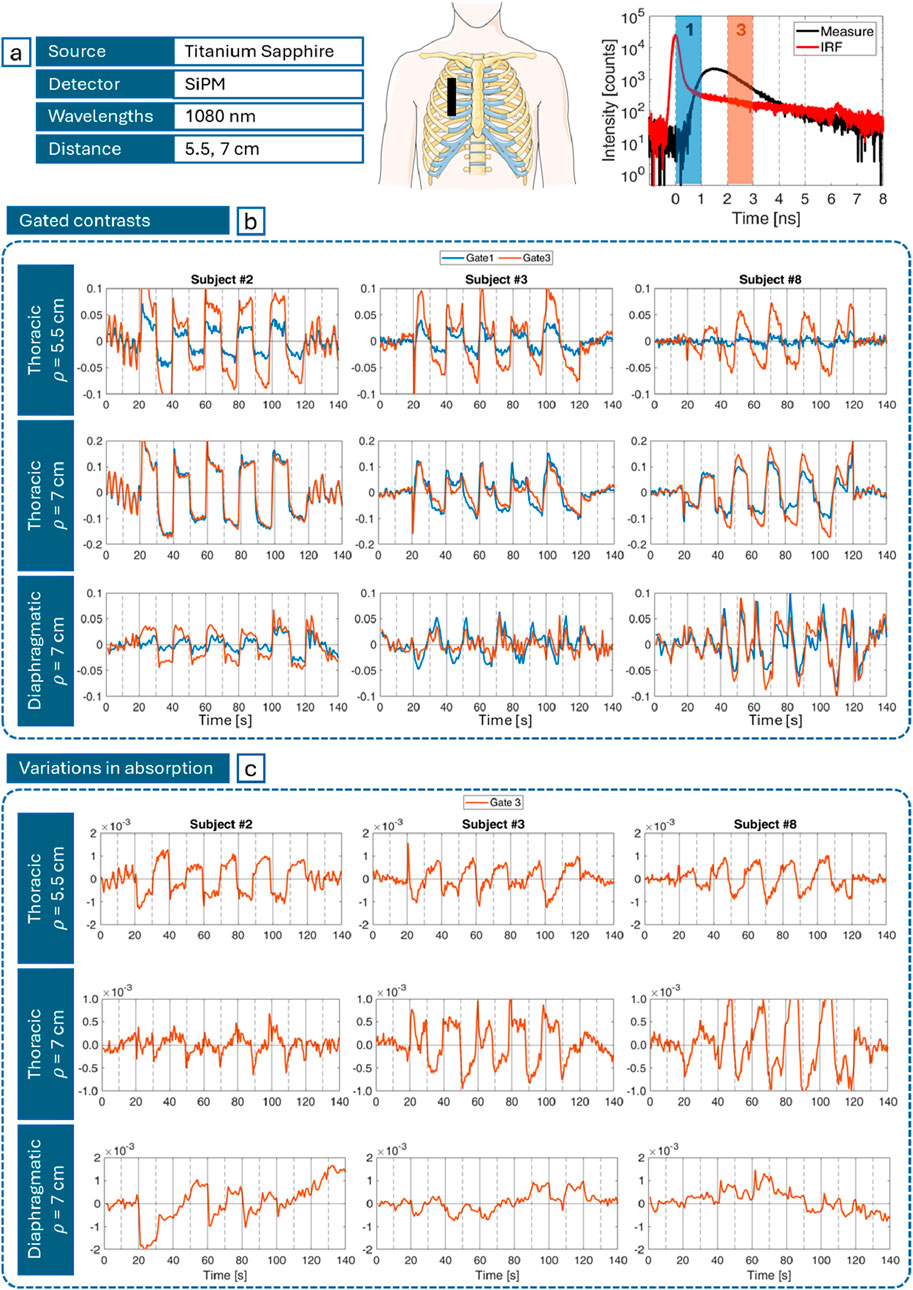
Figure 6. (a) Most relevant experimental parameters (left), probe positioning (middle) and gates temporal position (right) on a DTOF (black) and IRF (red); (b) Gated contrasts computed with Equation 1 for early gate (blue) and late gate (orange) for different subjects (columns), and different measurement configurations (rows) over the task macrotime; and (c) corresponding absorption changes (cm−1) computed with Equation 2. In (b, c) vertical gray lines mark the beginning of inhalation (solid) and exhalation (dashed) phases.
Figure 6b depicts the gated contrasts relative to gate 1 (first after the IRF peak) and 3 (on its tail) computed using Equation 1 and shown in Figure 6a. A periodic pattern matching the rhythm of the inhalation-exhalation cycle is consistently observed. However, the smoothness, amplitude and sign of these oscillations vary among individuals, as shown for subjects #2, #3 and #8, who were selected to represent the full range of different behaviors. Also, “gate 3” (orange) has higher contrasts compared to “gate 1” curves (blue), especially at 5.5 cm. Finally, thoracic breathing probed at 7 cm, despite the reduced difference between gates, globally reveals greater contrasts (up to 20%) with respect to the same exercise detected at 5.5 cm (up to 10%). On the contrary, diaphragmatic breathing is associated to smaller (up to 5% on average) and generally less “ideal” (square-wave-like) variations compared to thoracic respiration.
Figure 6c illustrates the corresponding variations in absorption. With reference to Equation 2, where the gates at exam are still gate 1 (early) and 3 (late), the resulting
Campaign C: Measurements at several wavelengths over a broad range (700–1,300 nm) with ρ = 3 cm.
Campaign C consisted in performing measurements over a broad spectral range (700–1,300 nm). The available supercontinuum laser combined with the photomultiplier tube (PMT) sensitivity allowed 3 cm as maximum source-detector distance common to all subjects (<5.5–7 cm as in Campaign B).
Based on the results of the previous measurement session, this campaign focused on thoracic breathing only, with the probe in the same position as in Campaign B. The outcomes at 700, 800 and 1,000 nm derive from measurements with the SiPM, the ones at 1,100, 1,140, 1,260, 1,300 nm with the PMT (Figure 7a). Graphs in Figure 7b show the gated contrasts along the gated time, similar to Figure 3. The ideal divergent behavior (higher gated contrasts for later times), with positive values for inhalation and negative for exhalation, is not obtained applying Equation 1. Actually, the opposite behavior is observed. The expected scenario takes place only provided that contrasts are computed with a slightly different approach. Different from the previous case, DTOFs are normalized to their peak. Only then, gating is implemented and the formula for
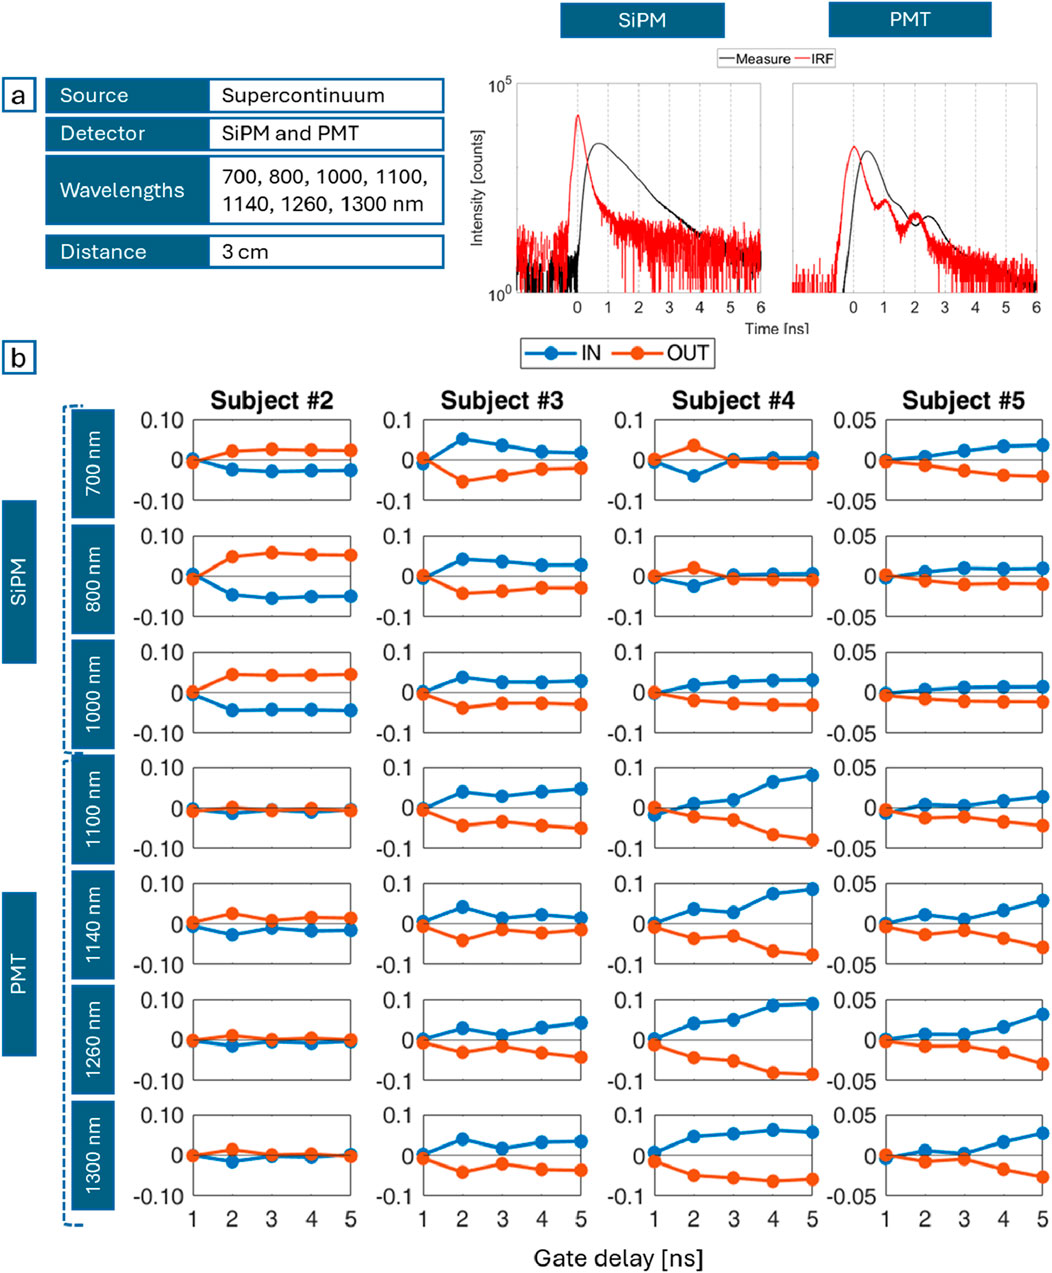
Figure 7. (a) Most relevant experimental parameters (left), an example of DTOF (black) acquired with the SiPM (middle) and with the PMT (right) with the corresponding IRF (red); (b) Gated contrasts during inspiration (IN, blue) and expiration (OUT, orange) for different subjects (columns) and wavelengths (rows) over the pulse time.
Discussion
The goal of this work is to investigate the possibility to probe the lungs through TD-DOS, paving the way for the non-invasive diagnosis of pulmonary diseases and/or monitoring of pulmonary conditions.
First, the thorax and the breathing mechanism were modeled to define a forward problem for MC simulations. Gated contrasts were used to evaluate which condition enables better sensitivity to the bulk (lung), with reference to a bilayered medium. The bilayered geometry is undoubtedly an oversimplification of the actual thorax anatomy, but it serves as an initial step to address the feasibility of the approach, even though not its accuracy. Contrast values reflect variations of the inspiratory and expiratory reserve volumes with respect to baseline (tidal) condition, typically asymmetrical, with a conservative approach (Barret et al., 2012). High contrasts, with a synergistic contribution of absorption and reduced scattering, mean that results are easier to measure and interpret, thus identifying the most favorable measurement setting. Such condition arises when the bulk (lung) is less absorbing than the superficial layer (chest wall), with no particular impact from scattering. A reduction in absorption indeed enhances longer propagation through the lungs, so that re-emitted photons encode higher information about them (Pifferi et al., 2001). Also, simulations highlight the strength of the time domain approach, indicating higher contrasts (>20%) for longer times of flight (>4 ns), i.e., a longer trajectory. Given a fixed source-detector distance, this translates into a deeper propagation of photons and then a longer experience through lung tissue.
Secondly, the absorption spectra of superficial layer and lungs in vivo were estimated from 600 to 1,300 nm. A hybrid approach (experiments and calculations) was employed to cover the whole spectrum. Concerning the superficial layer, an effort was made to identify the effect of bones on the average properties of the chest: contribution of ribs acts as an offset, yielding to globally lower absorption and higher reduced scattering for measurements orthogonal rather than parallel to them in accordance with previous assessment of bones in vivo (Sekar et al., 2016). The similarity of the spectral line shapes in the two positions makes the choice of probe placement non decisive, provided that it remains fixed during the whole measurement. Even if easier to implement, the spectra resulting from ex vivo measurements on lung samples are not suitable for the purposes of this research, being the vital parameters (e.g., blood oxygenation) fundamental for the assessment of pulmonary diseases (Mosca et al., 2020). Hence, for the sake of robustness, besides literature values on lung composition, results from measurements performed in contact with the lung of living swine were used. Focusing on absorption, which plays the major role in gated contrasts as emerged from Monte Carlo simulations, the two versions obtained are similar, except for a more pronounced contribution of water (peaks at 975 and >1,100 nm) and weaker contribution of oxy-hemoglobin in the experimental spectrum (the absolute values from 600 to 1,100 nm are significantly lower). The spectral differences reflect differences in composition estimated with the two methods. Water value derives from nutritional tabulated data, which indeed could refer to ex vivo and possibly dehydrated specimens, and blood estimations derive from considering a pure component, not dispersed in a heterogeneous tissue. This stresses once more the importance of the in vivo assessment in real conditions. In any case, both spectra agree that lungs have lower absorption compared to the superficial layer at 1,150 nm
Finally, after laying the foundation for the implementation and comprehension of in vivo measurements, subjects were recruited to test TD-DOS in lung probing. The probability of reaching the lungs is maximized for 1,150
The outcomes of both Campaigns B and C consistently exhibit variations in gated contrasts at the same pace of forced respiration. This could be considered proof of effective lung probing. However, such oscillations manifest significant inter- and intra-subject variability in terms of amplitude and sign, even if positive contrasts are expected during inhalation and negative contrasts during exhalation (as discussed in section “Monte Carlo simulations for a bilayered medium”). Also, in general late gates are expected to correspond to higher contrasts, assuming a longer propagation through lungs. Again, this is not always the case.
The observed behaviors could be ascribed to physiological or technological causes. The most intriguing hypothesis is the presence of the alveoli as a distribution of voids in the lungs with different volumes depending on the respiration phase. In our simplified bilayered model, we assumed the “homogenization” hypothesis that implies the optical properties to be calculated as mean values over the two regions (alveoli and tissue), and therefore both
Furthermore, the breathing exercise may include other factors along with the change in tissue density. For example, blood volume in lungs is about 450 mL, but it might halve when chest pressure increases, for instance during forced exhalation, or double due to a forced inhalation (Davies and Moores, 2010; Hall, 2011). The concurrent changes in density and blood volume are antagonistic and the net outcome might not always be consistent with what expected if blood changes are neglected. The lack of a univocal trend might require a more complex analysis method. The need or not for DTOF normalization in computing
The third and fourth causes have technological origin. SiPMs grant high active area, but at the same time they are affected by a diffusion tail in the temporal response that might weaken the informative content of late gates (Martinenghi et al., 2015). On the other hand, PMTs limited sensitivity imposes a constraint on the source-detector distance, hindering the probing of the deep lung tissue.
Finally, according to the absorption spectra assessed in Figure 5, 1,200 nm seems to be the optimal wavelength to sense lungs. However, at 1,200 nm lipids attain a relevant absorption peak, that greatly attenuates the signal. Indeed, Setup B could not perform measurements at 1,200 nm and the closest wavelengths on the 2 sides of the peak (1,140 and 1,260 nm) with sufficient signal level were selected as alternatives.
Therefore, despite the promising results, Setup B and C may not be the optimal solutions to probe lungs efficiently, but other pulsed lasers (with high power) and detectors (with high sensitivity) should be considered, for instance OPO lasers (Optical Parametric Oscillators) and InGaAs tiled wide area sensors (Linga et al., 2009), respectively. Such setups could enhance contrasts thanks to the higher signal that allows for higher source-detector distance, broader temporal distribution of detected photons and, therefore, late-time gating. Indeed, in MC simulations
Conclusion
In this paper, we explored the conditions for probing lungs using TD-DOS. We reached three key novel findings, namely,: (i) sensitivity to lungs is increased whenever the absorption coefficient is higher in the chest wall as compared to the lungs; (ii) we reconstructed a judicious-informed estimate for the absorption spectra of the chest wall and the lungs in the 600–1,300 nm range, indicating that the condition above is reached for 1,150 nm
The heterogeneity of in vivo data can at least in part be explained by the alveolar structure of lungs, blood fluctuations, setup constraints, even though further investigation is needed for full interpretation of all results. MC simulations and tests on custom-made phantoms (i.e., samples that reproduce the geometry and the optical properties of the targeted body part) will help improve our understanding about the effects of the complex lung anatomy and breathing mechanism on optical properties, so as to optimize our strategy to study lungs through TD-DOS. The complex propagation of light in the lung structures should be tackled, representing a potentially interesting field of application for the modelling of random media with strong microheterogeneities. Further, recent advancements in time-resolved single-photon detectors in the region above 1,000 nm–e.g., InGaAs Solid State Photomultipliers (Linga et al., 2009) or large-area Ge diodes–could extend by few ns the distribution of detectable photon time-of-flights above 1,100 nm, resulting in longer pathlength and sensitivity to lung tissues. We are currently working in this direction.
We aim at effectively probing the lung and defining the best conditions for that purpose. Only once such conditions are met, we can estimate lung composition in terms of water, lipids, collagen, and hemoglobin concentrations. The relative proportions of tissue constituents will then be challenged to distinguish pathologic conditions such as emphysema (increased water content), fibrosis (elevated collagen levels), pneumothorax (reduction in all constituents), COVID-19 (decreased oxygen saturation).
Data availability statement
The raw data supporting the conclusions of this article will be made available by the authors, without undue reservation.
Ethics statement
The studies involving humans were approved by the Ethical Committee, Politecnico di Milano. The studies were conducted in accordance with the local legislation and institutional requirements. The participants provided their written informed consent to participate in this study. Written informed consent was obtained from the individual(s) for the publication of any potentially identifiable images or data included in this article.
Author contributions
GM: Data curation, Formal Analysis, Investigation, Validation, Visualization, Writing–original draft, Writing–review and editing. NS: Data curation, Formal Analysis, Investigation, Resources, Validation, Writing–review and editing. AB: Investigation, Resources, Writing–review and editing. EA: Investigation, Resources, Writing–review and editing. ADM: Resources, Writing–review and editing. LDS: Resources, Writing–review and editing. RC: Resources, Writing–review and editing. AP: Conceptualization, Funding acquisition, Methodology, Project administration, Supervision, Writing–review and editing. PT: Conceptualization, Funding acquisition, Methodology, Project administration, Supervision, Writing–review and editing.
Funding
The author(s) declare that financial support was received for the research, authorship, and/or publication of this article. This work was partly funded by the National Plan for NRRP Complementary Investments (PNC, established with the decree-law 6 May 2021, n. 59, converted by law n. 101 of 2021) in the call for the funding of research initiatives for technologies and innovative trajectories in the health and care sectors (Directorial Decree n. 931 of 06-06-2022) - project n. PNC0000003 - CUP B53C22006720001 - AdvaNced Technologies for Human-centrEd Medicine (project acronym: ANTHEM), by the European Union’s NextGenerationEU Programme with the I-PHOQS Infrastructure [IR0000016, ID D2B8D520, CUP B53C22001750006] “Integrated infrastructure initiative in Photonic and Quantum Sciences and by the European Union’s NextGenerationEU Programme with PNRR - M4C2, investment 1.1 - “PRIN 2022 fund” - ALPHA [ID 2022HHZWRS, CUP D53D23013540006].
Conflict of interest
The authors declare that the research was conducted in the absence of any commercial or financial relationships that could be construed as a potential conflict of interest.
Generative AI statement
The author(s) declare that no Generative AI was used in the creation of this manuscript.
Publisher’s note
All claims expressed in this article are solely those of the authors and do not necessarily represent those of their affiliated organizations, or those of the publisher, the editors and the reviewers. Any product that may be evaluated in this article, or claim that may be made by its manufacturer, is not guaranteed or endorsed by the publisher.
References
Avanzi, E., Ghezzi, A., Farina, A., D’Andrea, C., Dalla Mora, A., and Di Sieno, L. (2023). “Evaluation of the timing performance of silicon photomultiplier detectors array and its preliminary application in fluorescence lifetime sensing and diffuse optics,” Optical Tomography and Spectroscopy of Tissue XV. Editors S. Fantini, and P. Taroni (SPIE), 47. doi:10.1117/12.2648786
Barret, K. E., Barman, S. M., Boitano, S., and Brooks, H. L. (2012). “Blood as a circulatory fluid and the dynamics of blood and lymph flow,” Ganong’ls Review of Medical Physiology. Editors K. E. Barret, S. M. Barman, S. Boitano, and H. L. Brooks 24th Edn (McGraw Hill Lange), 555–586.
Barthelemy, P., Bertolotti, J., and Wiersma, D. S. (2008). A lévy flight for light. Nature 453 (7194), 495–498. doi:10.1038/nature06948
Beek, J. F., van Staveren, H. J., Posthumus, P., Sterenborg, H. J. C. M., and van Gemert, M. J. C. (1997). The optical properties of lung as a function of respiration. Phys. Med. Biol. 42 (11), 2263–2272. doi:10.1088/0031-9155/42/11/018
Bossi, A., Bianchi, L., Saccomandi, P., and Pifferi, A. (2024). Optical signatures of thermal damage on ex-vivo brain, lung and heart tissues using time-domain diffuse optical spectroscopy. Biomed. Opt. Express 15 (4), 2481. doi:10.1364/BOE.517376
Camilli, E., and Marletta, L. (2019). “Tabelle di composizione degli alimenti.” CREA Centro Alimenti e Nutrizione. Available online at: https://www.alimentinutrizione.it/sezioni/tabelle-nutrizionali.
Chen, C., Jianqi, H., Xiaohu, H., Xu, W., Xiao, C., Zhang, J., et al. (2021). The accuracy of Raman spectroscopy in the diagnosis of lung cancer: a systematic review and meta-analysis. Transl. Cancer Res. 10 (8), 3680–3693. doi:10.21037/tcr-21-515
Contini, D., Spinelli, L., Torricelli, A., Pifferi, A., and Cubeddu, R. (2007). “Novel method for depth-resolved brain functional imaging by time-domain NIRS,” in Optics InfoBase Conference Papers. Editors B. W. Pogue, and R. Cubeddu Vol. 6629, 662908. doi:10.1117/12.728104
Costa, S., Fang, Q., Farrell, T., Dao, E., and Farquharson, M. (2024). Time-resolved fluorescence and diffuse reflectance for lung squamous carcinoma margin detection. Lasers Surg. Med. 56 (3), 279–287. doi:10.1002/lsm.23761
Dattani, S., Samborska, V., Ritchie, H., and Roser, M. (2024). Cancer. Available online at: OurWorldinData.orgr.
Davies, A., and Moores, C. (2010). “Structure of the respiratory system, related to function.” in The respiratory system. Editors A. Davies, and C. Moores (London: Elsevier), 2nd Edn, 11–28. doi:10.1016/B978-0-7020-3370-4.00002-5
de Koning, B., Weijtmans, P., Baris Karakullukcu, M., Shan, C., Baltussen, E., Smit, L. A., et al. (2020). Toward assessment of resection margins using hyperspectral diffuse reflection imaging (400–1,700 Nm) during tongue cancer surgery. Lasers Surg. Med. 52 (6), 496–502. doi:10.1002/lsm.23161
Dong, Di, Tang, Z., Wang, S., Hui, H., Gong, L., Yao, Lu, et al. (2021). The role of imaging in the detection and management of COVID-19: a review. IEEE Rev. Biomed. Eng. 14, 16–29. doi:10.1109/RBME.2020.2990959
Durkee, M. S., Fletcher, G. K., Carlson, C., Matheson, K., Swift, S. K., Maitland, D. J., et al. (2018). Light scattering by pulmonary alveoli and airway surface liquid using a concentric sphere model. Opt. Lett. 43 (20), 5001. doi:10.1364/OL.43.005001
Fang, Q., and Boas, D. A. (2009). Monte Carlo simulation of photon migration in 3D turbid media accelerated by graphics processing units. Opt. Express 17 (22), 20178. doi:10.1364/OE.17.020178
Fantini, S., Frederick, B., and Sassaroli, A. (2018). Perspective: prospects of non-invasive sensing of the human brain with diffuse optical imaging. Apl. Photonics 3 (11), 110901. doi:10.1063/1.5038571
Gandjbakhche, A. H. (2001). Diffuse optical imaging and spectroscopy, in vivo, Comptes Rendus l’Académie Sci. - Series IV - Physics 2 (8): 1073–1089. doi:10.1016/S1296-2147(01)01251-3
Grosenick, D., Rinneberg, H., Cubeddu, R., and Taroni, P. (2016). Review of optical breast imaging and spectroscopy. J. Biomed. Opt. 21 (9), 091311. doi:10.1117/1.JBO.21.9.091311
Hamaoka, T., and McCully, K. K. (2019). Review of early development of near-infrared spectroscopy and recent advancement of studies on muscle oxygenation and oxidative metabolism. J. Physiological Sci. 69 (6), 799–811. doi:10.1007/s12576-019-00697-2
Hamaoka, T., McCully, K. K., Niwayama, M., and Chance, B. (2011). The use of muscle near-infrared spectroscopy in sport, health and medical Sciences: recent developments. Philosophical Trans. R. Soc. A Math. Phys. Eng. Sci. 369 (1955), 4591–4604. doi:10.1098/rsta.2011.0298
He, Q., Wang, Q., Qi, Wu, Feng, J., Cao, J., and Chen, B.-Y. (2013). Value of autofluorescence imaging videobronchoscopy in detecting lung cancers and precancerous lesions: a review. Respir. Care 58 (12), 2150–2159. doi:10.4187/respcare.02524
Hohert, G., Meyers, R., Lam, S., Vertikov, A., Lee, A., Lam, S., et al. (2020). Feasibility of combined optical coherence Tomography and autofluorescence imaging for visualization of needle biopsy placement. J. Biomed. Opt. 25 (10), 1–13. doi:10.1117/1.JBO.25.10.106003
Hollings, N., and Shaw, P. (2002). Diagnostic imaging of lung cancer. Eur. Respir. J. 19 (4), 722–742. doi:10.1183/09031936.02.00280002
Hoshi, Y., and Yamada, Y. (2016). Overview of diffuse optical Tomography and its clinical applications. J. Biomed. Opt. 21 (9), 091312. doi:10.1117/1.JBO.21.9.091312
Kang, C., Newton, D., Warner, A. J., Absolom, T. A., Kruchten, D. A., Anderson, A. L., et al. (1993). A comparison of techniques in the assessment of chest wall thickness and composition. Health Phys. 64, 406–411. July 1992: 0–5. doi:10.1097/00004032-199304000-00008
Khan, R., Gul, B., Khan, S., Nisar, H., and Ahmad, I. (2021). Refractive index of biological tissues: review, measurement techniques, and applications. Photodiagnosis Photodyn. Ther. 33 (December 2020), 102192. doi:10.1016/j.pdpdt.2021.102192
Kienle, A., Patterson, M. S., Dögnitz, N., Bays, R., Wagnières, G., and Bergh, H. van den (1998). Noninvasive determination of the optical properties of two-layered turbid media. Appl. Opt. 37 (4), 779. doi:10.1364/AO.37.000779
Lacerenza, M., Pacheco, A., Konugolu Venkata Sekar, S., Saito Nogueira, M., Buttafava, M., Tosi, A., et al. (2020). “Functional monitoring of lung tissue using a hybrid hyperspectral time-resolved GASMAS system: a systematic study on ex vivo sample,” in Biophotonics congress: biomedical optics 2020 (translational, microscopy, OCT, OTS, BRAIN), Part F179-:SW1D.2 (Washington, D.C.: Optica Publishing Group). doi:10.1364/OTS.2020.SW1D.2
Langhout, G. C., Spliethoff, J. W., Schmitz, S. J., Aalbers, A. G. J., van Velthuysen, M.-L. F., Hendriks, B. H. W., et al. (2015). Differentiation of healthy and malignant tissue in colon cancer patients using optical spectroscopy: a tool for image-guided surgery. Lasers Surg. Med. 47 (7), 559–565. doi:10.1002/lsm.22388
Liao, P., Larsson, J., Svanberg, E. K., Lundin, P., Swartling, J., Xu, M. L., et al. (2018). Computer simulation analysis of source-detector position for percutaneously measured O 2 -gas signal in a three-dimensional preterm infant lung. J. Biophot. 11 (11), 1–7. doi:10.1002/jbio.201800023
Linga, K., Yevtukhov, Y., and Liang, B. (2009). Very high-gain and low-excess noise near-infrared single-photon avalanche detector: an NIR solid state photomultiplier. Adv. Phot. Count. Tech. 3. doi:10.1117/12.818580
Listewnik, P., Ronowska, M., Wąsowicz, M., Tuchin, V. V., and Szczerska, M. (2021). Porous phantoms mimicking tissues—investigation of optical parameters stability over time. Materials 14 (2), 423. doi:10.3390/ma14020423
Long, H., Ji, J., Chen, L., Feng, J., Liao, J., and Yang, Y. (2023). EB-OCT: a potential strategy on early diagnosis and treatment for lung cancer. Front. Oncol. 13 (April), 1156218–8. doi:10.3389/fonc.2023.1156218
Margallo-Balbás, E., Taroni, P., Pifferi, A., Koolstra, J. H., v Ruijven, L. J., and French, P. J. (2010). The impact of morphology on light transport in cancellous bone. Phys. Med. Biol. 55 (17), 4917–4931. doi:10.1088/0031-9155/55/17/003
Martelli, F., Del Bianco, S., Ismaelli, A., and Zaccanti, G. (2009). Light Propag. through Biol. Tissue Other Diffusive Media Theory, Solutions, Softw. doi:10.1117/3.824746
Martelli, F., Pifferi, A., Farina, A., Amendola, C., Maffeis, G., Tommasi, F., et al. (2023). Statistics of maximum photon penetration depth in a two-layer diffusive medium. Biomed. Opt. Express 15 (2), 1163–1180. doi:10.1364/boe.507294
Martinenghi, E., Di Sieno, L., Contini, D., Sanzaro, M., Pifferi, A., and Mora, A. D. (2016). Time-resolved single-photon detection module based on Silicon photomultiplier: a novel building block for time-correlated measurement systems. Rev. Sci. Instrum. 87 (7), 073101. doi:10.1063/1.4954968
Martinenghi, E., Mora, A. D., Contini, D., Farina, A., Villa, F., Torricelli, A., et al. (2015). Spectrally resolved single-photon timing of Silicon photomultipliers for time-domain diffuse spectroscopy. IEEE Photonics J. 7 (4), 1–12. doi:10.1109/JPHOT.2015.2456070
Michel, R. G., Kinasewitz, G. T., Fung, K.-M., and Keddissi, J. I. (2010). Optical coherence Tomography as an adjunct to flexible bronchoscopy in the diagnosis of lung cancer. Chest 138 (4), 984–988. doi:10.1378/chest.10-0753
Mimura, T., Okawa, S., Kawaguchi, H., Tanikawa, Y., and Hoshi, Y. (2021). Imaging the human thyroid using three-dimensional diffuse optical Tomography: a preliminary study. Appl. Sci. 11 (4), 1670. doi:10.3390/app11041670
Mojahed, D., Applegate, M. B., Guo, H., Taback, B., Ha, R., Hibshoosh, H., et al. (2022). Optical coherence Tomography holds promise to transform the diagnostic anatomic pathology gross evaluation process. J. Biomed. Opt. 27 (09), 096003–096015. doi:10.1117/1.jbo.27.9.096003
Mosca, S., Lanka, P., Stone, N., Sekar, S. K. V., Matousek, P., Valentini, G., et al. (2020). Optical characterization of porcine tissues from various organs in the 650–1100 Nm range using time-domain diffuse spectroscopy. Biomed. Opt. Express 11 (3), 1697. doi:10.1364/BOE.386349
Pacheco, A., Grygoryev, K., Messina, W., and Andersson-Engels, S. (2021). Lung tissue phantom mimicking pulmonary optical properties, relative humidity, and temperature: a tool to analyze the changes in oxygen gas absorption for different inflated volumes. J. Biomed. Opt. 27 (07), 074707–074710. doi:10.1117/1.JBO.27.7.074707
Pacheco, A., Li, H., Chakravarty, M., Sekar, S. K. V., and Andersson-Engels, S. (2020). Anthropomorphic optical phantom of the neonatal thorax: a key tool for pulmonary studies in preterm infants. J. Biomed. Opt. 25 (11), 1–11. doi:10.1117/1.JBO.25.11.115001
Pattelli, L., Savo, R., Burresi, M., and Wiersma, D. S. (2016). Spatio-temporal visualization of light transport in complex photonic structures. Light Sci. and Appl. 5 (5), e16090. doi:10.1038/lsa.2016.90
Perrey, S., and Ferrari, M. (2018). Muscle oximetry in sports science: a systematic review. Sports Med. 48 (3), 597–616. doi:10.1007/s40279-017-0820-1
Pifferi, A., Contini, D., Mora, A. D., Farina, A., Spinelli, L., and Torricelli, A. (2016). New frontiers in time-domain diffuse optics, a review. J. Biomed. Opt. 21 (9), 091310. doi:10.1117/1.JBO.21.9.091310
Pifferi, A., Miniati, M., Farina, A., Sekar, S. K. V., Lanka, P., Mora, A. D., et al. (2024). Initial non-invasive in vivo sensing of the lung using time domain diffuse optics. Sci. Rep. 14 (1), 6343. doi:10.1038/s41598-024-56862-0
Pifferi, A., Torricelli, A., Taroni, P., and Cubeddu, R. (2001). Reconstruction of absorber concentrations in a two-layer structure by use of multidistance time-resolved reflectance spectroscopy. Opt. Lett. 26 (24), 1963. doi:10.1364/OL.26.001963
Pirovano, I., Re, R., Candeo, A., Contini, D., Torricelli, A., and Spinelli, L. (2020). “Instrument response function acquisition in reflectance geometry for time-resolved diffuse optical measurements,”. Editors H. Dehghani, and H. Wabnitz, 11, 240. doi:10.1364/BOE.380996Biomed. Opt. Express1
Poplack, S. P., Park, E.-Y., and Ferrara, K. W. (2023). Optical breast imaging: a review of physical principles, technologies, and clinical applications. J. Breast Imaging 5 (5), 520–537. doi:10.1093/jbi/wbad057
Quaresima, V., and Ferrari, M. (2019). A mini-review on functional near-infrared spectroscopy (FNIRS): where do we stand, and where should we go? Photonics 6 (3), 87. doi:10.3390/photonics6030087
Quirk, B. C., McLaughlin, R. A., Curatolo, A., Kirk, R. W., Sampson, D. D., and Noble, P. B. (2011). In situ imaging of lung alveoli with an optical coherence Tomography needle probe. J. Biomed. Opt. 16 (03), 1. doi:10.1117/1.3556719
Sarid, H., and Abookasis, D. (2022). Extraction of the anisotropy factor and refractive index of biological tissue in the near-infrared region from diffusion approximation in the spatial frequency domain. Opt. Commun. 508 (August 2021), 127749. doi:10.1016/j.optcom.2021.127749
Sekar, K. V., Pagliazzi, M., Negredo, E., Martelli, F., Farina, A., Mora, A. D., et al. (2016). In vivo, non-invasive characterization of human bone by hybrid broadband (600-1200 Nm) diffuse optical and correlation spectroscopies. PLoS ONE 11 (12), 1–16. doi:10.1371/journal.pone.0168426
Serra, N., Cubeddu, R., Maffeis, G., Damagatla, V., Pifferi, A., and Taroni, P. (2024). In vivo optimization of the experimental conditions for the non-invasive optical assessment of breast density. Sci. Rep. 14 (1), 19154. doi:10.1038/s41598-024-70099-x
Spinelli, L., Contini, D., Farina, A., Torricelli, A., Pifferi, A., Cubeddu, R., et al. (2011). “In vivo swine myocardial tissue characterization and monitoring during open chest surgery by time-resolved diffuse near-infrared spectroscopy,” in Photonic Ther. Diagnostics VII, 7883. doi:10.1117/12.874697
Spliethoff, J. W., Prevoo, W., Meier, M. A. J., de Jong, J., Klomp, H. M., Evers, D. J., et al. (2016). Real-time in vivo tissue characterization with diffuse reflectance spectroscopy during transthoracic lung biopsy: a clinical feasibility study. Clin. Cancer Res. 22 (2), 357–365. doi:10.1158/1078-0432.CCR-15-0807
Svanberg, E. K., Lundin, P., Larsson, M., Åkeson, J., Svanberg, K., Svanberg, S., et al. (2016). Diode laser spectroscopy for noninvasive monitoring of oxygen in the lungs of newborn infants. Pediatr. Res. 79 (4), 621–628. doi:10.1038/pr.2015.267
Tommasi, F., Pattelli, L., Cavalieri, S., Fini, L., Paolucci, M., Pini, E., et al. (2024). “Anomalous radiative transfer in heterogeneous media.” Adv. Theory Simulations 7, 1–9. doi:10.1002/adts.202400182
Torricelli, A., Contini, D., Dalla Mora, A., Pifferi, A., Re, R., Zucchelli, L., et al. (2014). Neurophotonics: non-invasive optical techniques for monitoring brain functions. Funct. Neurol. 29 (4), 223–230. doi:10.11138/FNeur/2014.29.4.223
Vetrugno, L., Guerino Biasucci, D., Deana, C., Spadaro, S., Anna Lombardi, F., Longhini, F., et al. (2024). Lung ultrasound and supine chest X-ray use in modern adult intensive care: mapping 30 Years of advancement (1993–2023). Ultrasound J. 16 (1), 7. doi:10.1186/s13089-023-00351-4
Zaric, B., Stojsic, V., Sarcev, T., Stojanovic, G., Carapic, V., Perin, B., et al. (2013). Advanced bronchoscopic techniques in diagnosis and staging of lung cancer. J. Thorac. Dis. 5 (Suppl. 4), S359–S370. doi:10.3978/j.issn.2072-1439.2013.05.15
Keywords: lung, time domain diffuse optics, non-invasive tissue characterization, Monte Carlo simulations, ex vivo measurements, in vivo measurements, large source-detector separation, broadband spectroscopy
Citation: Maffeis G, Serra N, Bossi A, Avanzi E, Dalla Mora A, Di Sieno L, Cubeddu R, Pifferi A and Taroni P (2025) Addressing the need for non-invasive lung assessment with time-resolved diffuse optics. Front. Photonics 6:1559430. doi: 10.3389/fphot.2025.1559430
Received: 12 January 2025; Accepted: 24 February 2025;
Published: 10 March 2025.
Edited by:
Xuefei Tan, Vizgen, Inc., United StatesReviewed by:
Yao Wang, The Rockefeller University, United StatesShijie Yan, Northeastern University, United States
Rahul Ragunathan, Northeastern University, United States
Copyright © 2025 Maffeis, Serra, Bossi, Avanzi, Dalla Mora, Di Sieno, Cubeddu, Pifferi and Taroni. This is an open-access article distributed under the terms of the Creative Commons Attribution License (CC BY). The use, distribution or reproduction in other forums is permitted, provided the original author(s) and the copyright owner(s) are credited and that the original publication in this journal is cited, in accordance with accepted academic practice. No use, distribution or reproduction is permitted which does not comply with these terms.
*Correspondence: Giulia Maffeis, Z2l1bGlhLm1hZmZlaXNAcG9saW1pLml0