 Cristiano de Mello Gallep
95% of researchers rate our articles as excellent or good
Learn more about the work of our research integrity team to safeguard the quality of each article we publish.
Find out more
MINI REVIEW article
Front. Photonics , 06 August 2024
Sec. Biophotonics
Volume 5 - 2024 | https://doi.org/10.3389/fphot.2024.1421686
This article is part of the Research Topic Quantum Biology View all 5 articles
Germinating seedlings emit light in the visible range spontaneously, and these emissions are related to metabolism and reactive-oxygen species (ROS) processes. Several series of germination tests had such biological auto-luminescence (BAL) recorded in controlled conditions, fostering applications for the non-invasive, real-time evaluation of a seedling’s germinability and vigor when submitted to chemical and/or physical perturbations. However, long-term analysis of the BAL time-series of control samples conducted in different locations around the globe reveals that their BAL signals (and thus their metabolism) appear to follow the local gravimetric tide (g-tide) time profile. This indicates that the small daily and monthly variations in gravity acceleration due to the relative positioning of the Sun and Moon with respect to the Earth’s surface influence these signals. The gravimetric tide is a natural phenomenon that affects all things, fluid or solid, and is an uncontrollable variable in normal laboratory settings on Earth’s crust. All things on Earth have evolved under these pervasive cycles, with periods ranging from ∼12.2 h up to 28 d, which correspond to the Moon cycle. Tide-like cycles occur in living beings of different types, from the simplest bacteria to the most complex human beings, and we speculate that water availability at the molecular level could be a significant physical factor in modulating bio-activity by enabling protein folding and all metabolic pathways that require a synchronized organization to adapt to external environmental conditions. In this study, we summarize published results of a seedling’s BAL with cycle patterns resembling the g-tide in Limeira/BR, Prague/CZ, Leiden/NL, and Hamamatsu/JP and discuss the possible implications of this phenomenon for chronobiological studies.
Spontaneous ultra-weak light emission by organisms, also known as biological auto-luminescence (BAL), ultra-weak photon emission (UPE), ultra-weak chemiluminescence (UWCL), and “biophoton,” among others (Cifra and Pospíšil, 2014), is a regular phenomenon related to the metabolic activity, mostly involving the balance of reactive-oxygen species (ROS) that occurs for all living processes. Several applications of such phenomena have been pointed out in past decades, ranging from biomedical analysis (Poplová et al., 2023) to seedlings’ vigor and germinability (Gallep, 2014). For a review on the subject, including history, theory, and a full range of applications, refer to the recent book edited by Volodyaev et al. (2023); furthermore, refer to the special edition of the Journal of Photochemistry and Photobiology B: Biology, organized by Pospíšil (2014).
In this study, we focus on the BAL data from seedlings during their early development, which were continuously recorded from the moment of imbibition up to few days later, using photomultiplier tubes (PMTs) in the photon-count mode inside dedicated dark chambers. Initially, our research group aimed to develop toxicological applications using such germination tests: it all started with an undergraduate scientific project to use wastewater residue as fertilizer, where the germination outputs were checked using both standard (i.e., seedlings’ size/mass) and photonic parameters obtained from few-day-long BAL time profiles (Gallep and dos Santos, 2007). Leachate and heavy metal salts (chromium and mercury), among other toxic solutions, were tested in the years that followed; a review of the first decade of such toxicological experiments was presented in 2014 (Gallep, 2014), where another phenomenon was also pointed out, which was noted from the start but not mentioned up there yet: the periodic, semi/circadian-like (i.e., ∼12 h and ∼24 h) profiles present in BAL time patterns, occurring in all control groups, and the astonishing coincidence of those patterns with the local gravimetric tide (g-tide) time profile and its periodical components.
As discussed in the next sections—using already published data as evidence—when we started analyzing the collection of results (thousands of hours of photon-count records taken in germination tests and run over several years), we found a kind of “breathing” in the BAL patterns: the occurrence of plateaus and jumps/falls whose timing appears in (semi-) circadian cycles and is apparently in synchrony with the g-tide’s peaks and lows. Such tide-like patterns appear during the days of each test and also over the month-long span when a series of consecutive tests are recorded. “What is it that goes up and down, every day and every month?” we asked ourselves and some close students, with no good clue at first. We found the (obvious in hindsight) answer when we searched the literature: this is the tide, i.e., the local variations in the downward acceleration promoted by gravity due to the relative positioning of the Earth–Sun–Moon as they evolve in the Solar System. It is mostly visible in massive water movements all over the planet, the water tides, but it also affects all matter, solid or fluid, and across (and also a little below) the global surface.
One of the earliest articles to be found was that of Zücher et al. (1998), published in the prestigious magazine Nature, which presented the similarity between daily tree-diameter oscillations due to water uptake and the local gravimetric tide pattern. “It was so obvious,” one might say; “almost all indigenous wisdom says it!,” another could reply, as it is still known in modern Europe (Zücher, 2001). However, nobody had presented it so beautifully and in a modern scientific paper.
This first article led us to other articles of the same research group and to those of further groups, including the extended and comprehensive work of Peter Barlow. His research, also done on trees, related the trunk’s size and electric potentials to the local g-tide, and he also revisited the seminal leaf-movement data from the articles that inaugurated the chronobiology in the 1930s, where he showed that the basic, daily leaf movements can also be related to the local g-tide. For a review of Barlow’s work, refer to Gallep et al. (2018). Barlow helped our group from 2011, when we reached out to him via electronic mail, until early 2017, when he passed away prematurely. We dedicate this present work to him.
Since those days, we have been exploring this idea: could germination (and other basic biological processes) somehow follow the local gravimetric tide? How could the small variations, but extreme coherence in time and with very pervasive action, of the g-tide influence the diverse types of organisms so that they could prepare/react to the environmental conditions? These are open questions we might address speculatively at the end. What we are sure of is that the BAL of seedlings follows the g-tide and that this phenomenon can help in understanding this subject in a broader way and possibly foster the study of more complex organisms in the same sense.
Here, we will summarize the data already published by our group, based in the city of Limeira/BR, as well as those published in collaboration with colleagues of research groups in Prague/CZ, Leiden/NL, and Hamamatsu/JP. These collaborations enabled studies with intercontinental, simultaneous germination tests, with the BAL signal being recorded in similar conditions. To put it simply, seedlings are germinated in controlled conditions inside a dark chamber with a low-noise photon-count sensor continuously recording the faint light emission that occurs throughout the germination process, which can last for days. Afterward, the BAL data were plotted over time and superposed on the calculated local g-tide profile for initial visual inspection. Further data analysis was also conducted, including local cross-correlation factors (Moraes et al., 2012), Fourier-spectral components (Gallep et al., 2013), and coincidence of pattern inflections with the first and second derivatives (Gallep et al., 2014); for details, please refer to the original articles.
For a detailed description and the preliminary data obtained in our home-made setups, refer to Bertogna et al. (2011). As shown in Figure 1, seedlings are germinated in a Petri dish inside a dark chamber and properly positioned in front of/below the active window of a photon-multiplier tube with good sensitivity in the visible range and low dark-count noise levels. Components such as temperature control for the sample holder and external illumination mediated by an optical shutter are also included, all of which are controlled by a laptop/computer.
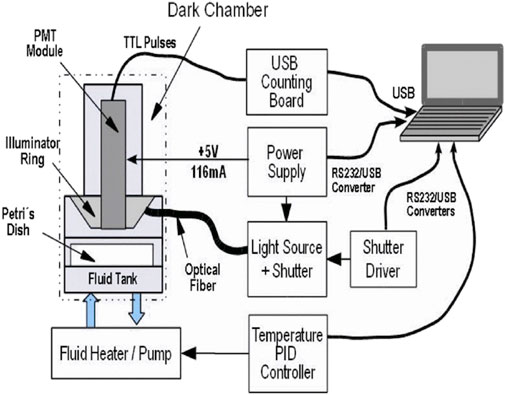
Figure 1. Basic setup for BAL measurements, from Bertogna et al. (2011).
The photon-count device is a PMT with sensitivity in the visible spectra and the very near infrared (350 nm–700 nm); in our case, an integrated module included a high-voltage supply and pulse discriminator (Hamamatsu Photonics KK, model H7360-01) with low operational dark-count noise (∼15 s-1) at room temperature. This module provides TTL pulses (transistor–transistor logic electric pulses, time width = 20 ns) that are integrated into the desired time window (up to 10 s) by a dedicated counting board (Hamamatsu Photonics KK, model C8855).
Selected seedlings are germinated in a Petri dish with water or the tested solution inside a dark chamber with a controlled temperature. Details used for each series of tests can be found in the related articles; in summary, 20 to 50 small seeds (i.e., wheat and mung beans) are germinated for 3 days in 10 mL of water/solution. Single seedlings, in small dishes (3.5 cm), use just 1–2 mL of liquid. After the germination period (3–7 days), the seedlings are quantified in terms of germinability (%) and vigor (size) or even mass growth.
The predictions of the local gravimetric tide for each location and time span were made using executable software programs named “E-Tide” (vertical component only) and “D-Tide” (vertical and horizontal components), which were constructed from the theoretical model established by Longmann (1959). Using the timelines of the Sun–Earth–Moon orbital mechanics, the model predicts past and future temporal variations in the lunisolar gravimetric tide at any location on Earth. Model validation was performed for the vertical component, measured in Bristol in February 2019, as shown in the Supplementary Material of Gallep and Robert (2022), which is available online1.
The first published article, Gallep and dos Santos (2007), as already mentioned, focused on the impact of wastewater residues on the germination capacity of wheat samples. However, the obtained BAL data already showed the circadian (∼24 h) and semi-circadian (∼12 h) periodicities, mostly for the control samples. This is illustrated by the typical time profile shown in Figure 2, which shows the pattern changing approximately at the 12th, 24th, 48th, 60th, and 72nd h.
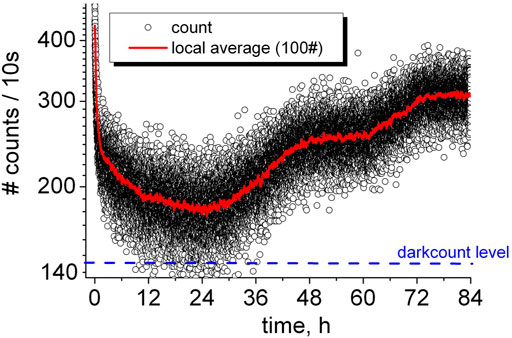
Figure 2. Typical BAL of a wheat sample (50 seeds) germinating in water for 3.5 days.
Those periodic plateaus and jumps present in the BAL profiles change from day to day and throughout the month as the germination tests were run in sequence for the diverse solutions being tested. This behavior was intriguing for those involved in the experiments. So, to better understand this phenomenon, a consecutive series of control samples were germinated for several weeks in 2007 from mid-February to the end of April, and the BAL data are shown in Figure 3: the first BAL series, “A” and “B,” were recorded over consecutive germination tests. One can note that not only are the (semi-) circadian cycles (∼12 h and ∼24 h) always present, but they also change for each test, and patterns change as the weeks pass: an overall increasing tendency from samples A0 to A3, followed by a decrease (A3 to A5), and a decrease followed by an increase for B0–B2 and B2–B4, respectively. Naive as we were, we initially tried to relate this long-term rhythmicity to the Moon cycle. Later, we would learn that the Moon is the main body exerting modulations over net gravity, causing the tide to oscillate during the days, the months, and all over the year. Approximately 2/3 of the overall g-tide is due to the Moon’s pull, and 1/3 of it is due to the Sun’s. However, we had no good clue about this at first.
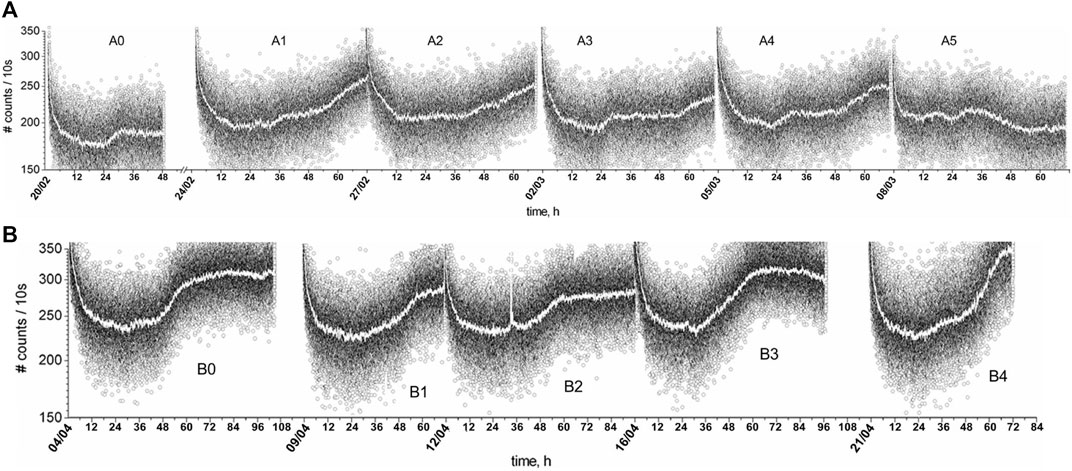
Figure 3. BAL data (and local average) of the control samples, which were two series of wheat seedlings starting on (A) 20/02/07 (A0 to A5) and (B) 04/04/07 (B0 to B4), from Gallep et al (2007).
Further data from more than 2,000 h of tests were presented in 2009 in a “biophoton”/BAL-dedicated section of a PIERS conference (Moraes et al., 2009). There, we started testing the idea of a g-tide like behavior; however, as we did not have access at that moment to proper software needed to calculate the g-tide, we used related data such as the Moon phase (and its square, i.e., the representative of the tide amplitude) and the water tide level at a similar latitude in the nearest sea-shore, as presented in Figure 4. Although not yet quantified, one can visually check the time patterns and observe several BAL patterns changing in coincidence with the inflections of the water tide. However, a proper numerical analysis was still lacking. By the end of 2010, we discovered the work of Peter Barlow, and through him, we gained access to the E-tide program (from the Institute of Geodesy and Photogrammetry, ETH-Zurich), which calculates the g-tide pattern for any point on Earth but only the vertical component. With that, we could accurately calculate the g-tide for our laboratory (or any) location and revisit some data to compare the BAL time profiles with the g-tide pattern. All data were further analyzed in terms of periodic components using the fast-Fourier transform (FFT) after proper signal de-trending (removal of linear growth) and in terms of the local correlation factor. We found that the g-tide and the BAL data present similar (semi)circadian cycles, even for long series (∼2 months), with similar tone-beatings and high harmonics (Moraes et al., 2012), although they did not always match. All BAL and g-tide (vertical component) time profiles of the data from 2007 to 2009 can be accessed online2, including the Sun/Moon rise/set times and Moon phase plots.
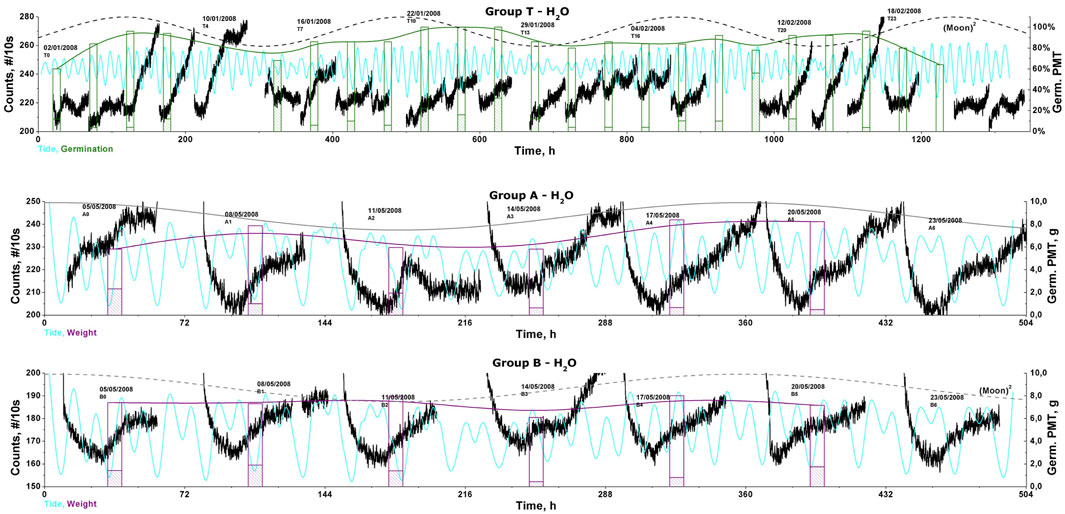
Figure 4. BAL data (counts/10s) of consecutive germination tests (groups T, A, and B, 50 wheat seeds in water) superposed on the data of germination (% of success for group, Germ. PMT, in green, or the total weight, Germ. PMT, g, in purple) of the local water tide level (blue) and the Moon phase square (tide amplitude) (in dashed-black).
We also revisited some data collected in 2007 in Germany and Brazil simultaneously, using samples that had traveled and were induced to germinate just after their arrival at a laboratory in Neuss, near Dusseldorf, Germany. The traveled samples experienced something similar to a “jet lag,” with BAL time patterns showing mixed, intermediate periodic components when compared to the “local” patterns, which only showed the (semi-)circadian components. Both “local” BR and DE samples were in tune with their local g-tide (Gallep et al., 2013). It was as if the traveled samples were presenting both rhythms: the original, from Brazil, and the new rhythm in Germany. We still have no clue as to how and why this occurred.
Trying to confirm that BAL would be synchronized with the local g-tide, a multi-continental experiment was prepared and conducted in collaboration with groups in Prague/CZ (Institute of Photonics and Electronics—UFE) and Hamamatsu/JP (Hamamatsu Photonics KK Research Head Quarter); wheat samples were germinated at each location under similar conditions, and their BAL signals were recorded and further related to the local g-tide (Gallep et al., 2014). A Supplementary Figure from that paper is shown in Figure 5 and all data can be found online3. Figure 5 shows what was found previously: the BAL of the wheat seedlings exhibited patterns that appear to be in synchrony with the local g-tide’s peaks and lows. The wheat samples were also transported back from Japan to Brazil and germinated just afterward, simultaneously with non-transported samples, but no “jet lag” was observed in the BAL data at that time. We then realized that Japan is almost 180° apart from Brazil on the globe, and this specific disposition leads to a similar g-tide pattern in both places, which may have masked a possible “jet lag” effect in this case.
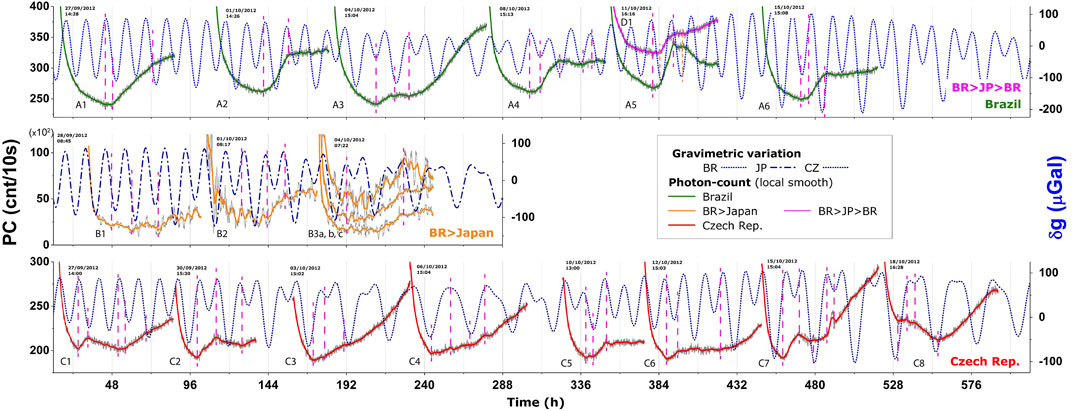
Figure 5. BAL data (counts/10s) of wheat seedlings: Brazilian samples in Limeira/BR (A, series, top), samples transported to Hamamatsu/Japan (B, middle) and back to Brazil (D1, top on A5), and Czech samples in Prague (C, bottom), plotted against the local g-tide (dg). Vertical marks (dash lines) indicate singular PC points (i.e., pattern turning points). From the supplementary figure of Gallep et al. (2014).
To check this possible jet-lag-like effect on seedlings, another series of intercontinental experiments were performed in cooperation with the Center for Photonics of Living Systems at Leiden University, Netherlands, in 2014 (Gallep et al., 2017); wheat samples were brought to Leiden from Brazil and germinated there in parallel with local samples, with BAL being recorded for both in six consecutive tests that were carried out for 24 days. Later, Dutch samples were transported to our laboratory in Limeira, Brazil, and germinated there in parallel with local samples, with BAL being recorded again in eight consecutive tests that were carried out for 30 days. No significant difference was found between the BAL of the transported and local samples for both series of tests, with the samples’ BAL showing astonishing synchronism with the local g-tide. The same article also presented some BAL data from different samples, such as corn and sunflower, whose germination lasts up to 7 days; although quite different in terms of their long-term time profiles, i.e., growth development, several samples presented similar local changes in their BAL pattern when abruptly altering their time derivatives, which occurred mostly in synchrony with the g-tide singular points (local minima or maxima), as marked by arrows in Figure 6 showing the data of corn and wheat and corn and sunflower germinating in parallel. Note that these tests show all BAL pattern changes/inversions occurring alongside g-tide inversions. Similar BAL patterns are evident around many of those inversions, such at the time of 21 d (day), 23 d to 25 d, 26 d to 28 d, 29 d to 31 d, and 33.5 d to 36 d (Figure 6).
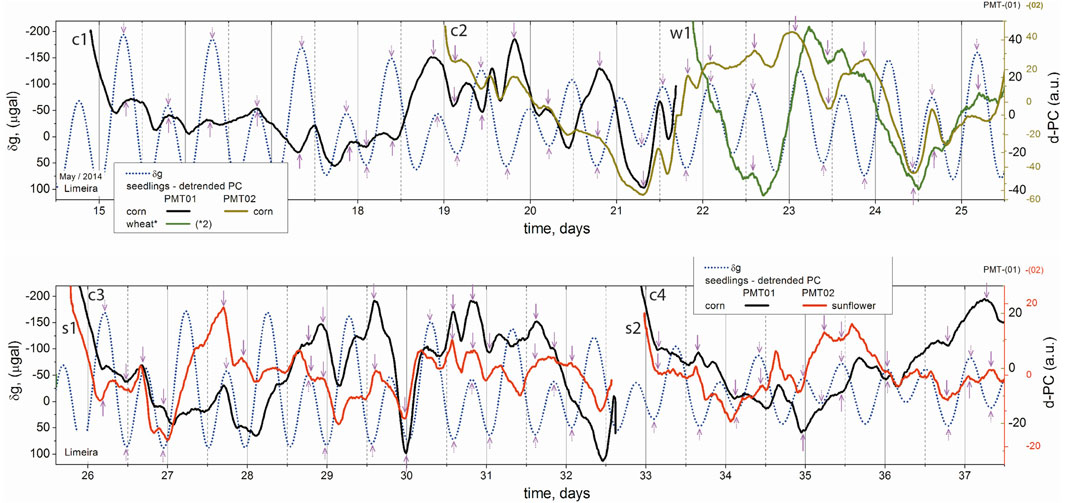
Figure 6. BAL data (detrended photon-counts, d-PC) of concurrent germination tests of wheat, corn, and sunflower plotted over the local g-tide (vertical); singular time points (i.e., pattern turning points) of each pattern indicated by arrows; from Gallep et al. (2017).
All the above examples of BAL were from tests using a sample of seedlings for each run—few tens of grains each—to ensure a good signal-to-noise ratio (>2) and have a stable local average for the photon-count data that could be further smoothed and detrended when needed/desired. Since not all seedlings in a sample evolve together at the same pace, the BAL data recorded are related to a collective sum of the photon emissions of each sample and discounted the possible light absorption by the neighboring organic mass that moved as the whole sample increased. So, sometimes, even the data of simultaneous tests—using samples of the same seed stock—were hard to compare quantitatively. To avoid such impairments related to sample movement/absorption and enable the verification of the individual circadian profile, the BAL recording of individual seedlings was necessary. The first record of a single seedling’s BAL (sunflower) was presented in 2014 (Gallep, 2014), and the data were revisited in another article (Gallep and Robert, 2022), where by superposing and averaging 24 h-time windows for both the BAL and the g-tide patterns, it was demonstrated that the single seedling’s BAL presents time profiles similar to—and in synchronism with—those of the local g-tide. New data on the germination of single seedlings (for wheat, mung bean, and corn) were initially presented solely in relation to their germination vigor (seedlings’ size), with no analysis of time patterns (Gallep and Robert, 2020). Later, the aforementioned approach of 24-h window averaging was employed again to demonstrate the observed similarity in the BAL and the gravimetric tide patterns (Gallep, 2023); the selected profile of BAL recorded in consecutive wheat tests and their corresponding g-tide are shown in Figure 7.
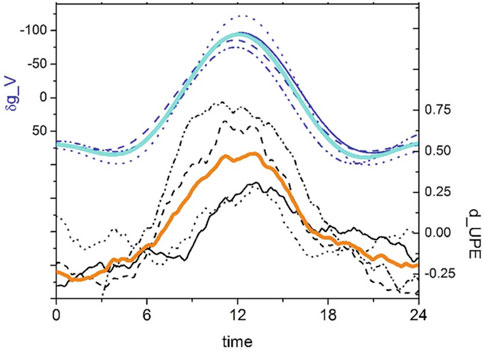
Figure 7. Superposed g-tide profiles (vertical component δg_V, μGal) and detrended BAL profiles (d_UPE, a.u.), for single-seedling germination tests of wheat; respectively, the dark-blue (top) and the black lines (bottom) comprehend the individual data of consecutive samples, and the continuous light-blue and orange lines are the average values in that 24-h span. From Gallep (2023).
Figure 7 shows that not only does each individual test using single seedlings present BAL data with time profiles similar to those of the local g-tide but also that consecutive tests, when averaged, present even more pronounced similarities. The phase of both oscillatory patterns evolves together. This would not be a surprise if we consider that the g-tide is a regular, all-pervasive oscillation of a basic natural force that has existed in our environment for eons. We speculate that if the water availability were somehow modulated by the g-tide in the microrange on a molecular scale, it could be sufficient to produce such tide-like patterns observed in plant growth and development and in many other organisms since all proteins depend on the water surrounding them. For a mini-review on the possible relations between the gravimetric tide and the behavior of various organisms, refer to Gallep and Robert (2022), which revisits data on animal behavior, including the swimming activity of isopods and the larvae released in a coral reef, both in controlled, water-tide-free conditions.
We must stress that the energy involved in the g-tide process is substantial; it provides the Earth with approximately 10^20 J per year, comparable to the energy generated by tectonic deformations, volcanic eruptions, or isotopic decay (Adushkin et al., 2017). So, ignoring such tremendous power acting on matter would be naive; instead, we should investigate how it influences the diverse phenomena on Earth, living or non-living.
The base of life, i.e., water, despite its simple chemical makeup, is a complex and intricately structured substance that exhibits peculiar behavior, particularly when interacting with interfaces. This complexity is further accentuated when water is in contact with organic compounds, giving rise to what is commonly referred to as “biological” or “structured water” (Chaplin, 2000). Even fundamental physical properties of matter can fluctuate with the gravitational tide, including water electrical conductivity (Ageev et al., 2018) and isotope radioactive decay rates (Sturrock et al., 2014); so, continuing with our speculation, if water properties at the molecular level could somehow be affected by the g-tide, this would show the possibility of biological processes being modulated by the g-tide.
Water clustering is of paramount importance to understand water behavior in complex media due to the unusual properties of such water conjugates and their impact on solution chemistry (Gadre et al., 2014). Different from its solid form (ice), where each water molecule forms strong hydrogen bonds (SHBs) with four neighbors, in the liquid form of water, the number of SHBs is reduced to two, but those can be interconnected into chains of up to 150 water molecules, acting like a branched polymer that changes dynamically, with great impact on viscosity, diffusion, and solvation of molecules, ions, membranes, and proteins (Naserifar and Goddard, 2019). In this regard, the self-assembly processes of nucleic acids are strongly dependent on the interactions between the base pairs, with the important influence of long-range ordered water that interacts between them by forming special helical networks (Luo et al., 2020).
Researchers are also beginning to delve into the peculiar characteristics of water when it interacts with both living organisms and mineral substances. Interfacial water plays a crucial role in various chemical reactions, colloidal properties, molecular recognition, and protein folding processes (Hayashi, 2021; Tanaka et al., 2021). Interfacial water forms a protective barrier around compounds, regulating protein adsorption and cell adhesion processes (Tanaka et al., 2021). Hydration shells play a crucial role in mediating interactions between compounds, influencing chemical processes such as ion adsorption at the solution–solid interface (Jiang et al., 2021). Within biomembranes, the intricate interplay between water and hydrophilic compounds significantly influences the local chemical activity, with dehydration exerting a notable effect on lipid mobility (Chattopadhyay et al., 2021).
We speculate that if water structuring and the formation of hydration shells over organic compounds were somehow modulated by the all-pervasive g-tide, this oscillation in the fundamental geophysical force would be enough to work as a Zeitgeber, an external natural trigger, for the chronobiological processes found in the lives of bacteria, plants, and animals up to human beings by acting over the effectiveness of biological processes at the molecular level. We do not forget the genetic mechanisms that perform rhythmical cycles, but it is clear now that they do not work properly without a good Zeitgeber. So, the so-called “free-run” experiments—those run under constant, controlled conditions—are still under a cyclic, g-tide influence that would be enough to act as an external synchronizing factor.
A deeper and broader understanding of such phenomena could, besides the obvious impact on basic biology, chronobiology, and further agricultural applications, also help bridge the gap between the current academic scientific knowledge and the wisdom of indigenous people with their native knowledge from all over the world. These groups seriously consider cosmic influences as integral to the Earthly realms, including all living processes. Understanding the Sun and Moon’s influence on agriculture, animal breeding and mood, and human behavior could enhance our ability to use this knowledge for the common good, and native knowledge could be better appreciated and even integrated into mainstream science.
After a brief presentation of the published results of our group, with data used to compare the time profiles of BAL from seedlings and those of the local gravimetric tide, we suggest, as has already been proposed (Brown, 1983; Zürcher et al., 1998; Barlow, 2015; Gallep and Robert, 2022), that the g-tide somehow interacts with organisms and can be a driver for biological cycles. In addition, we speculate, maybe naively, that these interactions could be mediated by water clustering/shell formation in organic processes.
The original contributions presented in the study are included in the article further inquiries can be directed to the corresponding author.
CG: writing–original draft, writing–review and editing, conceptualization, data curation, funding acquisition, project administration, and resources.
The author(s) declares that financial support was received for the research, authorship, and/or publication of this article. The author is grateful for the financial support of the National Research Council CNPq, Brazil (grant 301765/2022-7), the Biotechnology and Biological Sciences Research Council (BBSRC), United Kingdom (grant BB/N022556/1), and the São Paulo Research Foundation, FAPESP, Brazil (grants 04/10146-3, 07/00431-0, 07/50046-6, 07/50047-2, 14/04232-6, 15/11280-0, 16/50344-6, 17/00900-2, and 18/05300-6).
The author is very grateful to all the students and fellow researchers with whom he cooperated in exchanging experiments and ideas, including many co-authors of the cited papers from Brazil and abroad. The author is especially thankful to Peter W. Barlow, in memoriam, to whom this article is dedicated.
The author declares that the research was conducted in the absence of any commercial or financial relationships that could be construed as a potential conflict of interest.
All claims expressed in this article are solely those of the authors and do not necessarily represent those of their affiliated organizations, or those of the publisher, the editors, and the reviewers. Any product that may be evaluated in this article, or claim that may be made by its manufacturer, is not guaranteed or endorsed by the publisher.
1https://doi.org/10.25824/redu/UGMCJV
2https://doi.org/10.25824/redu/ZZHRNI
3https://www.tandfonline.com/doi/suppl/10.4161/psb.28671
Adushkin, V. V., Riabova, S. A., and Spivak, A. A. (2017). Lunar–solar tide effects in the Earth’s crust and atmosphere. Izvestiya, Phys. Solid Earth 53, 565–580. doi:10.1134/S1069351317040012
Ageev, I. M., Rybin, Y. M., and Shishkin, G. G. (2018). Manifestation of solar–terrestrial rhythms in variations of the electrical conductivity of water. Biophysics 63, 282–288. doi:10.1134/S0006350918020021
Barlow, P. W. (2015). Leaf movements and their relationship with the lunisolar gravitational force. Ann. Bot. 116, 149–187. doi:10.1093/aob/mcv096
Bertogna, E., Santos, S. R., Paterniani, J. E. S., Conforti, E., and Gallep, C. M. (2011). “Compact, automatic set-up for ultra-weak photon emission measurements in organisms,” in 2011 SBMO/IEEE MTT-S international microwave and optoelectronics conference (IMOC 2011) (IEEE), 449–452. doi:10.1109/IMOC.2011.6169247
Brown, F. A. (1983). The biological clock phenomenon: exogenous timing hypothesis. Biol. Rhythm Res. 14, 137–162. doi:10.1080/09291018309359807
Chaplin, M. F. (2000). A proposal for the structuring of water. Biophys. Chem. 83, 211–221. doi:10.1016/S0301-4622(99)00142-8
Chattopadhyay, M., Krok, E., Orlikowska, H., Schwille, P., Franquelim, H. G., and Piatkowski, L. (2021). Hydration layer of only a few molecules controls lipid mobility in biomimetic membranes. J. Am. Chem. Soc. 143 (36), 14551–14562. doi:10.1021/jacs.1c04314
Cifra, M., and Pospíšil, P. (2014). Ultra-weak photon emission from biological samples: definition, mechanisms, properties, detection and applications. J. Photochem. Photobiol. B, Biol. 139, 2–10. doi:10.1016/j.jphotobiol.2014.02.009
Gadre, S. R., Yeole, S. D., and Sahu, N. (2014). Quantum chemical investigations on molecular clusters. Chem. Rev. 114 (24), 12132–12173. doi:10.1021/cr4006632
Gallep, C. M. (2014). Ultraweak, spontaneous photon emission in seedlings: toxicological and chronobiological applications. Luminescence 29 (8), 963–968. doi:10.1002/bio.2658
Gallep, C. M. (2023). “Autoluminescence in seedlings: applications,” in Ultra-weak photon emission from biological Systems: endogenous biophotonics and intrinsic bioluminescence (Cham: Springer International Publishing), 305–312. doi:10.1007/978-3-031-39078-4_18
Gallep, C. M., Barlow, P. W., Burgos, R. C., and van Wijk, E. P. (2017). Simultaneous and intercontinental tests show synchronism between the local gravimetric tide and the ultra-weak photon emission in seedlings of different plant species. Protoplasma 254, 315–325. doi:10.1007/s00709-016-0947-1
Gallep, C. M., and Dos Santos, S. R. (2007). Photon-counts during germination of wheat (Triticum aestivum) in wastewater sediment solutions correlated with seedling growth. Seed Sci. Technol. 35 (3), 607–614. doi:10.15258/sst.2007.35.3.08
Gallep, C. M., Moraes, T. A., Červinková, K., Cifra, M., Katsumata, M., and Barlow, P. W. (2014). Lunisolar tidal synchronism with biophoton emission during intercontinental wheat-seedling germination tests. Plant Signal. Behav. 9 (5), e28671. doi:10.4161/psb.28671
Gallep, C. M., Moraes, T. A., Dos Santos, S. R., and Barlow, P. W. (2013). Coincidence of biophoton emission by wheat seedlings during simultaneous, transcontinental germination tests. Protoplasma 250, 793–796. doi:10.1007/s00709-012-0447-x
Gallep, C. M., Moraes, T. A., Juliao, G. O., and Santos, S. R. (2007). “Rhythmicities in the spontaneous photon emission of wheat seedlings,” in 2007 SBMO/IEEE MTT-S international microwave and optoelectronics conference (IEEE), 713–715. doi:10.1109/IMOC.2007.4404360
Gallep, C. M., and Robert, D. (2020). Time-resolved ultra-weak photon emission as germination performance indicator in single seedlings. J. Photochem. Photobiol. 1, 100001. doi:10.1016/j.jpap.2020.100001
Gallep, C. M., and Robert, D. (2022). Are cyclic plant and animal behaviours driven by gravimetric mechanical forces? J. Exp. Bot. 73 (4), 1093–1103. doi:10.1093/jxb/erab462
Gallep, C. M., Viana, J. F., Cifra, M., Clarke, D., and Robert, D. (2018). Peter Barlow’s insights and contributions to the study of tidal gravity variations and ultra-weak light emissions in plants. Ann. Bot. 122 (5), 757–766. doi:10.1093/aob/mcx176
Hayashi, T. (2021). Water at interfaces: its behavior and roles in interfacial phenomena. Chem. Lett. 50 (6), 1173–1180. doi:10.1246/cl.210049
Jiang, J., Guo, L., Tang, L., and Zhang, Y. (2021). The manner and extent to which the hydration shell impacts interactions between hydrated species. Phys. Chem. Chem. Phys. 23 (36), 20496–20508. doi:10.1039/D1CP03368A
Longman, I. M. (1959). Formulas for computing the tidal accelerations due to the moon and the sun. J. Geophys. Res. 64, 2351–2355. doi:10.1029/JZ064i012p02351
Luo, Z., Xiao, H., Peng, X., Li, Y., Zhu, Z., Tian, Y., et al. (2020). Long-range ordered water correlations between A–T/C–G nucleotides. Matter 3 (3), 794–804. doi:10.1016/j.matt.2020.08.001
Moraes, T. A., Barlow, P. W., Klingelé, E., and Gallep, C. M. (2012). Spontaneous ultra-weak light emissions from wheat seedlings are rhythmic and synchronized with the time profile of the local gravimetric tide. Naturwissenschaften 99, 465–472. doi:10.1007/s00114-012-0921-5
Moraes, T. A., Garofalo, R. T., Ramos, S. R., de Carvalho Martins, L., and Gallep, C. M. (2009). “Day-and month-like rhythms of biophoton emission in seedlings,” in Progress in electromagnetics research symposium 2009 Moscow, session 5P6 biophotonics: basis and applications, 1014.
Naserifar, S., and Goddard, W. A. (2019). Liquid water is a dynamic polydisperse branched polymer. Proc. Natl. Acad. Sci. 116 (6), 1998–2003. doi:10.1073/pnas.1817383116
Poplová, M., Prasad, A., Van Wijk, E., Pospíšil, P., and Cifra, M. (2023). Biological auto (chemi) luminescence imaging of oxidative processes in human skin. Anal. Chem. 95 (40), 14853–14860. doi:10.1021/acs.analchem.3c01566
Pospíšil, P. (2014). “Ultra-weak photon emission from living systems - from mechanism to application,”J. Photochem. Photobiol. B Biol., 139, 1–84. doi:10.1016/j.jphotobiol.2014.06.013
Sturrock, P. A., Fischbach, E., and Jenkins, J. (2014). Analysis of beta-decay rates for Ag108, Ba133, Eu152, Eu154, Kr85, Ra226, and Sr90, measured at the Physikalisch-Technische Bundesanstalt from 1990 to 1996. Astrophysical J. 794, 42. doi:10.1088/0004-637X/794/1/42
Tanaka, M., Morita, S., and Hayashi, T. (2021). Role of interfacial water in determining the interactions of proteins and cells with hydrated materials. Colloids Surfaces. B, Biointerfaces 198, 111449. doi:10.1016/j.colsurfb.2020.111449
Volodyaev, I., van Wijk, E., Cifra, M., and Vladimirov, Y. A. (2023). Ultra-weak photon emission from biological Systems: endogenous biophotonics and intrinsic bioluminescence. Springer. doi:10.1007/978-3-031-39078-4
Zürcher, E. (2001). Lunar rhythms in forestry traditions—lunar-correlated phenomena in tree biology and wood properties. Earth Moon Planets 85–86, 463–478. doi:10.1023/A:1017018821490
Keywords: bioluminescence, photon count, germination, gravity tide, sensing
Citation: Gallep CdM (2024) Auto-luminescence in seedlings: possible indicators for the gravimetric tide?. Front. Photonics 5:1421686. doi: 10.3389/fphot.2024.1421686
Received: 22 April 2024; Accepted: 16 July 2024;
Published: 06 August 2024.
Edited by:
Marcelo Victor Pires de Sousa, D'Or Institute for Research and Education (IDOR), BrazilReviewed by:
Frantisek Baluska, University of Bonn, GermanyCopyright © 2024 Gallep. This is an open-access article distributed under the terms of the Creative Commons Attribution License (CC BY). The use, distribution or reproduction in other forums is permitted, provided the original author(s) and the copyright owner(s) are credited and that the original publication in this journal is cited, in accordance with accepted academic practice. No use, distribution or reproduction is permitted which does not comply with these terms.
*Correspondence: Cristiano de Mello Gallep, Z2FsbGVwQGZ0LnVuaWNhbXAuYnI=
Disclaimer: All claims expressed in this article are solely those of the authors and do not necessarily represent those of their affiliated organizations, or those of the publisher, the editors and the reviewers. Any product that may be evaluated in this article or claim that may be made by its manufacturer is not guaranteed or endorsed by the publisher.
Research integrity at Frontiers
Learn more about the work of our research integrity team to safeguard the quality of each article we publish.