
95% of researchers rate our articles as excellent or good
Learn more about the work of our research integrity team to safeguard the quality of each article we publish.
Find out more
BRIEF RESEARCH REPORT article
Front. Photonics , 03 September 2024
Sec. Biophotonics
Volume 5 - 2024 | https://doi.org/10.3389/fphot.2024.1418246
 Valerie Xinhui Teo1†
 Savitha Dhandapani2†Randall Ang Jie1
 Vidya Susan Philip2Mark Teo Ju Teng1
 Shuyan Zhang3
 Bong Soo Park2*Malini Olivo1*
 U. S. Dinish1*
Leafy vegetables are widely consumed around the world for their rich nutritional qualities. To ensure a reliable and cost-effective supply of leafy vegetables in the future, advancements in their production are essential. Deficiencies of nitrogen (N), phosphorus (P), and potassium (K) impair growth of leafy vegetables and the ensuing visual symptoms make the plants unmarketable. We studied the use of non-contact large area hyperspectral imaging (HSI) for early detection of N, P and K deficiencies in the leafy vegetable, Choy Sum, before the appearance of visual symptoms. The wide spectral data of 500–900 nm extracted from the plants were subjected to advanced feature mining, facilitating the creation of novel spectral indices tailored to each vital nutrient by leveraging the Pearson’s correlations of 0.85 for N, 0.64 for P, and 0.68 for K with gold standard elemental concentration data. Early detection of deficiencies and timely replenishment of macronutrient(s) can prevent the development of obvious symptoms and thus maintain the visual quality of Choy Sum. These newly created spectral indices hold the potential to provide non-destructive estimation of nutrient content in plants, offering a promising avenue for future advancements in precision agriculture and resource-efficient crop management.
Nitrogen (N), phosphorus (P), and potassium (K) are vital macronutrients for plants, essential for growth and cellular functions. Three macronutrient deficiencies impact crop yield significantly. These deficiencies are addressed using synthetic fertilizers, but this leads to environmental issues like greenhouse gas emissions (Burney et al., 2010) and aquatic eutrophication (Vitousek et al., 2009). For balanced crop yield and reduced environmental harm, early detection and optimized fertilizer application are crucial.
Nitrogen deficiency manifests as leaf yellowing due to chlorophyll degradation. Phosphorus-deficient plants display purple discoloration from anthocyanin buildup. Potassium-deficient plants have yellowed/brown leaf edges (Veazie et al., 2020). However, diagnosing these signs requires expertise, and assessing the deficiency’s degree is challenging. Farmers often miss early detection, while traditional nutrient evaluation methods are time-consuming, destructive, and costly (Li et al., 2023). Early detection and intervention can mitigate damage and maintain yield, reducing environmental impacts. In leafy vegetables, nutrient deficiencies not only hinder growth but create visible quality-degrading symptoms, resulting in economic losses. Early deficiency detection in leafy vegetables is therefore crucial.
The global demand for sustainable agriculture is an escalating challenge that necessitates the exploration of cutting-edge technologies for crop improvement and yield maximization. The agricultural sector has made notable strides in utilizing modern tools for plant phenotyping, particularly regarding nutrient management (Williams et al., 2023; Yang et al., 2023). Among these, hyperspectral imaging (HSI) stands out as an indispensable technique that offers transformative potential in agricultural practices as it is inexpensive, reliable in situ analysis with unparalleled detail, and non-destructive (Grieco et al., 2021). Previous research has indicated the usability of HSI in assessing various physiological attributes like nutrient status, disease resistance, and various abiotic stress responses (Takehisa et al., 2022; De Silva et al., 2023). HSI has successfully estimated N, P, and K contents in various plants including tea leaves (Wang et al., 2020a; Wang et al., 2020b), Valencia-Orange (Osco et al., 2020), maize (Pandey et al., 2017), soybean (Pinit et al., 2022), rice (Pinit et al., 2022), and wheat (Mahajan et al., 2014). On the other hand, in leafy vegetables, HSI has been extensively used only to measure the levels of contaminants like Escherichia coli, slugs, worms, faecal matter (Siripatrawan et al., 2011; Mo et al., 2017; Cho et al., 2018), water potential (Tung et al., 2018), shelf-life (Simko et al., 2015) except for its application in assessing the nutritional status of lettuce (Eshkabilov et al., 2021; Eshkabilov et al., 2022; Pandey et al., 2023). In lettuce studies focusing on nutrition deficiencies, plants were subjected to deficient conditions for a long time (3–8 weeks) and the HSI were done after plant harvest (Eshkabilov et al., 2021; Eshkabilov et al., 2022; Pandey et al., 2023). To our knowledge, the use of HSI for early detection of nutrient deficiencies in leafy vegetables is unexplored, making it an emerging frontier.
In our study, we explored non-invasive HSI to monitor early deficiencies of N, P, and K in Choy Sum. We formulated a diagnostic method correlating HSI signals with elemental concentrations during initial deficiencies. The uniqueness of our work lies in the application of feature mining, a data-driven technique, to develop a diagnostic method that correlates HSI signals with elemental concentrations during initial deficiencies. Using HSI for early nutrient deficiency detection could revolutionize sustainable, productive agriculture. By automating data collection, processing, and fertilizer recommendations, our study bridges plant science, remote sensing, and data analytics, advancing technological applications in agriculture.
Seeds of Choy Sum (Brassica rapa var. parachinensis) were surface sterilized and sown onto 0.8% agar media containing Murashige and Skoog (MS) salts, 1% (w/v) sucrose and 2.5 mM MES, pH 5.6. After imbibition at 4°C/dark for 1 day, seedlings were germinated in a growth chamber at 22°C with 60% relative humidity and a 16 h light/8 h dark cycle with a light intensity of 100 μmol·m−2·s−1. After 7 days, Choy Sum seedlings were transplanted to hydroponic trays containing 3 L of Hoagland’s solution with each tray holding six plants. The plants were placed in a growth chamber for the next 2 weeks under the same chamber conditions used for seed germination and the nutrient solution was renewed every 4 days. All plant experiments comply with local and national guidelines and regulations. For all experiments, samples were collected from six plants representing each growth condition. Two plants were combined into one replicate, resulting in three biological replicates per experiment. Each experiment was repeated three times using different biological samples.
On Day 0, HSI data was collected from leaves #3 and #4 of six plants growing under sufficient-medium conditions. The selection of leaves #3 and #4 was strategic, considering nutrient remobilization during nutrient stress. These older leaves are key indicators of the nutritional status in plants. By focusing on these leaves, we aimed to detect the N, P, and K deficient response from older to younger tissues. Next, leaf discs were taken for qRT-PCR analysis and frozen immediately in liquid nitrogen. Similarly, leaf discs were taken for chlorophyll and anthocyanin analyses and the rest of the leaves were dried in an oven at 65°C for N, P, and K determination. The nutrients solutions for the remaining plants were replaced as follows. For the control trays, the old nutrient solution was replaced with fresh sufficient media. Similarly, for -N, -P, and -K trays, N, P, and K content were reduced to 0 mM, respectively. For the -NPK treatment, the nutrient solution was devoid of N, P, and K. Four trays were used for each condition.
On Day 4, HSI data were collected from six plants under each specific condition, and the leaves were processed for various analyses as described above. The nutrient solutions in all the trays were again replaced with sufficient medium and the plants were allowed to grow for another 4 days under recovery conditions.
On Day 8, HSI data were once again collected from six plants under each condition, and the leaves were processed for various analyses as described above.
Chlorophyll levels were measured as previously described (Porra et al., 1989). Total chlorophyll levels (mg·g-1 FW) were calculated from 80% (v/v) acetone extracts using the equation: [(8.29 x Absorbance663nm) + (19.54 x Absorbance646nm)] x [extraction volume (mL)/(1,000 x sample weight (g)]. Anthocyanin levels were measured as previously described (Porra et al., 1989).
For N, P and K elemental analysis, the leaves were dried at 60°C and ground into a fine powder. N determination was carried out using the organic elemental analyzer - vario EL cube (Elementar, Langenselbold, Germany). For the measurement of P and K contents, samples were prepared and analyzed using Agilent 720 Inductively Coupled Plasma–Optical Emission Spectrometry (ICP-OES; Agilent, Santa Clara, California, United ) as described in previous research (Suraby et al., 2023).
Total RNA isolation cDNA synthesis, and qRT-PCR were carried out as described in existing research (Dhandapani et al., 2023). The primers used in this study are given in Supplementary Table S1.
The experimental setup utilized a single aluminum frame mounted on top of two tripods (Brand: Tristar), creating a gantry-like configuration (Figure 1A). A Senop HSC–2.1-C camera was employed to capture spectral reflectance measurements across a wavelength range of 500–900 nm, acquiring 400 spectral bands (Figure 1B). The camera was securely housed in a custom-designed black aluminum casing attached to the aluminum frame. It had a field of view of 36.8 degrees, with a lens aperture set at f/4 and a focal length of 8 mm. For uniform illumination of the sample trays, two 120 W halogen lamps (RS Pro – 791-8,264) were strategically positioned on either side of the camera, emitting light across a spectrum of 350–3600 nm.
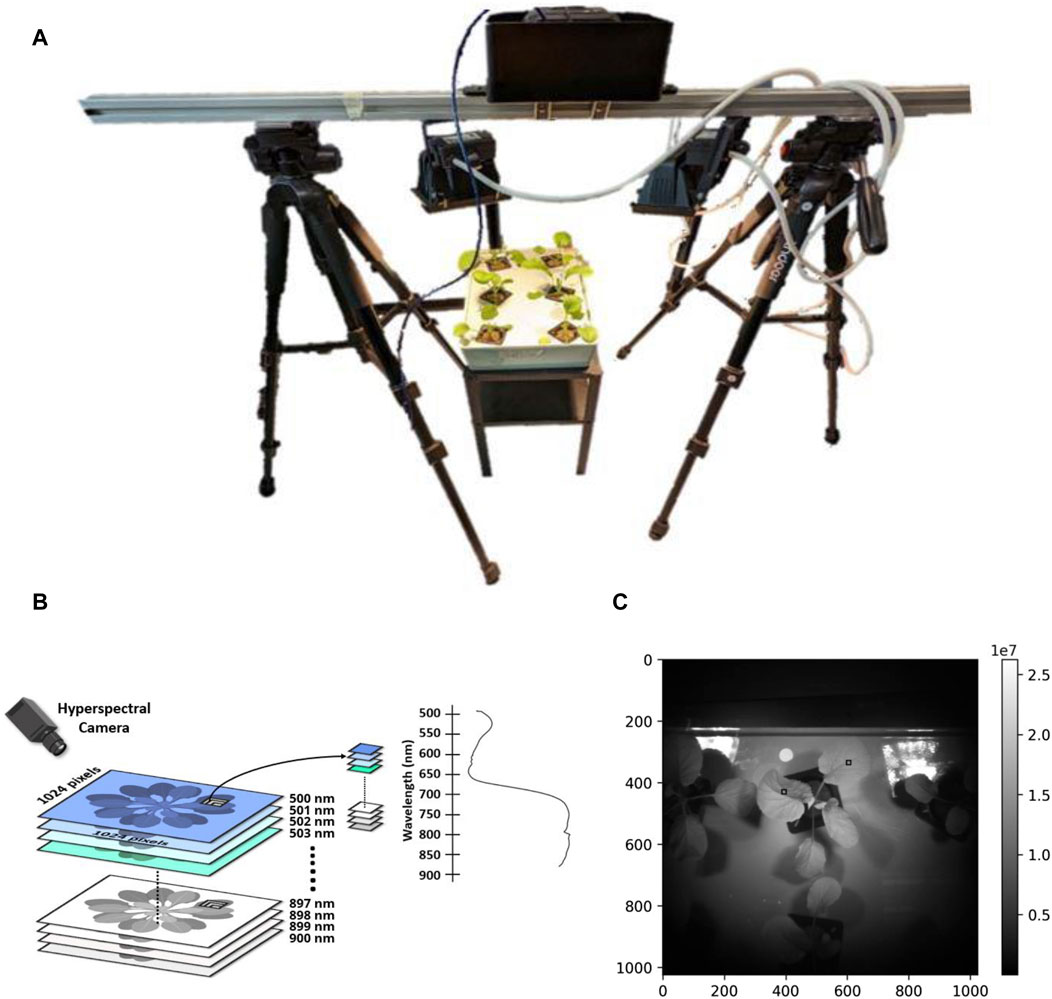
Figure 1. Hyperspectral detection of nutrients. (A) Schematic representation of the experimental setup featuring the aluminium frame, Senop HSC–2.1-C camera, halogen lamps, and custom-designed casing for hyperspectral data acquisition. (B) Composite visual representation presenting an image of the plant sample alongside the corresponding hyperspectral spectra, illustrating the comprehensive spectral information collected during the experiment. (C) Sample image captured from Senop Camera. 10 × 10 pixel black boxes indicate selected ROIs.
The camera’s proprietary software (Senop HSC-2) facilitated camera control and data visualization. The process of extracting samples using the HSI camera and software was meticulously executed. Initially, the camera was connected to the Senop software, and a live image along with a histogram was observed in the data visualization tab to ensure proper image exposure. The desired wavelengths (500–900 nm) and number of spectral bands (400 spectral bands) were defined and displayed in the data visualization tab. The exposure time was set to 20 m, and the camera operated in live mode to observe the sample. The snapshot function was used to capture the desired frames as defined by the settings. Finally, the captured data was saved as a measured data cube and stored for further analysis in dat and hdr file formats.
The frame-based spectral system was capable of capturing comprehensive snapshot images of the plant samples with settings configured to a 10-bit depth. At a distance of 70 cm, the lamps irradiated the plant with an intensity of 19.49 W·m-2. The hyperspectral image obtained had a resolution 1024 × 1024 pixels.
To account for intraleaf variations, ten 10 × 10 pixel bounding boxes were randomly chosen at various locations on a leaf sample for each of the growth conditions, including control, -N, -P, -K, -NPK on Day 4. The size of the bounding box was chosen because some leaves were smaller due to nutrient deficiencies. This sampling method ensured that the analysis captured a representative range of variation within individual leaves. The spectra within each bounding box were normalized using the corresponding coordinates of white and dark reference (Equation 1) to account for variations in illumination and sensor response. Normalization effectively corrected uneven illumination and bidirectional distribution function characteristics of leaves. This ensured that the resulting spectra accurately reflected the intrinsic properties of the sample. Following normalization, the quality of the spectra was further enhanced by employing a Savitzky-Golay filter for smoothening. Then, the spectra within the defined bounding box of each leaf sample for each condition were summed, resulting in ten representative spectra per leaf.
where I represented the acquired spectra, D was the dark reference collected by covering the camera shutter, and W was the white reference obtained using SphereOptics Zenith Polymer®, positioned at the same height as the leaves to ensure that the illumination accurately reflected the conditions the leaves were subjected to.
An Analysis of Variance (ANOVA) test was conducted to compare the spectra of different locations on each leaf. The ANOVA test provided the F-statistic, which measures the ratio of variance between the groups to the variance within the groups. Additionally, the degrees of freedom for both between-group and within-group comparisons were calculated, along with the p values, which indicate the statistical significance of the observed differences among the various locations on the leaf.
By comparing the p values from the ANOVA test, we determined if there were significant intraleaf variations. The ANOVA test evaluated the null hypothesis that there were no significant differences within the leaf. A low p-value (<0.05) indicated that the null hypothesis could be rejected, suggesting significant differences within the leaf. Conversely, a high p-value suggested that any observed differences were not significant. All data can be found in Supplementary Table S2. It was found that there were no significant intraleaf variations after preprocessing.
From the hyperspectral images, a 10 × 10 pixel bounding box was defined to encapsulate the regions of interest (ROI), from which spectral data were subsequently obtained (Figure 1C). This resulted in a total of 200 spectra per plant. These spectra were preprocessed as mentioned in the previous section, resulting in a consolidated spectral representation considered representative of the leaf and consequently, the plant. This representative spectrum served as the basis for all subsequent analyses in our study, ensuring that our findings accurately reflected the overall spectral characteristics of the plant specimens under investigation.
To derive novel spectral indices for assessing plant nutrient content, we drew upon established plant indices as a foundation and systematically devised a range of potential indices, including both two-band and three-band indices, as shown in Table 1. We explored various mathematical operations, including simple arithmetic and exponential functions, to model nutrient growth and decay dynamics. Additionally, we examined several potential indices in a normalized format, as research has indicated that normalization significantly mitigates the impact of sensor calibration degradation (Bannari et al., 1996). This normalization approach aligns with established practices in the development of plant indices and highlights its common usage in its analytics (Gitelson et al., 1996). Subsequently, the spectral data from two plants were combined, resulting in three samples per nutrient per experimental day, totaling 39 samples across the entire study period (from Day 0 to Day 8).

Table 1. Potential indices for N, P, and K quantification.
We then embarked on a comprehensive feature mining spanning the spectral range of 500–900 nm. This process involved systematically testing numerous combinations of reflectance intensities at various wavelengths, evaluating the spectral information at each discrete point. By doing so, we aimed to identify the specific combination of wavelengths that, when used to calculate the respective nutrient index using their respective reflectance intensities, exhibited the strongest Pearson’s correlation with the N, P, and K concentrations determined using the gold standard elemental concentration analysis. Through this rigorous evaluation process, we identified the index with the highest correlation coefficient relative to the gold standard elemental concentration analysis. We then collated the wavelengths corresponding to each nutrient to formulate the final index for estimating nutrient concentrations within plant specimens.
To validate the index, Pearson’s correlation coefficient was calculated between the estimated nutrient content (obtained from the index using the spectra averaged from three representative samples for each growth condition on their respective days) and the corresponding gene expression data. This analysis provided the R-value, R2-value, and p-value for the correlation.
First, we investigated the effects of 4-day -N/-P/-K/-NPK treatment on plant growth and observed that growth rate of the -N/-P/-K/-NPK treated plants did not differ from the control plants (D4; Figure 2A). In addition, leaf yellowing, leaves turning purple, and browning of the leaf margins, the visual symptoms of N, P, and K deficiencies, respectively, were also absent in the -N/-P/-K/-NPK treated plants on Day 4. In other words, for visual inspection, the leaf color of both the control and the treated plants appeared comparable (Figure 2A). Since the plant morphology was unaffected by the 4-day nutrient deficiency treatment, the replenishment of the missing nutrients in the recovery media on Day 4 forestalled the further development of visual symptoms. Thus, by Day 8, the treated plants remained indistinguishable from the control plants (D8; Figure 2A).
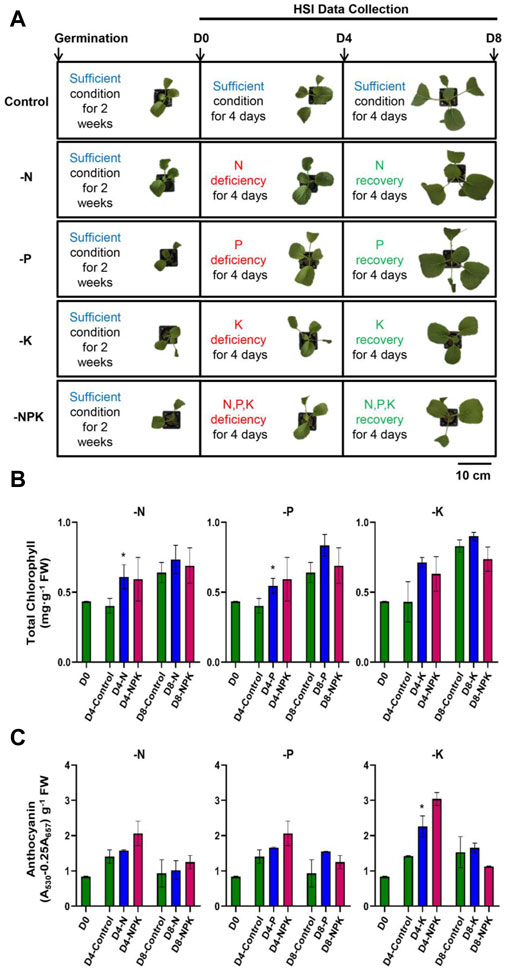
Figure 2. Plant growth and leaf color were not altered during early stages of nutrient deficiency. (A) The experimental plan and the morphological phenotype of the plants grown under control, deficient and recovery conditions. Representative images of plants are shown here. Analysis of total chlorophyll (B) and total anthocyanin (C) in plants grown under control, N, P, K, and NPK deficient, and recovery conditions. Values are mean ± SD, n = 3 (two plants pooled into one replicate). Asterisks indicate statistical difference as determined by two-tailed t-test (*p < 0.05). The p values are given in Supplementary Table S3.
Next, we examined the total chlorophyll content and total anthocyanin content in the control and -N/-P/-K/-NPK treatment plants. The results demonstrated no statistically significant difference in the total chlorophyll content and total anthocyanin content of -N/-P/-K/-NPK treated plants compared to the control plants on Day 4 (Figures 2B, C). As expected, consistent with the similarity observed between control and -N/-P/-K/-NPK treated plants on Day 8, the chlorophyll and anthocyanin contents were also not substantially different between control and -N/-P/-K/-NPK treated plants (Figures 2B, C).
Despite no differences in growth rate, chlorophyll, and anthocyanin contents on Day 4, the elemental concentrations of N, P, and K in -N/-P/-K/-NPK treated plants were significantly lower compared to the control plants (Figure 3A). Concurrently, on Day 4, transcript levels of the nitrogen starvation-induced genes (EIN3, ORE1, and SAG29), phosphate starvation-induced genes (PHR1, IPS1, and PAP1) and potassium starvation-induced genes (HAK5, KUP3, and KEA5) were significantly higher in plants grown under -N, -P, and -K, conditions, respectively, compared to the control plants (Figures 3B–D). The mRNA levels of N/P/K starvation-induced genes were also upregulated in -NPK treated plants on Day 4. Interestingly, when the plants were returned to sufficient conditions of N, P, and K and the mRNA levels of the nutrient deficiency-marker genes had recovered on Day 8 (Figures 3B–D).
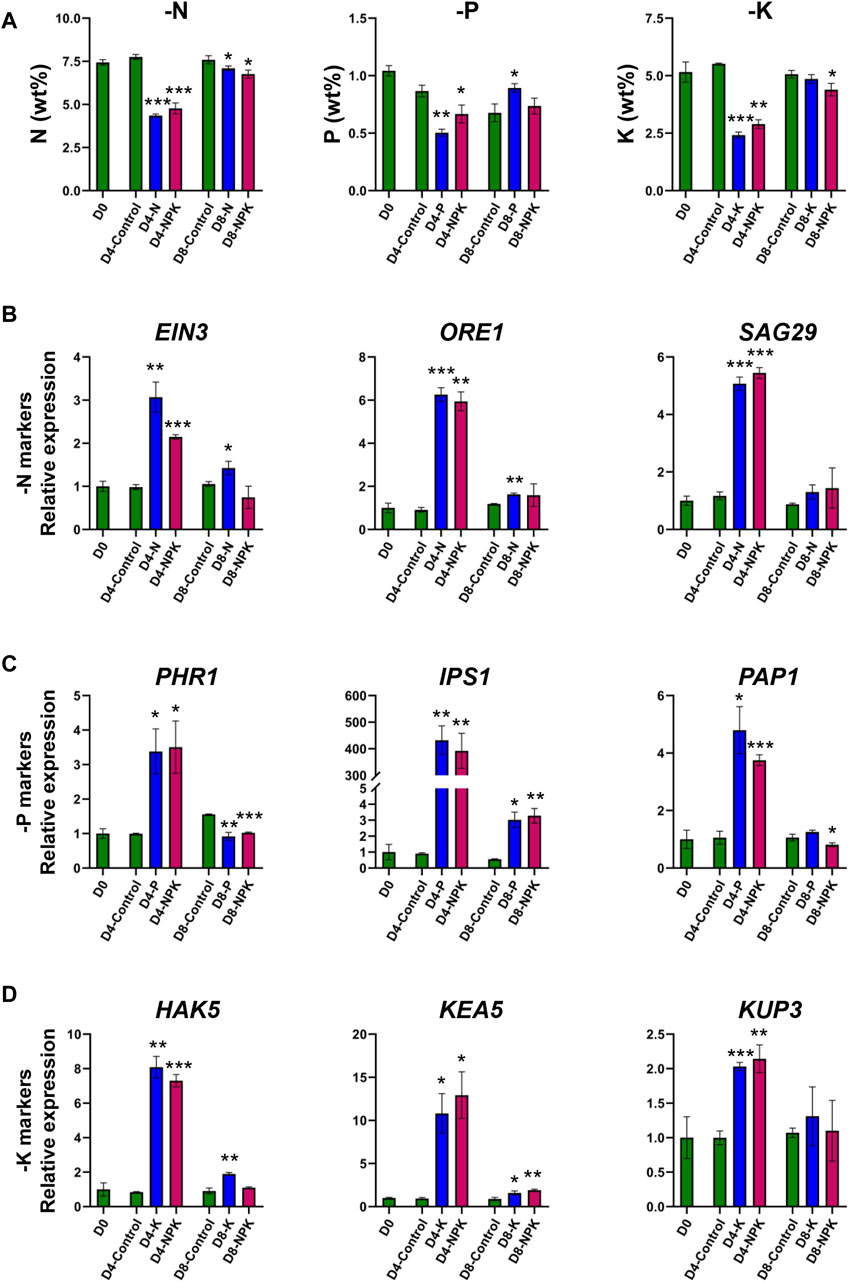
Figure 3. Elemental concentrations and gene expression were altered during early stages of nutrient deficiency. (A) Elemental concentrations of N, P, and K in plants grown under control, N, P, K, and NPK deficient, and recovery conditions. Values are mean ± SD, n = 3 (two plants pooled into one replicate). Transcript levels of nitrogen deficiency markers (B), phosphate deficiency markers (C), and potassium deficiency markers (D) in plants grown under control, N, P, K, and NPK deficient, and recovery conditions. EIN3, ethylene-insensitive 3; ORE1, ORESARA1; SAG29, senescence-associated gene 29; PHR1, phosphate starvation response 1; IPS1, induced by phosphate starvation 1; PAP1, production of anthocyanin pigment 1; HAK5, high affinity K+ transporter 5; KUP3, potassium transporter; KEA5, K+ efflux antiporter 5. Values are mean ± SD, n = 3 (two plants pooled into one replicate). Asterisks indicate statistical differences as determined by two-tailed t-test (*p < 0.05, **p < 0.01, ***p < 0.001). The p values are given in Supplementary Table S4.
Based on these findings, we analyzed the spectral data obtained from the plant specimens (Figure 4A). Among the range of indices explored in the Materials and Methods section, one index demonstrated the strongest correlation with gold standard elemental concentrations data for all nutrients (Equation 2).
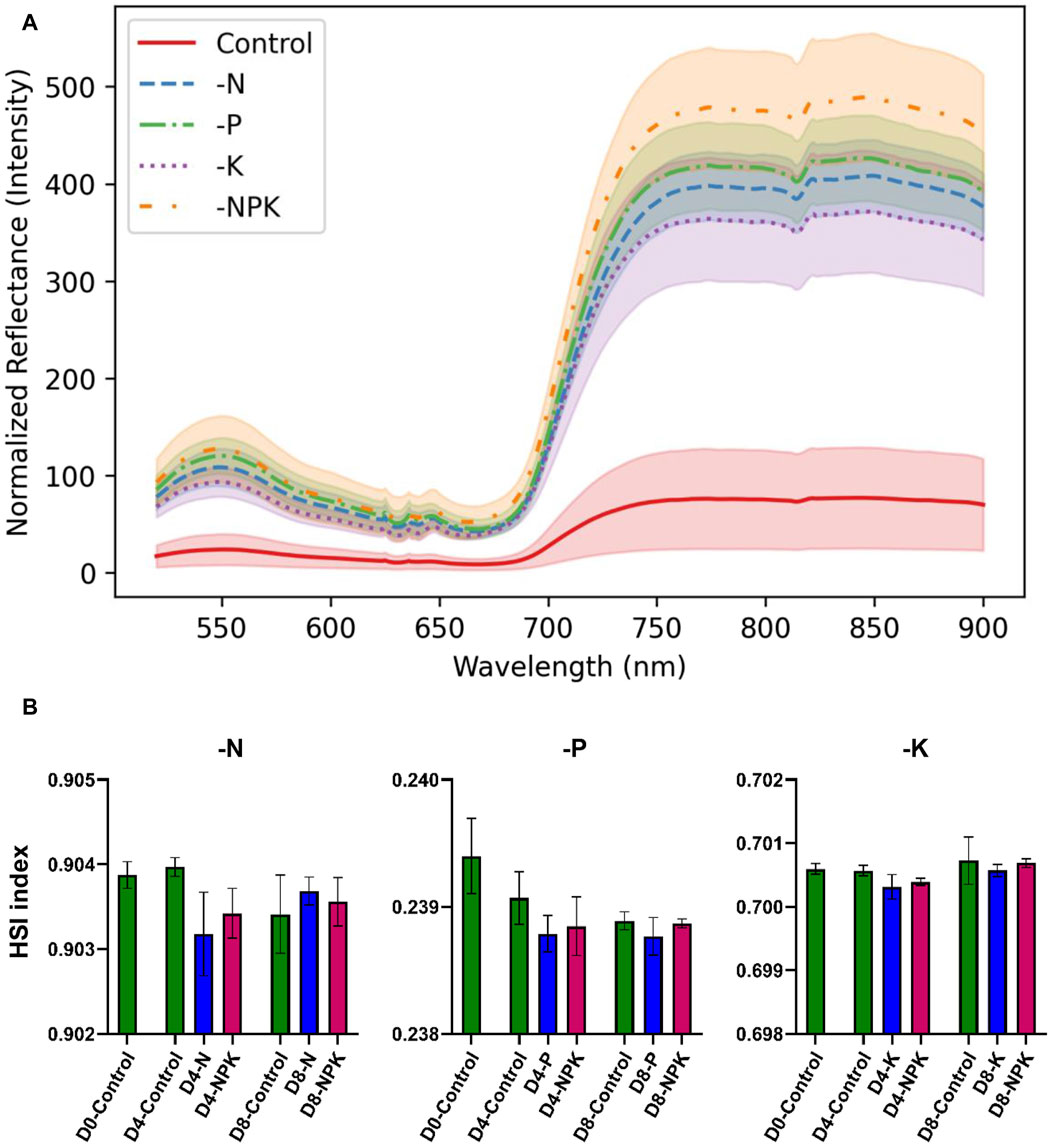
Figure 4. Detection of nutrients using hyperspectral imaging. (A) Representative averaged spectra obtained from plant samples on Day 4. (B) Analysis of N, P, and K content using optimized HSI indices. Statistical differences were determined by a two-tailed t-test. The p values are given in Supplementary Table S5.
This index showed significant correlations of 0.85 (p-value: 5.17e-12) for N, 0.64 (p-value: 1.12e-5) for P, and 0.68 (p-value: 2.09e-6) for K to the elemental concentrations of N, P, and K, respectively. Optimized wavelengths for assessing key nutrients in plants were identified. Specifically, wavelengths at 836, 850, and 853 nm were pinpointed for N assessment (Table 1). For differentiation of P content, wavelengths at 821, 824, and 862 nm were identified. Similarly, wavelengths at 620, 646, and 678 nm were found to be optimized for assessing K content. This is illustrated in Figure 4B, where the observed trends align with the experimental design, depicting nutrient deficiency on Day 4 and nutrient recovery on Day 8.
All estimated N, P, and K nutrients from the index (Equation 2) showed negative correlation with their respective gene expression data as shown in Table 2. Specifically, for N, the genes EIN3, ORE1, and SAG29 exhibited weaker negative correlations with R-values of −0.27, −0.26, and −0.19, respectively, and none of these correlations were statistically significant (p values > 0.5). For phosphorus (P), the genes PHR1, IPS1, and PAP1 also showed weak negative correlations, with R-values of −0.28, −0.26, and −0.27, respectively, and similarly, these were not statistically significant (p values > 0.5). In contrast, the potassium (K) genes showed stronger negative correlations, particularly for HAK5, which had an R-value of −0.81 and a significant p-value of 0.026. KEA5 and KUP3 had R-values of −0.69 and −0.72, respectively, with p values of 0.085 and 0.070, indicating moderate negative correlations but not reaching statistical significance. These results show an overall trend of inverse relationship between the estimated nutrient content and gene expression levels, with potassium-related genes showing the strongest correlations.
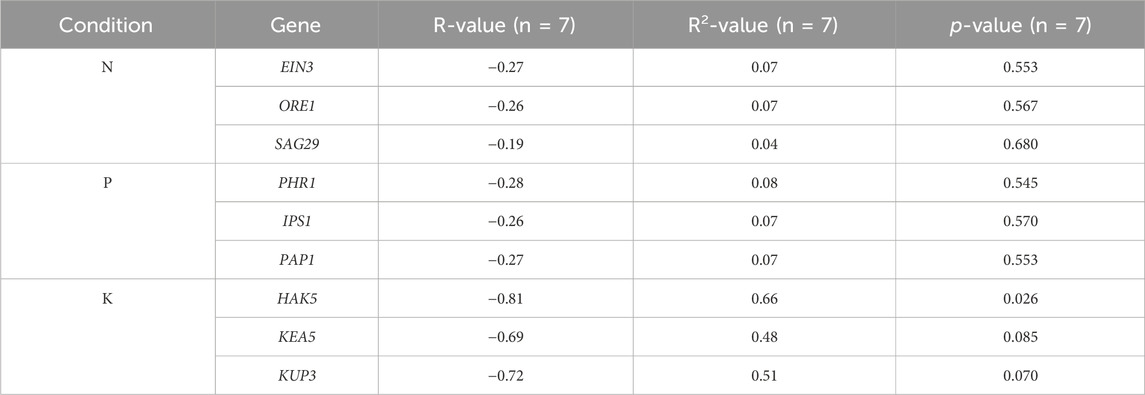
Table 2. Correlation of nutrient index and gene expression.
Our research highlights the potential of HSI technology for early detection of macronutrient deficiencies in crops. In Choy Sum, HSI identified deficiencies before visible symptoms appeared. This early detection is crucial for prompt intervention to maintain optimal crop health and yield. Nutrient deficiencies significantly impact the quality of leafy vegetables, leading to potential economic losses (de Bang et al., 2021). Visible symptoms often manifest only after prolonged exposure to deficiencies. Pak Choi, a relative of Choy Sum in the B. rapa family, exhibited deficiencies in N and K levels 11 days after being transplanted into deficient conditions and P deficiencies after 16 days (Vitousek et al., 2009). Studies have documented notable reductions in chlorophyll and increases in anthocyanin levels after approximately 14 days (Juszczuk et al., 2004). Despite the absence of immediate phenotypic changes in -N/-P/-K/-NPK treatments on Day 4 (Figure 2), reductions in elemental concentrations and increased expression of deficiency marker genes on Day 4 (Figure 3) indicate earlier molecular responses. This highlights the critical importance of early nutrient supplementation in preventing long-term damage to plants.
The process of selecting wavelengths through feature mining in our study provides a significant advantage by allowing the use of a narrower bandwidth for analysis compared to the entire hyperspectral image. It is unsurprising that the selected wavelengths are within specific ranges: the 630–690 nm range is absorbed by chlorophyll, while the 760–900 nm range is strongly reflected by leaf cellular structures (Gitelson et al., 1996). Moreover, incorporating exponential functions into the most effective index aligns with their mathematical utility in realistically modelling both growth dynamics and responses to nutrient deficiencies (Werf et al., 1993; Litaor et al., 2008). This strategic selection of wavelengths not only optimizes the spectral information for nutrient assessment but also carries practical implications, particularly in real-world applications. By focusing on a subset of wavelengths, computational efficiency is greatly enhanced, leading to faster and more streamlined data processing. In precision agriculture and agricultural management scenarios, where timely decisions are imperative, this reduction in computational time provides significant benefits.
In contrast to conventional analysis methods such as Partial Least Squares Regression (PLSR) demonstrated in several prior studies (Wang et al., 2020a; Wang et al., 2020b; Pandey et al., 2023), feature mining presents a more robust and versatile methodology for extracting pertinent information from hyperspectral data. It facilitates the identification of critical spectral features linked to nutrient deficiencies in plants. Unlike PLSR, which relies on linear modelling and may encounter challenges with intricate, nonlinear relationships within hyperspectral data, feature mining employs data-driven feature selection. This approach enables the extraction of meaningful patterns and relationships, even from high-dimensional hyperspectral datasets.
In comparing traditional methods of nutrient assessment with HSI technology for detecting nutrient deficiencies in Choy Sum, HSI offers significant advantages. Traditional methods, such as visual inspections, Inductively Coupled Plasma (ICP) testing, chlorophyll content measurement, and total anthocyanin content analysis, are typically time-consuming and destructive. They require laboratory analysis that may overlook early signs of deficiency. In contrast, HSI provides a non-contact, rapid, and non-destructive approach to capturing detailed spectral data across the range of 500–900 nm. This capability enables early detection of deficiencies before visible symptoms emerge. HSI technology reduces the time and cost associated with sample preparation and analysis. The development of novel spectral indices through feature mining further enhances the precision and practicality of HSI, positioning it as an effective alternative for efficient and proactive nutrient management in precision agriculture.
The inverse correlations observed between the estimated nutrient content and the gene expression data align with expectations, as these genes are known to respond to nutrient starvation. This suggests that the index effectively captures the anticipated trends, validating its methodology. However, while the overall trend is promising, the lack of statistically significant p values indicates the need for further investigation. This limitation is likely attributable to the small sample size, with only seven samples per nutrient, which may have constrained the statistical power of the analysis. Future research will focus on increasing the sample size and conducting studies on a larger scale to achieve more robust validation of the index, ensuring its reliability and accuracy across various conditions.
Consequently, these indices, characterized by their sensitivity to specific wavelengths associated with nutrient-related spectral features and structural attributes, have the potential to provide a suitable and effective means for quantifying nutrient content in Choy Sum plants. Their capability to promptly detect both nutrient deficiency and recovery phases emphasizes their effectiveness as valuable tools for real-time monitoring and management of plant nutrient status. This facilitates proactive nutrient management strategies in agricultural practices.
In conclusion, our study employed HSI technology for early detection of nutrient deficiencies in plants. The feature-mined indices (Equation 2) exhibited high sensitivity to early deficiencies in N, P, and K and demonstrated the capability to monitor nutrient replenishment (Table 1; Figure 4B). This ability can facilitate real-time analysis and prompt management of plant nutrition. However, it is important to acknowledge certain limitations in our findings. Environmental factors such as variable weather conditions and sunlight inconsistency can impact the accuracy of hyperspectral data. Further experiments are necessary to validate the developed index against gold standard elemental concentrations analyses of N, P, and K deficiencies beyond the current experimental dataset. Moreover, optimal indices may vary among different plant species, highlighting the need for more tailored research efforts. While our study focused on N, P, and K deficiencies, future investigations should explore other nutrients and a broader range of plant species on a larger scale. The wavelengths identified through feature mining also offer potential for developing an affordable and compact multispectral imaging system in future research, optimizing data collection for applications in agricultural settings. We are currently developing a distribution plot using our index to map nutrient distribution in leaves. Additionally, efforts are underway to establish an automated and robust selection and analysis of ROI, which is crucial for automating the screening process for early nutrient deficiencies in plants.
By integrating principles from plant science, remote sensing, and data analytics, our research emphasizes the value of real-time automated surveillance of crop health. This advancement marks a transition towards precision agriculture and accentuates the significance of HSI technology in modern agricultural practices.
The original contributions presented in the study are included in the article/Supplementary Material, further inquiries can be directed to the corresponding authors.
VT: Formal Analysis, Validation, Visualization, Writing–original draft, Writing–review and editing, Data curation, Investigation, Methodology. SD: Formal Analysis, Investigation, Validation, Visualization, Writing–original draft, Writing–review and editing, Methodology. RA: Data curation, Formal Analysis, Validation, Visualization, Writing–original draft, Writing–review and editing, Methodology. VP: Formal Analysis, Investigation, Writing–original draft, Writing–review and editing. MT: Methodology, Writing–original draft, Writing–review and editing. SZ: Formal Analysis, Validation, Visualization, Writing–original draft, Writing–review and editing. BP: Conceptualization, Funding acquisition, Project administration, Supervision, Writing–original draft, Writing–review and editing. MO: Conceptualization, Funding acquisition, Supervision, Writing–original draft, Writing–review and editing, Project administration. UD: Conceptualization, Supervision, Writing–original draft, Writing–review and editing, Funding acquisition, Project administration.
The author(s) declare that financial support was received for the research, authorship, and/or publication of this article. This work was supported by Agency of Science, Technology and Research (A∗STAR) under its Industry Alignment Fund Prepositioning Program, High Performance Precision Agriculture (HiPPA) Award, H19E4a0101.
The authors declare that the research was conducted in the absence of any commercial or financial relationships that could be construed as a potential conflict of interest.
The author(s) declared that they were an editorial board member of Frontiers, at the time of submission. This had no impact on the peer review process and the final decision.
All claims expressed in this article are solely those of the authors and do not necessarily represent those of their affiliated organizations, or those of the publisher, the editors and the reviewers. Any product that may be evaluated in this article, or claim that may be made by its manufacturer, is not guaranteed or endorsed by the publisher.
The Supplementary Material for this article can be found online at: https://www.frontiersin.org/articles/10.3389/fphot.2024.1418246/full#supplementary-material
Bannari, A., Morin, D., Bonn, F., and Huete, A. R. (1996). A review of vegetation indices. Remote Sens. Rev. 13, 95–120. doi:10.1080/02757259509532298
Burney, J. A., Davis, S. J., and Lobell, D. B. (2010). Greenhouse gas mitigation by agricultural intensification. Proc. Natl. Acad. Sci. 107, 12052–12057. doi:10.1073/pnas.0914216107
Cho, H., Kim, M. S., Kim, S., Lee, H., Oh, M., and Chung, S. H. (2018). Hyperspectral determination of fluorescence wavebands for multispectral imaging detection of multiple animal fecal species contaminations on romaine lettuce fluorescence wavebands for multispectral imaging detection of multiple animal fecal species contaminations on romaine lettuce. Food Bioprocess Technol. 11: 774–784. doi:10.1007/s11947-017-2032-y
de Bang, T. C., Husted, S., Laursen, K. H., Persson, D. P., and Schjoerring, J. K. (2021). The molecular– physiological functions of mineral macronutrients and their consequences for deficiency symptoms in plants. New Phytol. 229, 2446–2469. doi:10.1111/nph.17074
De Silva, A. L., Trueman, S. J., Kämper, W., Wallace, H. M., Nichols, J., and Hosseini Bai, S. (2023). Hyperspectral imaging of adaxial and abaxial leaf surfaces as a predictor of macadamia crop nutrition. Plants 12, 558. doi:10.3390/plants12030558
Dhandapani, S., Philip, V. S., Nabeela Nasreen, S. A. A., Tan, A. M. X., Jayapal, P. K., Ram, R. J., et al. (2023). Effects of storage temperatures on nitrogen assimilation and remobilization during post- harvest senescence of pak choi. Biomolecules 13, 1540. doi:10.3390/biom13101540
Eshkabilov, S., Lee, A., Sun, X., Lee, C. W., and Simsek, H. (2021). Hyperspectral imaging techniques for rapid detection of nutrient content of hydroponically grown lettuce cultivars. Comput. Electron. Agric. 181, 105968. doi:10.1016/j.compag.2020.105968
Eshkabilov, S., Stenger, J., Knutson, E. N., Küçüktopcu, E., Simsek, H., and Lee, C. W. (2022). Hyperspectral image data and waveband indexing methods to estimate nutrient concentration on lettuce (Lactuca sativa L.) cultivars. Sensors 22, 8158. doi:10.3390/s22218158
Gitelson, A., Merzlyak, M., and Lichtenthaler, H. (1996). Detection of red edge position and chlorophyll content by reflectance measurements near 700nm. J. Plant Physiology 148, 501–508. doi:10.1016/S0176-1617(96)80285-9
Grieco, M., Schmidt, M., Warnemünde, S., Backhaus, A., Klück, H.-C., Garibay-Hernández, A., et al. (2021). Dynamics and genetic regulation of leaf nutrient concentration in barley based on hyperspectral imaging and machine learning. Plant Sci. 315, 111123. doi:10.1016/j.plantsci.2021.111123
Juszczuk, I., Wiktorowska, A., Malusà, E., and Rychter, A. (2004). Changes in the concentration of phenolic compounds and exudation induced by phosphate deficiency in bean plants (Phaseolus vulgaris L.). Plant Soil 267, 41–49. doi:10.1007/s11104-005-2569-9
Li, X., Chen, Z., Wang, J., and Jin, J. (2023). LeafSpec-dicot: an accurate and portable hyperspectral imaging device for dicot leaves. Sensors 23, 3687. doi:10.3390/s23073687
Litaor, M., Seastedt, T., and Sackett, L. C. (2008). Nutrient status in alpine soils of the Colorado front range using the nitrogen/phosphorus ratio index. Soil Sci. Soc. Am. J. 72, 1628–1636. doi:10.2136/sssaj2006.0434
Mahajan, G. R., Sahoo, R. N., Pandey, R. N., Gupta, V. K., and Kumar, D. (2014). Using hyperspectral remote sensing techniques to monitor nitrogen, phosphorus, sulphur and potassium in wheat (Triticum aestivum L.). Precis. Agric. 15, 499–522. doi:10.1007/s11119-014-9348-7
Mo, C., Kim, G., Kim, M. S., Lim, J., Lee, K., Lee, W.-H., et al. (2017). On-line fresh-cut lettuce quality measurement system using hyperspectral imaging. Biosyst. Eng. 156, 38–50. doi:10.1016/j.biosystemseng.2017.01.005
Osco, L. P., Ramos, A. P., Faita Pinheiro, M. M., Moriya, É. A., Imai, N. N., Estrabis, N., et al. (2020). A machine learning framework to predict nutrient content in valencia-orange leaf hyperspectral measurements. Remote Sens. 12, 906. doi:10.3390/rs12060906
Pandey, P., Ge, Y., Stoerger, V., and Schnable, J. C. (2017). High throughput in vivo analysis of plant leaf chemical properties using hyperspectral imaging. Front. Plant Sci. 8, 1348. doi:10.3389/fpls.2017.01348
Pandey, P., Veazie, P., Whipker, B., and Young, S. (2023). Predicting foliar nutrient concentrations and nutrient deficiencies of hydroponic lettuce using hyperspectral imaging. Biosyst. Eng. 230, 458–469. doi:10.1016/j.biosystemseng.2023.05.005
Pinit, S., Ruengchaijatuporn, N., Sriswasdi, S., Buaboocha, T., Chadchawan, S., and Chaiwanon, J. (2022). Hyperspectral and genome-wide association analyses of leaf phosphorus status in local Thai indica rice. PLOS ONE 17, e0267304. doi:10.1371/journal.pone.0267304
Porra, R. J., Thompson, W. A., and Kriedemann, P. E. (1989). Determination of accurate extinction coefficients and simultaneous equations for assaying chlorophylls a and b extracted with four different solvents: verification of the concentration of chlorophyll standards by atomic absorption spectroscopy. Biochimica Biophysica Acta (BBA) - Bioenergetics 975, 384–394. doi:10.1016/s0005-2728(89)80347-0
Simko, I., Jimenez-Berni, J. A., and Furbank, R. T. (2015). Detection of decay in fresh-cut lettuce using hyperspectral imaging and chlorophyll fluorescence imaging. Postharvest Biol. Technol. 106, 44–52. doi:10.1016/j.postharvbio.2015.04.007
Siripatrawan, U., Makino, Y., Kawagoe, Y., and Oshita, S. (2011). Rapid detection of Escherichia coli contamination in packaged fresh spinach using hyperspectral imaging. Talanta 85, 276–281. doi:10.1016/j.talanta.2011.03.061
Suraby, E. J., Agisha, V. N., Dhandapani, S., Sng, Y. H., Lim, S. H., Naqvi, N. I., et al. (2023). Plant growth promotion under phosphate deficiency and improved phosphate acquisition by new fungal strain, Penicillium olsonii TLL1. Front. Microbiol. 14, 1285574. doi:10.3389/fmicb.2023.1285574
Takehisa, H., Ando, F., Takara, Y., Ikehata, A., and Sato, Y. (2022). Transcriptome and hyperspectral profiling allows assessment of phosphorus nutrient status in rice under field conditions. Plant Cell Environ. 45, 1507–1519. doi:10.1111/pce.14280
Tung, K.-C., Tsai, C.-Y., Hsu, H.-C., Chang, Y.-H., Chang, C.-H., and Chen, S. (2018). Evaluation of water potentials of leafy vegetables using hyperspectral imaging. IFAC-PapersOnLine 51, 5–9. doi:10.1016/j.ifacol.2018.08.052
Veazie, P., Cockson, P., Henry, J., Perkins-Veazie, P., and Whipker, B. (2020). Characterization of nutrient disorders and impacts on chlorophyll and anthocyanin concentration of Brassica rapa var. Chinensis. Agriculture 10, 461. doi:10.3390/agriculture10100461
Vitousek, P. M., Naylor, R., Crews, T., David, M. B., Drinkwater, L. E., Holland, E., et al. (2009). Nutrient imbalances in agricultural development. Science 324, 1519–1520. doi:10.1126/science.1170261
Wang, Y.-J., Jin, G., Li, L.-Q., Liu, Y., Kalkhajeh, Y. K., Ning, J.-M., et al. (2020a). NIR hyperspectral imaging coupled with chemometrics for nondestructive assessment of phosphorus and potassium contents in tea leaves. Infrared Phys. and Technol. 108, 103365. doi:10.1016/j.infrared.2020.103365
Wang, Y.-J., Li, T.-H., Jin, G., Wei, Y.-M., Li, L.-Q., Kalkhajeh, Y. K., et al. (2020b). Qualitative and quantitative diagnosis of nitrogen nutrition of tea plants under field condition using hyperspectral imaging coupled with chemometrics. J. Sci. Food Agric. 100, 161–167. doi:10.1002/jsfa.10009
Werf, A., Enserink, T., Smit, B., and Booij, R. (1993). Allocation of carbon and nitrogen as a function of the internal nitrogen status of a plant: modelling allocation under non-steady-state situations. Plant Soil 155-156, 183–186. doi:10.1007/bf00025014
Williams, D., Karley, A., Britten, A., McCallum, S., and Graham, J. (2023). Raspberry plant stress detection using hyperspectral imaging. Plant Direct 7, e490. doi:10.1002/pld3.490
Yang, Y., Nan, R., Mi, T., Song, Y., Shi, F., Liu, X., et al. (2023). Rapid and nondestructive evaluation of wheat. Int J. Mol Sci. 24(6):5825. 10.3390/ijms24065825.
Keywords: nutrient deficiency, early diagnosis, hyperspectral imaging, choy sum, hydroponic culture, feature selection
Citation: Teo VX, Dhandapani S, Ang Jie R, Philip VS, Teo Ju Teng M, Zhang S, Park BS, Olivo M and Dinish US (2024) Early detection of N, P, K deficiency in Choy Sum using hyperspectral imaging-based spatial spectral feature mining. Front. Photonics 5:1418246. doi: 10.3389/fphot.2024.1418246
Received: 16 April 2024; Accepted: 06 August 2024;
Published: 03 September 2024.
Edited by:
Qiuqiang Zhan, South China Normal University, ChinaReviewed by:
Guangdong Zhou, Southwest University, ChinaCopyright © 2024 Teo, Dhandapani, Ang Jie, Philip, Teo Ju Teng, Zhang, Park, Olivo and Dinish. This is an open-access article distributed under the terms of the Creative Commons Attribution License (CC BY). The use, distribution or reproduction in other forums is permitted, provided the original author(s) and the copyright owner(s) are credited and that the original publication in this journal is cited, in accordance with accepted academic practice. No use, distribution or reproduction is permitted which does not comply with these terms.
*Correspondence: Bong Soo Park, Ym9uZ3Nvb0B0bGwub3JnLnNn; Malini Olivo, bWFsaW5pX29saXZvQGFzcmwuYS1zdGFyLmVkdS5zZw==; U. S. Dinish, ZGluaXNoQGFzcmwuYS1zdGFyLmVkdS5zZw==
†These authors have contributed equally to this work
Disclaimer: All claims expressed in this article are solely those of the authors and do not necessarily represent those of their affiliated organizations, or those of the publisher, the editors and the reviewers. Any product that may be evaluated in this article or claim that may be made by its manufacturer is not guaranteed or endorsed by the publisher.
Research integrity at Frontiers
Learn more about the work of our research integrity team to safeguard the quality of each article we publish.