 Zihan Xiong1,2,3,4
 Lan Yu1,2,3,4
 Sha An1,2,3,4*
 Juanjuan Zheng1,2,3,4
 Ying Ma1,2,3,4
 Vicente Micó5*
 Peng Gao1,2,3,4*
- 1Hangzhou Institute of Technology, Xidian University, Hangzhou, China
- 2School of Physics, Xidian University, Xi’an, China
- 3Key Laboratory of Optoelectronic Perception of Complex Environment, Ministry of Educationy, Xi’an, China
- 4Engineering Research Center of Functional Nanomaterials, Universities of Shaanxi Province, Xi’an, China
- 5Departamento de Óptica y de Optometría y Ciencias de la Visión, Universidad de Valencia, Burjassot, Spain
Counting and analyzing of blood cells, as well as their subcellular structures, are indispensable for understanding biological processes, studying cell functions, and diagnosing diseases. In this paper, we combine digital holographic microscopy with cell segmentation guided by the Sobel operator using Dice coefficients for automatic threshold selection and aimed to automatic counting and analysis of blood cells in flow and different kinds of cells in the static state. We demonstrate the proposed method with automatic counting and analyzing rat red blood cells (RBCS) flowing in a microfluidic device, extracting quickly and accurately the size, concentration, and dry mass of the sample in a label-free manner. The proposed technique was also demonstrated for automatic segmentation of different cell types, such as COS7 and Siha. This method can help us in blood inspection, providing pathological information in disease diagnosis and treatment.
1 Introduction
Blood cell counting and analysis in both physiology and pathological states have been playing a crucial role in biological and medical study (Adollah et al., 2008; Wen et al., 2022). For instance, blood cell counting is helpful to check for anemia, or to explain symptoms like weakness, fever, bruising, or feeling tired. It aids greatly in the detection and monitoring of conditions such as cancer, infections or blood disorders. Blood cell analysis can help characterize healthy versus diseased cells, track cell dynamics over time, and understand how cells respond to different stimuli or conditions. There are two essential issues in high-throughput blood cell screening: 1) How to image blood cells with high contrast in a label-free manner? 2) How to identify, segment, and count/analyze the cells automatically and efficiently?
For the first issue, quantitative phase microscopy (QPM) combines phase imaging with microscopy, enables visualization of transparent cells with high contrast, and quantify the thickness or refractive index distribution of cells (Popescu et al., 2006; Kim, 2010; Micó et al., 2019; Gao and Yuan, 2022). Among different QPM approaches, digital holographic microscopy (DHM) which combines digital holography and optical microscopy, is one of the label-free, QPM approaches (Schnars and Jüptner, 1994; Osten et al., 2014; Yu et al., 2014). DHM features a nanometer-ranged axial resolution (Mann et al., 2005; Kim, 2010) and autofocusing capability. Nowadays, the reconstruction of DHM can be finished by deep learning frameworks (Ren et al., 2019), which enhance the performances of DHM in general. So far, DHM has been widely applied to many fields, including industrial inspection (Kebbel et al., 2001; Emery et al., 2005), biomedical studies (Yamaguchi et al., 2001; Carl et al., 2004; Marquet et al., 2005; Dubois et al., 2006; Emery et al., 2007), and so on.
For the second issue, cellular analysis through the identification and segmentation of individual cells in images. This process is crucial for assessing cellular parameters, aiding in drug discovery (Robertson, 2014; Park et al., 2023). Some of the common cell segmentation methods are threshold segmentation (Wu et al., 2015), region growing (Xu et al., 2017), edge detection (Lin et al., 2010), and using machine learning or deep learning model methods (Al-Kofahi et al., 2018; Shrestha et al., 2023). Among them, threshold segmentation, as one of the simplest and most common cell segmentation methods, divides the pixels into foreground (cells) and background based on a thresholding of the pixel grey values. However, it is difficult to differentiate regions with obscure cell outline boundaries, which can lead to over-segmentation or under-segmentation phenomena. The rise of deep learning methodologies, particularly convolutional neural networks (CNNs) has emerged as a powerful tool in cell segmentation, capable of learning complex patterns from extensive data for precise segmentation (Tran et al., 2018; Araújo et al., 2019; Panigrahi et al., 2021). Models like mask R-CNN, combining object detection and instance segmentation, have excelled in various computer vision tasks, including cell segmentation (Loh et al., 2021). While deep learning methods provide high accuracy and robustness, they require a significant amount of labeled data for training, which can be time-consuming and expensive. In edge detection people often use Canny, Laplacian, and Sobel operators. Among them, Sobel operator is based on first-order derivatives, and Laplacian operator is based on second-order derivatives. Canny operator is a non-differential edge detection operator, which requires multiple steps (e.g., Gaussian filtering, gradient computation, non-maximum suppression, and bi-thresholding) to complete the edge detection. All of the three methods suffer from computational complexity. In contrast, the Sobel operator is less computationally intensive, and can efficiently process a large amount of image data with high segmentation efficiency (Matthews, 2002). It approximates the edges of an image by calculating the image luminance gradient, and a weighted average of the grey values of the pixels during the detection process provides more continuous edge information. It has been applied in many fields, such as edge detection, object detection and recognition, image segmentation, image compression and video processing (Perra et al., 2005; Jin-Yu et al., 2009; Wang, 2009; Xiu et al., 2020). However, cell segmentation for high-throughput blood cell screening is a challenging task. The reasons are in the following. Firstly, there may be more background noise in the sample image in high-throughput blood cell screening. Secondly, biological cells usually have irregular shapes, protrusions or fibrous structures.
In this paper, we combine DHM with a Sobel operator guided segmentation method using Dice coefficients for automatic threshold selection while automatically counting and analyzing blood cells in flow and their different cells in a static state. It contributes to a better understanding of cell behavior, disease mechanisms and the development of new therapeutic and diagnostic tools.
2 Methods
2.1 Partially coherent illumination based point-diffraction digital holographic microscopy
In our work, red blood cells (RBCs) in microfluidic channels were imaged using a partially coherent point diffraction digital holographic microscope (PC-pDHM) (Zhuo et al., 2021). As shown in Figure 1, a partially coherent illumination (PCI) generated by combining a rotating diffuser and a multimode fiber is used.
FIGURE 1. (A) Schematic diagram of the experimental setup for automatic cell segmentation. PCI, partially coherent illumination; MO, microscopic objectives; L1-L3, achromatic lens; M. Mirrors; G, polarization grating; PH, pinhole; P, polarizers; CCD, charge-coupled device; RBCs, red blood cells; (B) Schematic diagram of the automatic segmentation process in PC-pDHM.
Under the PCI, the sample is imaged by a telescope system consisting of a 10×/0.45 microscopic objective MO and a tube lens L1 (f = 150 mm). Then, a polarization grating (G) splits the object wave into several copies along different diffraction orders of the grating. The +1st diffraction order is used as the object wave while the -1st order acts as the reference wave after being spatially filtered out (pinhole mask). Due to the polarization dependence of the grating’s diffraction orders, the object and reference waves are elliptically polarized along two orthogonal directions. Finally, the object and reference light are converted to the same polarized wave by a linear polarizer (P), and interfere with each other in the plane of the digital sensor (CCD). The relative intensity of the object and reference waves, i.e., the fringe contrast of the hologram, can be adjusted by rotating the polarizer P. The digital camera (DMK33UX174, The Imaging Source, LLC, Charlotte, NC, United States) records the hologram sequence at up to 162 frames per second (fps), limiting the temporal resolution to about 6 ms. PC-pDHM has the advantages of high accuracy, low speckle noise, and instant amplitude/phase imaging. Notably, PC-pDHM is robust against environmental disturbances due to its common-path configuration.
On the CCD plane, the interference between the object wave and the reference wave produces an intensity distribution of
For Eq. 1,
where,
2.2 Automatic cell segmentation in phase image
In the conventional cell segmentation using Sobel operator, the threshold value for edge segmentation is usually identified by using the grayscale histogram of the image. This technique may result in overlooked and misidentified edges for the images with feeble edge contrast. Herein, we propose a cell segmentation method guided by the Sobel operator (Sobel and Feldman, 1968; Gao et al., 2010) and Dice coefficient (Shamir et al., 2019), of which the threshold value is identified using ground truth images to achieve automatic optimal segmentation. The specific details of the segmentation process are shown in Figure 1B.
Step 1. Cell edge detection.
At first, the background of the original phase images is removed by subtracting the mean value of the phase images.
Then, the edge contour of cells is extracted using Sobel operators, which compute the gradient of an image along four-direction (0°, 45°, 90°, and 135°). Specifically, the gradient along these directions can be calculated by convolving the phase image I (x, y) with Sobel matrix
For Eq. 3, the squares of the gradients in the four specified directions are added, and the square root of their summation is the overall gradient magnitude G. This process the cell edges exhibit higher intensity values, making them easily distinguishable, as shown the Gradient in Figure 1B.
Step 2. Cell segmentation.
First, convert the gradient image into a binarized image using an initial threshold n.
Second, an expansion kernel of size 1 × 1 pixel2 is employed to perform a dilation operation. This operation examines the surrounding pixels of a target pixel, if any of the 8 surrounding pixels has a value of 1 (foreground pixel), the value of the current pixel is set to 1. Otherwise, it is left unchanged, enabling the expansion or joining of foreground regions. The dilation operation can somehow suppress disjointed or inaccurate edge due to the presence of noise.
Third, the holes are eliminated and the edges are smoothed by morphological closing operations (dilation and erosion). The dilation operation is first repeated continuously until the foreground pixels are filled in the connected region. However, this may result in the foreground region becoming irregular or too large. In order to eliminate these problems, the erosion operation is then performed. Specifically, the dilation kernel defined above is compared to the current pixel position and its surrounding pixels. If the value of the image pixel corresponding to the dilation kernel with all the surrounding pixels is 1, the value of the current pixel is set to 1. Otherwise, it is set to 0. The erosion process modifies the shape and size of the foreground region, removing minor details and smoothing edges to create a more accurate cell mask.
Fourth, automatic threshold identification using ground truth (GT) images is applied where accurate selection of threshold value is crucial for cell segmentation. In this method, the threshold n is identified using GT images to obtain the best segmentation. The Dice coefficient, which is the most commonly used objective metric in deep learning-based segmentation (Milletari et al., 2016):
Actually, Eq. 4 assesses segmentation quality by comparing the overlap between the segmented (Mask) and GT images, and the value ranges from 0 to 1. The closer the value is to 1, the higher the overlap similarity between Mask and GT, i.e., the more accurate the segmentation result. In the implementation, the threshold n is varied so that an optimal threshold is found that maximizes the value of the Dice coefficient. For the GT images in this cellular segmentation task, manual labelling was performed with ImageJ. Firstly, the cell boundaries were precisely outlined on the phase image. And secondly, the cell regions were filled with a paintbrush to obtain the labelled image for cell regions.
2.3 Automatic cell segmentation in phase image
Dry mass, which is the mass of a cell or an organism after all the water content has been evaporated, is often used to evaluate the morphology or the density of biological samples. The dry mass of the target as a whole can be obtained by integrating the refractive indices of the target body volume regions (Sung et al., 2012):
Here,
3 Results and discussions
3.1 Cell area measurement and concentration analysis based on automatic segmentation
In the first experiment, we demonstrate that the proposed technique can be applied to the analysis of rat blood. Fresh blood was extract from a rat and was diluted at a volume ratio of 1:100. Then, the diluted blood was pumped through a microfluidic channel equipped in PC-pDHM and continuous recording of off-axis holograms were taken at a ratio of 30 fps. Using Eq. 2, quantitative phase images of the blood cells can be reconstructed, as shown in Figure 2A. The contours of individual cells are extracted based on the automatic segmentation methodology previously introduced, as shown in Figure 2B. The area of each individual cell can be calculated by counting the number of pixels within each cell area and multiplying a factor of 0.078 μm2/pixel2. The statistics of cell areas among 43,711 cells is represented in Figure 2C. In the statistics, the area below 13.50 μm2 is from speckle noise and the area above 28.0 μm2 is from the cells clusters in the phase images (see the area marked with red circles in Figure 2B). The range in between (13.50–28.0 μm2) corresponds to a valid area region (containing 13,943 cells for the statistic) and this region is magnified and shown with Figure 2E where the useful cells are labeled. Often, the valid area range for individual cells can be determined by analyzing the phase image containing sparse cells, as shown in Figures 2B, E. At low density of cells, the cell contour can be easily isolated and segmented since there is a large difference between the noise points and the actual cells. The Gaussian fit on the histogram reveals that the mean area of individual cells is 21.80 ± 0.14 μm2 (mean ± SD).
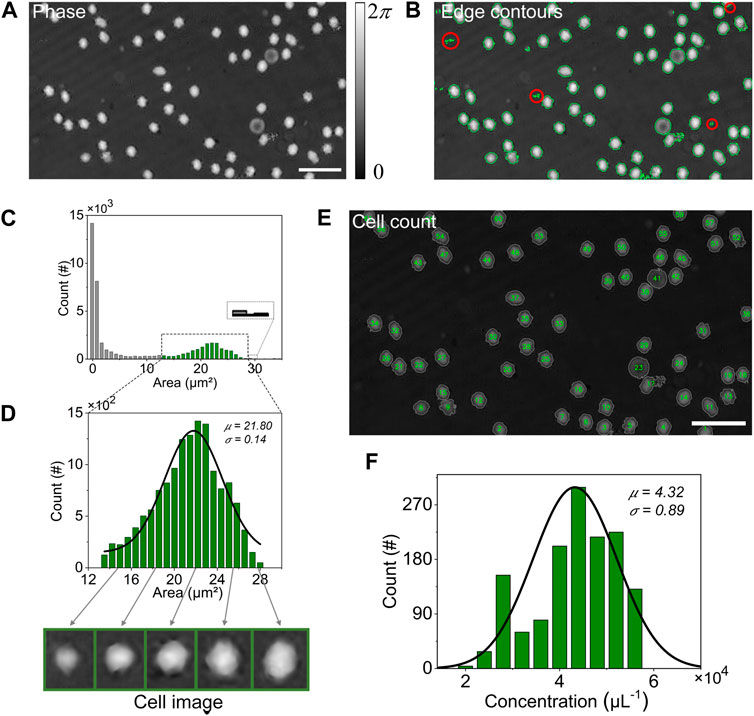
FIGURE 2. Analysis of diluted rat blood using the proposed technique. (A) Phase image of RBCs; (B) Edge contours of RBCs; (C) Histogram of area among 43,711 contours; (D) Distribution statistics of RBCs area, for the area within the dashed box in (C); (E) Results of RBCs counting; (F) Statistics of RBCs concentration in the diluted solution. Scale bars in (A–B) are 20 µm, (E) are 20 µm, respectively.
Considering the observation volume of the microfluidic channel falling in the field of view (FOV) of 149.76 × 84.24 × 100 μm³, we can calculate the volume concentration of blood cells in the diluted blood sample. Using the cell area distribution included in Figure 2D as a constraint for cell counting, we obtained the number of cells N = 61 cells in the observation volume of 149.76 × 84.24 × 100 μm³ for the exemplary frame (Figure 2E), which means that the cell concentration can be deduced to be 4.84 × 10⁶ μL⁻1. In this case, we performed an automated count on 1,134 manually counted cells and assessed the accuracy of the algorithm to be approximately 97% when compared to an automated count of 1,099 cells. Once repeating this process for 1,400 images, the histogram of cell concentration can be obtained and shown in Figure 2F. The Gaussian fit of the histogram tells that RBCs concentration in the diluted solution is (4.32 ± 0.89) ×104 μL⁻1 (mean ± SD). Taking the dilution factor 1:100 into consideration, the blood cell concentration in rat blood is (4.32 ± 0.89) ×106 μL⁻1 (mean ± SD). This information is essential for deeper understanding of cellular behavior and characteristics during cell proliferation or under effect of drugs.
3.2 Cell dry mass analysis based on automatic cell segmentation
The dry mass of a cell is the amount of solid material, such as proteins, nucleic acids and other organic molecules, existing in the cell. Measuring the dry mass of a cell can provide information about the cell’s metabolism, growth and health states. It is useful for assessing rates of cell proliferation, comparing the biochemistry of different cell types, and studying the effects of drugs on cells. Several approaches exist for determining cell dry mass. One possibility involves the direct measurement of the dry weight of cells by collecting them, washing and centrifuging them, and subsequently drying them (Bratbak and Dundas, 1984). Another approach is to quantitatively measure the cell dry mass by phase change determination (Popescu, 2011). This method has the advantage of being non-destructive and does not require additional treatment of the sample. Therefore, it is widely used in fields such as cell biomass measurement and cell growth monitoring.
In our experiment, we acquired phase images by using the PC-pDHM for label-free measurement of RBCs’ dry mass. As shown in Figure 3A, the phase values were first integrated point-by-point over the cell region, yielding the integrated phase value
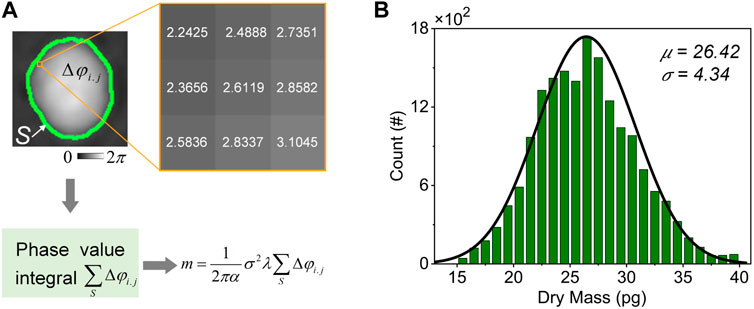
FIGURE 3. Analysis of the dry mass of RBCs. (A) Procedure for calculating the dry mass of RBCs; (B) Histograms of the cell dry mass. The curve in (B) is a gaussian fit.
3.3 Segmentation of different cell types and comparison with multiple segmentation
Cell segmentation is crucial in high-throughput, automatic analysis of cell morphology. In this experiment, we demonstrate the proposed approach can be used for segmentation of different kinds of cells. We imaged Siha cells using the DHM setup shown in Figure 1 and segmented them using the proposed method in comparison with the following four well-established methods: 1) Cellpose (Stringer et al., 2021): A deep learning based cell segmentation method; 2) Trainable Weka Segmentation (TWS) (Arganda-Carreras et al., 2017): A machine learning based cell segmentation method; 3) Empirical Gradient Threshold (EGT) (Chalfoun et al., 2015): A feature-extracting strategies; 4) Ostu (Ostu, 1979): A thresholding based method. Cellpose based segmentation was performed using its startup web version. TWS and EGT were implemented using plugins integrated in Fiji, while Ostu was implemented using python. The phase diagram of Siha cells is shown in Figure 4A, and the GT image (Figure 4B) was obtained by manual segmentation. The segmentation results obtained by different methods are shown in Figures 4C–G. We visualize the deviation of the segmentation results against the GT images, including TP (correctly identified positive samples), FN (positive samples missed cases), FP (negative samples misreported cases), and TN (correctly identified negative samples). The segmentation results were evaluated using F1 scores and Hausdorff Distance (HD) as secondary criteria, of which F1 scores indicate consistency of the segmentation results with the actual labels and HD values indicate segmentation accuracy. The F1 scores for Figures 4C–G were 0.95, 0.87, 0.91, 0.89, and 0.87, and their HD values were 6.40, 33.11 16.28, 12.04, and 18.79, respectively. In comparison, the method proposed in this paper has better performance.
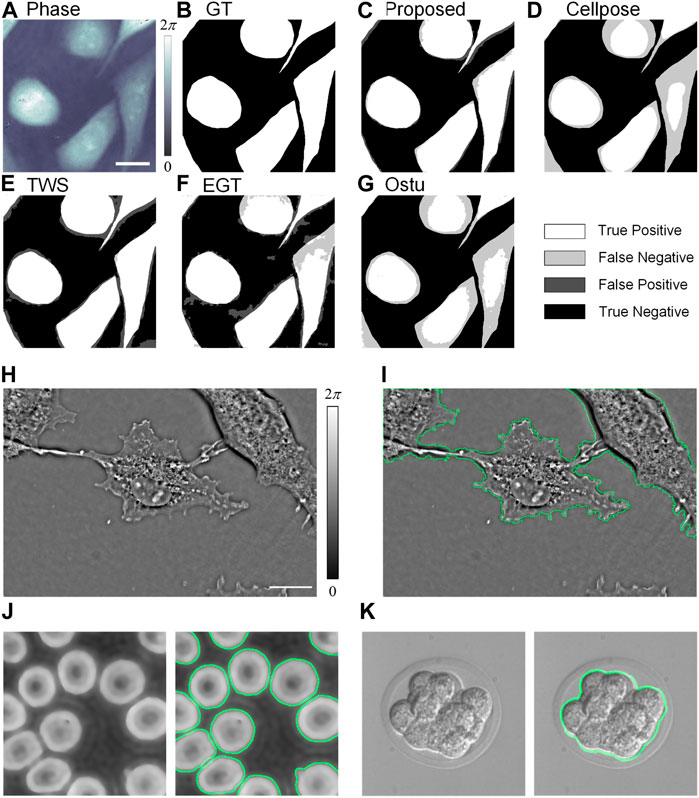
FIGURE 4. Automatic segmentation of cells (A–G) Comparison of the proposed method with other methods on segmentation of Siha cells. (A) Phase image of the cells; (B) GT image of the cell segmentation; (C–G) The segmentation results of different segmentation methods obtained by the TP, FN, FP, and TN methods in comparison with the GT images; (H) Quantitative phase image of COS7 cells and (I) cell segmentation result; (J) Holographic image of human blood cells and corresponding segmentation results; (K) Differential interference contrast (DIC) image of Mouse Embryos and corresponding segmentation results. Scale bars in (A–G) are 10 µm, (H–I) are 10 µm, respectively.
First, there is no need to obtain a large amount of labeled data since only one piece of labelled data for the same kind of samples taken by the same device is sufficient to guide the thresholding optimization in the segmentation operation. Second, the method is relatively simple and computationally efficient, and by contrast, the learning network model in a neuron network often requires a lot of computational resources and time. Just as an example, the complete segmentation of the proposed method takes only about 0.05 s for an image with 96 × 96 pixels, while the U-Net needs 17 h to be trained with 3,600 pairs of data. Considering the phase image can be acquired in real-time using off-axis DHM configuration, real-time dynamic imaging and segmentation is possible once using parallel processing techniques. Third, the proposed approach can segment different kinds of cell profiles. In particular, our method shows excellent ability to extract cell contours of COS7 cells (Figures 4H, I). We further demonstrate in Figures 4J, K that the proposed approach works also in the segmentation of both human erythrocytes and mouse embryo cells (Ljosa et al., 2012). By contrast, the network model can only predict the structures that are identical or similar to those in the training set. However, our proposed method has some shortcomings and the segmentation results of the model may be somewhat poor for images containing complex textures, significant shape changes, or no clear delineation between target and background.
4 Conclusion
In this paper, we propose a scheme for cell segmentation using the Sobel operator with Dice coefficients as a guide, which can segment cells in digital holographic imaging and enables the determination of cell size, concentration, and dry mass. Notably, many of the present cell segmentation algorithms are restricted to specific modalities, making our method’s versatility in segmenting cells across various imaging modes noteworthy. In our experiments, after testing with rat RBCs, COS7 cells and Siha cells, eventually we found that the method can rapidly segment individual cell outlines in phase images. The proposed method is valuable in clinical screening that requires rapid processing of large amount of sample. Additionally, the proposed method can be adapted to wide range of clinical imaging devices, enabling the analysis of diverse cell types and morphologies. It is also worth mentioning that the proposed pipeline cannot be considered fully automatic as it requires manual segmentation of an image to optimize the threshold for segmentation in order to maximize the Dice coefficient. Further standardization and validation are needed to fully establish its efficacy, particularly in real patient samples.
Data availability statement
The raw data supporting the conclusion of this article will be made available by the authors, without undue reservation.
Ethics statement
Ethical approval was not required for the studies on animals in accordance with the local legislation and institutional requirements because only commercially available established cell lines were used.
Author contributions
ZX: Writing–original draft, Writing–review and editing. LY: Writing–review and editing. SA: Writing–review and editing. JZ: Writing–review and editing. YM: Writing–review and editing. VM: Writing–review and editing. PG: Writing–review and editing.
Funding
The author(s) declare financial support was received for the research, authorship, and/or publication of this article. This work was supported by the National Key Research and Development Program of China (2022YFE0100700 and 2021YFF0700303); the National Natural Science Foundation of China (NSFC 62075177, 62105251, and 12104354); the Natural Science Foundation of Shaanxi Province (2023JCQN0731, 2023JCYB518, and 2022JQ-122); the Fundamental Research Funds for the Central Universities (QTZX23024, QTZX23013, QTZX23008, and XJSJ23137), the Open Research Fund of State Key Laboratory of Transient Optics and Photonics and by the Grant PID2020-120056GB-C21 funded by MCIN/AEI/10.13039/501100011033.
Conflict of interest
The authors declare that the research was conducted in the absence of any commercial or financial relationships that could be construed as a potential conflict of interest.
The author(s) declared that they were an editorial board member of Frontiers, at the time of submission. This had no impact on the peer review process and the final decision.
Publisher’s note
All claims expressed in this article are solely those of the authors and do not necessarily represent those of their affiliated organizations, or those of the publisher, the editors and the reviewers. Any product that may be evaluated in this article, or claim that may be made by its manufacturer, is not guaranteed or endorsed by the publisher.
References
Adollah, R., Mashor, M. Y., Mohd Nasir, N., Rosline, H., Mahsin, H., and Adilah, H. (2008). Blood cell image segmentation: a review, 4th kuala lumpur international conference on biomedical engineering, BIOMED 2008 25–28 june 2008 kuala lumpur. Berlin, Germany: Springer, 141–144.
Al-Kofahi, Y., Zaltsman, A., Graves, R., Marshall, W., and Rusu, M. J. B. b. (2018). A deep learning-based algorithm for 2-D cell segmentation in microscopy images. BMC Bioinforma. 19, 365. doi:10.1186/s12859-018-2375-z
Araújo, F. H., Silva, R. R., Ushizima, D. M., Rezende, M. T., Carneiro, C. M., Bianchi, A. G. C., et al. (2019). Deep learning for cell image segmentation and ranking. Comput. Med. Imaging Graph. 72, 13–21. doi:10.1016/j.compmedimag.2019.01.003
Arganda-Carreras, I., Kaynig, V., Rueden, C., Eliceiri, K. W., Schindelin, J., Cardona, A., et al. (2017). Trainable Weka Segmentation: a machine learning tool for microscopy pixel classification. Bioinformatics 33, 2424–2426. doi:10.1093/bioinformatics/btx180
Bratbak, G., and Dundas, I. (1984). Bacterial dry matter content and biomass estimations. Appl. Environ. Microbiol. 48, 755–757. doi:10.1128/aem.48.4.755-757.1984
Carl, D., Kemper, B., Wernicke, G., and von Bally, G. (2004). Parameteroptimized digital holographic microscope for high-resolution living-cell analysis. Appl. Opt. 43, 6536–6544. doi:10.1364/AO.43.006536
Chalfoun, J., Majurski, M., Peskin, A., Breen, C., Bajcsy, P., and Brady, M. J. m (2015). Empirical gradient threshold technique for automated segmentation across image modalities and cell lines. J. Microsc. 260, 86–99. doi:10.1111/jmi.12269
Dubois, F., Yourassowsky, C., Monnom, O., Legros, J.-C., Debeir, O., Van Ham, P., et al. (2006). Digital holographic microscopy for the three-dimensional dynamic analysis of in vitro cancer cell migration. J. Biomed. Opt. 11, 054032. doi:10.1117/1.2357174
Emery, Y., Cuche, E., Colomb, T., Depeursinge, C., Rappaz, B., Marquet, P., et al. (2007). Dhm (Digital Holography Microscope) for Imaging Cells, IOP Publishing, England, UK.
Emery, Y., Cuche, E., Marquet, F., Aspert, N., Marquet, P., Kuhn, J., et al. (2005). Digital holography microscopy (dhm): fast and robust systems for industrial inspection with interferometer resolution. Optical Measurement Systems for Industrial Inspection Iv, 5856 930–937.
Gao, P., and Yuan, C. J. (2022). Resolution enhancement of digital holographic microscopy via synthetic aperture: a review. Light Adv. Manuf. 3, 105–120. doi:10.37188/lam.2022.006
Gao, W., Zhang, X., Yang, L., and Liu, H. (2010). An improved Sobel edge detection, Proceedings of the 3rd International conference on computer science and information technology. June 2010, Huangshi, China, 67–71.
Jin-Yu, Z., Yan, C., and Xian-Xiang, H. (2009). Edge detection of images based on improved Sobel operator and genetic algorithms, Proceedings of the International conference on image analysis and signal processing. August 2009, Rome, Italy, 31–35.
Kebbel, V., Hartmann, H.-J., and Jüptner, W. P. (2001). Application of digital holographic microscopy for inspection of micro-optical components, optical measurement systems for industrial inspection II: application in industrial design. SPIE, Washington, DC, USA, 189–198.
Kim, M. K. J. S. r. (2010). Principles and techniques of digital holographic microscopy. SPIE Rev. 1, 018005. doi:10.1117/6.0000006
Lin, C. H., and Chen, C. C. (2010). Image segmentation based on edge detection and region growing for thinprep-cervical smear. Int. J. Pattern Recognit. Artif. Intell. 24, 1061–1089. doi:10.1142/S0218001410008305
Ljosa, V., Sokolnicki, K. L., and Carpenter, A. E. (2012). Annotated high-throughput microscopy image sets for validation. Nat. methods 9 (7). doi:10.1038/nmeth.2083
Loh, D. R., Yong, W. X., Yapeter, J., Subburaj, K., and Chandramohanadas, R., (2021). A deep learning approach to the screening of malaria infection: automated and rapid cell counting, object detection and instance segmentation using Mask R-CNN. Comput. Med. Imaging Graph. 88, 101845. doi:10.1016/j.compmedimag.2020.101845
Mann, C. J., Yu, L., Lo, C. M., and Kim, M. K. (2005). High-resolution quantitative phase-contrast microscopy by digital holography. Opt. Express 13, 8693–8698. doi:10.1364/OPEX.13.008693
Marquet, P., Rappaz, B., Magistretti, P. J., Cuche, E., Emery, Y., Colomb, T., et al. (2005). Digital holographic microscopy: a noninvasive contrast imaging technique allowing quantitative visualization of living cells with subwavelength axial accuracy. Opt. Lett. 30, 468–470. doi:10.1364/OL.30.000468
Matthews, J. (2002). An introduction to edge detection: the sobel edge detector. Available at: http://www.generation5.org/content/2002/im01.asp.
Micó, V., Zheng, J., Garcia, J., Zalevsky, Z., and Gao, P., and (2019). Resolution enhancement in quantitative phase microscopy. Adv. Opt. Photonics 11, 135–214. doi:10.1364/AOP.11.000135
Milletari, F., Navab, N., and Ahmadi, S. A. (2016). V-net: fully convolutional neural networks for volumetric medical image segmentation, Fourth international conference on 3D vision (3DV). IEEE, Stanford, CA, USA, 565–571.
Osten, W., Faridian, A., Gao, P., Körner, K., Naik, D., Pedrini, G., et al. (2014). Recent advances in digital holography [Invited]. Appl. Opt. 53, G44–G63. doi:10.1364/AO.53.000G44
Ostu, N. (1979). A threshold selection method from gray-level histograms. IEEE Trans. Syst. man, Cybern. 9, 62–66. doi:10.1109/tsmc.1979.4310076
Panigrahi, S., Murat, D., Le Gall, A., Martineau, E., Goldlust, K., Fiche, J.-B., et al. (2021). Misic, a general deep learning-based method for the high-throughput cell segmentation of complex bacterial communities. Elife 10, e65151. doi:10.7554/eLife.65151
Park, S. A., Sipka, T., Krivá, Z., Lutfalla, G., Nguyen-Chi, M., Mikula, K., et al. (2023). Segmentation-based tracking of macrophages in 2D+time microscopy movies inside a living animal. Comput. Biol. Med. 153, 106499. doi:10.1016/j.compbiomed.2022.106499
Perra, C., Massidda, F., and Giusto, D. D. (2005). Image blockiness evaluation based on sobel operator. Proceedings of the IEEE International Conference on Image Processing, July 2005, Austin, TX, USA, I–389.
Popescu, G. (2011). Quantitative phase imaging of cells and tissues. McGraw-Hill Education. New York, NY, USA.
Popescu, G., Ikeda, T., Goda, K., Best-Popescu, C. A., Laposata, M., Manley, S., et al. (2006). Optical measurement of cell membrane tension. Phys. Rev. Lett. 97, 218101. doi:10.1103/PhysRevLett.97.218101
Ren, Z., Xu, Z., and Lam, E. (2019). End-to-end deep learning framework for digital holographic reconstruction. Adv. Photonics 1, 1–016004. doi:10.1117/1.AP.1.1.016004
Robertson, D. S. (2014). The development of tumor cell characteristics. J. Cell. Physiology 229, 705–710. doi:10.1002/jcp.24498
Schnars, U., and Jüptner, W. (1994). Direct recording of holograms by a CCD target and numerical reconstruction. Appl. Opt. 33, 179–181. doi:10.1364/AO.33.000179
Shamir, R. R., Duchin, Y., Kim, J., Sapiro, G., and Harel, N. (2019). Continuous dice coefficient: a method for evaluating probabilistic segmentations. https://arxiv.org/abs/1906.11031.
Shrestha, P., Kuang, N., and Yu, J. (2023). Efficient end-to-end learning for cell segmentation with machine generated weak annotations. Commun. Biol. 6, 232. doi:10.1038/s42003-023-04608-5
Sobel, I., and Feldman, G. (1968). “A 3x3 isotropic gradient operator for image processing,” in Stanford Artificial Intelligence Project (SAIL).
Stringer, C., Wang, T., Michaelos, M., and Pachitariu, M., (2021). Cellpose: a generalist algorithm for cellular segmentation. Nat. methods 18, 100–106. doi:10.1038/s41592-020-01018-x
Sung, Y., Choi, W., Lue, N., Dasari, R. R., and Yaqoob, Z. (2012). Stain-free quantification of chromosomes in live cells using regularized tomographic phase microscopy. PloS one 7, e49502. doi:10.1371/journal.pone.0049502
Tran, T., Kwon, O.-H., Kwon, K.-R., Lee, S.-H., and Kang, K.-W. (2018). Blood cell images segmentation using deep learning semantic segmentation, Proceedings of the IEEE international conference on electronics and communication engineering (ICECE). June 2018, Xi’an, China, 13–16.
Wang, W. (2009). Reach on Sobel operator for vehicle recognition, Proceedings of the International joint conference on artificial intelligence. June 2009, Yokohama, Japan, 448–451.
Wen, T., Tong, B., Liu, Y., Pan, T., Du, Y., Chen, Y., et al. (2022). Review of research on the instance segmentation of cell images. Comput. Methods Programs Biomed. 227, 107211. doi:10.1016/j.cmpb.2022.107211
Wu, Y. Q., Meng, T. L., and Wu, S. H. (2015). Research progress of image thresholding methods in recent 20 Years(1994-2014). J. Data Acquis. Process. 30, 1–23. doi:10.16337/j.1004-9037.2015.01.001
Xiu, C., Yin, H., and Liu, Y. (2020). Image segmentation of cv model combined with sobel operator, Proceedings of the 2020 Chinese Control and Decision Conference (CCDC). June 2020, Hefei, China, 4356–4360.
Xu, W. B., Liu, Y., Zhang, H. W., and Intelligence, A. (2017). Image segmentation based on edge detection and region growing for thinprep-cervical smear. Beijing Biomed. Eng. 36 (3), 317–322.
Yamaguchi, I., Kato, J. I., Ohta, S., and Mizuno, J. (2001). Image formation in phase-shifting digital holography and applications to microscopy. Appl. Opt. 40, 6177–6186. doi:10.1364/AO.40.006177
Yu, X., Hong, J., Liu, C., and Kim, M. K. (2014). Review of digital holographic microscopy for three-dimensional profiling and tracking. Opt. Eng. 53, 112306. doi:10.1117/1.OE.53.11.112306
Keywords: quantitative phase microscopy (QPM), digital holographic microscopy (DHM), cell segmentation, cell characteristic parameters, Sobel operator
Citation: Xiong Z, Yu L, An S, Zheng J, Ma Y, Micó V and Gao P (2024) Automatic identification and analysis of cells using digital holographic microscopy and Sobel segmentation. Front. Photonics 5:1359595. doi: 10.3389/fphot.2024.1359595
Received: 21 December 2023; Accepted: 08 February 2024;
Published: 19 February 2024.
Edited by:
Claas Falldorf, Bremer Institut für angewandte Strahltechnik, GermanyReviewed by:
Shaowei Jiang, Hangzhou Dianzi University, ChinaZhenbo Ren, Northwestern Polytechnical University, China
Copyright © 2024 Xiong, Yu, An, Zheng, Ma, Micó and Gao. This is an open-access article distributed under the terms of the Creative Commons Attribution License (CC BY). The use, distribution or reproduction in other forums is permitted, provided the original author(s) and the copyright owner(s) are credited and that the original publication in this journal is cited, in accordance with accepted academic practice. No use, distribution or reproduction is permitted which does not comply with these terms.
*Correspondence: Sha An, YW5zaGFAeGlkaWFuLmVkdS5jbg==; Vicente Micó, dmljZW50ZS5taWNvQHV2LmVz; Peng Gao, cGVuZy5nYW9AeGlkaWFuLmVkdS5jbg==