 Mengyi Zhu
 Jafar Safarian
94% of researchers rate our articles as excellent or good
Learn more about the work of our research integrity team to safeguard the quality of each article we publish.
Find out more
ORIGINAL RESEARCH article
Front. Photonics, 04 March 2024
Sec. Photovoltaic Materials and Devices
Volume 5 - 2024 | https://doi.org/10.3389/fphot.2024.1334122
This article is part of the Research TopicUpgraded Metallurgical Grade (UMG) Silicon: Quality, Applications and Process EconomicsView all 5 articles
In response to the escalating global demand for solar photovoltaic (PV) energy, there is a critical need for more cost-effective and environmentally sustainable production methods for upgrading metallurgical-grade silicon (MG-Si). Among various metallurgical approaches, acid leaching is an economical and effective method to upgrade MG-Si. However, the impact of cooling rates during solidification, a potentially significant factor for optimization of the leaching process, has been rarely investigated. In this work, the effects of magnesium alloying content and cooling rate on microstructural evolutions in MG-Si are studied. MG-Si was alloyed with two different magnesium contents (5.5 wt% and 9.0 wt%), using an induction furnace for the melting, alloying, and casting process. The cast alloys were subsequently remelted under five distinct cooling rates, specifically 3, 10, 25, 40, and 80°C/min. Microstructural analysis and grain size measurement were conducted using scanning electron microscopy (SEM), electron backscatter diffraction (EBSD), and the ASTM E112 standards. It was observed that the Mg2Si phase was formed along the primary Si grains and with other intermetallic silicide-containing impurities embedded inside. Moreover, higher cooling rates resulted in finer primary Si grains with highly diverse crystallographic orientations, while slower rates induced coarser Si grains and a concentrated silicide phase along the grain boundaries. Importantly, the results also indicate that a higher magnesium alloying content (9.0 wt%) led to finer grain sizes. The present work establishes links between alloying content, cooling rate, and the resulting microstructure, offering valuable insights for optimizing the alloying–leaching process.
The solar industry has experienced an exponential growth in recent years. Over the last decade, the solar photovoltaic (PV) sector has expanded with an average annual rate of 25% (REN, 2023). Despite the COVID-19 pandemic-induced global supply chain challenges, as well as the subsequent global inflation increasing raw material and labor costs, solar PV manufacturing has exhibited robust resilience. In 2022, the installed capacity of solar power reached a significant milestone of 1185 GW, with solar PV accounting for a substantial 70% of the global total renewable power capacity additions (REN21, 2023). Moreover, according to the forecast by the International Renewable Energy Agency (IRENA, 2023), the global cumulative photovoltaic installation capacity is set to exceed 5400 GW by 2030 and 18200 GW by 2050. Therefore, in response to the escalating global demand for solar PV and to attain the global vision of carbon neutrality, there is a critical need for more cost-effective and environmentally sustainable production of solar grade silicon.
Although the current solar silicon production is dominated by the modified Siemens process and the fluidized bed reactor (FBR) process for upgrading metallurgical-grade silicon, the metallurgical route for upgraded metallurgical-grade (UMG) silicon is drawing increased attention owing to its lower energy consumption and carbon dioxide emissions, coupled with its suitability for larger-scale production. Furthermore, the metallurgical route also presents a significant opportunity for incorporating the recycling of substantial cutting kerf from the wafering process and the recycling of end-of-life PV, thereby enabling a circular material flow essential for sustainable operations within the solar silicon sector.
As a typical example of the commercialized process for UMG silicon production, the ELKEM solar process has been successfully developed and operated by REC Solar Norway in the past decade. The ELKEM solar process consists of a combination of metallurgical refining techniques including slag refining (Jakobsson, 2013; Thomas et al., 2021), acid leaching (Zhu et al., 2020b), and directional solidification (Ma et al., 2013; Ren et al., 2018) that upgrades the metallurgical-grade Si to solar-grade Si. In the slag refining step, B content in Si is reduced through oxidation. Subsequently, acid leaching is performed to further reduce P content and large quantities of metallic impurities, and the final directional solidification step is used to remove the remaining impurities.
As a crucial step for silicon purification, the acid leaching technique itself presents a conventional method for UMG silicon production with a long history. The earliest study on acid leaching for high-purity silicon preparation can be dated back to Tucker (1927). Since then, numerous investigations have been performed to study the leaching conditions (Hunt et al., 1976; Dietl, 1983; Santos et al., 1990) and kinetics (Margarido et al., 1993; Margarido et al., 1994). Developed in the 1970s by Elkem Bremanger in Norway, the Silgrain® process effectively reduces metallic impurities through acid leaching and remains today as the exclusive hydrometallurgical method for high-quality MG-Si production (Aas, 1971; Dueñas Díez et al., 2006; Ceccaroli and Tronstad, 2016). However, the relatively high segregation coefficient of P between solid/liquid silicon (KP = 0.35) makes direct leaching of metallurgical silicon a challenge in achieving a high degree of P removal. Therefore, considering this issue, additional elements were introduced into the Si melt to further enhance the impurity segregation behavior. The solvent refining technique involves adding substantial quantities of alloying elements such as Al (Yoshikawa and Morita, 2003; Yoshikawa and Morita, 2012; Lei et al., 2018), Sn (Ma et al., 2015; Ren et al., 2019), and Cu (Huang et al., 2018) to form a solvent alloy. The solvent not only decreases the alloy melting point and operation temperature but also improves the segregation of various impurities due to the interaction with the introduced solvent element. However, the improvement of P segregation is still limited and requires an extended cooling time period. An alternative method, the alloying–leaching approach, involves doping MG-Si with smaller amounts of more reactive elements such as Ca (Schei, 1985; Shimpo et al., 2004) and Mg (Espelien et al., 2017a; Espelien and Safarian, 2017; Zhu et al., 2020a). The doping elements are typically limited to a few weight percent additions to bring more economic benefits. They serve as an impurity getter, forming an Si-rich alloy where impurities are gathered in a phase that can be leached. Since Ca exhibits strong thermodynamic attraction with P in Si melt (Shimpo et al., 2004), the formed leachable CaSi2 phase is enriched with P and gathers most of the impurity precipitate. Thus, the subsequent acid leaching can readily remove the CaSi2 precipitates. Although the use of alumina crucibles may lead to an unwanted side reaction with Ca in the melt, consuming of the impurity getter, and introducing of Al impurity that contaminates the melt (Zhu et al., 2021), Meteleva-Fischer et al. have highlighted the considerable influence of the cooling rate on the alloy microstructure and efficiency of impurity removal in the Si–Ca alloy(Meteleva-Fischer et al., 2013). Specifically, a slower cooling rate is less effective for impurity removal due to significant Ca volatilization.
Recently, Mg has emerged as a novel and effective impurity getter for silicon purification owing to its similarly strong chemical affinity to P as compared to Ca. Moreover, while the leaching of the Si–Ca alloy generates the solid by-product siloxene, the leaching of Si–Mg is free of solid by-product and with higher Si recovery (Zhu et al., 2020b). However, the impact of cooling rates during solidification, a potentially significant factor, has been rarely investigated.
The present work aimed to provide valuable insights into optimization of the emerging Si–Mg refining system. A series of Si–Mg alloys were produced with different Mg alloying concentrations (5.5 wt% and 9.0 wt%) using a melting–casting process in an induction furnace. The as-cast alloys were further remelted in a resistance furnace and subjected to different cooling rates (3, 10, 25, 40, and 80°C/min). Comprehensive analyses were conducted to examine the impact of alloy compositions and cooling rates on microstructural evolution, impurity segregation behavior, and grain size variation.
In this work, commercial-grade silicon fines (HQ-Silgrain®) were used as the starting Si source, with its chemical composition presented in Table 1. The high-purity granular silicon produced from the fluidized bed reactor process (FBR-Si) was also introduced. The HQ-Silgrain® silicon fines and FBR-Si granules were mixed in a 40:60 ratio. The magnesium used in this work has a high purity (99.8%, Alfa Aesar). Magnesium pieces were obtained by cutting a magnesium rod, and the magnesium was carefully weighted to achieve 5.5 and 9.0 wt% Mg additions.
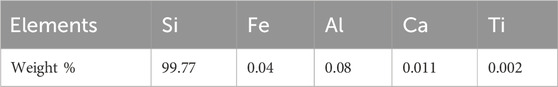
TABLE 1. Chemical composition of the HQ-Silgrain® fines.
For the alloying experiment of 5.5 wt% and 9 wt% of Si–Mg alloys, an induction furnace with a water-cooled copper mold was employed first to prepare the as-cast sample. Subsequently, a resistance furnace was used for the re-melting and controlled cooling rate experiments. The investigated alloying concentration and cooling conditions are displayed in Table 2.

TABLE 2. Re-melting conditions and studied cooling rates for Si–Mg alloys.
In the preparation of Si–Mg alloys, the proper quantities of the mentioned silicon alloys were put inside an isotropic cylindrical graphite crucible (inner diameter: 70 mm and height: 150 mm). Prior to heating, the graphite crucible was placed into the induction furnace chamber. The furnace chamber was then evacuated and purged with argon gas three times and finally purged with continuous argon gas flow kept at 1,030–1,050 mbar. The crucible was then heated up to 1,450°C. After all of the silicon melted, the cut Mg pieces were then doped into the melt for alloying. The molten alloy was further held for 5 min at 1,450°C, with intensive stirring induced by the electromagnetic force. The homogenized Si–Mg molten alloy was then cast into a water-cooled copper mold.
Following the casting process, the obtained bulk alloys were crushed for metallographic characterization and served as the feedstock for further re-melting tests with controlled cooling. In the re-melting experiments, a graphite tube resistance furnace was used, enabling controlled cooling rates of 3, 10, 25, 40, and 80°C/min during the alloy solidification process. Approximately 20 g of the crushed Si–Mg lumps was charged into an isotropic graphite crucible (inner diameter: 34 mm and height: 40 mm). Although the Mg loss was insignificant and can be ignored due to the low chemical activity in the melt, a graphite lid was used to cover the crucible during the re-melting to minimize magnesium loss due to evaporation. The solidified samples were again crushed for metallographic sample preparation.
The microstructure of all obtained alloy samples was characterized by scanning electron microscopy (SEM, Zeiss SUPRA 55-VP) coupled with energy-dispersive X-ray spectroscopy (EDS) elemental analysis for phase identification and an electron backscatter diffraction (EBSD) detector for crystallographic properties measurement. A high-energy beam of 20 kV was employed as the accelerating voltage for the EBSD setting. In addition, the specimen was pre-tilted to 70° on the z-axis toward the phosphorus screen with a working distance of approximately 20 mm. To make the diffraction pattern center accurately align with the detector, the specimen was prepared carefully to ensure that the surface has as little topography as possible.
To determine the grain size of primary silicon in all of the samples, two sets of measurements were conducted. The first approach involved grain size analysis through EBSD supported by software in compliance with ASTM E2627 standards. Concurrently, manual grain counting was executed as per ASTM E112 standards. This latter method employed Heyn’s linear intercept technique, wherein each line was counted upon intersecting a grain boundary in the captured image. Counting was done on two sides of the sample, the planar and radial sides. The counting was done on each of the planes to find the mean linear intercept based on Eq. 1
where
where
In addition to the Si crystal analysis, the volume fraction of the Mg2Si phase was also investigated. The volume fraction of the Mg2Si phase was estimated according to two approaches, respectively, automatic calculation through ImageJ software and manual counting based on the ASTM E562. With the ImageJ approach, the volume fraction of phases was determined by calculating the ratio of the number of pixels representing the phase or feature of interest to the total number of pixels in the image. For each sample, analyses were conducted on five fields, and the manual counting method employed 100 grid points per field. The counting was done when the grid point intersected the targeted fraction, which can be expressed as Eq. 4:
where
From the standard deviation, the 95% confidence interval (CI) can be calculated as Eq. 6:
where 95% CI is the confidence interval and t is the multiplier determined by the field counted; the value of t is set to 2.776 following the standard table based on the five fields being counted.
Therefore, volume fraction (Vv) is calculated using the average grid point count (
The microstructure of the 5.5 wt% and 9.0 wt% alloys with different cooling rates is displayed in Figures 1, 2. In the obtained Si–Mg alloys, the primary Si phase, formed above the eutectic isotherm, serves as the matrix, while the eutectic phase forms a distinct two-phase network, which is composed of the darker Mg2Si phase and the secondary Si. Moreover, it is evident that the cooling rate has a significant impact on the alloy microstructure. First, when the cooling rate is reduced from the casting condition to 3°C/min, the size of the primary silicon grain increases significantly. Taking the sample with 9.0 wt% Mg addition as an example, the thickness of the primary Si escalated from roughly 100 μm in the casting sample to nearly 1,000 μm during the slower cooling at 3°C/min. In addition, the magnesium alloying concentration and the cooling rate also affect the morphology of the primary Si. The slowest cooling rate of 3°C/min resulted in an elongated platelet shape, while the rapidly cooled sample shows a more equiaxed shape. Furthermore, the interface region between the primary Si and eutectic phases also exhibits distinct variations. In the casting sample, it appears shorter and more curved, while it becomes longer and linear in the slowly cooled specimens. Correspondingly, the sizes of Mg2Si and secondary Si within the eutectic phase region also increase as the cooling rate decreases. When comparing the influence of the magnesium addition quantity on the microstructure, the alloy with 9.0 wt% Mg content has a higher proportion of the eutectic phase than the alloy with 5.5 wt% Mg content, and its distribution becomes more concentrated with increasing magnesium content.
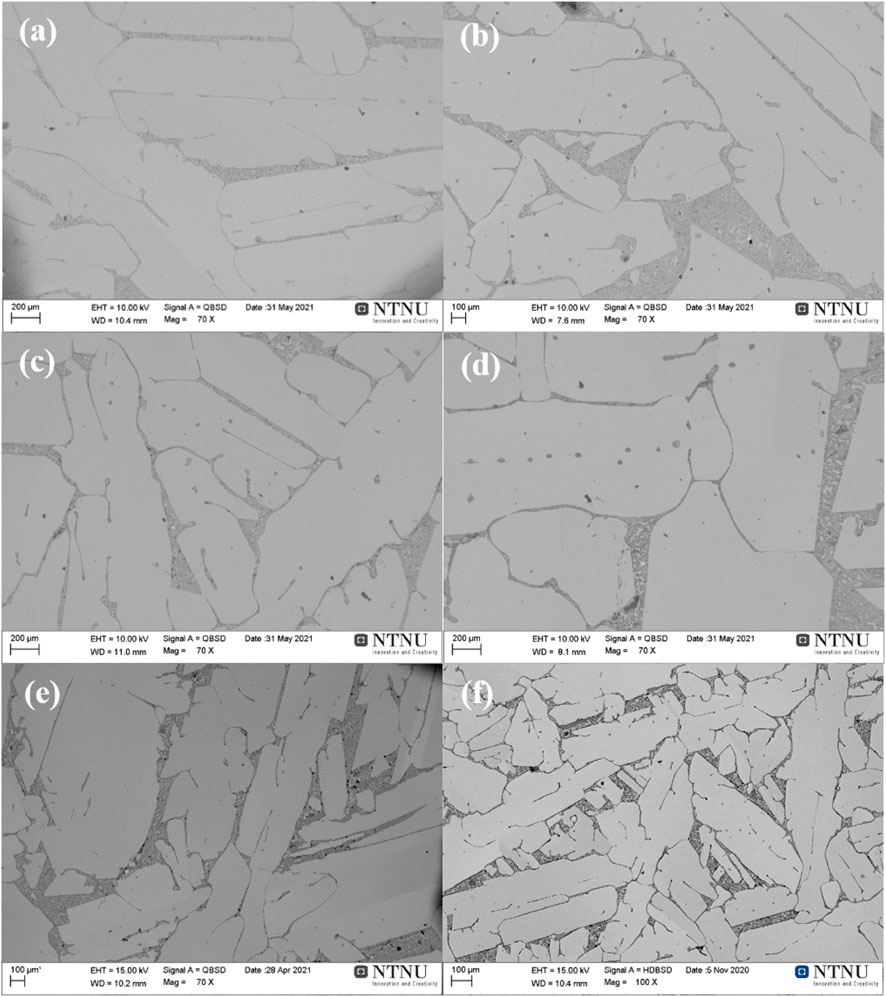
FIGURE 1. Microstructure of alloys with 5.5 wt% Mg cooled at rates of (A) 3°C/min, (B) 10°C/min, (C) 25°C/min, (D) 40°C/min, (E) 80°C/min, and (F) casting.
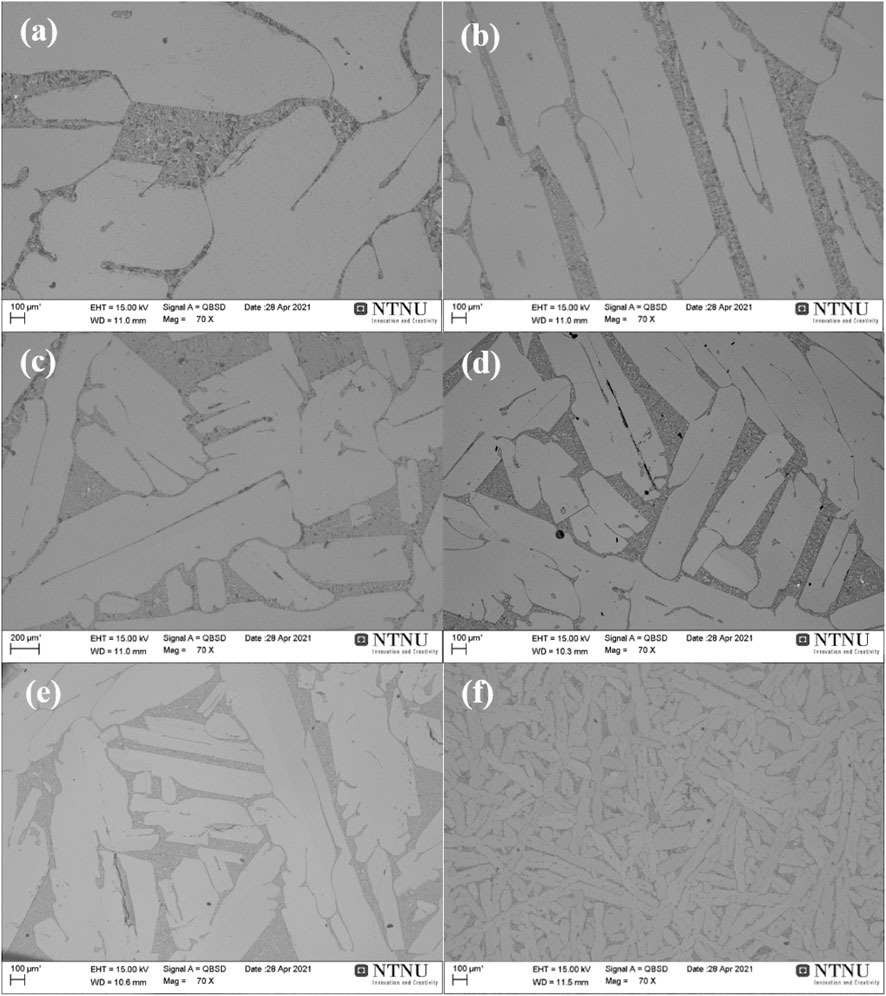
FIGURE 2. Microstructure of alloys with 9.0 wt% Mg cooled at rates of (A) 3°C/min, (B) 10°C/min, (C) 25°C/min, (D) 40°C/min, (E) 80°C/min, and (F) casting.
The morphology of the eutectic phase was also significantly affected by the cooling rate and the alloying concentration. As can be seen in the secondary electron imaging in Figure 3, an increased cooling rate results in a significant reduction in the size of Mg2Si precipitates and the thickness of secondary Si. Conversely, a higher magnesium alloying concentration leads to larger Mg2Si precipitate phases.
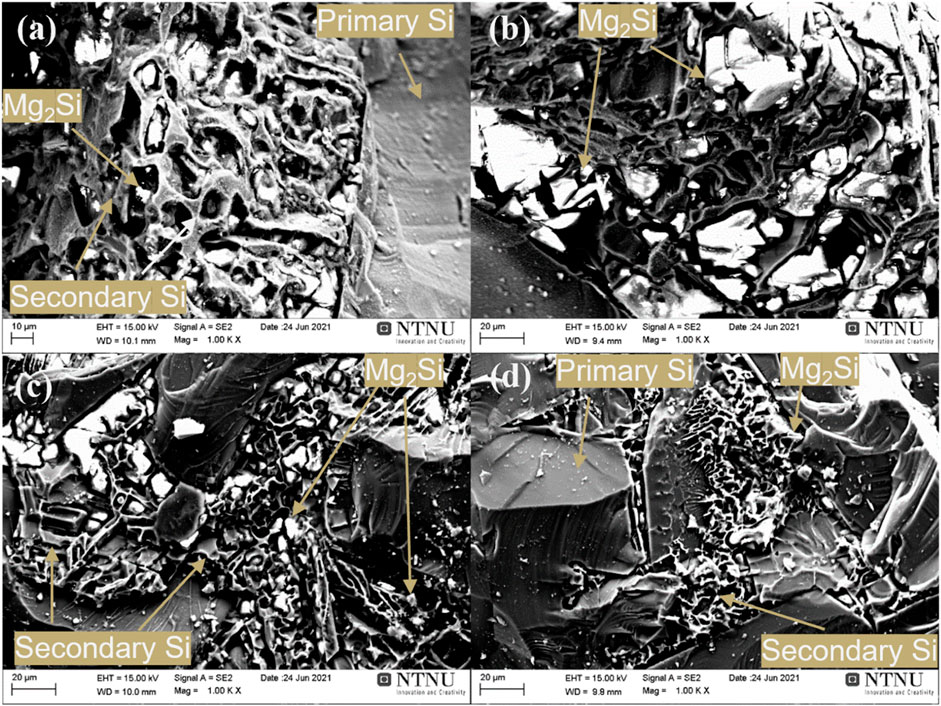
FIGURE 3. Morphology of the alloys with (A) 5.5 wt% Mg cooled at 3°C/min, (B) 9.0 wt% Mg cooled at 3°C/min, (C) 5.5 wt% Mg by casting, and (D) 9.0 wt% Mg by casting.
The result of the phase fraction analysis based on the two methods can be seen in Figure 4. In this analysis, the area percentage obtained by ImageJ serves as an approximate indicator of the volume percentage of the phases. A clear trend can be observed that as the cooling rate increases, the Mg2Si phase fraction continuously decreases. Taking the 9.0 wt% Mg sample as an example, in the sample with the slowest cooling rate of 3°C/min, the Mg2Si phase fraction determined by both methods is around 20%. However, in the casting sample, this value diminishes to only about 12%. These findings indicate that although faster cooling brings about a higher thermodynamic driving force for the eutectic phase nucleation, it concurrently constrains the growth of the eutectic phase and, finally, the finer eutectic structure formed. The finer eutectic structure may also reduce the leaching efficiency due to the decreased precipitate phase fraction, and it is unfavorable for the enrichment of other impurity phases.
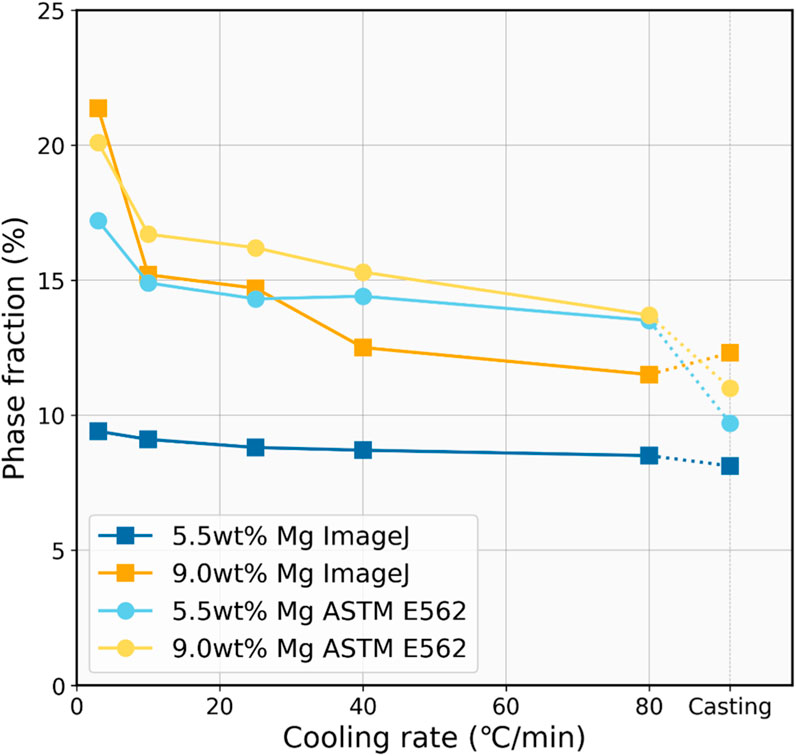
FIGURE 4. Estimated volume fraction of the Mg2Si phase as a function of cooling rate for comparison.
In addition, both methods demonstrated that the Mg2Si phase fraction in the 9.0 wt% Mg alloys is higher than that in the 5.5 wt% Mg alloys. However, the manual counting method indicated that the two are very close, while the calculation through ImageJ showed a larger difference between them, which is more consistent with the theoretical calculations. According to the lever rule, during fully equilibrium solidification, the Mg2Si phase fractions corresponding to 5.5 wt% Mg and 9.0 wt% Mg should be 11.6% and 19.0%, respectively. This is similar to the results obtained from ImageJ. It can also be observed that as the cooling rate increases, the obtained values deviate further from the values at equilibrium. Thus, it can be inferred that there might be some deviation in the results obtained from manual counting, possibly due to the insufficient grid number.
The observed precipitates embedded inside the eutectic phase were subjected to further compositional analysis by EDS. The main impurity phase and elemental distribution are shown in Figures 5, 6. The quaternary intermetallic CaAl6Fe4Si8 was primarily identified as the main impurity phase in the samples with a controlled cooling rate, while a minor Si–Al–Fe ternary phase was also observed, particularly in the casted samples. More importantly, as illustrated in Figure 5, all the impurity-containing silicide is exclusively located within the eutectic phase and appears to be concentrated in this area. This phenomenon was evident in samples with different alloy compositions and cooling rates. However, compared with the typical microstructure of MG-Si without Mg alloying, as reported in previous works (Espelien et al., 2017a; Espelien and Safarian, 2017; Zhu et al., 2018), the distribution of the impurity phase in the samples without the impurity getter is very dispersed and small along the grain boundaries of silicon grains. Thus, the Mg alloying can facilitate the impurity removal in the leaching process by enriching them into the reactive silicide phase. Moreover, their enrichment in the eutectic area also implies that they can be separated out physically as the reactive Mg2Si phase dissolves in the solution, resulting in an improved removal degree during HCl leaching (Espelien and Safarian, 2017; Zhu et al., 2020a). It is worth mentioning that without the addition of an impurity getter, the efficient removal of the transition metal-containing impurity phase requires the use of HF due to its poor reactivity with common acids, which inevitably leads to Si loss. Therefore, the addition of Mg emerges as an efficient method for impurity gathering and removal.
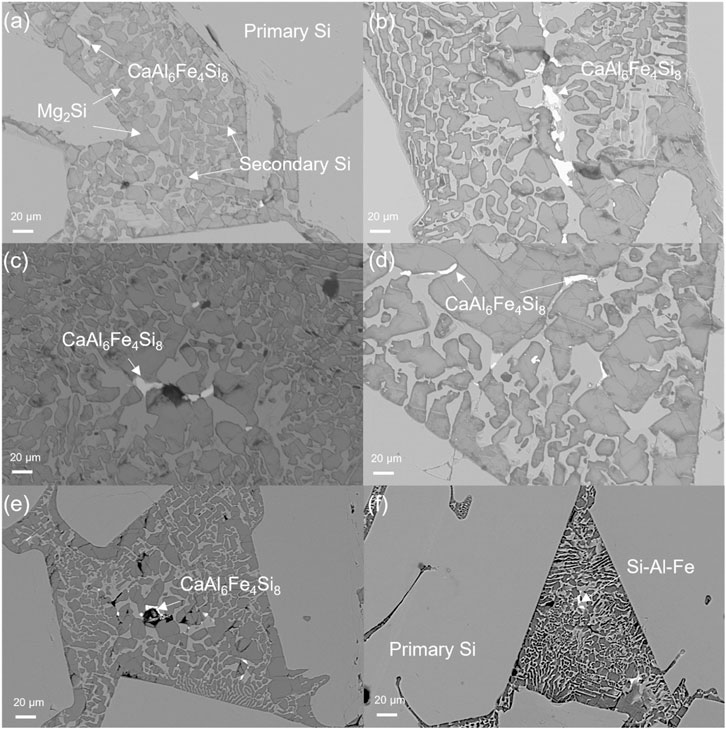
FIGURE 5. Impurity phases in 9.0 wt% Mg alloys at (A) 3°C/min, (B) 10°C/min, (C) 25°C/min, (D) 40°C/min, (E) 80°C/min, and (F) higher than 100°C/min cooling rate.
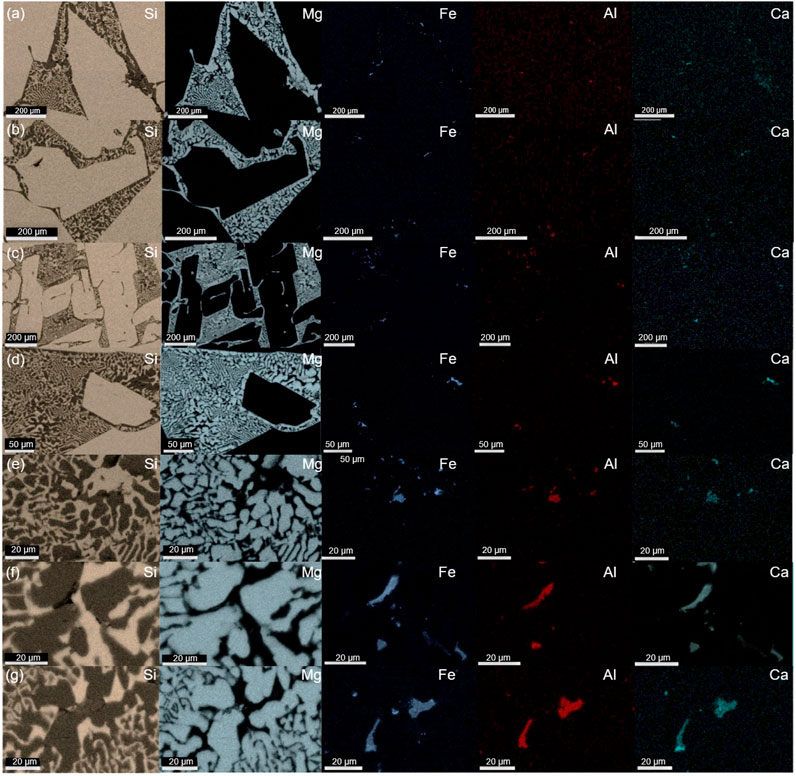
FIGURE 6. EDS elemental mapping of 5.5 wt% Mg alloys cooled at rates of (A) 3°C/min, (B) 10°C/min, (C) 25°C/min, (D) 40°C/min, (E) 80°C/min and 9.0 wt% Mg alloys at (F) 40°C/min, and (G) 80°C/min.
The EBSD results are shown in Figures 7, 8. It can be seen that the cooling rate directly affects not only the grain size but also the distribution of crystal orientations. Since both cast samples display a varied crystal orientation distribution with a large extent of heterogeneity, this indicates that grains had little time for directional growth, leading to multiple nucleation sites and rapid evolution. The anisotropy in the rapidly cooled samples also led to ineffective segregation and distribution of impurities. In contrast, samples cooled slowly showed increased homogeneity in Si crystal orientation, suggesting preferential growth of Si grains. Furthermore, crystal morphology transitions from equiaxed in rapidly cooled samples to more elongated shapes, indicating reduced thermal disturbance and longer grain growth periods. In addition, it is also evident that the Mg2Si eutectic precipitates, marked as white areas, localize predominantly along the primary Si grains. The grain boundary properties are also significantly influenced by the cooling rate. In cast samples, a finer and more intricate intergranular morphology potentially limits impurity exposure to leaching agents.
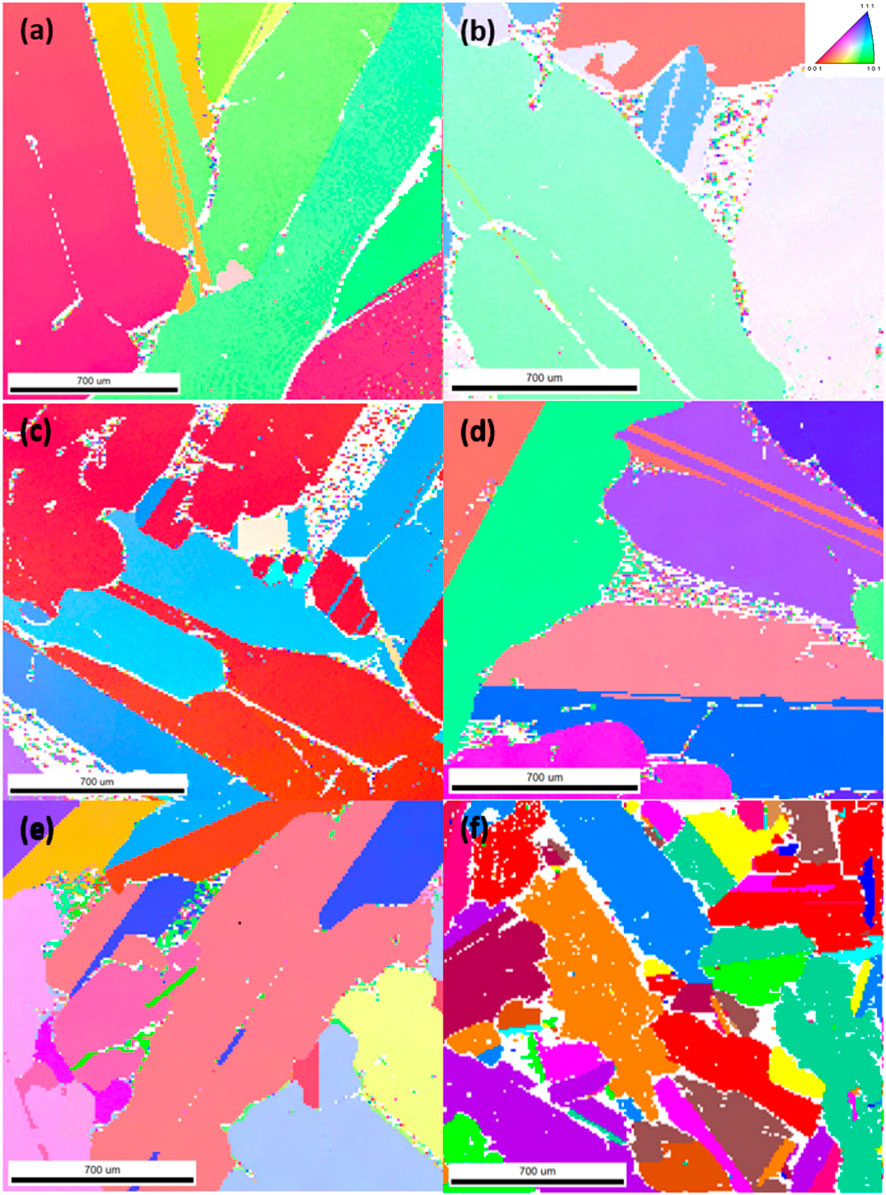
FIGURE 7. EBSD results of 5.5 wt% Mg alloy cooled at rates of (A) 3°C/min, (B) 10°C/min, (C) 25°C/min, (D) 40°C/min, (E) 80°C/min, and (F) casting.
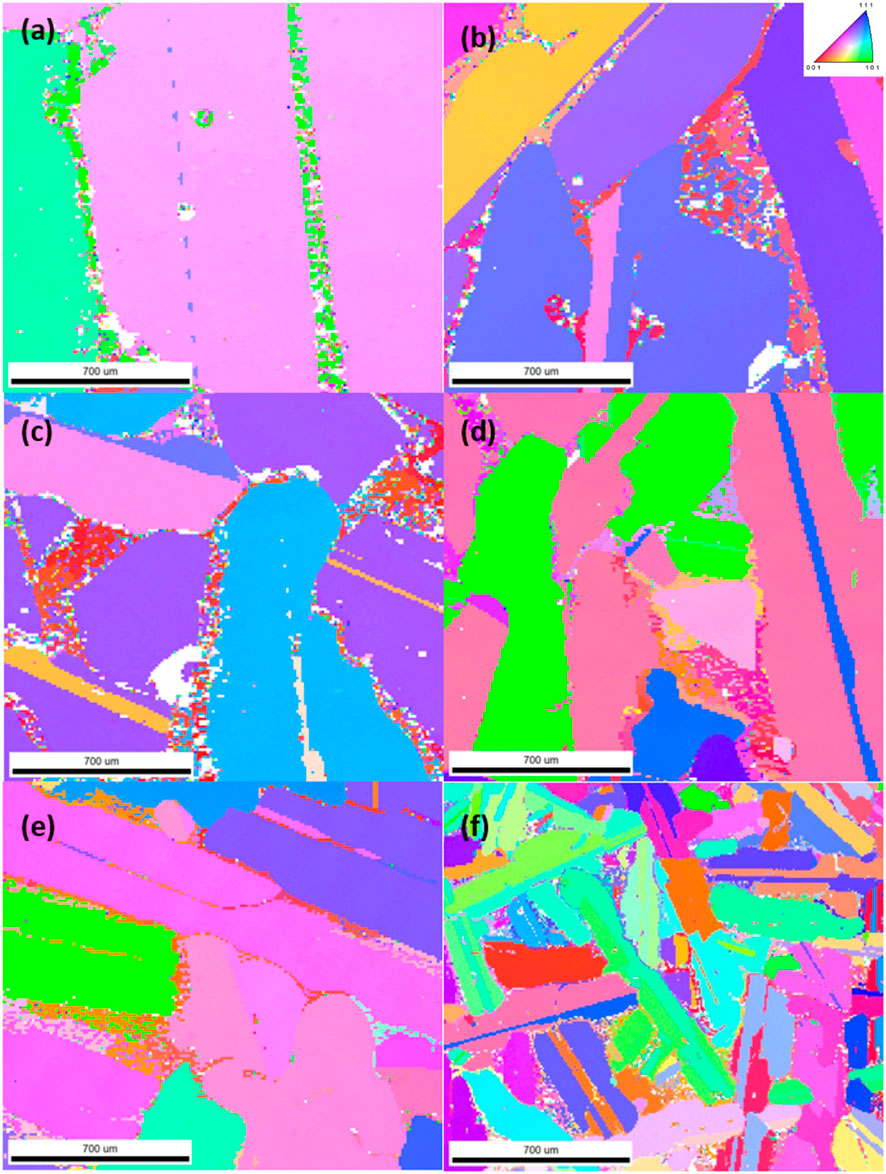
FIGURE 8. EBSD results of 9.0 wt% Mg alloys cooled at rates of (A) 3°C/min, (B) 10°C/min, (C) 25°C/min, (D) 40°C/min, (E) 80°C/min, and (F) casting.
The relationship between ASTM grain size number (G) and the cooling rate was measured using two methodologies: EBSD software analysis, in compliance with ASTM E2627 standards, and manual determination, following ASTM 112 standards. The results are presented in Figure 9.
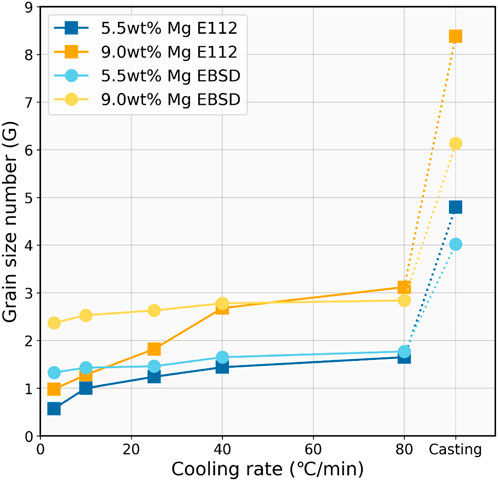
FIGURE 9. ASTM grain size number (G) as a function of cooling rate (°C/min) measured by EBSD and ASTM E112 methods.
Both measurement methods consistently show a clear trend that as the cooling rate increases, the ASTM grain size number also increases. This suggests that faster cooling rates are associated with smaller silicon grain sizes, as the ASTM grain size number is inversely proportional to the actual grain size.
For the 5.5 wt% Mg alloying samples, the E112 method starts at a grain size number of approximately 0.57 at the cooling rate of 3°C/min, which moderately elevates to about 1.65 by 80°C/min cooling and eventually reaches around 4.8 by casting. In comparison, the EBSD measurement for the Si–5.5 wt% Mg alloys begins at a slightly higher grain size number of around 0.98 at 3°C/min and increases gradually to 1.77 by 80°C/min cooling and reaches 4.02 of the casting sample.
The 9.0 wt% Mg alloys display a larger G number than the 5.5 wt% Mg alloys at a given cooling rate, which indicates a grain refinement effect with increasing Mg addition. However, the 9.0 wt% Mg alloy samples also exhibit more distinct variations from the two methods, particularly in the E112 manual measurement. The grain size number is 0.98 at 3°C/min cooling and increases to about 3.12 by 80°C/min cooling, and it finally reaches 8.38 in the casting sample. However, the EBSD measurement suggests smoother growth within the controlled cooling region and eventually reaches 6.13 for the casting sample. A difference in results in the two methods can be seen. EBSD grain size analysis was shown to be much more stable compared with ASTM E112, and the different grain size between the two alloys does not fluctuate too much. The largest and lowest grain size number can be seen in the ASTM E112 analysis method for both alloys of 5.5 wt% and 9.0 wt%. The divergence might indicate differences in sensitivity to microstructural features, particularly the manual measurement’s imprecision. Overall, the grain size measurement underscores the crucial influence of the cooling rate on grain refinement, with faster cooling resulting in more refined microstructures.
Based on the analysis of grain size presented above, the impact of the cooling rate on the microstructure can be explained through the mechanisms of nucleation and grain growth, as depicted in Figure 10. When the melt reaches the liquidus temperature of the Si–Mg alloy, nucleation of primary Si begins, and impurities are expelled into the surrounding liquid phase by the growing solid silicon. As the temperature further decreases, the Si crystals grow larger, leading to an increased enrichment of impurities in the liquid phase. When the temperature decreases to the eutectic phase of the Si–Mg alloy, the reaction L → Si + Mg2Si happens, where the secondary Si grains are formed together with Mg2Si along the grain boundaries in an eutectic pattern.
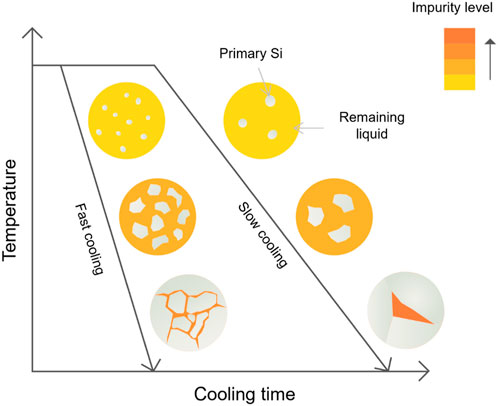
FIGURE 10. Sketch of the Si–Mg alloy solidification process under varying cooling rates.
With an increased cooling rate, the high extent of overcooling leads to enhanced nucleation as more equiaxed primary Si grains can be observed, especially in the cast samples. Due to the limited diffusion time, the grain growth is suppressed, and although there is a certain level of impurities expelled into the liquid phase, the overall segregation is still limited. On the contrary, under slower cooling rates, although the driving force of nucleation is reduced, the primary Si grains have more time to grow larger, and the phase fraction of the precipitated Mg2Si increases as well, resulting in more impurities being enriched.
The effect of magnesium alloying concentration on the microstructure is illustrated in Figure 11. It suggests that as the magnesium concentration increases, less silicon forms as the primary Si grain because more silicon reacts with magnesium to generate the Mg2Si phase. Accordingly, a larger eutectic phase will form. As an impurity getter, Mg significantly reduces the segregation coefficient of P in Si. Thus, with a higher concentration of magnesium in the liquid phase, more P is enriched into the final eutectic phase. Thus, it is expected that higher alloying concentration results in a larger leachable phase volume, and higher impurity removal can be achieved. However, it also needs to be noted that higher magnesium content in the alloy may also lead to higher alloying material cost, larger acid consumption, and higher Si loss during acid leaching. Thus, in terms of cost–benefit analysis, optimal conditions require keeping the cooling rate and magnesium concentration within reasonable ranges to minimize costs. This entails minimizing magnesium addition and maximizing the cooling rate, all while ensuring sufficient impurity segregation is achieved.
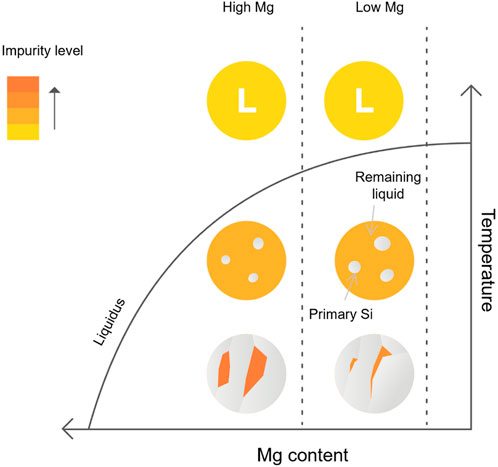
FIGURE 11. Sketch of the Si–Mg alloy solidification process with varying alloy composition.
In the present work, commercial MG-Si was alloyed with 5.5 wt% and 9.0 wt% magnesium and was further re-melted, and then it was subjected to five different cooling rates (3, 10, 25, 40, and 80°C/min) in addition to a casting process. The microstructure of the alloys was studied and investigated. It was found that a high cooling rate process and high Mg concentration resulted in a reduction in primary Si grain size. The fast-cooling rate resulted in a more equiaxed shape, whereas a slow-cooling rate yielded a more elongated platelet shape. The results were further confirmed by the EBSD measurements, and an increased heterogeneity of crystallographic orientation was observed with the increasing cooling rate. In addition, the phase fraction of the Mg2Si phase also follows a similar trend, where slower cooling and higher alloying concentration of Mg led to increased Mg2Si phase fraction. This study contributes to the optimization of the alloying–leaching process for silicon purification, as maintaining both the cooling rate and alloying content within reasonable ranges is essential for process cost efficiency. This involves minimizing magnesium addition and maximizing the cooling rate while also ensuring sufficient impurity segregation and achieving adequate alloy microstructure morphology.
The original contributions presented in the study are included in the article/Supplementary material; further inquiries can be directed to the corresponding author.
MZ: investigation, writing–original draft and writing–review and editing. JS: writing–review and editing, validation, and supervision. MI: investigation, writing–original draft. MD: writing–review and editing, validation, and supervision.
The author(s) declare that financial support was received for the research, authorship, and/or publication of this article. Financial support was received for the research from the Research Centre for Sustainable Solar Cell Technology (FME SuSolTech, Project No. 257639).
This work was performed at Norwegian University of Science and Technology (NTNU) within the Research Centre for Sustainable Solar Cell Technology (FME SuSolTech, Project No. 257639) and was co-sponsored by the Norwegian Research Council and industry partners.
The authors declare that the research was conducted in the absence of any commercial or financial relationships that could be construed as a potential conflict of interest.
All claims expressed in this article are solely those of the authors and do not necessarily represent those of their affiliated organizations, or those of the publisher, the editors, and the reviewers. Any product that may be evaluated in this article, or claim that may be made by its manufacturer, is not guaranteed or endorsed by the publisher.
Aas, H. (1971). The silgrain process: silicon metal from 90% ferrosilicon. Proc. Symposia 100th AIME Annu. Meet. A71-47, 650–667.
Ceccaroli, B., and Tronstad, R. (2016). “Chapter 4 Elkem solar and the Norwegian PV industry through 40 Years (1975-2015),” in Solar silicon processes (Germany: CRC Press), 141–198. doi:10.1201/9781315369075-5
Dietl, J. (1983). Hydrometallurgical purification of metallurgical-grade silicon. Sol. Cells 10, 145–154. doi:10.1016/0379-6787(83)90015-7
Dueñas Díez, M., Fjeld, M., Andersen, E., and Lie, B. (2006). Validation of a compartmental population balance model of an industrial leaching process: the Silgrain process. Chem. Eng. Sci. 61, 229–245. doi:10.1016/j.ces.2005.01.047
Espelien, S., and Safarian, J. (2017). Effect of acid leaching conditions on impurity removal from silicon doped by magnesium. AIMS Energy 5, 636–651. doi:10.3934/energy.2017.4.636
Espelien, S., Tranell, G., and Safarian, J. (2017a). Effect of magnesium addition on removal of impurities from silicon by hydrometallurgical treatment. Cham: Springer, 355–365. doi:10.1007/978-3-319-52192-3_35
Huang, L., Danaei, A., Thomas, S., Xing, P., Li, J., Luo, X., et al. (2018). Solvent extraction of phosphorus from Si-Cu refining system with calcium addition. Sep. Purif. Technol. 204, 205–212. doi:10.1016/J.SEPPUR.2018.04.087
Hunt, L. P., Dosaj, V. D., McCormick, J. R., and Crossman, L. D. (1976). Production of solar-grade silicon from purified metallurgical silicon. 12th IEEE Photovolt. Spec. Conf., 125–129.
IRENA (2023). World energy transitions outlook 2023: 1.5°C pathway. Abu Dhabi Available at: https://www.irena.org/Publications/2023/Jun/World-Energy-Transitions-Outlook-2023 (Accessed October 27, 2023).
Jakobsson, L. K. (2013). Distribution of boron between silicon and CaO2, MgO-SiO2, CaO-MgO-SiO2 and CaO-Al2O3-SiO2 slags at 1600 ° C.
Lei, Y., Sun, L., Ma, W., Ma, X., Wu, J., Li, S., et al. (2018). An approach to employ titanium-bearing blast-furnace slag to prepare Ti and Al–Si alloys. J. Alloys Compd. 769, 983–990. doi:10.1016/j.jallcom.2018.08.077
Ma, X., Lei, Y., Yoshikawa, T., Zhao, B., and Morita, K. (2015). Effect of solidification conditions on the silicon growth and refining using Si–Sn melt. J. Cryst. Growth 430, 98–102. doi:10.1016/J.JCRYSGRO.2015.08.001
Ma, X., Yoshikawa, T., and Morita, K. (2013). Si growth by directional solidification of Si–Sn alloys to produce solar-grade Si. J. Cryst. Growth 377, 192–196. doi:10.1016/J.JCRYSGRO.2013.05.024
Margarido, F., Bastos, M. H., Figueiredo, M. O., and Martins, J. P. (1994). The structural effect on the kinetics of acid leaching refining of Fe-Si alloys. Mater Chem. Phys. 38, 342–347. doi:10.1016/0254-0584(94)90211-9
Margarido, F., Martins, J. P., Figueiredo, M. O., and Bastos, M. H. (1993). Kinetics of acid leaching refining of an industrial Fe-Si alloy. Hydrometallurgy 34, 1–11. doi:10.1016/0304-386X(93)90077-Q
Meteleva-Fischer, Y. V., Yang, Y., Boom, R., Kraaijveld, B., and Kuntzel, H. (2013). Microstructure of metallurgical grade silicon and its acid leaching behaviour by alloying with calcium. Trans. Institutions Min. Metallurgy, Sect. C Mineral Process. Extr. Metallurgy 122, 229–237. doi:10.1179/0371955313Z.00000000068
REN (2023). RENEWABLES 2023 GLOBAL STATUS REPORT. Available at: https://www.ren21.net/gsr-2023/modules/global_overview/(Accessed October 27, 2023).
Ren, Y., Wang, H., and Morita, K. (2018). Growth control and enrichment of Si crystals from Si-Sn melt by directional solidification. Vacuum 158, 86–92. doi:10.1016/j.vacuum.2018.09.044
Ren, Y., Wang, H., and Morita, K. (2019). Effect of Zr addition on B-removal behaviour during solidification purification of Si with Si–Sn solvent. Vacuum 167, 319–328. doi:10.1016/j.vacuum.2019.06.029
Santos, I. C., Goncalves, A. P., Santos, C. S., Almeida, M., Afonso, M. H., and Cruz, M. J. (1990). Purification of metallurgical grade silicon by acid leaching. Hydrometallurgy 23, 237–246. doi:10.1016/0304-386x(90)90007-o
Schei, A. (1985). “High purity silicon production,” in International seminar on refining and alloying of liquid aluminium and Ferro-alloys (Trondheim, Norway).
Shimpo, T., Yoshikawa, T., and Morita, K. (2004). Thermodynamic study of the effect of calcium on removal of phosphorus from silicon by acid leaching treatment. Metallurgical Mater. Trans. B 35, 277–284. doi:10.1007/s11663-004-0029-1
Thomas, S., Huang, L., and Barati, M. (2021). A review of slag refining of crude silicon. Jom 73, 260–281. doi:10.1007/s11837-020-04470-4
Yoshikawa, T., and Morita, K. (2003). Removal of phosphorus by the solidification refining with Si-Al melts. Sci. Technol. Adv. Mater 4, 531–537. doi:10.1016/j.stam.2003.12.007
Yoshikawa, T., and Morita, K. (2012). An evolving method for solar-grade silicon production: solvent refining. JOM 64, 946–951. doi:10.1007/s11837-012-0371-8
Zhu, M., Azarov, A., Monakhov, E., Tang, K., and Safarian, J. (2020a). Phosphorus separation from metallurgical-grade silicon by magnesium alloying and acid leaching. Sep. Purif. Technol. 240, 116614. doi:10.1016/j.seppur.2020.116614
Zhu, M., Murgau, A., and Safarian, J. (2018). Effects of magnesium-doping on silicon leaching for solar grade feedstock production. Eur. Photovolt. Sol. Energy Conf. Exhib., 465–468. doi:10.4229/35thEUPVSEC20182018-2AV.1.3
Zhu, M., Yue, S., Wu, G., Tang, K., Xu, Y., and Safarian, J. (2021). P removal from Si by Si-Ca-Al alloying-leaching refining: effect of Al and the CaAl2Si2 phase. Sep. Purif. Technol. 271, 118675. doi:10.1016/j.seppur.2021.118675
Keywords: silicon, magnesium, cooling rate, microstructure, grain size
Citation: Zhu M, Safarian J, Irvansyah MIAF and Di Sabatino M (2024) Effect of Mg alloying and cooling rate on the microstructure of silicon. Front. Photonics 5:1334122. doi: 10.3389/fphot.2024.1334122
Received: 06 November 2023; Accepted: 19 February 2024;
Published: 04 March 2024.
Edited by:
Marco Peccianti, Loughborough University, United KingdomReviewed by:
Sergio Pizzini, University of Milano-Bicocca, ItalyCopyright © 2024 Zhu, Safarian, Irvansyah and Di Sabatino. This is an open-access article distributed under the terms of the Creative Commons Attribution License (CC BY). The use, distribution or reproduction in other forums is permitted, provided the original author(s) and the copyright owner(s) are credited and that the original publication in this journal is cited, in accordance with accepted academic practice. No use, distribution or reproduction is permitted which does not comply with these terms.
*Correspondence: Mengyi Zhu, bWVuZ3lpLnpodUBudG51Lm5v
Disclaimer: All claims expressed in this article are solely those of the authors and do not necessarily represent those of their affiliated organizations, or those of the publisher, the editors and the reviewers. Any product that may be evaluated in this article or claim that may be made by its manufacturer is not guaranteed or endorsed by the publisher.
Research integrity at Frontiers
Learn more about the work of our research integrity team to safeguard the quality of each article we publish.