
95% of researchers rate our articles as excellent or good
Learn more about the work of our research integrity team to safeguard the quality of each article we publish.
Find out more
REVIEW article
Front. Photonics , 26 September 2022
Sec. Biophotonics
Volume 3 - 2022 | https://doi.org/10.3389/fphot.2022.964719
This article is part of the Research Topic Biophotonics Technologies for Clinical Translation View all 8 articles
 Mark Witteveen1
 Dirk J. Faber2Henricus J. C. M. Sterenborg1,2Theo J. M. Ruers1
 Ton G. van Leeuwen2
 Anouk L. Post1,2*
For a long time, steady-state reflectance spectroscopy measurements have been performed so that diffusion theory could be used to extract tissue optical properties from the reflectance. The development of subdiffuse techniques, such as Single Fiber Reflectance Spectroscopy and subdiffuse SFDI, provides new opportunities for clinical applications since they have the key advantage that they are much more sensitive to the details of the tissue scattering phase function in comparison to diffuse techniques. Since the scattering phase function is related to the subcellular structure of tissue, subdiffuse measurements have the potential to provide a powerful contrast between healthy and diseased tissue. In the subdiffuse regime, the interrogated tissue volumes are much smaller than in the diffuse regime. Whether a measurement falls within the diffuse or subdiffuse regime depends on tissue optical properties and the distance between the source and detector fiber for fiber-optic techniques or the projected spatial frequency for hyperspectral imaging and SFDI. Thus, the distance between source and detector fibers or the projected spatial frequency has important implications for clinical applications of reflectance spectroscopy and should be carefully selected, since it influences which tissue optical properties the technique is sensitive to and the size of the tissue volume that is interrogated. In this paper, we will review the opportunities and pitfalls in steady-state reflectance spectroscopy in the subdiffuse and the diffuse regime. The discussed opportunities can guide the choice of either the diffuse or subdiffuse regime for a clinical application, and the discussed pitfalls can ensure these are avoided to enable the development of robust diagnostic algorithms. We will first discuss the relevant basics of light-tissue interaction. Next, we will review all the tissue scattering phase functions that have been measured and investigate which scattering phase function models are representative of tissue. Subsequently, we will discuss the sensitivity of diffuse and subdiffuse techniques to tissue optical properties and we will explore the difference in the interrogation depth probed by diffuse and subdiffuse techniques.
When tissue changes from healthy to diseased, anatomical and physiological changes can occur which in turn can influence the absorption and scattering of light by the tissue. Reflectance spectroscopy techniques are sensitive to these changes and, therefore, have been investigated for many clinical applications (O’Sullivan et al., 2012; Lu and Fei, 2014; Akter et al., 2018; Gioux, Mazhar and Cuccia, 2019). For example, reflectance spectroscopy has been used to image resection margins during cancer surgery and to examine internal organs through endoscopes and biopsy needles (Fawzy et al., 2006; Stegehuis et al., 2017; Lin et al., 2018; McClatchy et al., 2018; Kho et al., 2019a; Jansen-Winkeln et al., 2019; Post et al., 2021). In steady-state reflectance spectroscopy, a broadband light source is used to illuminate tissue and after light interacts with tissue the remitted light is detected. Reflectance spectroscopy measurements can be performed either with fiber-optic or wide-field techniques. In fiber-optic techniques light is emitted and collected through fibers; in wide-field techniques, tissue is illuminated with either a uniform intensity (hyperspectral imaging, HSI) or a line pattern (spatial frequency domain imaging, SFDI (Cuccia et al., 2005)) and the reflected light is collected by a camera. In essence, HSI is equivalent to SFDI with a spatial frequency of zero.
For a long time, reflectance spectroscopy measurements have been performed with large distances between the source and detector fibers or low spatial frequencies, so diffusion theory could be used to extract tissue optical properties from these measurements. For diffusion theory to apply the distance between where photons are emitted and collected should be much larger than one transport mean free path
Scattering and absorption of light by tissue can be summarized in three optical properties: the scattering coefficient

FIGURE 1. Diffuse and subdiffuse implementations of steady-state reflectance spectroscopy. In fiber-optic techniques (top row) light is emitted (downward arrows) and collected (upward arrows) by fibers. In wide-field imaging techniques (bottom row), tissue is illuminated with sinusoidal intensity patterns of different spatial frequencies and collected by a camera. A spatial frequency
In this manuscript, we will review the opportunities and pitfalls in steady-state reflectance spectroscopy in the subdiffuse and the diffuse regime. We will not discuss the technical details of the many different device geometries used in steady-state reflectance spectroscopy, for which we refer to the papers of (Utzinger and Richards-Kortum, 2003) for fiber-optic reflectance spectroscopy, (Lu and Fei, 2014) for hyperspectral imaging, (Gioux, Mazhar and Cuccia, 2019) for SFDI; and (O’Sullivan et al., 2012) for Diffuse Optical Imaging. The opportunities and pitfalls described in this paper generally apply to any type of reflectance spectroscopy technique. Additional opportunities and pitfalls unique to individual techniques are beyond the scope of this article.
We will first discuss the basics of light-tissue interaction relevant to understanding the difference between diffuse and subdiffuse measurements. Next, we will provide a review of all the tissue scattering phase functions that have been measured since the tissue scattering phase function is fundamental for both modeling and interpretation of subdiffuse measurements. Subsequently, we will discuss the sensitivity of diffuse and subdiffuse techniques to tissue optical properties and we will explore the difference in the interrogation depth probed by diffuse and subdiffuse techniques. Based on our review of the scattering phase function, sensitivity to optical properties, and the interrogation depth, we will discuss the opportunities and pitfalls in (sub)diffuse reflectance spectroscopy.
We have performed Monte Carlo (MC) simulations to illustrate the basics of light-tissue interaction and how the sensitivity to optical properties and the interrogation depth differs between subdiffuse and diffuse measurements. The reflectance measured with fiber-optic as well as wide-field techniques can be calculated from the reflectance as a function of radial distance
For our MC simulations, we used a modified version (Post et al., 2017) of the software package MCML (Prahl, 1989; Wang, Jacques and Zheng, 1995) which enables simulating any scattering phase function using the method of (Zijp and ten Bosch, 1994). For the phase functions, we generated inverse lookup tables of 10.000 tabulated values. For each simulation we obtained histograms for the number of detected photons, the number of scattering events, the path length, the maximum depth detected photons had reached and all scattering angles of detected photons. For the reflectance, a 1D histogram was created where the weight of each detected photon was stored versus radial distance, with a 0.1 mm bin size. The reflectance was then normalized by dividing over the area of the annulus corresponding to that radial bin (
For the path length and the interrogation depth, 2D histograms were created where the weight of each detected photon was stored versus radial distance with a 0.1 mm bin size and interrogation depth
and
For each analysis, we will provide the optical properties of the tissue used in the MC simulations in the figure captions. Unless specified otherwise, we assumed refractive index matching between tissue and the surrounding medium (no refraction or reflection), and photons were detected irrespective of their angle of arrival (i.e. a detection numerical aperture of 1.0). Throughout the manuscript, five different scattering phase functions have been used in MC simulations, which are specified in Table 1.
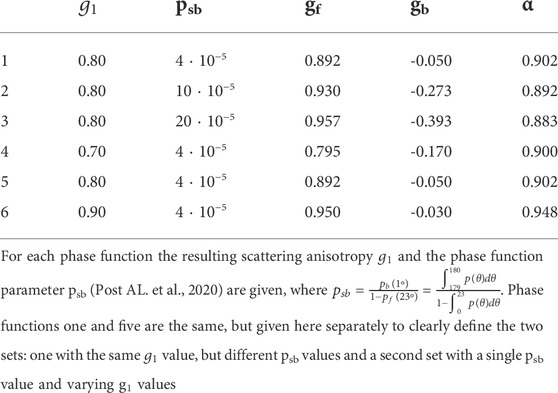
TABLE 1. Phase functions used in Monte Carlo simulations. All six phase functions are Two-Term Henyey-Greenstein phase functions:
Scattering and absorption of light by tissue can be summarized in three optical properties: the scattering coefficient
Diffusion theory is appropriate when detected photons have scattered many times. Figure 2 illustrates that close to the source diffusion theory underestimates the reflectance (Figure 2A), where photons undergo only a few scattering events and have short path lengths (Figure 2B). We compared the simulated reflectance to the model for
where a’ = µs’/(µs’+µa); z0 = 1/(µs’); µeff = √(3µaµs’); r1 = √(z02+ρ2) and r2 = √((z0+2zb)2+ρ2); zb = 2A/(3µs’); and A is a parameter that depends on the refractive index mismatch between the tissue and the medium above it (Martelli et al., 2009). There is no clearly defined boundary between diffuse and subdiffuse measurements, but one criterion that has been postulated for diffusion theory to apply is that photons should scatter more than approximately
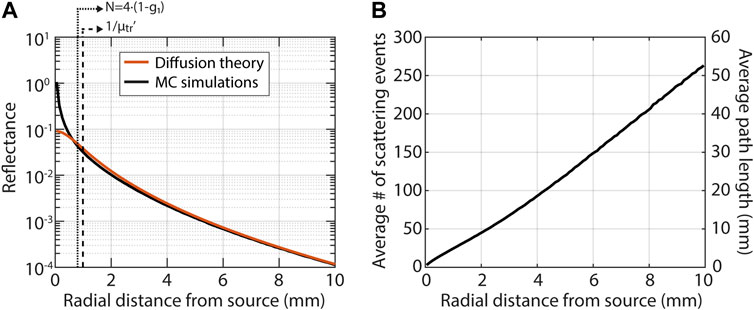
FIGURE 2. The basics of light-tissue interaction in the subdiffuse and diffuse regime illustrated with Monte Carlo simulations for a pencil beam illumination and a tissue with μs’ = 1 mm−1, μa = 0.01 mm−1 and g = 0.8. There is no clearly defined boundary between diffuse and subdiffuse measurements, two criteria that have been proposed are indicated by the dashed lines in the left figure. (A) Diffusion theory (Eq. 4) severely underestimates the reflectance close to the source, in the so-called subdiffuse regime. (B) In the subdiffuse regime detected photons underwent few scattering events (left axis) and traveled short path lengths (right axis).
A key difference between reflectance in the diffuse and subdiffuse regime is the influence of the scattering phase function (Mourant et al., 1996; Bevilacqua and Depeursinge, 1999; Calabro and Bigio, 2014). In the subdiffuse regime, photons have scattered only a few times before they are detected and, therefore, the scattering phase function greatly influences the measured reflectance. In the diffuse regime, photons have scattered many times before they are detected and, therefore, the effect of the scattering phase function is much less. In 2014, Calabro and Bigio published a review on the influence of the tissue scattering phase function in reflectance spectroscopy, demonstrating the importance of properly incorporating the influence of the scattering phase function for short source-detector separations and stating that the importance of the scattering phase function was chronically overlooked (Calabro and Bigio, 2014). Since then, more research has been done on incorporating the influence of the scattering phase function into forward models, which we will discuss here. Even so, often enough the influence of the scattering phase function is still not properly taken into account when analyzing subdiffuse reflectance spectroscopy measurements.
No analytical model exists that describes the reflectance for the entire range from subdiffuse to diffuse measurements. For the diffuse regime, analytical models exist to derive optical properties from the measured reflectance, but these do not exist in the subdiffuse regime. Some analytical models exist to describe light-tissue interaction in the subdiffuse regime, but their application has been limited (Vitkin et al., 2011; Xu, 2016; Piao and Patel, 2017). In the subdiffuse regime, semi-empirical models exist for some specific device geometries (such as the model for SFR Spectroscopy (Post A. L. et al., 2020)) which are based on MC simulations. For device geometries where no models exist, optical properties are extracted based on look-up-tables or machine-learning algorithms—both also based on MC simulations (Hennessy et al., 2013; Vervandier and Gioux, 2013; Chen et al., 2016; Ivančič et al., 2018; Stier et al., 2021; Erickson, Durkin and Tunnell, 2022). It is thus imperative to understand which phase function models accurately represent tissue scattering phase functions since any optical property extraction in the subdiffuse regime is thus directly or indirectly based on MC simulations. Therefore, we have performed a literature review of measured tissue scattering phase functions and identified which scattering phase function models are representative of tissue.
In general, Mie theory can be used to calculate the scattering phase function for a single spherical particle with a given radius and refractive index. One approach to model the tissue scattering phase function is using Mie theory for a fractal size distribution of scattering particles (Wang, 2000). The phase function for the size distribution is then calculated as:
where
where
Other scattering phase function models use simple analytic expressions. One of the first such models that was proposed for tissue was the Henyey-Greenstein (HG) phase function:
where
For both the MHG and the TTHG
where
and
where
From our literature search, we identified 19 papers in which 29 scattering phase functions had been measured (Table 2). In some papers no fit was performed with a scattering phase function model, in other papers a fit with only one type of scattering phase function seemed to have been performed. To investigate which scattering phase function models best represent the tissue scattering phase function, we extracted the measured phase functions from the papers and performed fits with all six phase function models (Mie, HG, MHG, TTHG, RMC, and MPC). The goal was not to identify a single phase function model that would be representative for any tissue type, but to identify which phase function models best represent measured tissue scattering phase functions.
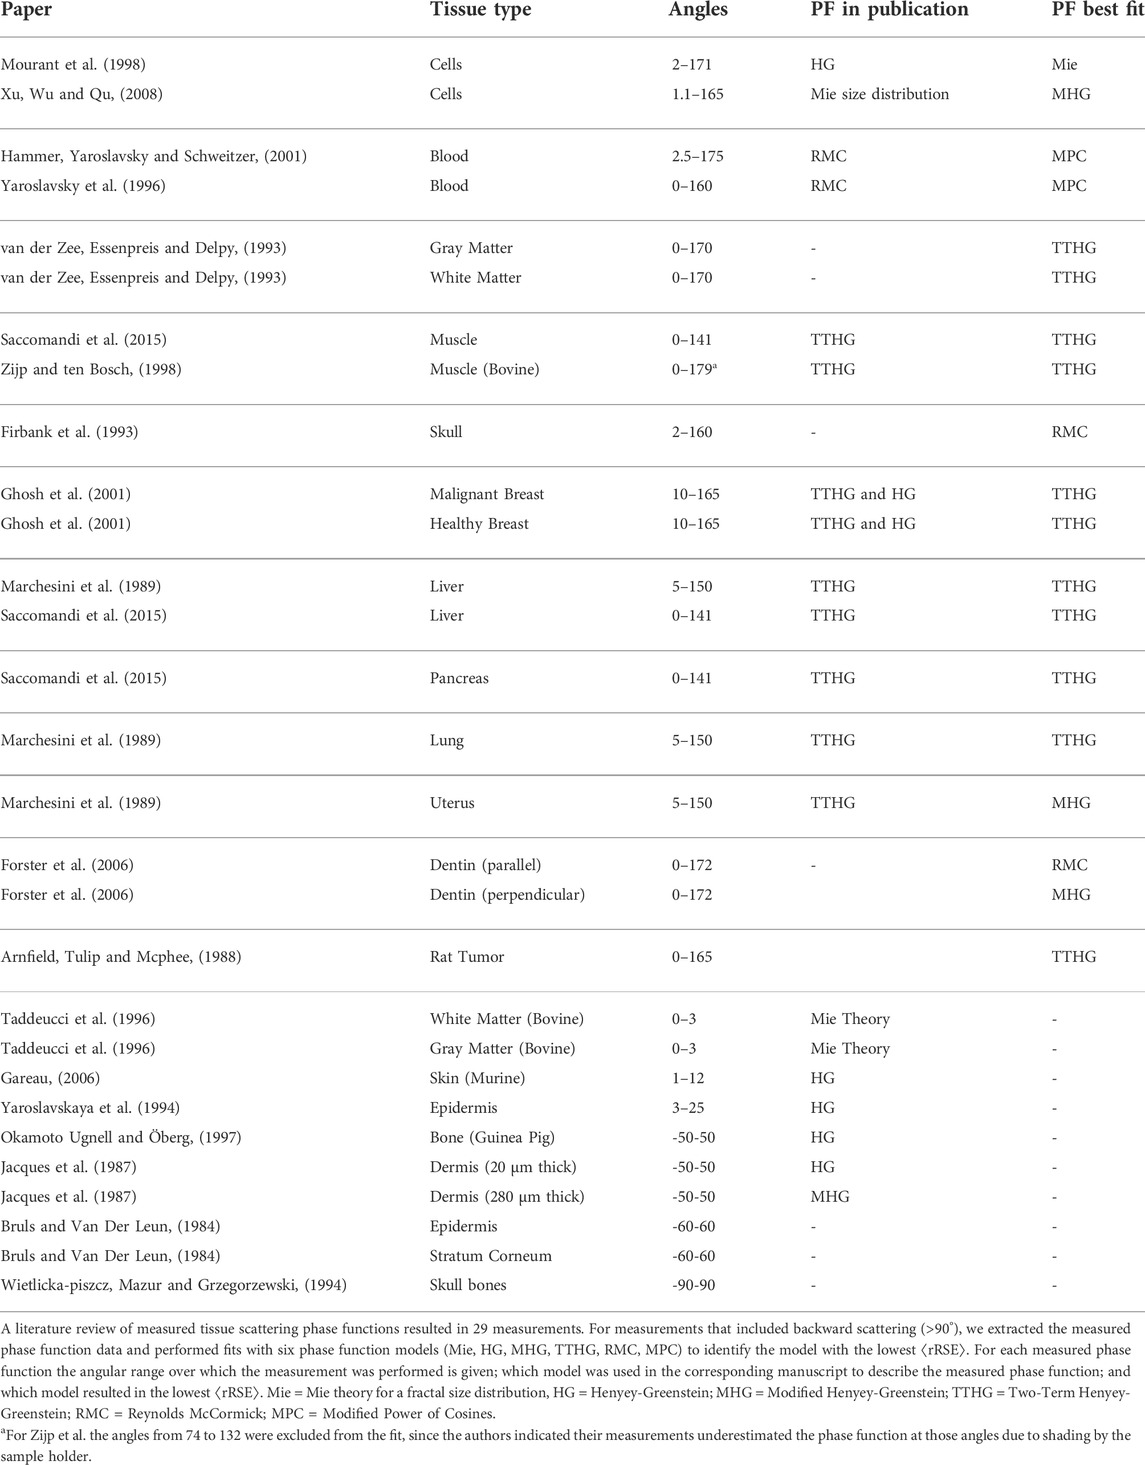
TABLE 2. Overview of phase function models that provided the best fit (last column) to measured phase functions.
Since the main difference between the phase function models is in the backward scattering direction, ten measured phase functions were excluded from the analysis since they only measured in the forward direction (<90°, last rows of Table 2). For the remaining 19 phase functions, the phase function model that resulted in the best fit based on the average relative error between the fit and the data is given in the last column of Table 2. The Mie phase function for a fractal size distribution was the best fit for one measured scattering phase function, the HG was never the best model, the TTHG in 11 measurements, MHG in 3, RMC in 2, and MPC in 2.
An example of a fit is shown in Figure 3A for the phase function of healthy breast tissue as measured by (Ghosh et al., 2001). The TTHG is the best fit to the measured data; the MPC and HG are the worst. The RMC underestimates the backscattering and the MHG and Mie for a fractal size distribution underestimate forward scattering. In Figure 3B the average relative root squared error
and the average of the rRSE,

FIGURE 3. Six phase function models have been proposed for tissue: Mie for a fractal size distribution (Mie), Henyey-Greenstein (HG); Modified Henyey-Greenstein (MHG), Two-Term Henyey-Greenstein (TTHG), Reynolds McCormick (RMC), and Modified Power of Cosines (MPC). A literature review of measured tissue scattering phase functions resulted in 29 measurements, for which we performed fits with each model and identified the model with the lowest average relative root-square-error
The scattering phase function can be represented by a series of
where
Figure 4A shows results from an MC simulation for a pencil beam illumination and detection within the first 100 µm from the source with a numerical aperture of 0.22. The black line is the tissue scattering phase function that was used in the simulation, the red line is the histogram of scattering angles of detected photons (the effective phase function (Post AL. et al., 2020)). Figure 4A illustrates that detected photons mostly undergo scattering evens at small angles in the forward and backward directions. The sensitivity of subdiffuse measurements to small-angle backscattering events has also been shown by (Canpolat and Mourant, 2000). For SFR spectroscopy, the subdiffuse limit for fiber-optic measurements (since the source and detector fiber overlap), it has been shown that
where
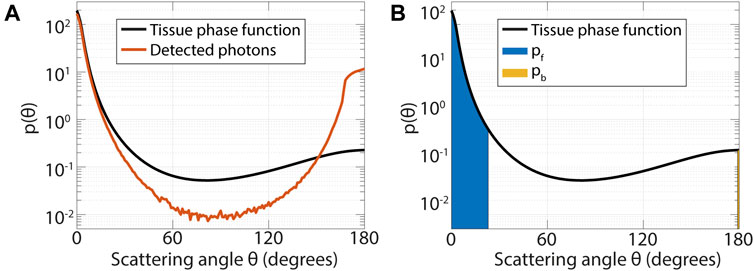
FIGURE 4. (A) In the subdiffuse regime detected photons mainly undergo scattering events at small angles in the forward and backward direction. Results from a Monte Carlo simulation with a pencil beam illumination and detection over a radial distance from 0 to 0.1 mm from the source with a numerical aperture of 0.22, for a tissue with µs’ = 1 mm−1, µa = 0.01 mm−1; g = 0.8; psb = 4·10−5 and a refractive index of 1.35. (B) The phase function parameter psb incorporates the probability of scattering at small angles, where psb is equal to the probability of backward scattering within 1° (pb, yellow area) divided by one minus the probability of forward scattering within 23° (pf, blue area). The probability of scattering within a certain angle is equal to the integral of the phase function over the angular range (shaded areas).
The parameter psb was specifically developed for SFR Spectroscopy, where the source and detector fiber overlap. Here, we show that the parameter psb can also be used to accurately describe the reflectance at larger radial distances from the source. In Figure 5 the influence of the scattering phase function on the measured reflectance is illustrated for two sets of TTHG phase functions. One set where
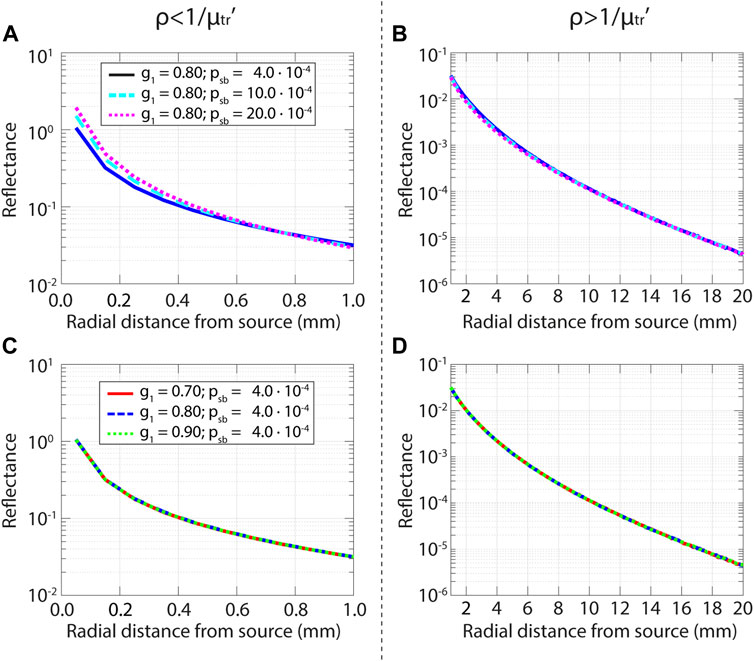
FIGURE 5. Influence of the phase function on the reflectance as a function of radial distance from the source for the subdiffuse regime (left, up to 1/µtr’) and the diffuse regime (right, from 1/µtr’). Results from Monte Carlo simulations with a pencil beam illumination for a tissue with μs' = 1.0 mm−1, μa = 0.01 mm−1. (A) Reflectance for three different phase functions, with the same
Figure 5A shows that
Diffuse and subdiffuse measurements have different sensitivities to optical properties, which is illustrated in Figure 6. In the diffuse regime, measurements are more sensitive to the absorption coefficient, while in the subdiffuse regime measurements are more sensitive to both the reduced scattering coefficient and psb. In Figure 6 for each subplot one optical property is varied, and the relative differences in reflectance values are calculated with respect to the lowest optical property (
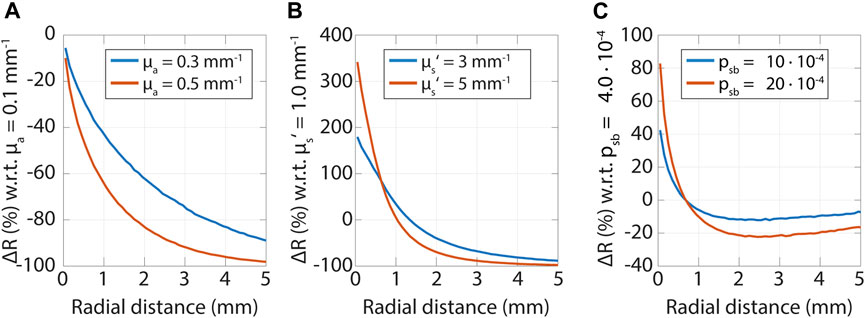
FIGURE 6. Sensitivity to tissue optical properties versus radial distance. In each subfigure, the relative change in the reflectance is shown as a function of radial distances for changes in an optical property. Note that the sensitivity is related to the absolute value of
These sensitivities can be related to Figure 2, where we showed that photons that are detected close to where they were emitted underwent only a few scattering events and traveled short path lengths. The absorption attenuates the reflectance by a factor of
The depth detected photons have reached in the tissue depends on both the tissue optical properties and the distance between the source and detector. This relation is illustrated in Figure 7, where the interrogation depth is shown for a range of optical properties and distances between emission and detection of photons. The interrogation depth is defined here as the average depth detected photons have traveled. We varied the absorption coefficient, reduced scattering coefficient, and psb, to show their effects on the interrogation depth.
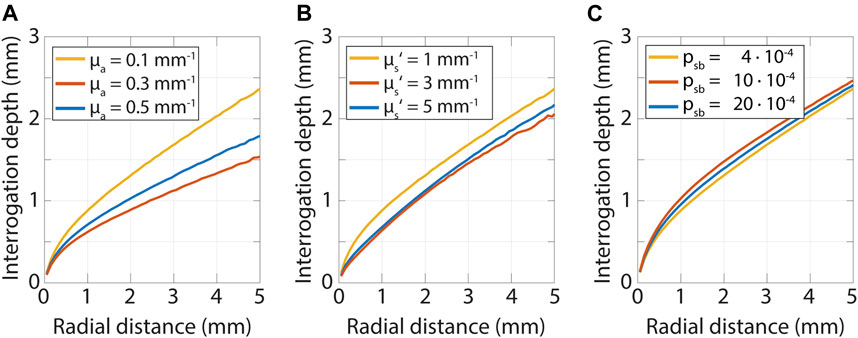
FIGURE 7. Interrogation depth versus radial distance from a pencil beam source obtained from Monte Carlo simulations while varying the absorption coefficient, scattering coefficient and psb. The interrogation depth mainly depends on the radial distance from the source and the absorption coefficient of the tissue. (A) Variation of absorption coefficient while µs’ = 1.0 mm−1 and psb = 4·10−5. (B) Variation of scattering coefficient while µa = 0.1 mm−1 and psb = 4·10−5. (C) Variation of psb while µs’ = 1.0 mm−1 and µa = 0.1 mm−1.
The interrogation depth is mainly influenced by the source-detector-separation and the absorption coefficient of the tissue. The reduced scattering coefficient and psb have a smaller influence. The influence of the scattering anisotropy is not shown here but has been found to also have a minor influence on the interrogation depth (Kanick et al., 2009; Hennessy et al., 2014). Methods and models to determine the interrogation depth for a specific measurement geometry can be found for SFDI in (Bodenschatz et al., 2015) and (Hayakawa et al., 2018), and for fiber-optic spectroscopy in (Kanick et al., 2009) and (Hennessy et al., 2014).
Whether measurements are in the diffuse or subdiffuse regime is influenced by the tissue optical properties and the distance between source and detector fibers or the projected spatial frequency. There is no clear dichotomy between the diffuse and subdiffuse regime, but measurements are in the diffuse regime when the distance between source and detector fibers is large or the projected spatial frequency is low compared to the transport mean free path of the tissue. When measurements cannot be described by diffusion theory they are in the so-called subdiffuse regime. In the diffuse regime, the reflectance can be described as a function of the absorption and reduced scattering coefficient. For smaller distances, details in the scattering phase function have to be taken into account as well. Since the scattering phase function is related to the subcellular structure of tissue, subdiffuse measurements have the potential to provide a powerful contrast between healthy and diseased tissue.
Since the fiber distance or spatial frequency influences which tissue optical properties the reflectance method is sensitive to and the size of the tissue volume that is interrogated, the choice for a certain distance or frequency has important implications for clinical applications of reflectance spectroscopy. Often enough, the fiber distance or spatial frequency used in a clinical study is based on practical considerations such as the availability of a probe with fixed fiber distances. Based on our review, we want to encourage researchers to carefully select the fiber distance or spatial frequency for a clinical application, since it has important consequences for its ability to answer a clinical question. Also, we would implore researchers to always supply the reasoning behind the fiber distance or spatial frequency in the methods section of a manuscript. When the interrogation depth is essential to the clinical application, this should drive the choice for a fiber distance or spatial frequency. For example, for margin assessment in breast cancer, the surgeon wants to know whether there is tumor tissue within the first 2 mm from the tissue surface. When the interrogation depth is not essential for a clinical application, the sensitivity to optical properties should drive the choice for a fiber distance or spatial frequency.
Subdiffuse measurements have the key advantage that they are much more sensitive to the tissue scattering phase function compared to diffuse techniques, more specifically to scattering at small angles in the forward and backward direction (Canpolat and Mourant, 2000; Post AL. et al., 2020; Stewart et al., 2020). The phase function is related to the subcellular structure of tissue. The exact relationship between the subcellular structure of tissue and different scattering phase function models and parameters used in these scattering phase function models is not well-known. The volume fraction of organelles influences the total amount of scattered light as well as the angular distribution of scattered light (Drezek, Dunn and Richards-Kortum, 1999). (Mourant et al., 1998) and (Drezek, Dunn and Richards-Kortum, 1999) showed that mitochondria and other organelles with similar sizes (in the order of a micron) result in scattering at small angles in the forward direction, while nuclei are related to small angle scattering in the forward direction. Another study suggests that scattering at angles greater than approximately 110° is correlated with the DNA content of cells (Mourant et al., 2000). The full clinical potential of the characterization of the scattering phase function has not yet been explored, but a small number of studies with subdiffuse techniques have shown promising results (McClatchy et al., 2016; Bugter and Hardillo, 2018; Bugter and Spaander, 2018; Bugter et al., 2019; Post et al., 2021; Streeter et al., 2021). For example, Post et al. have shown that SFR spectroscopy could discriminate between non-dysplastic Barrett’s mucosa and neoplasia with an area under the curve of 0.94 based on scattering properties of tissue alone (the scattering amplitude, scattering slope, and psb at 500 nm) (Post et al., 2021). Even more interesting, sensitivity to the tissue scattering phase function might enable detecting changes in tissue that are not (yet) visible by eye since the tissue scattering phase function is related to the subcellular structure of tissue. For example, before the development of a tumor, cell lineages can acquire pro-tumorigenic genetic mutations, which can grow in large areas of cells that are predisposed to progress to a malignant lesion—an effect known as field cancerization. These areas of cells can have acquired some, but not all phenotypic changes related to malignancy (Curtius, Wright and Graham, 2017). A small number of studies with subdiffuse reflectance spectroscopy have shown promise for the detection of field cancerization, e.g. with SFR spectroscopy for esophageal cancer (Bugter and Spaander, 2018; Post et al., 2021). Other subdiffuse techniques such as enhanced backscatter spectroscopy have also shown promise for the detection of field cancerization in colon cancer (Roy et al., 2009).
Diffuse reflectance measurements are more sensitive to the absorption coefficient. However, this does not necessarily mean diffuse measurements are the best choice when absorption properties are related to the disease state of tissue. If the tissue has a high absorption coefficient, the measured reflectance values might become so low that there is almost no signal regardless of the concentration of the absorber (e.g. blood) and subdiffuse techniques should be used instead.
Whenever the interrogation depth is less important, we would recommend performing a pilot study to identify the optimal fiber distance or spatial frequency that provides maximum contrast between tissue types. For any fiber-optic probe, one could always include an SFR measurement by also illuminating and collecting through one fiber. Furthermore, probes could be used with multiple fiber distances (Lin et al., 1997). Since it is very easy to perform measurements with multiple spatial frequencies for wide-field imaging techniques, we would recommend always investigating which spatial frequencies provide the best clinical results.
For clinical applications where the interrogation depth is critical, an important opportunity in reflectance spectroscopy is the ability to choose the fiber distance or spatial frequency to obtain the required interrogation depth. However, since the absorption coefficient has a major influence on the interrogation depth and the absorption coefficient can vary by a few orders of magnitude within a spectrum, the interrogation depth will vary significantly with wavelength for a constant fiber distance or spatial frequency. The issue of variable penetration depth should be considered when designing experiments and developing diagnostic algorithms. A study by Kho et al. illustrates this pitfall for hyperspectral imaging (Kho et al., 2019b). They performed measurements with a pushbroom hyperspectral imaging setup on slices of resected breast tissue, where the tissue was placed on black rubber (Figure 8A). The thickness of the tissue slices varied from 2.5 to 5.5 mm. Figure 8B shows the estimated interrogation depth for adipose tissue (90% fat, 10% water) and Figure 8C shows the estimated diffuse reflectance for adipose tissue (black solid line), and the average measured spectrum for a tissue slice of 5.5 mm thick (blue solid line) and for a tissue slice of 2.5 mm thick (blue dashed line). The difference between the spectra for different slice thicknesses underlines the importance of knowing the interrogation depth for the device geometry used and the tissue that is interrogated. Because the tissue slices are thinner than the interrogation depth at some wavelengths, the thickness itself will influence the measured reflectance. Photons that normally would have gone deeper into the tissue and would have been detected are now absorbed by the black rubber underneath the tissue slices. If a diffusion theory model would be used to fit the measured spectra this would result in inaccurate retrieved optical properties. If the spectra would be used to train a machine-learning algorithm (as is often done), either tissue slices with a single thickness would be needed (which is practically impossible in clinical practice), or much more data would be needed to train the algorithm to account for the additional influence of the slice thickness. Even in that case, the trained algorithm would not be translatable to in vivo applications, where the tissue in essence will be semi-infinite and thus the measured reflectance spectra would be different.
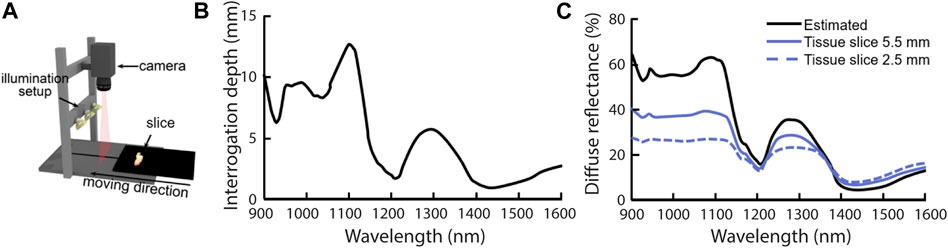
FIGURE 8. A pitfall in the design of experiments and the development of diagnostic algorithms is the variable interrogation depth within a measured spectrum, as illustrated by (Kho et al., 2019b). (A) Hyperspectral images were obtained with a push broom system of breast tissue slices which were placed on black rubber. The thickness of tissue slices varied from 2.5 to 5.5 mm. Image copied from (Kho et al., 2019a) (B) Expected approximate interrogation depth based on the optical properties of breast tissue. For a large part of the spectrum, the interrogation depth is larger than the slice thicknesses of 2.5–5.5 mm. Image modified from (Kho et al., 2019b) (C) Measured diffuse reflectance spectra for slices thicknesses of 2.5 and 5.5 mm. In regions where the interrogation depth is larger than the slice thickness the measured diffuse reflectance is lower than what was estimated based on diffusion theory and optical properties of breast tissue. The lower reflectance spectra for the two tissue slices can be explained by the fact that photons that normally would have gone deeper into the tissue and would have been detected are now absorbed by the black rubber underneath the tissue slices. Figure modified from (Kho et al., 2019b).
The fact that the interrogation depth varies with fiber distance or spatial frequency also offers the opportunity to extract depth information on tissue optical properties. For example, fiber-optic probes with multiple fibers distances and SFDI with multiple frequencies have been used to extract optical properties of different tissue layers, as well as the thickness of the layers (Sharma et al., 2014; Tabassum et al., 2018; Geldof et al., 2022; Sung et al., 2022). Also, in the very first paper where SFDI was presented (Cuccia et al., 2005), Cuccia et al. already suggested obtaining tomographic images of optical properties from images obtained with multiple spatial frequencies, and more recently methods have been developed to enable this (Konecky et al., 2009, 2012).
Diagnostic algorithms are generally either based on tissue optical properties extracted from the measured spectra or on the entire spectra themselves. For diffuse measurements, analytical models exist to extract tissue optical properties from reflectance spectra (Flock et al., 1989; Farrell, Patterson and Wilson, 1992; Cuccia et al., 2009). For fiber-optic subdiffuse measurements, a semi-empirical model exists for SFR spectroscopy (Post A. L. et al., 2020), which applies when the source and detector fiber overlap. However, for measurements where the source and detector fiber do not overlap but are too close together for diffusion theory to apply, no model exists. For wide-field subdiffuse measurements, Kanick et al. developed a model, but this does not incorporate the influence of absorption on the measured spectra (Kanick et al., 2014). Both the SFR and SFDI models have been derived semi-empirically from MC simulations. Other approaches to extract tissue optical properties are based on look-up tables derived from MC simulations or measurements on phantoms (Hennessy et al., 2013; Vervandier and Gioux, 2013; Ivančič et al., 2018; Erickson, Durkin and Tunnell, 2022) or machine learning based on MC simulations (Chen et al., 2016; Ivančič et al., 2018; Stier et al., 2021). Since subdiffuse measurements are very sensitive to the tissue scattering phase function, simulations from which models or look-up tables are derived should be performed with a wide range of tissue scattering phase functions. Based on our review of tissue scattering phase functions, it should at least include TTHG and MHG phase functions, since these scattering phase function models are representative of measured phase functions in soft tissue. To ensure accurate results from subdiffuse measurements for any tissue type we would suggest also including phase functions based on Mie theory with a fractal size distribution, MPC phase functions (representative of blood) and RMC phase functions (representative of cells and dentin). The HG phase function should not be included, since it never represented the measured scattering phase functions well and it underestimates backward scattering. Previously MC simulation software was limited to HG phase functions only, but more recently MC software has become available where any scattering phase function can be implemented (e.g. MCX (Yu et al., 2018)). The importance of using a range of scattering phase functions for the development of a subdiffuse model was illustrated by (Post A. L. et al., 2020). They developed a model based on MC simulations with TTHG, MHG, RMC, and MPC phase functions and compared their accuracy for this range of phase functions to the model previously developed by (Kanick et al., 2011), which was based only on MHG phase functions. Post et al. increased the accuracy of the model by a factor of 3. Thus, approaches to extract optical properties from subdiffuse measurements based on MC simulations with MHG phase functions alone are prone to errors.
Although counterintuitive, another approach to extract optical properties from subdiffuse measurements is to use diffusion theory—as has been done for fiber-optic measurements with short source-detector separations (Müller et al., 2003; de Boer et al., 2016). The extracted optical properties will not be accurate—even when diffusion theory only slightly underestimates the reflectance, this can lead to large errors in the extracted optical properties (Naglič et al., 2019). For clinical applications inaccuracies in the extracted optical properties are not necessarily a problem as long as the extracted optical properties are reproducible.
Figure 9 shows what can happen when a diffuse model is used for fiber-optic reflectance measurements of breast tissue. For this specific example, diffusion theory is not appropriate regardless of the fiber distance, because the absorption coefficient is much higher than the reduced scattering coefficient for part of the spectrum due to the presence of fat and water. For short fiber distances, the volume fractions of blood, fat, and water are underestimated. This underestimation can be explained by the fact that the reflectance close to the source is higher than expected based on diffusion theory (Figure 2A) which can be accounted for by a lower absorption. The scatter amplitude is fairly constant but inaccurate regardless of the fiber distance. The scatter slope does become increasingly accurate with fiber distance. Interestingly, further away from the source the extracted concentrations of absorbers are still inaccurate, but there they are overestimated. The inaccuracies in the scattering amplitude and the volume fraction of absorbers can be explained by the fact that the reduced scattering coefficient should be much larger than the absorption coefficient for diffusion theory to apply. For this simulated breast tissue, this is not the case at higher wavelengths.
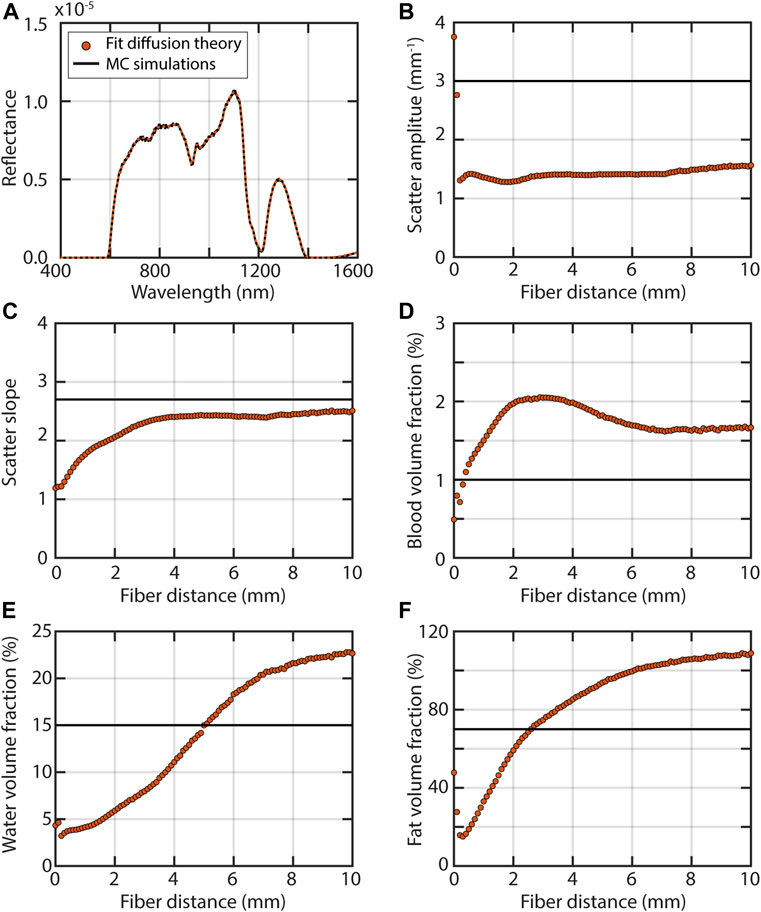
FIGURE 9. A pitfall in the development of diagnostic algorithms is not realizing that results from one fiber distance or spatial frequency cannot simply be translated to another fiber distance or spatial frequency. For example, when a diffusion theory model is used for fiber-optic measurements, the extracted optical properties will depend on the distance between the source and detector fiber. Results from Monte Carlo simulations for illumination through a fiber with a diameter of 200 µm and an NA of 0.22 of a sample with optical properties representative of breast tissue (Jacques, 2013), where µs’ = 3·(λ/500 nm)−2.7, a blood volume fraction of 1%, a fat volume fraction of 15% and a water volume fraction of 70%. The refractive index of the medium was 1.35 and above the medium 1.0. Detection was also through a fiber with a diameter of 200 µm and an NA of 0.22, placed at several distances from the source fiber in increments of 100 µm. Black lines indicate the Monte Carlo simulations and red lines and circles the fit results for the diffusion theory model of (Farrell, Patterson and Wilson, 1992) (A) Example of a fit with diffusion theory to the simulated reflectance for a fiber distance of 10 mm. (B) Fit results and simulated value of the scattering amplitude (C) scattering slope (D) blood volume fraction (E) fat volume fraction; and (F) water volume fraction. The inaccuracies in all extracted optical properties over all fiber distances imply that diffusion theory does not hold for these simulated measurements, which can be explained by the fact that the ratio between the reduced scattering coefficient and the absorption coefficient is too low. The extracted optical properties change with fiber distance.
Figure 9 thus illustrates an important pitfall in diagnostic algorithm development: not realizing that results from one fiber distance or spatial frequency cannot be translated to another one. When a fit with diffusion theory is performed in the subdiffuse regime, the fiber distance or spatial frequency will influence the values of the extracted optical properties that are used in a diagnostic algorithm. When machine learning is used, the features that were used by the diagnostic algorithm for one fiber distance or spatial frequency will not necessarily perform equally well for other fiber distances. Also, when tissue is not homogenous but layered, diagnostic algorithms from different fiber distances or spatial frequencies are definitely not interchangeable, since they will have interrogated different volumes and thus different layers of different tissue types.
Knowledge of tissue scattering phase functions is important for both modeling and interpretation of subdiffuse measurements. However, currently, we cannot be sure that the MHG, TTHG, Mie for a fractal size distribution, RMC, and MPC are sufficient to fully describe all phase functions that are present in tissue. First of all, only a small number of tissue scattering phase functions have been measured (29) for only a small number of tissue types (13). Secondly, most scattering phase functions were only measured up to 150° and we thus do not know if the currently used phase function models accurately describe small angle backscattering events—which have a major impact on subdiffuse measurements. To better understand the tissue scattering phase function to improve our understanding of subdiffuse techniques, we thus need new approaches that can cover the full range of scattering angles, and we need more measurements of scattering phase functions of different tissue types.
We also need a better understanding of how the tissue scattering phase function relates to the disease state of tissue. Some work has been done that relates the scattering phase function to the subcellular structure of tissue, but we do not yet know how the tissue scattering phase function changes from healthy to diseased tissue. Only (Ghosh et al., 2001) measured the scattering phase function of both normal and malignant (breast) tissue. Furthermore, we do not know how subdiffuse parameters such as psb relate to changes in the tissue structure. To obtain a better understanding of psb, subdiffuse measurements of psb could be related to histology slides of the investigated tissue.
For steady-state reflectance spectroscopy, the tissue optical properties and the distance between source and detector fibers or the projected spatial frequency determine whether measurements are in the diffuse or subdiffuse regime. When fiber distances are too short or spatial frequencies too high for diffusion theory to apply, these measurements are in the so-called subdiffuse regime. The fiber distance or spatial frequency has important implications for clinical applications of reflectance spectroscopy since they influence which tissue optical properties the technique is sensitive to and the size of the tissue volume that is interrogated. An opportunity in reflectance spectroscopy is that the interrogation depth can be tailored to a clinical application by appropriate selection of a fiber distance or spatial frequency. Another opportunity in reflectance spectroscopy is the sensitivity of subdiffuse measurements to the tissue scattering phase function—which has the potential to be a powerful contrast mechanism between healthy and diseased tissue. A pitfall in reflectance spectroscopy is not properly considering the effect of the interrogation depth on a clinical measurement and not realizing the variable interrogation depth within a spectrum. Another pitfall is assuming diagnostic algorithms developed from measurements with a certain fiber distance or spatial frequency can be used for measurements with another fiber distance or spatial frequency. Lastly, an important pitfall is developing models to extract optical properties from subdiffuse measurements based on MC simulations that do not cover the full range of phase functions present in tissue (at least modified Henyey-Greenstein and two-term Henyey-Greenstein should be included).
AP conceived the study. All authors contributed to the design of the study. MW and AP performed the analyses and wrote the manuscript. All authors contributed to manuscript revision, read, and approved the submitted version.
Nederlandse Organisatie voor Wetenschappelijk Onderzoek—17908.
The authors declare that the research was conducted in the absence of any commercial or financial relationships that could be construed as a potential conflict of interest.
All claims expressed in this article are solely those of the authors and do not necessarily represent those of their affiliated organizations, or those of the publisher, the editors and the reviewers. Any product that may be evaluated in this article, or claim that may be made by its manufacturer, is not guaranteed or endorsed by the publisher.
Akter, S., Hossain, M. G., Nishidate, I., Hazama, H., and Awazu, K. (2018). Medical applications of reflectance spectroscopy in the diffusive and sub-diffusive regimes. J. Near Infrared Spectrosc. 26 (6), 337–350. doi:10.1177/0967033518806637
Arnfield, M. R., Tulip, J., and Mcphee, M. S. (1988). Optical propagation in tissue with anisotropic scattering. IEEE Trans. Biomed. Eng. 35 (5), 372–381. doi:10.1109/10.1396
Bevilacqua, F., and Depeursinge, C. (1999). Monte Carlo study of diffuse reflectance at source–detector separations close to one transport mean free path. J. Opt. Soc. Am. A 16 (12), 2935–2945. doi:10.1364/JOSAA.16.002935
Bodenschatz, N., Krauter, P., Liemert, A., and Kienle, A. (2016). Quantifying phase function influence in subdiffusively backscattered light. J. Biomed. Opt. 21 (3), 035002. doi:10.1117/1.JBO.21.3.035002
Bodenschatz, N., Krauter, P., Liemert, A., Wiest, J., and Kienle, A. (2015). Model-based analysis on the influence of spatial frequency selection in spatial frequency domain imaging. Appl. Opt. 54 (22), 6725–6731. doi:10.1364/AO.54.006725
Bruls, W. A. G., and Van Der Leun, J. C. (1984). Forward scattering properties of human epidermal layers. Photochem. Photobiol. 40 (2), 231–242. doi:10.1111/j.1751-1097.1984.tb04581.x
Bugter, O., Hardillo, J. A., Baatenburg de Jong, R. J., Amelink, A., and Robinson, D. J. (2018). Optical pre-screening for laryngeal cancer using reflectance spectroscopy of the buccal mucosa. Biomed. Opt. Express 9 (10), 4665. doi:10.1364/boe.9.004665
Bugter, O., Spaander, M. C. W., Bruno, M. J., de Jong, R. J. B., Amelink, A., and Robinson, D. J. (2018). Optical detection of field cancerization in the buccal mucosa of patients with esophageal cancer. Clin. Transl. Gastroenterol. 9 (4), e152. doi:10.1038/s41424-018-0023-6
Bugter, O., van Brummelen, S., van der Leest, K., Aerts, J., Maat, A., Baatenburg de Jong, R., et al. (2019). Towards the optical detection of field cancerization in the buccal mucosa of patients with lung cancer. Transl. Oncol. 12 (12), 1533–1538. doi:10.1016/j.tranon.2019.07.018
Calabro, K. W., and Bigio, I. J. (2014). Influence of the phase function in generalized diffuse reflectance models: Review of current formalisms and novel observations. J. Biomed. Opt. 19 (7), 075005. doi:10.1117/1.JBO.19.7.075005
Canpolat, M., and Mourant, J. R. (2000). High-angle scattering events strongly affect light collection in clinically relevant measurement geometries for light transport through tissue. Phys. Med. Biol. 45, 1127–1140. doi:10.1088/0031-9155/45/5/304
Chen, Y.-W., Chen, C. C., Huang, P. J., and Tseng, S. H. (2016). Artificial neural networks for retrieving absorption and reduced scattering spectra from frequency-domain diffuse reflectance spectroscopy at short source-detector separation. Biomed. Opt. Express 7 (4), 1496–1510. doi:10.1364/boe.7.001496
Cuccia, D. J., Bevilacqua, F., Durkin, A. J., Ayers, F. R., and Tromberg, B. J. (2009). Quantitation and mapping of tissue optical properties using modulated imaging. J. Biomed. Opt. 14 (2), 024012. doi:10.1117/1.3088140
Cuccia, D. J., Bevilacqua, F., Durkin, A. J., and Tromberg, B. J. (2005). Modulated imaging: Quantitative analysis and tomography of turbid media in the spatial-frequency domain. Opt. Lett. 30 (11), 1354–1356. doi:10.1364/ol.30.001354
Curtius, K., Wright, N. A., and Graham, T. A. (2017). An evolutionary perspective on field cancerization. Nat. Rev. Cancer 18 (1), 19–32. doi:10.1038/nrc.2017.102
de Boer, L. L., Hendriks, B. H. W., van Duijnhoven, F., Peeters-Baas, M. J. T. F. D. V., Van de Vijver, K., Loo, C. E., et al. (2016). Using DRS during breast conserving surgery: Identifying robust optical parameters and influence of inter-patient variation. Biomed. Opt. Express 7 (12), 5188–5200. doi:10.1364/BOE.7.005188
Drezek, R., Dunn, A., and Richards-Kortum, R. (1999). Light scattering from cells : Finite-difference time-domain simulations and goniometric measurements. Appl. Opt. 38 (16), 3651–3661. doi:10.1364/ao.38.003651
Erickson, T. A., Durkin, A. J., and Tunnell, J. W. (2022). Lookup-table method for imaging optical properties with structured illumination beyond the diffusion theory regime. J. Biomed. Opt. 15 (3), 036013. doi:10.1117/1.3431728
Faber, D. J., Post, A. L., Sterenborg, H. J. C. M., and Van Leeuwen, T. G. (2019). Analytical model for diffuse reflectance in single fiber reflectance spectroscopy. Opt. Lett. 45 (7), 2078–2081. doi:10.1364/ol.385845
Farrell, T. J., Patterson, M. S., and Wilson, B. (1992). A diffusion theory model of spatially resolved, steady-state diffuse reflectance for the noninvasive determination of tissue optical properties in vivo. Med. Phys. 19 (4), 879–888. doi:10.1118/1.596777
Fawzy, Y. S., Petek, M., Tercelj, M., and Zeng, H. (2006). In vivo assessment and evaluation of lung tissue morphologic and physiological changes from non-contact endoscopic reflectance spectroscopy for improving lung cancer detection. J. Biomed. Opt. 11 (4), 044003. doi:10.1117/1.2337529
Firbank, M., Hiraoka, M., Essenpreis, M., and Delpy, D. T. (1993). Measurement of the optical properties of the skull in the wavelength range 650-950 nm. Phys. Med. Biol. 38 (4), 503–510. doi:10.1088/0031-9155/38/4/002
Flock, S. T., Patterson, M., Wilson, B., and Wyman, D. (1989). Monte Carlo modeling of light propagation in highly scattering tissues—I: Model predictions and comparison with diffusion theory. IEEE Trans. Biomed. Eng. 36 (12), 1162–1168. doi:10.1109/TBME.1989.1173624
Forster, F. K., Kienle, A., Michels, R., and Hibst, R. (2006). Phase function measurements on nonspherical scatterers using a two-axis goniometer. J. Biomed. Opt. 11 (2), 024018. doi:10.1117/1.2187421
Gamm, U. A., Kanick, S. C., Sterenborg, H. J. C. M., Robinson, D. J., and Amelink, A. (2012). Quantification of the reduced scattering coefficient and phase-function-dependent parameter γ of turbid media using multidiameter single fiber reflectance spectroscopy: Experimental validation. Opt. Lett. 37 (11), 1838–1840. doi:10.1364/OL.37.001838
Gareau, D. S. (2006). In vivo confocal microscopy in turbid media. Available at: https://digitalcollections.ohsu.edu/concern/etds/pz50gw084?locale=en.
Geldof, F., Dashtbozorg, B., Hendriks, B. H. W., Sterenborg, H. J. C. M., and Ruers, T. J. M. (2022). Layer thickness prediction and tissue classification in two-layered tissue structures using diffuse reflectance spectroscopy. Sci. Rep. 12 (1), 1698. doi:10.1038/s41598-022-05751-5
Ghosh, N., Mohanty, S. K., Majumder, S. K., and Gupta, P. K. (2001). Measurement of optical transport properties of normal and malignant human breast tissue. Appl. Opt. 40 (1), 176–184. doi:10.1364/AO.40.000176
Gioux, S., Mazhar, A., and Cuccia, D. J. (2019). Spatial frequency domain imaging in 2019: Principles, applications, and perspectives. J. Biomed. Opt. 24 (07), 1. doi:10.1117/1.JBO.24.7.071613
Hammer, M., Yaroslavsky, A. N., and Schweitzer, D. (2001). A scattering phase function for blood with physiological haematocrit. Phys. Med. Biol. 46 (3), N65–N69. doi:10.1088/0031-9155/46/3/402
Hayakawa, C. K., Karrobi, K., Pera, V., Roblyer, D., and Venugopalan, V. (2018). Optical sampling depth in the spatial frequency domain. J. Biomed. Opt. 24 (7), 1. doi:10.1117/1.JBO.24.7.071603
Hennessy, R., Goth, W., Sharma, M., Markey, M. K., and Tunnell, J. W. (2014). Effect of probe geometry and optical properties on the sampling depth for diffuse reflectance spectroscopy. J. Biomed. Opt. 19 (10), 107002. doi:10.1117/1.jbo.19.10.107002
Hennessy, R., Lim, S. L., Markey, M. K., and Tunnell, J. W. (2013). Monte Carlo lookup table-based inverse model for extracting optical properties from tissue-simulating phantoms using diffuse reflectance spectroscopy. J. Biomed. Opt. 18 (3), 037003. doi:10.1117/1.jbo.18.3.037003
Ivančič, M., Naglic, P., Pernus, F., Likar, B., and Burmen, M. (2018). Efficient estimation of subdiffusive optical parameters in real time from spatially resolved reflectance by artificial neural networks. Opt. Lett. 43 (12), 2901. doi:10.1364/ol.43.002901
Jacques, S. L., Alter, C. A., and Prahl, S. A. (1987). Angular dependence of HeNe laser light scattering by human dermis. Lasers Life Sci. 1 (4), 309–333.
Jacques, S. L. (2013). Corrigendum: Optical properties of biological tissues: A review. Phys. Med. Biol. 58 (14), 5007–5008. doi:10.1088/0031-9155/58/14/5007
Jansen-Winkeln, B., Holfert, N., Kohler, H., Moulla, Y., Takoh, J. P., Rabe, S. M., et al. (2019). Determination of the transection margin during colorectal resection with hyperspectral imaging (HSI). Int. J. Colorectal Dis. 34 (4), 731–739. doi:10.1007/s00384-019-03250-0
Kanick, S. C., Gamm, U. A., Sterenborg, H. J. C. M., Robinson, D. J., and Amelink, A. (2011). Method to quantitatively estimate wavelength-dependent scattering properties from multidiameter single fiber reflectance spectra measured in a turbid medium. Opt. Lett. 36 (15), 2997–2999. doi:10.1364/ol.36.002997
Kanick, S. C., McClatchy, D. M., Krishnaswamy, V., Elliott, J. T., Paulsen, K. D., and Pogue, B. W. (2014). Sub-diffusive scattering parameter maps recovered using wide-field high-frequency structured light imaging. Biomed. Opt. Express 5 (10), 3376. doi:10.1364/boe.5.003376
Kanick, S. C., Robinson, D. J., Sterenborg, H. J. C. M., and Amelink, A. (2009). Monte Carlo analysis of single fiber reflectance spectroscopy: Photon path length and sampling depth. Phys. Med. Biol. 54, 6991–7008. doi:10.1088/0031-9155/54/22/016
Kho, E., Boer, L. L., Post, A. L., Van de Vijver, K. K., Jozwiak, K., Sterenborg, H. J., et al. (2019b). Imaging depth variations in hyperspectral imaging: Development of a method to detect tumor up to the required tumor-free margin width. J. Biophot. 12 (11), e201900086. doi:10.1002/jbio.201900086
Kho, E., de Boer, L. L., Van de Vijver, K. K., van Duijnhoven, F., Vrancken Peeters, M. J. T., Sterenborg, H. J., et al. (2019a). Hyperspectral imaging for resection margin assessment during cancer surgery. Clin. Cancer Res. 25 (12), 3572–3580. doi:10.1158/1078-0432.CCR-18-2089
Konecky, S. D., Mazhar, A., Cuccia, D., Durkin, A. J., Schotland, J. C., and Tromberg, B. J. (2009). Quantitative optical tomography of sub-surface heterogeneities using spatially modulated structured light. Opt. Express 17 (17), 14780. doi:10.1364/oe.17.014780
Konecky, S. D., Owen, C. M., Rice, T., Valdés, P. A., Kolste, K., Wilson, B. C., et al. (2012). Spatial frequency domain tomography of protoporphyrin IX fluorescence in preclinical glioma models. J. Biomed. Opt. 17 (5), 056008. doi:10.1117/1.jbo.17.5.056008
Lin, J., Clancy, N. T., Qi, J., Hu, Y., Tatla, T., Stoyanov, D., et al. (2018). Dual-modality endoscopic probe for tissue surface shape reconstruction and hyperspectral imaging enabled by deep neural networks. Med. Image Anal. 48, 162–176. doi:10.1016/j.media.2018.06.004
Lin, S.-P., Wang, L., Jacques, S. L., and Tittel, F. K. (1997). Measurement of tissue optical properties by the use of oblique-incidence optical fiber reflectometry. Appl. Opt. 36 (1), 136. doi:10.1364/ao.36.000136
Lu, G., and Fei, B. (2014). Medical hyperspectral imaging: A review. J. Biomed. Opt. 19 (1), 010901. doi:10.1117/1.JBO.19.1.010901
Marchesini, R., Bertoni, A., Andreola, S., Melloni, E., and Sichirollo, A. E. (1989). Extinction and absorption coefficients and scattering phase functions of human tissues in vitro. Appl. Opt. 28 (12), 2318. doi:10.1364/ao.28.002318
Martelli, F., Del Bianco, S., Ismaelli, A., and Zaccanti, G. (2009). Light propagation through biological tissue and other diffusive media: Theory, solutions, and software. Bellingham, Washington: SPIE. doi:10.1117/3.824746
McClatchy, D. M., Rizzo, E. J., Wells, W. A., Black, C. C., Paulsen, K. D., Kanick, S. C., et al. (2018). Light scattering measured with spatial frequency domain imaging can predict stromal versus epithelial proportions in surgically resected breast tissue. J. Biomed. Opt. 24 (7), 1. doi:10.1117/1.jbo.24.7.071605
McClatchy, D. M., Rizzo, E. J., Wells, W. A., Cheney, P. P., Hwang, J. C., Paulsen, K. D., et al. (2016). Wide-field quantitative imaging of tissue microstructure using sub-diffuse spatial frequency domain imaging. Optica 3 (6), 613. doi:10.1364/optica.3.000613
Momi, N., Backman, V., Brendler, C. B., and Roy, H. K. (2015). Harnessing novel modalities: Field carcinogenesis detection for personalizing prostate cancer management. Future Oncol. 11 (20), 2737–2741. doi:10.2217/fon.15.182
Mourant, J. R., Boyer, J., Hielscher, A. H., and Bigio, I. J. (1996). Influence of the scattering phase function on light transport measurements in turbid media performed with small source-detector separations. Opt. Lett. 21 (7), 546–548. doi:10.1364/OL.21.000546
Mourant, J. R., Canpolat, M., Brocker, C., Esponda-Ramos, O., Johnson, T. M., Matanock, A., et al. (2000). Light scattering from cells: The contribution of the nucleus and the effects of proliferative status. J. Biomed. Opt. 5 (2), 131–137. doi:10.1117/1.429979
Mourant, J. R., Freyer, J. P., Hielscher, A. H., Eick, A. A., Shen, D., and Johnson, T. M. (1998). Mechanisms of light scattering from biological cells relevant to noninvasive optical-tissue diagnostics. Appl. Opt. 37 (16), 3586. doi:10.1364/AO.37.003586
Müller, M. G., Valdez, T. A., Georgakoudi, I., Backman, V., Fuentes, C., Kabani, S., et al. (2003). Spectroscopic detection and evaluation of morphologic and biochemical changes in early human oral carcinoma. Cancer 97 (7), 1681–1692. doi:10.1002/cncr.11255
Naglič, P., Pernuš, F., Likar, B., and Bürmen, M. (2017). “Estimation of optical properties from subdiffusive reflectance beyond the second similarity parameter γ,” in Diffuse optical spectroscopy and imaging VI (Bellingham, Washington: SPIE), 1041205. doi:10.1117/12.2286344
Naglič, P., Pernus, F., Likar, B., and Burmen, M. (2016). Estimation of optical properties by spatially resolved reflectance spectroscopy in the subdiffusive regime. J. Biomed. Opt. 21 (9), 095003. doi:10.1117/1.JBO.21.9.095003
Naglič, P., Vidovic, L., Milanic, M., Randeberg, L. L., and Majaron, B. (2019). Suitability of diffusion approximation for an inverse analysis of diffuse reflectance spectra from human skin in vivo. OSA Contin. 2 (3), 905. doi:10.1364/osac.2.000905
Okamoto Ugnell, A., and Öberg, P. Å. (1997). The optical properties of the cochlear bone. Med. Eng. Phys. 19 (7), 630–636. doi:10.1016/S1350-4533(97)00015-5
O’Sullivan, T. D., Cerussi, A. E., Cuccia, D. J., and Tromberg, B. J. (2012). Diffuse optical imaging using spatially and temporally modulated light. J. Biomed. Opt. 17 (7), 0713111. doi:10.1117/1.jbo.17.7.071311
Pfeiffer, N., and Chapman, G. H. (2008). Successive order, multiple scattering of two-term Henyey-Greenstein phase functions. Opt. Express 16 (18), 13637–13642. doi:10.1364/OE.16.013637
Piao, D., and Patel, S. (2017). Simple empirical master–slave dual-source configuration within the diffusion approximation enhances modeling of spatially resolved diffuse reflectance at short-path and with low scattering from a semi-infinite homogeneous medium. Appl. Opt. 56 (5), 1447. doi:10.1364/AO.56.001447
Post, A. L., Sterenborg, H. J. C. M., Woltjer, F. G., van Leeuwen, T. G., and Faber, D. J. (2020a). Subdiffuse scattering model for single fiber reflectance spectroscopy. J. Biomed. Opt. 25 (1), 1. doi:10.1117/1.JBO.25.1.015001
Post, A. L., Faber, D. J., Sterenborg, H. J. C. M., and van Leeuwen, T. G. (2020b). Subdiffuse scattering and absorption model for single fiber reflectance spectroscopy. Biomed. Opt. Express 11 (11), 6620. doi:10.1364/BOE.402466
Post, A. L., Groof, A. J., Zhang, X. U., Swager, A., Fockens, K. N., Pouw, R. E., et al. (2021). Toward improved endoscopic surveillance with multidiameter single fiber reflectance spectroscopy in patients with Barrett’s esophagus. J. Biophot. 14 (4), e202000351. doi:10.1002/jbio.202000351
Post, A. L., Jacques, S. L., Sterenborg, H. J. C. M., Faber, D. J., and van Leeuwen, T. G. (2017). Modeling subdiffusive light scattering by incorporating the tissue phase function and detector numerical aperture. J. Biomed. Opt. 22 (5), 050501. doi:10.1117/1.JBO.22.5.050501
Prahl, S. A. (1989). “A Monte Carlo model of light propagation in tissue,” in Dosimetry of laser radiation in medicine and biology (Bellingham, Washington: SPIE), 1030509. doi:10.1117/12.2283590
Radosevich, A. J., Mutyal, N. N., Yi, J., Stypula-Cyrus, Y., Rogers, J. D., Goldberg, M. J., et al. (2013). Ultrastructural alterations in field carcinogenesis measured by enhanced backscattering spectroscopy. J. Biomed. Opt. 18 (9), 097002. doi:10.1117/1.JBO.18.9.097002
Reynolds, L. O., and McCormick, N. J. (1980). Approximate two-parameter phase function for light scattering. J. Opt. Soc. Am. 70 (10), 1206–1212. doi:10.1364/JOSA.70.001206
Roy, H. K., Turzhitsky, V., Kim, Y., Goldberg, M. J., Watson, P., Rogers, J. D., et al. (2009). Association between rectal optical signatures and colonic neoplasia: Potential applications for screening. Cancer Res. 69 (10), 4476–4483. doi:10.1158/0008-5472.CAN-08-4780
Saccomandi, P., Vogel, V., Bazrafshan, B., Maurer, J., Schena, E., Vogl, T. J., et al. (2015). Estimation of anisotropy coefficient of swine pancreas, liver and muscle at 1064 nm based on goniometric technique. J. Biophot. 8 (5), 422–428. doi:10.1002/jbio.201400057
Sharma, M., Hennessy, R., Markey, M. K., and Tunnell, J. W. (2014). Verification of a two-layer inverse Monte Carlo absorption model using multiple source-detector separation diffuse reflectance spectroscopy. Biomed. Opt. Express 5 (1), 40–53. doi:10.1364/boe.5.000040
Stegehuis, P. L., Boogerd, L. S. F., Inderson, A., Veenendaal, R. A., van Gerven, P., Bonsing, B. A., et al. (2017). Toward optical guidance during endoscopic ultrasound-guided fine needle aspirations of pancreatic masses using single fiber reflectance spectroscopy: A feasibility study. J. Biomed. Opt. 22 (2), 024001. doi:10.1117/1.JBO.22.2.024001
Stewart, S., Darr, M., Gomer, H., Smith, A., Samiei, A., Post, J. C., et al. (2020). Visible near infrared reflectance molecular chemical imaging of human ex vivo carcinomas and murine in vivo carcinomas. J. Biomed. Opt. 25 (02), 1. doi:10.1117/1.jbo.25.2.026003
Stier, A. C., Goth, W., Hurley, A., Brown, T., Feng, X., Zhang, Y., et al. (2021). Imaging sub-diffuse optical properties of cancerous and normal skin tissue using machine learning-aided spatial frequency domain imaging. J. Biomed. Opt. 26 (9), 096007. doi:10.1117/1.jbo.26.9.096007
Streeter, S. S., Maloney, B. W., Zuurbier, R. A., Wells, W. A., Barth, R. J., Paulsen, K. D., et al. (2021). Optical scatter imaging of resected breast tumor structures matches the patterns of micro-computed tomography. Phys. Med. Biol. 66 (11), 115021. doi:10.1088/1361-6560/ac01f1
Sung, K., Shih, K. W., Hsu, F. W., Hsieh, H. P., Chuang, M. J., Hsiao, Y. H., et al. (2022). Accurate extraction of optical properties and top layer thickness of two-layered mucosal tissue phantoms from spatially resolved reflectance spectra. J. Biomed. Opt. 19 (7), 077002. doi:10.1117/1.jbo.19.7.077002
Tabassum, S., Pera, V., Greening, G., Muldoon, T. J., and Roblyer, D. (2018). Two-layer inverse model for improved longitudinal preclinical tumor imaging in the spatial frequency domain. J. Biomed. Opt. 23 (7), 076011. doi:10.1117/1.JBO.23.7.076011
Taddeucci, A., Martelli, F., Barilli, M., Ferrari, M., and Zaccanti, G. (1996). Optical Properties of brain tissue. J. Biomed. Opt. 1 (1), 117–123. doi:10.1117/12.227816
Tian, H., Liu, Y., and Wang, L. (2006). Influence of the third-order parameter on diffuse reflectance at small source-detector separations. Opt. Lett. 31 (7), 933–935. doi:10.1364/OL.31.000933
Utzinger, U., and Richards-Kortum, R. R. (2003). Fiber optic probes for biomedical optical spectroscopy. J. Biomed. Opt. 8 (1), 121–147. doi:10.1117/1.1528207
van der Zee, P., Essenpreis, M., and Delpy, D. T. (1993). “Optical properties of brian tissue,” in Photon migration and imaging in random media and tissues (Bellingham, Washington: SPIE), 454–465. doi:10.1117/12.154665
Vervandier, J., and Gioux, S. (2013). Single snapshot imaging of optical properties. Biomed. Opt. Express 4 (12), 2938–2944. doi:10.1364/BOE.4.002938
Vitkin, E., Turzhitsky, V., Qiu, L., Guo, L., Itzkan, I., Hanlon, E. B., et al. (2011). Photon diffusion near the point-of-entry in anisotropically scattering turbid media. Nat. Commun. 2 (1), 587. doi:10.1038/ncomms1599
Wang, L. V., Jacques, S. L., and Zheng, L. (1995). Monte Carlo modeling of light transport in tissues. Comput. Methods Programs Biomed. 47, 73–100. doi:10.1007/978-1-4757-6092-7_4
Wang, R. K. (2000). Modelling optical properties of soft tissue by fractal distribution of scatterers. J. Mod. Opt. 47 (1), 103–120. doi:10.1080/09500340008231409
Wietlicka-piszcz, M., Mazur, R., and Grzegorzewski, B. (1994). “Goniometric investigations of light scattered by bones of the skull,” in Proceedings of SPIE (Bellingham, Washington: SPIE). doi:10.1117/12.192028
Xu, M. (2016). Diagnosis of the phase function of random media from light reflectance. Sci. Rep. 6 (2), 22535–22537. doi:10.1038/srep22535
Xu, M., Wu, T. T., and Qu, J. Y. (2008). Unified Mie and fractal scattering by cells and experimental study on application in optical characterization of cellular and subcellular structures. J. Biomed. Opt. 13 (2), 024015. doi:10.1117/1.2907790
Yaroslavskaya, A. N., Utz, S. R., Tatarintsev, S. N., and Tuchin, V. V. (1994). “Angular scattering properties of human epidermal layers,” in Proceedings of SPIE (Bellingham, Washington: SPIE), 2100. doi:10.1117/12.179025
Yaroslavsky, A. N., Yaroslavsky, I. V., Goldbach, T., and Schwarzmaier, H. J. (1996). Optical properties of blood in the near-infrared spectral range. Proc. SPIE - Int. Soc. Opt. Eng. 2678 (5), 314–324. doi:10.1117/12.239516
Yu, L., Nina-Paravecino, F., Kaeli, D., and Fang, Q. (2018). Scalable and massively parallel Monte Carlo photon transport simulations for heterogeneous computing platforms. J. Biomed. Opt. 23 (1), 1. doi:10.1117/1.jbo.23.1.010504
Zijp, J. R., and ten Bosch, J. J. (1994). Use of tabulated cumulative density functions to generate pseudorandom numbers obeying specific distributions for Monte Carlo simulations. Appl. Opt. 33 (3), 533–534. doi:10.1364/AO.33.000533
Keywords: reflectance spectroscopy, diffuse, subdiffuse, source-detector separation, spatial frequency domain imaging (SFDI), hyperspectral imaging (HSI), diffuse reflectance spectroscopy (DRS), single fiber reflectance spectroscopy
Citation: Witteveen M, Faber DJ, Sterenborg HJCM, Ruers TJM, van Leeuwen TG and Post AL (2022) Opportunities and pitfalls in (sub)diffuse reflectance spectroscopy. Front. Photonics 3:964719. doi: 10.3389/fphot.2022.964719
Received: 08 June 2022; Accepted: 15 August 2022;
Published: 26 September 2022.
Edited by:
Sylvain Gioux, Intuitive Surgical Sàrl, SwitzerlandReviewed by:
Irving Bigio, Boston University, United StatesCopyright © 2022 Witteveen, Faber, Sterenborg, Ruers, van Leeuwen and Post. This is an open-access article distributed under the terms of the Creative Commons Attribution License (CC BY). The use, distribution or reproduction in other forums is permitted, provided the original author(s) and the copyright owner(s) are credited and that the original publication in this journal is cited, in accordance with accepted academic practice. No use, distribution or reproduction is permitted which does not comply with these terms.
*Correspondence: Anouk L. Post, YS5wb3N0QG5raS5ubA==
Disclaimer: All claims expressed in this article are solely those of the authors and do not necessarily represent those of their affiliated organizations, or those of the publisher, the editors and the reviewers. Any product that may be evaluated in this article or claim that may be made by its manufacturer is not guaranteed or endorsed by the publisher.
Research integrity at Frontiers
Learn more about the work of our research integrity team to safeguard the quality of each article we publish.