
95% of researchers rate our articles as excellent or good
Learn more about the work of our research integrity team to safeguard the quality of each article we publish.
Find out more
ORIGINAL RESEARCH article
Front. Photonics , 31 October 2022
Sec. Light Sources and Luminescent Materials
Volume 3 - 2022 | https://doi.org/10.3389/fphot.2022.1037473
This article is part of the Research Topic Celebrating 20 Years of CICECO – Aveiro Institute of Materials - Current and future perspectives in the use of Material Sciences, Chemistry, and Photonics for a more sustainable future View all 20 articles
 Joana Costa Martins1
 Artiom Skripka2
 Carlos D. S. Brites1
 Antonio Benayas3,4
 Rute A. S. Ferreira1
 Fiorenzo Vetrone2
 Luís D. Carlos1*
Luminescence thermometry is a spectroscopic technique for remote temperature detection based on the thermal dependence of the luminescence of phosphors, presenting numerous applications ranging from biosciences to engineering. In this work, we use the Er3+ emission of the NaGdF4/NaGdF4:Yb3+,Er3+/NaGdF4 upconverting nanoparticles upon 980 nm laser excitation to determine simultaneously the absolute temperature and the excitation power density. The Er3+ 2H11/2→4I15/2 and 4S3/2→4I15/2 emission bands, which are commonly used for thermometric purposes, overlap with the 2H9/2 →4I13/2 emission band, which can lead to erroneous temperature readout. Applying the concept of luminescent primary thermometry to resolve the overlapping Er3+ transitions, a dual nanosensor synchronously measuring the temperature and the delivered laser pump power is successfully realized holding promising applications in laser-supported thermal therapies.
Luminescent nanothermometry exploits the temperature-dependent emission properties of luminescent nanoprobes, e.g., quantum dots, organic dyes, polymers, DNA or protein conjugated systems, transition-metal-based materials, or trivalent lanthanide ion (Ln3+)-doped materials (Brites et al., 2012; Jaque and Vetrone, 2012; Brites et al., 2016). The latter systems feature unique characteristics, such as high photostability, narrow bandwidth, and efficient room-temperature emission, which make them suitable for different applications, particularly bioimaging-related ones (Jaque et al., 2014; Zhou et al., 2015; Brites et al., 2016; Dramicanin, 2018; Brites et al., 2019a). Ln3+ ions work in the spectral ranges where the biological tissue has minimal absorption and negligible autofluorescence, designated as biological imaging windows. Therefore, luminescent thermometers based on Ln3+-doped nanomaterials have been widely employed in intracellular measurements (Debasu et al., 2020; Piñol et al., 2020; Dantelle et al., 2021; Di et al., 2021; Kim et al., 2021; Dos Santos et al., 2022) and tumor temperature mapping during thermal therapies (Jaque et al., 2014; Carrasco et al., 2015; Zhu et al., 2016, 2018).
The most common approach to infer absolute temperature is based on the intensity ratio of two distinct transitions - ratiometric luminescence thermometry (Brites et al., 2016). In the last few years, primary thermometers based on luminescent nanoprobes have been studied which take advantage of the temperature-dependent intensity ratio of the two thermally coupled Er3+ levels, 2H11/2 and 4S3/2 (Balabhadra et al., 2017; Bastos et al., 2019; Brites et al., 2019b; Martínez et al., 2019; Borges et al., 2021; Martins et al., 2021; Dos Santos et al., 2022). A primary thermometer is characterized by a well-established emitting state population equation that follows Boltzmann statistics. Recently, a few works have drawn attention to the impact of the 2H9/2→4I13/2 emission band in temperature determination using Er3+ emission (Martins et al., 2021; Rühl et al., 2021; Van Swieten et al., 2021; Xia et al., 2021). Upon near-infrared (NIR) excitation, the 2H9/2 manifold of Er3+ is populated through a three-photon upconversion process (Cho et al., 2017). Emission of the 2H9/2→4I13/2 transition overlaps with the 4S3/2→4I15/2 one, which can lead to total intensity overestimation when 2H9/2→4I13/2 contribution is overlooked, and its contribution increases with the excitation power density (PD) (Zhou et al., 2013; Berry and May, 2015; Yuan et al., 2018, 2019; Rühl et al., 2021; Xia et al., 2021). This complicates accurate temperature readout but provides an opportunity to explore NIR PD optical readout, as demonstrated herein. To the best of our knowledge, only one luminescent excitation density ratiometric sensor for the visible spectral range was reported by (Marciniak et al. (2022)). There, the intensity ratio of 4T2(g)→4A2(g) and 2E(g) →4A2(g) transitions of GdAl3(BO3)4:Cr3+ nanoparticles was used to measure the excitation power density at 445 nm and 532 nm. The authors designed the nanoparticles to enhance the probability of nonradiative processes to achieve an efficient radiation-to-heat conversion. The designed material reached temperatures as high as 143°C, even at low excitation power density. According to the excitation power density, the heat generated in the system leads to the thermalization of the 4T2(g) state inducing a change in the intensity ratio (Marciniak et al., 2022), and thus, the working principle of this Cr3+ ratiometric laser power meter is, in fact, temperature related.
The simultaneous measurement of temperature and incident PD is critical for optimizing photon-based therapies, such as photothermal therapy (Jaque et al., 2014; Yang et al., 2017) and photobiomodulation (PBM) (Freitas and Hamblin, 2016), and preventing the surrounding tissue from overheating and deleterious damage (Shen et al., 2020). Photothermal therapy uses light to generate heat from plasmonic or dielectric nanoparticles (Jaque et al., 2014), whereas PBM involves the use of a low-powered light source (lasers and LEDs) within the red and NIR wavelength range (∼600–1,000 nm) to stimulate or inhibit cellular and biological processes (Freitas and Hamblin, 2016). In PBM applications, where the low-powered excitation source does not induce an evident temperature rise, the PD quantization of the delivered light to the target could contribute to standardization, improving the reliability and reproducibility of the technique (Wang and Dong, 2020).
In this work, we study the thermometric features of NaGdF4/NaGdF4:Yb3+,Er3+/NaGdF4 upconverting nanoparticles upon 980 nm laser excitation and show how they work as a primary luminescent thermometer once the decoupling procedure is applied to resolve the overlapping 2H9/2→4I13/2 and 4S3/2→4I15/2 emission bands. The passive-core/active-shell/passive-shell architecture of nanoparticles was chosen to promote Er3+ upconversion emission from the 2H9/2 excited state, through reduced energy migration and enhanced energy transfer upconversion (Chen et al., 2016; Wang, 2019). Taking advantage of the PD-dependent 2H9/2→4I13/2 emission intensity, we characterize a ratiometric NIR radiation sensor. Thus, we have developed a versatile system capable of sensing both the local absolute temperature and the PD delivered to the target using luminescence with future potential applications in PBM treatments or other laser-based thermal therapies.
Besides being a NIR radiation sensor, which is the radiation commonly used in biological applications, the monodisperse in size NaGdF4/NaGdF4:Yb3+,Er3+/NaGdF4 nanoparticles can be patterned on various substrates as well as dispersed in different colloidal mixtures. Moreover, the intensity of the selected transitions to sense the delivered laser pump power are thermal independent, enabling the synchronous measurement of the temperature and PD.
NaGdF4/NaGdF4: 2 mol% Er3+, 20 mol% Yb3+/NaGdF4 lanthanide-doped nanoparticles (Figure 1), were prepared by hot-injection thermal decomposition (Boyer et al., 2006; Skripka et al., 2020).
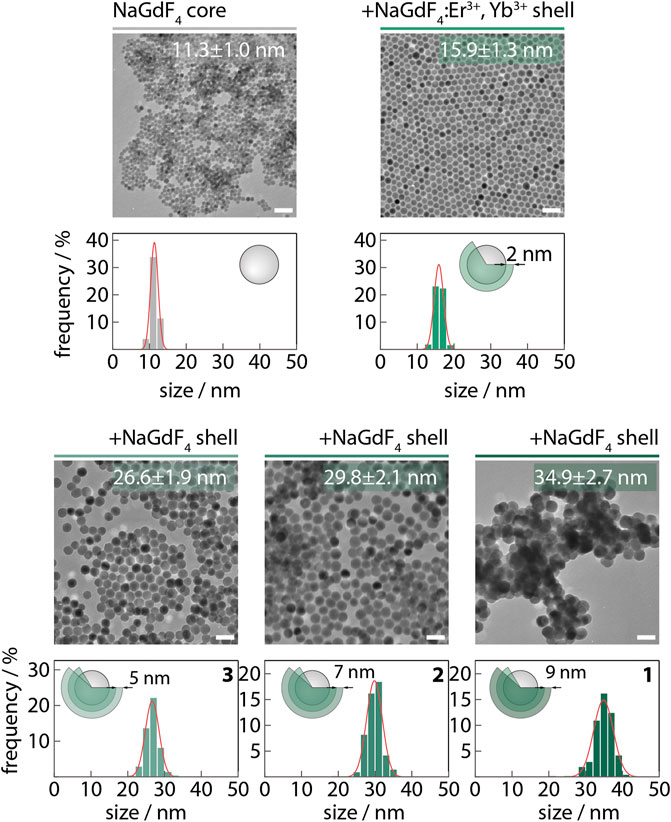
FIGURE 1. Representative TEM images of Er3+-doped nanothermometers and their respective size distributions. The thickness of the outer NaGdF4 shell is represented in the scheme. The nanoparticles used in this work, 1, 2, and 3, are represented in the lower panel. The solid lines are the best fits to the experimental data using Gaussian distributions (r2 > 0.99). The scale bars correspond to 50 nm.
To synthesize the core, an initial mixture of 12.5 mL each of OA and ODE was prepared in a 100 mL three-neck round bottom flask (Solution A). Aside, 2.5 mmol of Na-TFA were added to the 2.5 mmol of dried Gd-TFA precursor together with 7.5 mL each of OA and ODE (Solution B). Both solutions A and B were degassed at 150°C under vacuum with magnetic stirring for 30 min. After degassing, solution A was placed under an Ar atmosphere and the temperature was raised to 315°C. Solution B was then injected into the reaction vessel containing solution A with a syringe and pump system at a 1.3 mL/min injection rate. The mixture was left at 315°C under vigorous stirring for 60 min. After cooling to room temperature, the as-synthesized cores (11.3 nm) were stored in a Falcon centrifuge tube under Ar for further synthesis steps. The core/shell NaGdF4/NaGdF4:Er3+, Yb3+ nanoparticles were prepared by a subsequent shelling of the 2.5 mmol of core nanoparticles (solution A). Separately, solution B contained 3.5 mmol of Na-TFA precursors and 3.5 mmol of Gd,Yb,Er-TFA (2.73 mmol + 0.7 mmol + 0.07 mmol) together with 7.5 mL each of OA and ODE. Both solutions were degassed at 150°C under vacuum with magnetic stirring for 30 min. After degassing, solution A was placed under an Ar atmosphere and the temperature was raised to 315°C. Solution B was then injected at a 1 mL/min rate into solution A and left to react for 90 min. After, 15 mL of the reaction mixture containing core/shell1 nanoparticles (15.9 nm) was aliquoted for sampling. The core/shell/shell NaGdF4/NaGdF4:Er3+, Yb3+/NaGdF4 with various thicknesses of the most-outer shell were prepared by subsequent injection of shelling precursors into the reaction. 8 mmol each of Na-TFA and Gd-TFA were dissolved and degassed in a mixture of 10 mL each of OA and ODE (solution C). Half (10 mL) of solution C was injected at 1 ml/min into the reaction flask and kept at a pre-set 315°C temperature for 60 min, 10 mL of the reaction mixture was aliquoted from the flask before injecting the rest of the solution C. After 60 min, 10 mL were aliquoted from the reaction flask, obtaining core/shell/shell RENPs with a 5.4 nm thick outer shell. Another 8 mmol each of Na-TFA and Gd-TFA were dissolved and degassed in a mixture of 10 mL each of OA and ODE (solution D) and injected (10 mL) into the reaction flask. After 60 min, 10 mL were aliquoted from the reaction obtaining core/shell/shell RENPs with 7.0 nm thick outer shell. The remaining 10 mL of the solution D were then injected into the reaction mixture and allowed to react for 60 min, yielding core/shell/shell RENPs with a 9.5 nm thick outer shell. The mixture was cooled to room temperature, and core-only, core/shell, and core/shell/shell RENPs were precipitated with ethanol and washed three times with hexane/ethanol (1/4 v/v), followed by centrifugation (5400 RCF). Samples containing NaGdF4/NaGdF4:Er3+,Yb3+/NaGdF4 RENPs with outer shell thicknesses of 9.5, 7.0, and 5.4 nm dispersed in water (nanofluids) were designated as 1, 2 and 3, respectively.
The morphology and size distribution of the core-only and core/shell UCNPs were investigated by transmission electron microscopy (TEM, Philips Tecnai 12). The particle size was determined from TEM images using ImageJ software with a minimum set size of 200 individual UCNPs per sample. The crystallinity and phase of all the UCNPs were determined via X-ray powder diffraction (XRD) analysis with a Bruker D8 Advance Diffractometer (USA) using Cu Kα radiation.
The 1, 2, and 3 nanofluids were placed in a quartz cuvette (114F−10–40, Hellma Analytics) and were excited with a pulsed laser (BrixX 980–1000 HD, Omicron Laser) at a frequency of 1.5 MHz, to get an essentially continuous wave irradiation mode. The laser was focused through an optical lens of 7.5 cm focal distance (LA1145, Thorlabs) to enhance the power density (PD) that ranges from 29.0 ± 0.1 to 138.8 ± 0.7 W cm−2, estimated as previously reported (Caixeta et al., 2020). The emission light was guided through an optical fiber (P600-1-UV-VIS, Ocean Insight) and the laser contribution was cut out with a short-pass optical filter (FESH0750, Thorlabs). The emission spectra were recorded by a portable spectrometer (MAYA Pro 2000; Ocean Insight) using an acquisition window between 15–75 s (a total of 150 measurements with integration time ranging from 0.1 to 0.5 s), adjusting the acquisition conditions to obtain a similar signal-to-noise (SNR) ratio at the different excitation PD. The spectrometer uses reference and dark measurements to correct the instrument response.
The quartz cuvette was placed in thermal contact with a homemade temperature controller containing a Peltier system and a thermocouple (K-type, 0.1 K accuracy) that was immersed near the laser spot, but away from the light path to monitor and measure the temperature (T) of the nanofluid. We set the temperature controller at a fixed temperature and turned on the excitation laser at a fixed PD inducing an additional temperature increment. After the nanofluid reaches thermal equilibrium (t > 350 s) the emission spectra and thermocouple reading are recorded. This process was repeated for PD ranging from 19.0 to 138.8 W cm−2 and for different set temperatures (297.6–315.3 K). At the lowest temperature used (room temperature), the temperature controller was kept off.
Before the calculus of the thermometric parameter (∆) and NIR radiation sensing parameter (∆NIR), a spectral deconvolution procedure based on a previously reported work (Martins et al., 2021) was applied to the emission spectra to decouple the overlapping transitions, 2H9/2→4I13/2 and 4S3/2→4I15/2, using a routine in MatLab© software. The routine starts with a baseline subtraction to remove the remaining spectrometer electric noise, followed by the conversion of the signal of each emission spectrum from wavelength to energy units by applying the Jacobian transformation (Mooney and Kambhampati, 2013). Then, the [17,500, 19,500] cm−1 spectral region was fitted using a multiparametric Gaussian function. Good fits to the experimental data (R2 > 0.99) were obtained with a minimum number of Gaussian functions equal to 10 (two, four, and four Gaussian functions described the 2H9/2→4I13/2, 4S3/2→4I15/2, and 2H11/2→4I15/2 transitions, respectively). The intensities of the transitions were estimated by the sum of the fitted areas of the respectively assigned Gaussian functions. The parameters ∆ and ∆NIR are computed for the 150 recorded emission spectra for each PD and T, where ∆, ∆NIR and the respective uncertainties (δ∆ and δ∆NIR, respectively) are extracted from the corresponding histograms (mean ± standard deviation). To evaluate the performance of the luminescent thermometer, the relative thermal sensitivity, Sr, and the minimum temperature uncertainty, δT, are determined, as follows (Brites et al., 2016):
and
where δΔ is the uncertainty in the determination of
Figure 2 illustrates the emission spectra of 1 for selected PD values exhibiting Er3+ transitions in the green, 2H11/2→4I15/2 and 4S3/2→4I15/2, and red spectral regions, 4F9/2→4I15/2 (Auzel, 2004). Evidence of the 2H9/2 level population can be found in the transitions in the blue, 2H9/2 →4I15/2, and red spectral region, 2H9/2 →4I11/2. Additionally, the band overlapping with the 4S3/2→4I15/2 emission corresponds to the 2H9/2→4I13/2 transition, whose intensity shows similar power-dependence to the 2H9/2 →4I11/2,15/2 transitions (Berry and May, 2015; Cho et al., 2017). Since the population of the 2H9/2 level is reached via a three-photon upconversion process, the intensity of radiative transitions from the 2H9/2 level shows a different behavior with PD than the 2H11/2→4I15/2 and 4S3/2 →4I15/2 transitions (Renero-Lecuna et al., 2011; Zhou et al., 2013; Cho et al., 2017). A similar trend is observed for 4F9/2→4I15/2, where, at higher PD, the upper levels, 2H11/2 and 4S3/2 become saturated favoring the population of the 4F9/2 emitting level due to nonradiative relaxations upon the local heating induced by the laser excitation (Kraft et al., 2018; Maturi et al., 2021). The emission spectra of 2 and 3 measured at the lowest measured PD display analogous emission spectra of 1, except for the worse SNR (Supplementary Figure S1). As the shell gets thicker, the luminescence quenching effects are reduced (Pini et al., 2022; Shi et al., 2022) leading to higher SNR and advantageously decreased temperature uncertainty. As initially proposed by some of us (Brites et al., 2016), and experimentally implemented by others (Van Swieten et al., 2021), the temperature uncertainty increases as the SNR degrades. The value of the relative thermal uncertainty for 1 is about 78% and 49% smaller than those obtained for 2 and 3, respectively, in similar excitation and collection conditions (Supplementary Figure S2). For this reason, 1 was the chosen nanofluid to perform the onward photoluminescent measurements.
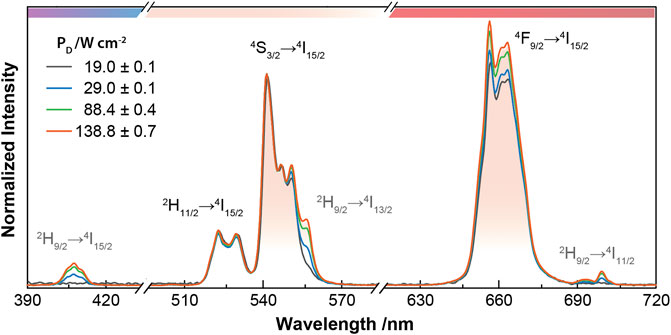
FIGURE 2. Normalized upconversion emission spectra of 1 as a function of PD measured at room temperature. The spectra are normalized to the 4S3/2→4I15/2 transition.
The Er3+ emission in the green spectral region, namely the 2H11/2→4I15/2 and 4S3/2→4I15/2 transitions, have been widely explored for thermometric purposes in light upconverting nanoparticles since its first report in 2010 (Vetrone et al., 2010). The intensity ratio of these two transitions is temperature-dependent according to Boltzmann statistics, which governs the population distribution between the two thermally coupled levels, 2H11/2 and 4S3/2. Recently, these thermometers have been explored as primary luminescent thermometers, in which the intensity ratio between 2H11/2→4I15/2 (IH) and 4S3/2→4I15/2 (IS) emissions bands are directly related to the absolute temperature, T, through a well-established equation of state population (Balabhadra et al., 2017; Brites et al., 2019b; Martínez et al., 2019; Back et al., 2020):
where kB is the Boltzmann constant, ΔE is the energy gap between the barycenters of the 2H11/2 and 4S3/2 levels, and Δ = IH/IS the thermometric parameter with Δ0 being the value at the temperature T0 (see Supporting Information for the calculus of ΔE and Δ0).
Regarding temperature determination through the intensity ratio between the 2H11/2→4I15/2 and 4S3/2→4I15/2, a few works have been raising awareness of the impact of the 2H9/2→4I13/2 transition and how it can affect the temperature measurements, especially when a laser PD variation is imposed (Martins et al., 2021; Rühl et al., 2021; Van Swieten et al., 2021; Xia et al., 2021).
Figure 3A shows the temperature dependence of the emission spectra of 1 excited at selected PD values and set temperatures (297.6, 305.3, and 315.3 K). Since the 2H9/2→4I13/2 and 4S3/2→4I15/2 emission bands are overlapped, and Equation 3 accounts only for the emissions of the two thermally coupled levels (2H11/2 and 4S3/2), the emission bands must be decoupled to correctly estimate IS. Thus, a spectral deconvolution, consisting of a multiparametric Gaussian fit, is applied and the 2H9/2→4I13/2 (IX), 4S3/2→4I15/2 (IS), and 2H11/2→4I15/2 (IH) transitions intensities are estimated by the sum of the fitted areas of the assigned Gaussians to the respective transitions (Figure 3B) (see further details in Materials and Methods).
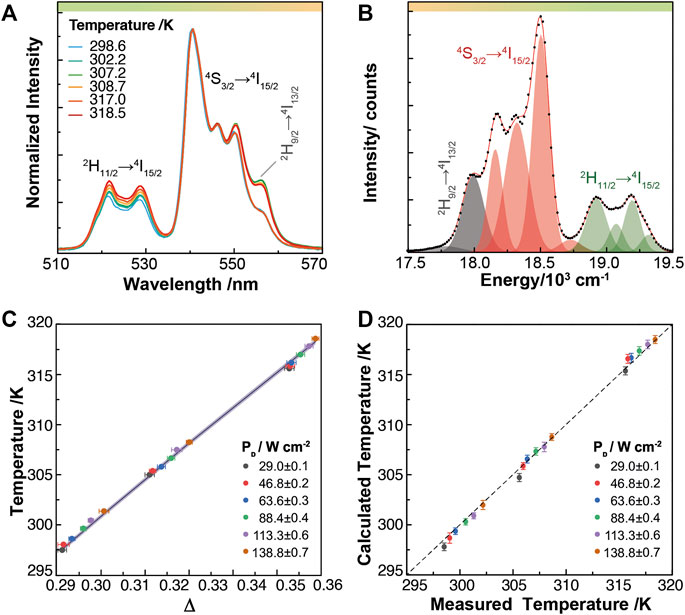
FIGURE 3. (A) Temperature-dependent upconversion emission spectra of 1 excited at 29.0, 88.4 and 138.8 W cm−2. (B) Spectral Gaussian deconvolution of the emission spectrum measured at 302.2 K and 138.8 W cm−2. The black dots and the red line represent the experimental data and the fit envelope of the spectrum, respectively. The shadowed areas correspond to the Gaussian functions assigned to the 2H9/2→4I13/2 (black), 4S3/2→4I15/2 (red), and 2H11/2→4I15/2 (green) transitions. (C) Temperature dependence of the experimental Δ values determined under laser excitation at different PD values. The horizontal error bars represent the error in the measured thermometric parameters (Supplementary Equation S1 in Supporting Information). The line is the theoretical prediction of the temperature (Equation 3) and the shadowed area is the corresponding uncertainty (Supplementary Equation S2 in Supporting Information). (D) Measured temperature (thermocouple reading) versus calculated temperature (Equation 3) under laser excitation at different PD values. The vertical error bars correspond to the shadowed area of the line represented in C. The thermocouple accuracy is 0.1 K.
We observe that the calculated ∆ are within the theoretical prediction by Equation 3, independently of the excitation PD values (Figure 3C). ∆ is converted to absolute temperature substituting the corresponding parameters (Δ0, T0, and ΔE, Supplementary Figures S3, S4 and Supporting Information for further details) in Equation 3. The calculated temperatures are in excellent agreement with the experimental ones, demonstrating that 1 works as a primary luminescent thermometer. Besides guaranteeing reliable temperature measurements, the primary luminescent thermometer demonstrated the correct decoupling of both transitions (2H9/2→4I13/2 and 4S3/2→4I15/2) in the PD range of 29.0–138.8 W cm−2. Moreover, it is experimentally verified, for the first time, the independence of the primary luminescent thermometer on excitation PD (Figure 3D).
The Sr of 1 is within the commonly reported range for Er3+ based nanothermometers (∼0.2–1 %K−1), since ΔE is not considerably affected by its host matrix (Figure 4A). Besides the material, δT also depends on the SNR of the measurement, which means this figure of merit is strongly affected by the type and performance of the detector and experimental conditions, such as luminescent material quantity, acquisition time, and background noise, thus precluding a fair comparison with reported values in the literature (Brites et al., 2016; Van Swieten et al., 2022). Nevertheless, in this work, the minimum δT is 0.3 K at 297.5 K (Figure 4B), which is above 0.2 K, the minimum possible value, as reported by (Van Swieten et al. (2022)).
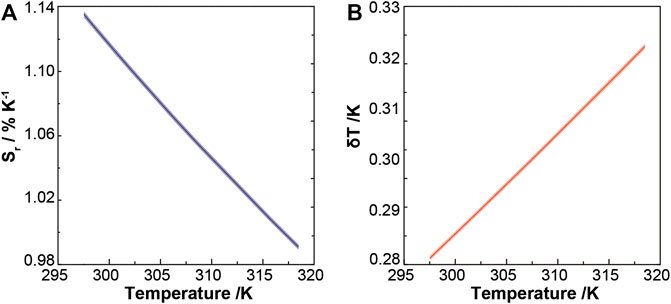
FIGURE 4. (A) Relative thermal sensitivity and (B) temperature uncertainty of 1. The corresponding uncertainties (Supplementary Equations S3, S4 in Supporting Information) are represented by the shadowed areas.
The high sensitivity of the 2H9/2→4I13/2 intensity to PD values led us to further study these luminescent nanoparticles as a potential NIR radiation sensor. Since emission intensities depend on a multitude of parameters (e.g., temperature, power density, sensor concentration, material inhomogeneities and optoelectronic drifts in detection) (Brites et al., 2012), we define the NIR radiation sensing parameter as an intensity ratio, ΔNIR = IX/IB, calculated using the emission intensity of the 2H9/2→4I15/2 (IB) and 2H9/2→4I13/2 (IX) transitions (Figure 5A).
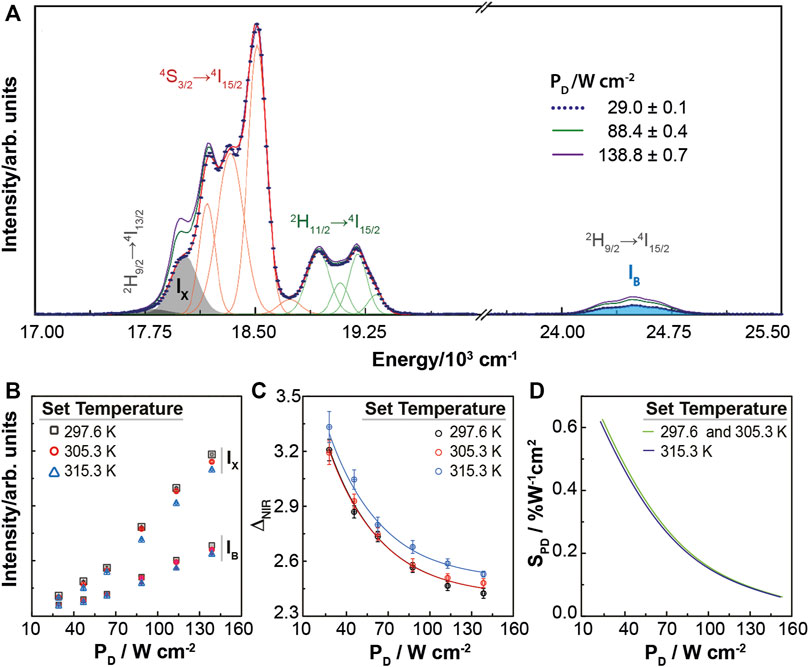
FIGURE 5. (A) Upconversion emission spectra of 1 for selected PD values (297.6 K set temperature) depicting the spectral Gaussian deconvolution (green and red lines ascribed to 2H11/2→4I15/2 and 4S3/2→4I15/2 transitions) and the IX and IB areas for 29.0 W cm−2 (grey and blue shadowed regions). Dependence on PD of (B) IX and IB and (C) ΔNIR, for the indicated set temperatures. The lines correspond to the best fits to the experimental data using Equation 4 (r2 > 0.98). (D) Corresponding relative sensitivity to PD of the NIR sensor based on 1.
The power-dependence of IX and IB is different (Figure 5B) resulting in a decreasing ΔNIR with PD values (Figure 5C). Changing PD for the set temperatures 297.6 and 305.3 K, ΔNIR is the same within the uncertainty, while at a higher set temperature (315.3 K) an offset in ΔNIR values is observed. Therefore, we characterize 1 as a NIR sensor with a specific calibration according to the working temperature ranges (298.5–308.7 K and 315.6–318.5 K, Figure 3D).
To determine a working calibration curve that describes ΔNIR variation in the measured PD range, we assume a generic and empirical equation that better fits the experimental data since we lack a theoretical model. As the behavior observed for ΔNIR variation is similar in both temperature ranges and only differs by an offset, the following function:
was fitted to both experimental datasets with A and t parameters shared between the two fits while y0 was kept free (Figure 5C). The resulting fitting parameters are A = 1.74 ± 0.09, t = 37 ± 1 W cm−2, y01 = 2.41 ± 0.01 and y02 = 2.50 ± 0.01, corresponding to y0 in the 298.5–308.7 K and 315.6–318.5 K ranges, respectively. Inspired by the definition of the relative thermal sensitivity of a thermometer (Equation 1), we define the relative sensitivity to PD, SPD, as a figure of merit to characterize the NIR sensor:
yielding a maximum value of 0.5% W−1·cm2 at 29.0 W cm−2 (Figure 5D), which is higher than the value reported for the luminescent Cr3+−based ratiometric radiation sensor, 0.07% W−1 cm2, (Marciniak et al., 2022).
The Er3+ emission of the NaGdF4/NaGdF4:Yb3+,Er3+/NaGdF4 upconverting nanoparticles upon 980 nm laser excitation was used to develop a luminescent dual nanosensor synchronously measuring the temperature and the delivered laser pump power. Both sensing capabilities use the same simple instrumentation, providing reliable temperature readout through the concept of luminescent primary thermometry to resolve the overlapping of the 2H9/2→4I13/2 and 4S3/2→4I15/2 emissions. Moreover, the measurements are independent and there are no temperature-PD crossover effects in the studied temperature. This dual-sensor shows potential for laser-assisted biomedical applications, such as in-vivo real-time temperature monitoring during photothermal therapies, where human exposure to NIR laser radiation must be strictly controlled to avoid healthy tissue damage and, thus, ensuring a safe and efficient therapy implementation. In context, under the International Commission on Non‐Ionizing Radiation Protection (ICNIRP) guidelines, skin exposure to 980 nm laser radiation is limited to 0.73 W cm-2 for exposures times of 10 s to 8 h (Ziegelberger, 2013). However, for deliberate exposure as part of medical treatment, these radiation limits vary according to the procedure and instrumentation regulated by U.S. Food and Drug Administration (FDA) (FDA, 2020), and thus demand for flexible in situ power verification.
The raw data supporting the conclusions of this article will be made available by the authors, without undue reservation.
JM: Photoluminescence characterization, draft and figures preparation. AS, AB, and FV: Conceptualization, supervising the synthesis of the particles, data curation, and validation of the synthesis and structural characterization of the prepared particles. CB, RF, and LC: Conceptualization of the luminescent thermometry and delivered laser power density sensor, methodology of photoluminescence measurements, data curation on photoluminescence, validation, writing, reviewing, and editing on the final manuscript and figures.
This work was developed within the scope of the project CICECO-Aveiro Institute of Materials, UIDB/50011/2020, UIDP/50011/2020 and LA/P/0006/2020, financed by national funds through the FCT/MEC (PIDDAC).
JM and AS are grateful to FCT (SFRH/BD/139710/2018) and Fonds de Recherche du Québec-Nature et technologies (FRQNT) for financial support in the form of scholarships for doctoral studies, respectively. AB acknowledges funding support from Comunidad de Madrid through TALENTO grant ref. 2019-T1/IND-14014.
The authors declare that the research was conducted in the absence of any commercial or financial relationships that could be construed as a potential conflict of interest.
All claims expressed in this article are solely those of the authors and do not necessarily represent those of their affiliated organizations, or those of the publisher, the editors and the reviewers. Any product that may be evaluated in this article, or claim that may be made by its manufacturer, is not guaranteed or endorsed by the publisher.
The Supplementary Material for this article can be found online at: https://www.frontiersin.org/articles/10.3389/fphot.2022.1037473/full#supplementary-material
Auzel, F. (2004). Upconversion and anti-Stokes processes with f and d ions in solids. Chem. Rev. 104, 139–174. doi:10.1021/cr020357g
Back, M., Casagrande, E., Brondin, C. A., Ambrosi, E., Cristofori, D., Ueda, J., et al. (2020). Lanthanide-doped Bi2SiO5@SiO2 core-shell upconverting nanoparticles for stable ratiometric optical thermometry. ACS Appl. Nano Mat. 3, 2594–2604. doi:10.1021/acsanm.0c00003
Balabhadra, S., Debasu, M. L., Brites, C. D. S., Ferreira, R. A. S., and Carlos, L. D. (2017). Upconverting nanoparticles working as primary thermometers in different media. J. Phys. Chem. C 121, 13962–13968. doi:10.1021/acs.jpcc.7b04827
Bastos, A. R. N., Brites, C. D. S., Rojas-Gutierrez, P. A., DeWolf, C., Ferreira, R. A. S., Capobianco, J. A., et al. (2019). Thermal properties of lipid bilayers determined using upconversion nanothermometry. Adv. Funct. Mat. 29, 1905474–1905510. doi:10.1002/adfm.201905474
Berry, M. T., and May, P. S. (2015). Disputed mechanism for NIR-to-red upconversion luminescence in NaYF4:Yb3+, Er3+. J. Phys. Chem. A 119, 9805–9811. doi:10.1021/acs.jpca.5b08324
Borges, F. H., Martins, J. C., Caixeta, F. J., Pereira, R. R., Carlos, L. D., Ferreira, R. A. S., et al. (2021). Primary thermometers based on sol–gel upconverting Er3+/Yb3+ Co-doped yttrium tantalates with high upconversion quantum yield and emission color tunability. J. Sol-Gel Sci. Technol. 102, 249–263. doi:10.1007/s10971-021-05673-0
Boyer, J.-C., Vetrone, F., Cuccia, L. A., and Capobianco, J. A. (2006). Synthesis of colloidal upconverting NaYF4 nanocrystals doped with Er3+, Yb3+ and Tm3+, Yb3+ via thermal decomposition of lanthanide trifluoroacetate precursors. J. Am. Chem. Soc. 128, 7444–7445. doi:10.1021/ja061848b
Brites, C. D. S., Balabhadra, S., and Carlos, L. D. (2019a). Lanthanide-based thermometers: At the cutting-edge of luminescence thermometry. Adv. Opt. Mat. 7, 1801239–1801330. doi:10.1002/adom.201801239
Brites, C. D. S., Lima, P. P., Silva, N. J. O., Millán, A., Amaral, V. S., Palacio, F., et al. (2012). Thermometry at the nanoscale. Nanoscale 4, 4799–4829. doi:10.1039/c2nr30663h
Brites, C. D. S., Martínez, E. D., Urbano, R. R., Rettori, C., and Carlos, L. D. (2019b). Self-calibrated double luminescent thermometers through upconverting nanoparticles. Front. Chem. 7, 267–310. doi:10.3389/fchem.2019.00267
Brites, C. D. S., Millán, A., and Carlos, L. D. (2016). “Lanthanides in luminescent thermometry,” in Handbook on the physics and Chemistry of rare earths. Editors J-C. Bünzli, and V. K. Pecharsky (Netherland: Elsevier, B.V), 339–427. doi:10.1016/bs.hpcre.2016.03.005
Caixeta, F. J., Bastos, A. R. N., Botas, A. M. P., Rosa, L. S., Souza, V. S., Borges, F. H., et al. (2020). High-quantum-yield upconverting Er3+/Yb3+-organic-inorganic hybrid dual coatings for real-time temperature sensing and photothermal conversion. J. Phys. Chem. C 124, 19892–19903. doi:10.1021/acs.jpcc.0c03874
Carrasco, E., Del Rosal, B., Sanz-Rodríguez, F., De La Fuente, Á. J., Gonzalez, P. H., Rocha, U., et al. (2015). Intratumoral thermal reading during photo-thermal therapy by multifunctional fluorescent nanoparticles. Adv. Funct. Mat. 25, 615–626. doi:10.1002/adfm.201403653
Chen, X., Jin, L., Kong, W., Sun, T., Zhang, W., Liu, X., et al. (2016). Confining energy migration in upconversion nanoparticles towards deep ultraviolet lasing. Nat. Commun. 7, 10304. doi:10.1038/ncomms10304
Cho, Y., Song, S. W., Lim, S. Y., Kim, J. H., Park, C. R., and Kim, H. M. (2017). Spectral evidence for multi-pathway contribution to the upconversion pathway in NaYF4:Yb3+, Er3+ phosphors. Phys. Chem. Chem. Phys. 19, 7326–7332. doi:10.1039/c7cp00048k
Dantelle, G., Reita, V., and Delacour, C. (2021). Luminescent Yb3+, Er3+-doped α-La(IO3)3 nanocrystals for neuronal network bio-imaging and nanothermometry. Nanomaterials 11, 479. doi:10.3390/nano11020479
Debasu, M. L., Oliveira, H., Rocha, J., and Carlos, L. D. (2020). Colloidal (Gd0.98Nd0.02)2O3 nanothermometers operating in a cell culture medium within the first and second biological windows. J. Rare Earths 38, 483–491. doi:10.1016/j.jre.2019.12.011
Di, X., Wang, D., Zhou, J., Zhang, L., Stenzel, M. H., Su, Q. P., et al. (2021). Quantitatively monitoring iIn-situ mitochondrial thermal dynamics by upconversion nanoparticles. Nano Lett. 21, 1651–1658. doi:10.1021/acs.nanolett.0c04281
Dos Santos, L. F., Martins, J. C., Lima, K. O., Gomes, L. F. T., De Melo, M. T., Tedesco, A. C., et al. (2022). In-vitro assays and nanothermometry studies of infrared-to-visible upconversion of nanocrystalline Er3+, Yb3+ co-doped Y2O3 nanoparticles for theranostic applications. Phys. B Condens. Matter 624, 413447. doi:10.1016/j.physb.2021.413447
Dramicanin, M. (2018). Luminescence thermometry: methods, materials, and applications. Sawston: Woodhead Publishing.
FDA (2020). Medical lasers - laws, regulations & performance standards. Radiation-Emitting Prod. Proced. Available at: https://www.fda.gov/radiation-emitting-products/surgical-and-therapeutic-products/medical-lasers#lrps.
Freitas, L. F. de, and Hamblin, M. R. (2016). Proposed mechanisms of photobiomodulation or low-level light therapy. IEEE J. Sel. Top. Quantum Electron. 22, 348–364. doi:10.1109/JSTQE.2016.2561201
Jaque, D., Martínez Maestro, L., Del Rosal, B., Haro-Gonzalez, P., Benayas, A., Plaza, J. L., et al. (2014). Nanoparticles for photothermal therapies. Nanoscale 6, 9494–9530. doi:10.1039/c4nr00708e
Jaque, D., and Vetrone, F. (2012). Luminescence nanothermometry. Nanoscale 4, 4301–4326. doi:10.1039/c2nr30764b
Kim, J. S., Lee, S. K., Doh, H., Kim, M. Y., and Kim, D. K. (2021). Real-time tracking of highly luminescent mesoporous silica particles modified with europium β-diketone chelates in living cells. Nanomaterials 11, 343–416. doi:10.3390/nano11020343
Kraft, M., Würth, C., Muhr, V., Hirsch, T., and Resch-Genger, U. (2018). Particle-size-dependent upconversion luminescence of NaYF4: Yb, Er nanoparticles in organic solvents and water at different excitation power densities. Nano Res. 11, 6360–6374. doi:10.1007/s12274-018-2159-9
Marciniak, L., Szalkowski, M., Bednarkiewicz, A., and Elzbieciak-Piecka, K. (2022). A Cr3+ luminescence-based ratiometric optical laser power meter. J. Mat. Chem. C 10, 11040–11047. doi:10.1039/D2TC02348B
Martínez, E. D., Brites, C. D. S., Carlos, L. D., García-Flores, A. F., Urbano, R. R., and Rettori, C. (2019). Electrochromic switch devices mixing small- and large-sized upconverting nanocrystals. Adv. Funct. Mat. 29, 1807758–1807812. doi:10.1002/adfm.201807758
Martins, J. C., Bastos, A. R. N., Ferreira, R. A. S., Wang, X., Chen, G., and Carlos, L. D. (2021). Primary luminescent nanothermometers for temperature measurements reliability assessment. Adv. Photonics Res. 2, 2000169. doi:10.1002/adpr.202000169
Maturi, F. E., Brites, C. D. S., Silva, R. R., Nigoghossian, K., Wilson, D., Ferreira, R. A. S., et al. (2021). Sustainable smart tags with two‐step verification for anticounterfeiting triggered by the photothermal response of upconverting nanoparticles. Adv. Photonics Res. 3, 2100227. doi:10.1002/adpr.202100227
Mooney, J., and Kambhampati, P. (2013). Get the basics right: Jacobian conversion of wavelength and energy scales for quantitative analysis of emission spectra. J. Phys. Chem. Lett. 4, 3316–3318. doi:10.1021/jz401508t
Pini, F., Francés-Soriano, L., Peruffo, N., Barbon, A., Hildebrandt, N., and Natile, M. M. (2022). Spatial and temporal resolution of luminescence quenching in small upconversion nanocrystals. ACS Appl. Mat. Interfaces 14, 11883–11894. doi:10.1021/acsami.1c23498
Piñol, R., Zeler, J., Brites, C. D. S., Gu, Y., Téllez, P., Carneiro Neto, A. N., et al. (2020). Real-time intracellular temperature imaging using lanthanide-bearing polymeric micelles. Nano Lett. 20, 6466–6472. doi:10.1021/acs.nanolett.0c02163
Ramalho, J. F. C. B., Dias, L. M. S., Fu, L., Botas, A. M. P., Carlos, L. D., Carneiro Neto, A. N., et al. (2021). Customized luminescent multiplexed quick‐response codes as reliable temperature mobile optical sensors for eHealth and internet of things. Adv. Photonics Res. 3, 2100206. doi:10.1002/adpr.202100206
Renero-Lecuna, C., Martín-Rodríguez, R., Valiente, R., González, J., Rodríguez, F., Krämer, K. W., et al. (2011). Origin of the high upconversion green luminescence efficiency in β-NaYF4: 2%Er3+, 20%Yb3+. Chem. Mat. 23, 3442–3448. doi:10.1021/cm2004227
Rühl, P., Wang, D., Garwe, F., Müller, R., Haase, M., Krämer, K. W., et al. (2021). Notes on thermometric artefacts by Er3+ luminescence band interference. J. Lumin. 232, 117860–117921. doi:10.1016/j.jlumin.2020.117860
Shen, Y., Santos, H. D. A., Ximendes, E. C., Lifante, J., Sanz-Portilla, A., Monge, L., et al. (2020). Ag2S nanoheaters with multiparameter sensing for reliable thermal feedback during in vivo tumor therapy. Adv. Funct. Mat. 30, 2002730–2002813. doi:10.1002/adfm.202002730
Shi, R., Brites, C. D. S., and Carlos, L. D. (2022). Understanding the shell passivation in ln3+-doped luminescent nanocrystals. Small Struct. 3, 2100194. doi:10.1002/sstr.202100194
Skripka, A., Benayas, A., Brites, C. D. S., Martín, I. R., Carlos, L. D., and Vetrone, F. (2020). Inert shell effect on the quantum yield of neodymium-doped near-infrared nanoparticles: The necessary shield in an aqueous dispersion. Nano Lett. 20, 7648–7654. doi:10.1021/acs.nanolett.0c03187
Van Swieten, T. P., Meijerink, A., and Rabouw, F. T. (2022). Impact of noise and background on measurement uncertainties in luminescence thermometry. ACS Photonics 9, 1366–1374. doi:10.1021/acsphotonics.2c00039
Van Swieten, T. P., Van Omme, T., Van Den Heuvel, D. J., Vonk, S. J. W., Spruit, R. G., Meirer, F., et al. (2021). Mapping elevated temperatures with a micrometer resolution using the luminescence of chemically stable upconversion nanoparticles. ACS Appl. Nano Mat. 4, 4208–4215. doi:10.1021/acsanm.1c00657
Vetrone, F., Naccache, R., Zamarrón, A., De La Fuente, A. J., Sanz-Rodríguez, F., Maestro, L. M., et al. (2010). Temperature sensing using fluorescent nanothermometers. ACS Nano 4, 3254–3258. doi:10.1021/nn100244a
Wang, J., and Dong, J. (2020). Optical waveguides and integrated optical devices for medical diagnosis, health monitoring and light therapies. Sensors 20, 3981. doi:10.3390/s20143981
Wang, Y. (2019). The role of an inert shell in improving energy utilization in lanthanide-doped upconversion nanoparticles. Nanoscale 11, 10852–10858. doi:10.1039/C9NR03205C
Xia, X., Volpi, A., Roh, J. Y. D., De Siena, M. C., Gamelin, D. R., Hehlen, M. P., et al. (2021). The impact of 2H9/2 → 4I13/2 emission from Er3+ ions on ratiometric optical temperature sensing with Yb3+/Er3+ Co-doped upconversion materials. J. Lumin. 236, 118006. doi:10.1016/j.jlumin.2021.118006
Yang, T. D., Park, K., Kim, H.-J., Im, N.-R., Kim, B., Kim, T., et al. (2017). In-vivo photothermal treatment with real-time monitoring by optical fiber-needle array. Biomed. Opt. Express 8, 3482. doi:10.1364/boe.8.003482
Yuan, M., Wang, R., Zhang, C., Yang, Z., Cui, W., Yang, X., et al. (2018). Exploiting the silent upconversion emissions from a single β-NaYF4:Yb/Er microcrystal via saturated excitation. J. Mat. Chem. C 6, 10226–10232. doi:10.1039/c8tc02193g
Yuan, M., Wang, R., Zhang, C., Yang, Z., Yang, X., Han, K., et al. (2019). Revisiting the enhanced red upconversion emission from a single β-NaYF4:Yb/Er microcrystal by doping with Mn2+ ions. Nanoscale Res. Lett. 14, 103. doi:10.1186/s11671-019-2931-0
Zhou, J., Liu, Q., Feng, W., Sun, Y., and Li, F. (2015). Upconversion luminescent materials: Advances and applications. Chem. Rev. 115, 395–465. doi:10.1021/cr400478f
Zhou, S., Deng, K., Wei, X., Jiang, G., Duan, C., Chen, Y., et al. (2013). Upconversion luminescence of NaYF4: Yb3+, Er3+ for temperature sensing. Opt. Commun. 291, 138–142. doi:10.1016/j.optcom.2012.11.005
Zhu, X., Feng, W., Chang, J., Tan, Y. W., Li, J., Chen, M., et al. (2016). Temperature-feedback upconversion nanocomposite for accurate photothermal therapy at facile temperature. Nat. Commun. 7, 10437. doi:10.1038/ncomms10437
Zhu, X., Li, J., Qiu, X., Liu, Y., Feng, W., and Li, F. (2018). Upconversion nanocomposite for programming combination cancer therapy by precise control of microscopic temperature. Nat. Commun. 9, 2176. doi:10.1038/s41467-018-04571-4
Keywords: lanthanides (III), upconversion nanoparticles (UCNPs), luminescent nanothermometer, NIR radiation sensor, bioimaging
Citation: Martins JC, Skripka A, Brites CDS, Benayas A, Ferreira RAS, Vetrone F and Carlos LD (2022) Upconverting nanoparticles as primary thermometers and power sensors. Front. Photonics 3:1037473. doi: 10.3389/fphot.2022.1037473
Received: 05 September 2022; Accepted: 18 October 2022;
Published: 31 October 2022.
Edited by:
Liang Zhou, Changchun Institute of Applied Chemistry (CAS), ChinaCopyright © 2022 Martins, Skripka, Brites, Benayas, Ferreira, Vetrone and Carlos. This is an open-access article distributed under the terms of the Creative Commons Attribution License (CC BY). The use, distribution or reproduction in other forums is permitted, provided the original author(s) and the copyright owner(s) are credited and that the original publication in this journal is cited, in accordance with accepted academic practice. No use, distribution or reproduction is permitted which does not comply with these terms.
*Correspondence: Luís D. Carlos, bGNhcmxvc0B1YS5wdA==
Disclaimer: All claims expressed in this article are solely those of the authors and do not necessarily represent those of their affiliated organizations, or those of the publisher, the editors and the reviewers. Any product that may be evaluated in this article or claim that may be made by its manufacturer is not guaranteed or endorsed by the publisher.
Research integrity at Frontiers
Learn more about the work of our research integrity team to safeguard the quality of each article we publish.