 Justina Bonaventura1
 Kellys Morara2
 Rhea Carlson2Courtney Comrie2Noelle Daigle1Elizabeth Hutchinson2
 Travis W. Sawyer1,2,3*
- 1Wyant College of Optical Sciences, University of Arizona, Tucson, AZ, United States
- 2Department of Biomedical Engineering, University of Arizona, Tucson, AZ, United States
- 3College of Medicine, University of Arizona, Tucson, AZ, United States
Understanding microscale physiology and microstructural cellular features of the brain is key to understanding mechanisms of neurodegenerative diseases and injury, as well as prominent changes undergone in development and aging. Non-invasive imaging modalities sensitive to the microscale, especially diffusion magnetic resonance imaging (dMRI), are promising for mapping of cellular microstructure of brain tissues; however, there is a need for robust validation techniques to verify and improve the biological accuracy of information derived. Recent advances in dMRI have moved toward probing of the more complex grey matter architecture, challenging current validation techniques, which are largely based on ex vivo staining and microscopy focusing on white matter. Polarized light imaging (PLI) has been shown to be successful for high resolution, direct, microstructural imaging and has been applied to dMRI validation with clear advantages over staining and microscopy techniques. Conventionally, PLI is applied to thin, sectioned samples in transmission mode, but PLI has also been extended to operate in reflectance mode to bridge the gap toward in vivo measurements of the brain. In this report we investigate the use of backscattering Mueller Matrix polarimetry to characterize the microstructural content of intact ferret brain specimens. The results show that backscattering polarimetry can probe white matter fiber coherence and fiber orientation, and show promise for probing grey matter microstructure. Ultimately, this motivates further study to fully understand how best to implement backscattering polarimetry for in vivo microstructural imaging of the brain.
Introduction
Developing methods to probe microscale physiology and microstructural cellular features within the brain is a rich topic of research both in the context of clinical care and neuroscientific studies. Understanding structure-function relationships in the human brain is critical both to understanding normal brain development and function, and also to elucidate the mechanisms of disorders and diseases that alter brain physiology, for example neurodegenerative diseases such as Alzheimer’s and Parkinson’s disease (Lamptey et al., 2022). Additionally there has been motivation to improve brain imaging which can be done in-vivo for the purpose of intra-operative imaging for brain tumor resection (Rodríguez-Núñez et al., 2021b; Jain et al., 2021).
Advances in neuroimaging technologies have enabled a wide range of research studies to explore changes in the brain structure. In particular, the last two decades have seen an explosion of studies using Magnetic Resonance Imaging (MRI), which enables in vivo, depth-resolved, and minimally invasive 3D visualization of structural and functional properties of the brain (Wang et al., 2021; Forouzannezhad et al., 2019). Diffusion MRI (dMRI) techniques, such as diffusion tensor imaging, are a subset of MRI that generate contrast using the diffusion of water molecules (Novikov et al., 2019). dMRI can be used to create exquisite maps of spatial organization and connectivity of white matter, as the cell structure of axons limits molecular movement perpendicular to the axonal fibers, giving rise to anisotropic diffusion (Le Bihan, 2014). While dMRI has become the modality of choice for investigating the neural architecture, one limitation is a lack of sufficient specificity to directly measure microstructural and molecular quantities, instead relying heavily on biophysical modeling or indirect inference; as a result, validation of the “biological accuracy” of dMRI estimates is essential for advancing the technology. Additionally, while MRIs have been shown to be useful as a surgical guide they can be difficult to follow, and costly and time consuming to apply mid surgery leaving the desire for additional in vivo brain imaging methods (Rodríguez-Núñez et al., 2021a; Schucht et al., 2020).
There are a wide range of optical methods which have been shown useful in brain imaging, particularly in the realm of fiber tract visualization. The traditional method of histological sectioning and staining is limited by stain specificity, tissue processing and sectioning artifacts, and a lack of quantitative metrics. Tissue clearing methods like CLARITY (Chung et al., 2013) paired with confocal or multiphoton fluorescence microscopy have been used for imaging biomedical content without the need for sectioning. Alternatively optical coherence tomography (OCT) (Magnain et al., 2019), or polarization sensitive OCT (Jones et al., 2021) can be used to image depth resolved tissue using back scattered light-interferometry at high resolution typically on the order of 1–20μm. Electron microscopy has been used for nanometer scale resolution of fine anatomical structural features (Kasthuri et al., 2015) but is limited to fixed sectioned ex vivo tissue samples. While all of these methods have their own advantages common issues that arise are sectioning artifacts and registration, tissue deformation and time needed for scanning large brain sections (Yendiki et al., 2022).
Polarized light imaging (PLI) is a popular technique used for probing physiological structures in the brain with high spatial resolution, which has shown great promise for brain imaging and dMRI validation (Mehta et al., 2013). PLI is generally capable of higher resolution imaging than MRI, for example the system used in this study has a spatial resolution on the order of 10μm, which while still a bit larger than most axons with a scale of 1–3μm is much closer than that of dMRI which is on the order of hundreds of microns (Hutchinson et al., 2017; Saito et al., 2019; Grisot et al., 2021). In particular, the myelin sheath surrounding neurons is strongly birefringent (Morgan et al., 2021), which will cause a phase delay in polarized light along the axis as the neuronal fibers. Traditionally, PLI is conducted by transmitting light of a specific polarization through a thin (on the order of 100 microns) slice of fixed tissue. The polarized light will interact with the cellular and sub-cellular structures, altering the polarization state, which is then measured by analyzing the transmitted light with a polarizer and camera detector. Rotating the analyzing polarizer in discrete increments and measuring the resulting transmitted power enables the estimation of the magnitude birefringence (also called “retardance”) and the orientation of the underlying structures (the “retardance angle”) (Larsen et al., 2007). While valuable for mapping out fiber orientation, this approach is limited to thin, fixed, and sectioned samples. Moreover, retardance and retardance angle are only two of many different polarization properties that could encode valuable information about the underlying tissue microstructure (Ghosh et al., 2008; Ghosh et al., 2009).
Backscattering PLI, in particular methods based on Mueller Matrix or Stokes polarimetry is emerging as a valuable technique for comprehensive polarization characterization of brain tissue specimens (Rodríguez-Núñez et al., 2021b; Jain et al., 2021). Multiple approaches exist for Mueller Matrix polarimetry, but in general, an optical system is constructed to cycle through different input polarization states and sample different output polarization states (Qi and Elson, 2017). The collected data can then be used to reconstruct the Mueller Matrix, which provides a complete picture of the polarization properties of the material. The Mueller Matrix can be further decomposed into individual elements such as the linear retardance, diattenuation and circular polarization (Ghosh and Vitkin, 2011). Some recent works have shown that multi-wavelength Stokes polarimetry has great promise for brain microstructural mapping (Menzel et al., 2015; Borovkova et al., 2022), and other groups have begun to explore full brain samples and Mueller Matrix polarimetry for brain imaging (Rodríguez-Núñez et al., 2021a; Jain et al., 2021). However, there remains a need to continue to advance this technology toward in vivo acquisition, by demonstrating the utility of the technique on intact whole brain specimens and assessing the suitability for different animal models and specific brain microstructures. Extension of PLI techniques to reflectance-mode imaging could reduce the reliance on ex vivo tissue processing for validation, and opens the door to potential in-vivo measurements. Realistically the penetration depth of light into adult human brain tissue has been found to be limited to values around 0.5 mm for blue light and 1.5 mm for red light (Svaasand and Ellingsen, 1983) which limits the sensitivity of structures which can be probed, however there is valuable information to be gleaned through imaging surface level brain structure through window chambers (in animal model research studies) or intra-operative imaging.
In this brief research report, we present a preliminary study to test the feasibility of multi-wavelength backscattering Mueller Matrix polarization microscopy for microstructural characterization of whole brain specimens in reflectance mode. For three specimens of ferret brain, we measure three different regions of the brain with known microstructural geometry: two composed of coherent white matter, and one composed of grey matter. The ferret brain is of particular interest in this case because of the folded cortex which is similar to the human brain and relatively high white matter volume for animals of its size. Robust animal models of this type are of value because they offer an avenue for understanding and quantification of the physiology and pathophysiology of the brain as well as areas of the brain most important to therapeutic treatments for disorder in humans (Hutchinson et al., 2017). We demonstrate that the technology is sensitive to orientation and fiber coherence in white matter, and shows promise for measuring grey matter microstructure. These results motivate further study of backscattering Mueller Matrix polarimetry in the context of in vivo characterization of brain microstructure, particularly for grey matter regions.
Materials and methods
Specimen preparation
Perfusion-fixed ferret brain specimens (n = 3) were generated in a previous unrelated study and provided for whole brain imaging in this study (Hutchinson et al., 2017). All animals were treated in accord with the guidelines of the Uniformed Services University of the Health Sciences and the National Institutes of Health’s Guide for the Care and Use of Laboratory Animals and all procedures were approved by the University Institutional Animal Care and Use Committee. Briefly, adult male ferrets, all 5–10 months old, underwent perfusion fixation with 4% paraformaldehyde (PFA). The brains were removed and post-fixed in 4% PFA for 10 days and then transferred for re-hydration and long-term storage where they were held for 2–4 years under refrigeration in phosphate buffered saline with 0.01% sodium azide which prevents degradation over time.
Polarization imaging
For fixed brain specimens (Figure 1A), images were collected for three regions with known physiological and microstructural characteristics using a benchtop multispectral polarization microscope. Images were acquired of the corticospinal tract (CST), the optic chiasm (OC) and the cerebellum. These regions were selected due to their well known microstructural orientation. The corticospinal tract is a one-directional white matter fiber bundle along the direction of the spinal tract; the optic chiasm is composed of two, crossing white matter fiber bundles; and the cerebellum is a region of grey matter, with parallel fibers located beneath the surface layer. Thus, these three regions provide increasing complexity to examine the capabilities of the polarization imaging technology.
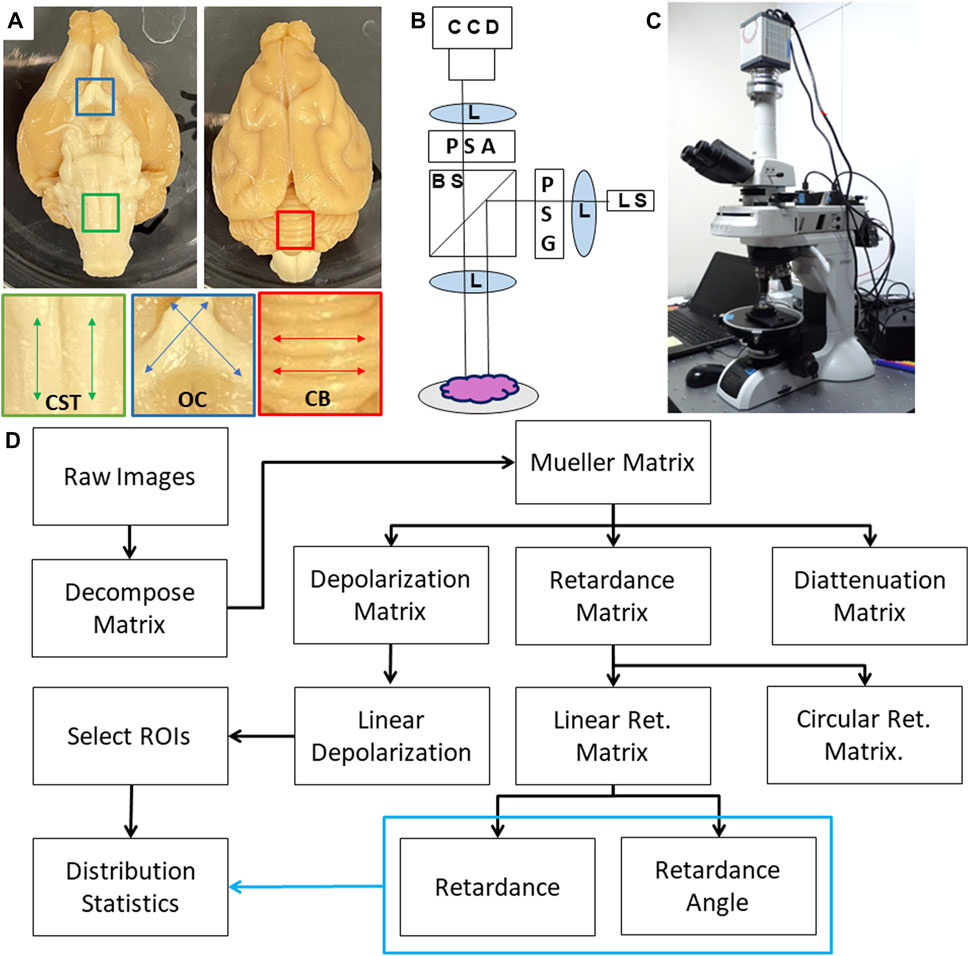
FIGURE 1. (A) Photograph of Ferret brain specimen along with regions of interest including corticospinal tract (CST); optic chiasm (OC) and cerebellum (CB). (B) Schematic diagram of the PLI system where light is emitted from a multi-wavelength light source (LS) which passes through a lens (L) and polarization state generator (PSG) before being directed to the sample through a beamsplitter (BS) and imaging lens. Backscattered light is collected and directed through a polarization state analyzer (PSA) before being focused onto a CCD camera. (C) Photograph of the polarimetry system. (D) Flow chart of data analysis including Mueller Matrix decomposition and calculation of distribution statistics.
The polarization microscope is a custom instrument developed by Nikon (Saito et al., 2019), which consists of an episodic illumination system capable of dark-field illumination in five wavelengths and a polarimetric imaging system for measuring the state of polarization of scattered light from the tissue sample positioned at the microscope’s specimen stage (Figures 1B,C). A Nikon bright-field objective lens with minimal polarization distortion (Nikon XFI TU Plan Fluor EPI) was used to operate within the epi-illumination and dark-field imaging constraints of this polarimeter. 5× magnification was used to capture all images due to its larger field of view and depth of field. The polarimeter uses a pair of Savart plates to measure the four Stokes parameters simultaneously in encoded interference fringes (Saito et al., 2019; Oka and Saito, 2006). In concurrent software, also developed for the system by Nikon, a data reduction algorithm is applied which constructs a measurement matrix based on the illumination and detection polarization states and multiplies the pseudoinverse of that with the measured data to find the least-squares optimized Mueller Matrix of the sample (Chipman, 1994), and a series of calibrations are completed to remove artifacts from the illumination and imaging optics (Saito et al., 2019). The instrument which has been previously characterized, validated, and used for human tissue imaging, produces spatial pixel-wise mappings of the sixteen Mueller Matrix components (Fujii et al., 2019; Saito et al., 2019). Exposure times were optimized using the instrument’s “auto-adjust” setting.
Image processing and analysis
Wavelengths where the Mueller Matrix was unsuccessfully reconstructed were excluded from analysis. Incomplete reconstruction can be caused by tissue-dependent saturation, numerical instability, or other sources of noise. Ultimately, the 405 and 442 nm were analyzed for the CST, all wavelengths except 442 nm were analyzed for the OC and all five wavelengths were analyzed for the cerebellum. The raw Mueller Matrix maps were decomposed using the Lu-Chipman decomposition to extract polarization parameters including retardance, and retardance angle (Figure 1D) (Lu and Chipman, 1996). For retardance angle, the laboratory reference frame was such that zero degrees was aligned with the vertical axis in the images. A positive angle was measured as clockwise from this axis.
In order to quantify specific tissues of interest, for each region that was imaged a sample-specific region of interest (ROI) was selected using ImageJ with the depolarization image as a reference (Rasband, 2012). Each region of interest was saved as a separate binary mask. For the CST, an ROI was selected for the spinal tract and the surrounding background region (known as the olivary complex, which lacks significant white matter directionality); for the OC, an ROI was selected for each of the two, crossing, coherent white matter bundles (referred to as left and right lobes), and for the cerebellum, a single ROI was selected for a region of the surface with minimal curvature.
Pixel-wise distributions of retardance and retardance angle were generated to quantitatively assess these polarization characteristics of each ROI. For the CST, the total retardance was compared between the CST and background by taking the mean value of the distribution for each sample and averaging across the collected samples. We characterize the distributions of the retardance and retardance angle by measuring the mean, standard deviation, and kurtosis and taking the ratio of the CST to the background. For the OC, we compare the mean retardance of the distributions, as well as the difference in mean retardance angle between the different samples. For the cerebellum, we quantify the mean, standard deviation, and kurtosis of the retardance and retardance angle distributions as a function of wavelength.
Statistical analysis
Statistical analysis of the quantitative comparisons for retardance and retardance angle for CST and OC was done using a paired t-test, as each sample had two comparable regions of interest. The cerebellum only had one region of interest and therefore no statistical comparisons were conducted. For the OC, we also extracted a radial slice and examined the retardance angle along this slice. This was done to examine the response of the imaging technique in a region of crossing fibers. To determine if the response is produced as an averaging of the microstructure or responding to the dominant orientation, we fit the resulting data along the slice to a linear curve. If backscattering PLI is sensitive to the averaging of the microstructure, the retardance angle would manifest as a linear gradient across the crossing fiber region; alternatively, sensitivity to the dominant microstructure would manifest as a step-function between the two crossing fiber directions. To test the linearity of this relationship, we conduct a hypothesis test with a null hypothesis that the slope is zero by using a Wald Test with t-distribution of the test statistic.
Results
Corticospinal tract
Figure 2 shows the results for measurements of the CST for whole brain specimens. Of the five wavelengths used for imaging, only 405 and 445 nm were unsaturated with the optimized exposure times. Figure 2A is a photograph of the specimen, while Figures 2B,C show the retardance and retardance angle maps for the region of interest showing the CST against the background olivary region (BKG). Quantification of these maps (Figures 2D,E) shows that there is a significant increase in retardance for the CST compared to the background (p
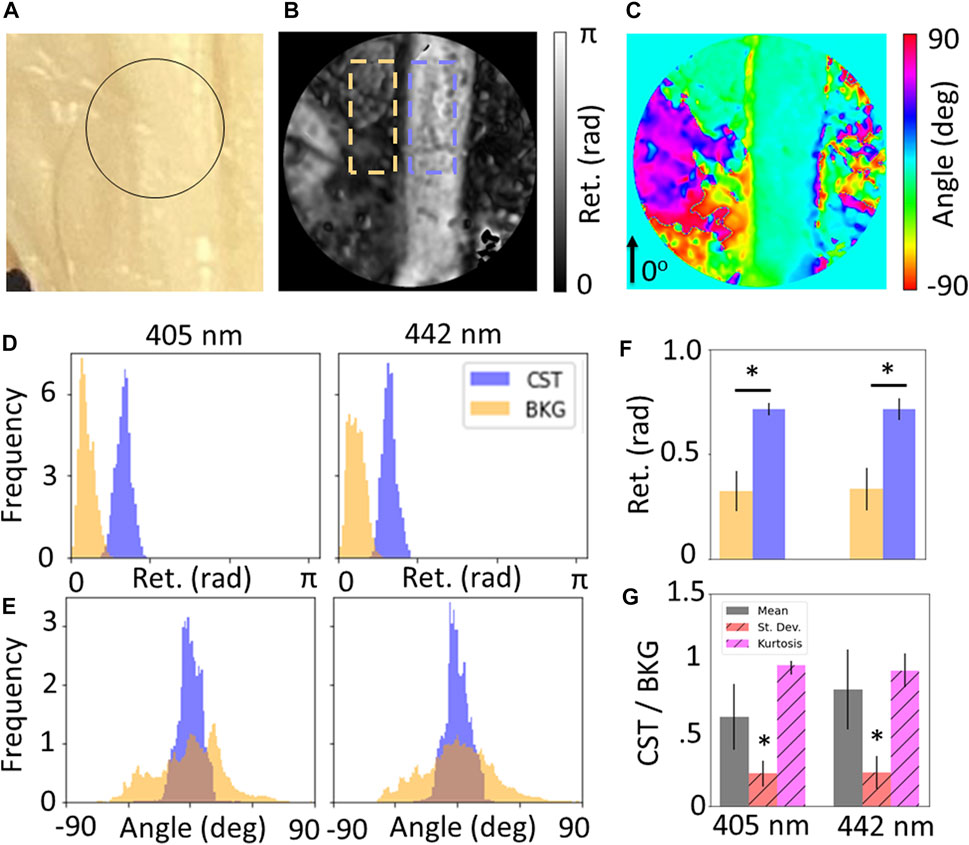
FIGURE 2. (A) Photograph of corticospinal tract (CST), maps of (B) retardance and (C) retardance angle of black circular region of interest shown in (A). Wavelength-resolved (D) retardance and (E) retardance angle distributions for CST compared to background (BKG). (F) Quantification of distribution statistics for retardance shows significance increase for CST compared to background, and (G) relative standard deviation and kurtosis of angle distributions shows significant decrease for CST, showing sensitivity to coherent fibers over unorganized tissue.
Optic chiasm
Figure 3 shows the results for measurements of the OC for whole brain specimens. Only the 442 nm wavelength was excluded due to saturation and unsuccessful reconstruction of the Mueller Matrix. Figure 3A shows a photograph with the ROI outlines, while 3B and 3C show the retardance and retardance angle maps for the region of interest showing the left and right lobes. The retardance angle along the radial slice shown as a black curve in Figure 3C was extracted and the retardance angle was plotted against the radial angle (Figure 3D), which was found to have a linear slope (p
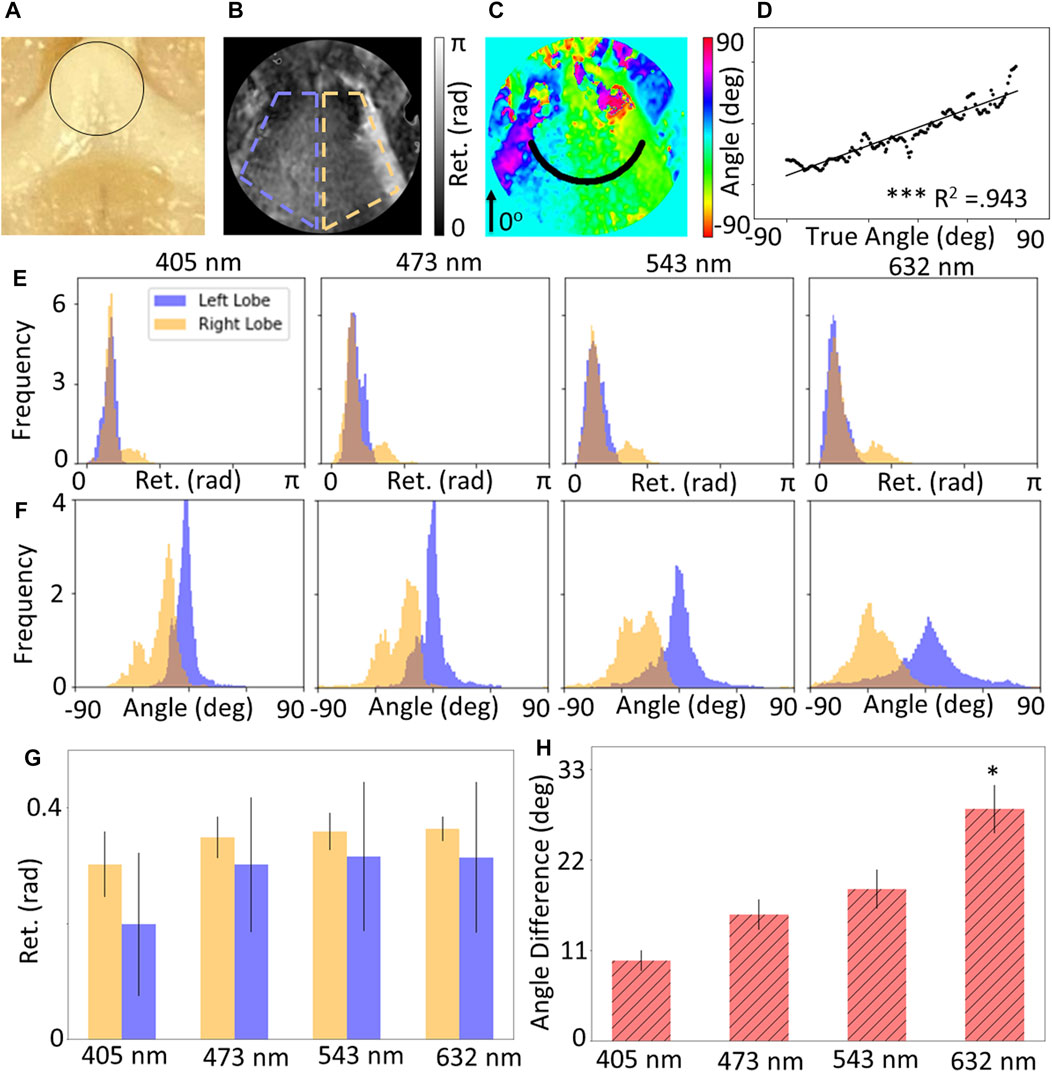
FIGURE 3. (A) Photograph of optic chiasm (OC), maps of (B) retardance and (C) retardance angle of black circular region of interest shown in (A). (D) Circular slice of retardance angle along black line shown in (C), which shows a statistically significant linear relationship with radial angle. Wavelength-resolved (E) retardance and (F) retardance angle distributions for CST compared to background (BKG). (G) Quantification of mean retardance shows no significant difference for both lobes, and (H) the mean retardance angle for both lobes increases with wavelength.
It is worth noting that this finding is not fully consistent with prior work using polarized light imaging on the optic chiasm done by Axer et al. (2016) who found the fiber orientation characteristics to be a patchwork combination of the features of the region for hooded seal and human samples. The disparity in these results could be due to several factors. The architecture of the imaging systems is significantly different in that our study operates in reflectance mode using a Savart plate design, whereas Axer et al. (2016) was in transmission of thin samples. The back-scattering bulk tissue imaging done in this study may create more scattering events and result in an averaging effect in those regions. Furthermore, the animal model in both studies differs—Axer et al. (2016) imaged the chiasm from a hooded seal where our Ferret model may have physiological differences. It would be valuable to conduct a study with identical samples using both imaging methods to assess how the hardware and software differences may influence the collected data.
Distributions of the retardance and retardance angle for the ROIs (Figures 3E,F) show that the retardance of both lobes is approximately equal, which is expected given that both lobes are composed of white matter. However, the retardance angle distributions indicate that the difference in retardance angle becomes more prominent at higher wavelengths. This may be due to the higher penetration depth of longer wavelengths, enabling more sensitive measurements. Figures 3G,H show the quantification of these distributions, which support the qualitative observations; where there is no significant difference in retardance across all wavelengths, but there is a statistically significant difference in the angle of the two lobes at a wavelength of 632 nm (p
Cerebellum
Figure 4 shows the results for the measurements of the cerebellum. Figure 4A is a photograph of the specimen, with Figure 4B demonstrating the expected underlying microstructural content of parallel fiber, which runs along the length of the ridges. Figures 4C,D show maps of the retardance and retardance angle, respectively. Distributions of the retardance and retardance angle for the ROI (Figures 4E,F) seem to suggest that the retardance is relatively constant across the tissue, but decreases with higher wavelength. Conversely, the retardance angle seems to increase but become less tightly distributed. Quantification of the characteristics of these distributions through mean, standard deviation and kurtosis (Figures 4G,H) shows consistent observations - the mean retardance decreases with increasing wavelength and mean retardance angle increases with increasing wavelength. Given that the ridges are not oriented horizontally, we would expect a nonzero retardance angle if the measurements are sensitive to the underlying parallel fibers. These results seem to suggest that higher wavelengths may be more sensitive to the underlying microstructure, which could be due to the higher penetration depth. A further consideration regarding penetration depth is that an additional orientation feature may arise due to the climbing fibers that reach beneath the molecular layer of the cerebellum (Figure 4B). The climbing fibers are orthogonal to the brain surface which one would expect to reduce measurable birefringence in those regions due to the imaging plane being perpendicular. However due to the curvature of the cerebellum, the climbing fibers may not be fully orthogonal to the reference frame of the microscope. Additionally it is possible that the collected signal is attenuated due to a small depth of focus or an abundance of scattering such that the reconstruction is not accurate, which could introduce inaccuracies into the retardance data. Other groups have mitigated this by applying a depolarization threshold over which the data in that region is considered too affected by scattering and not regarded as accurate, while not applied in this case this remains an avenue for future study and data processing (Rodríguez-Núñez et al., 2021a).
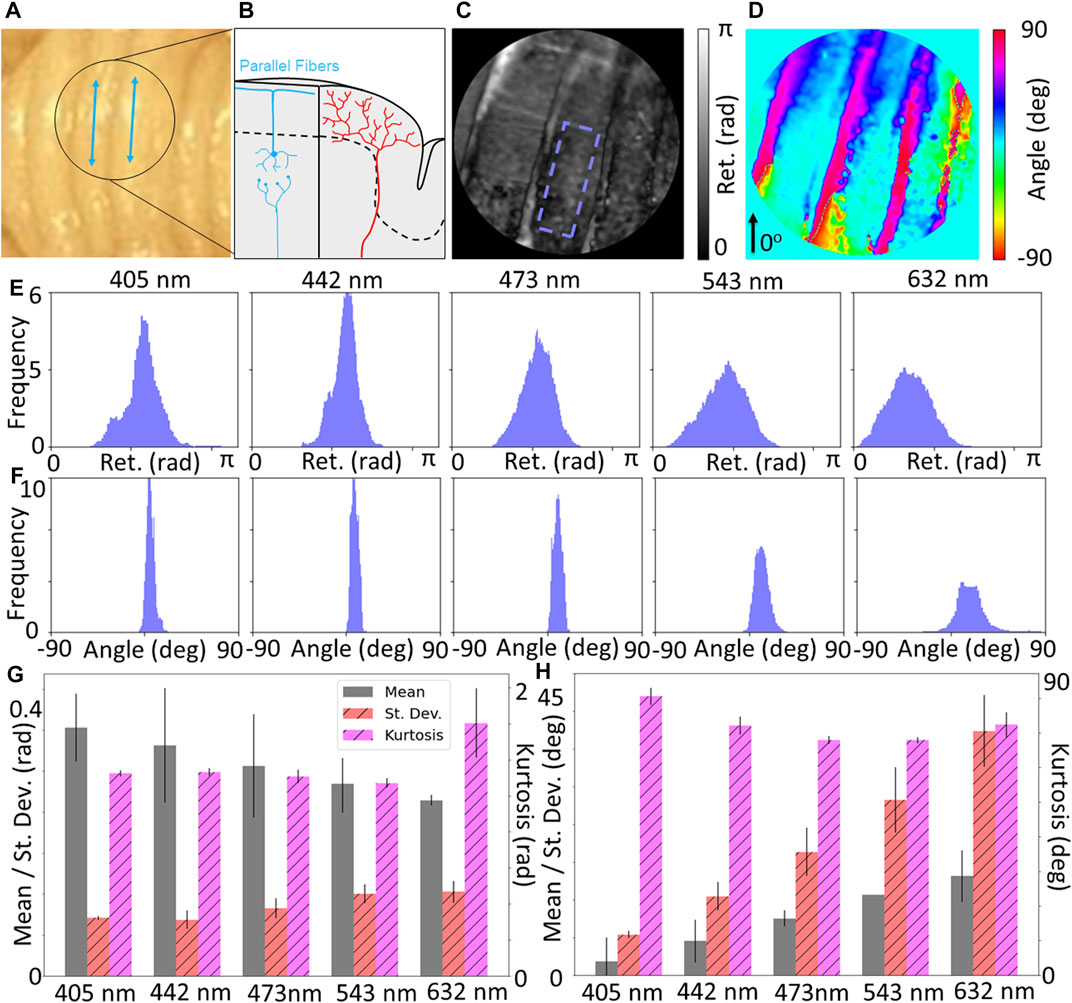
FIGURE 4. (A) Photograph of cerebellum, along with (B) diagram showing expected physiological structure of the grey matter where parallel fibers run along the length of the grooves, denoted by blue lines in (A). Maps of (C) retardance and (D) retardance angle of black circular region of interest shown in (A). Wavelength-resolved (E) retardance and (F) retardance angle distributions for ROI with minimal curvature. (G) Quantification of distributions statistics for retardance shows a decrease of the mean with increasing wavelength, and (H) retardance angle shows an increase of the mean with increasing wavelength, suggesting increased depth penetration of longer wavelengths may be more sensitive to parallel fiber structures.
Discussion
Our preliminary results suggest that backscattering Mueller Matrix polarimetry could be a promising technique for noninvasive mapping of microstructural orientation features in the brain. We show that we are able to obtain measurements of fiber coherence and density (retardance), as well as fiber orientation (retardance angle) that are consistent with known microstructural characteristics. One advantage to the Mueller Matrix approach is that the measurement also provides information about other polarization parameters including depolarization, diattenuation, and circular polarization interaction. These properties may also contain valuable information for probing tissue microstructure, which could complement the known markers of retardance and retardance angle. While not looked at in depth in this study, other works have found that depolarization can be used to distinguish between grey and white matter, with potential diagnostic value in the context of brain tumor surgery (Rodríguez-Núñez et al., 2021b; Schucht et al., 2020) Future work will investigate the potential value of other Mueller Matrix parameters in the context of brain imaging.
Our demonstration of this technology is valuable in that it evaluates the potential for in vivo use through the application to intact whole brain specimens in reflectance mode. The advantages of the Savart plate polarimeter are the quick acquisition time and lack of moving parts on the detector end, however Savart plate systems are limited in that they can be prone to image artifacts, for example aliasing effects when imaging outside of a narrow optical bandwidth, these artifacts may lower the resulting image quality; in order to advance this imaging technology toward in vivo use, other potential artifacts arising from this system configuration will need to be investigated in greater detail (Ramella-Roman et al., 2020). In using a commercial system direct control of the Mueller matrix reconstruction is limited, but there are built in controls in place which limit potential artifacts including image quality control checks, exposure time adjustment, and calibrations with reference targets conducted prior to each measurement session to assess repeatability. Other steps necessary to conduct in vivo studies may include, optimizing acquisition times to mitigate motion artifacts. In addition, our study shows preliminary promise for using PLI to measure to grey matter microstructure, for which developing validation techniques is becoming increasing important as dMRI methods continue to advance. Further study is needed to validate the capabilities of this technology for grey matter microstructural assessment and likely hardware and image analysis algorithm optimizations are required to maximize the performance of the technology.
While promising, our results indicate that the selection of wavelength is critical. Wavelength-resolved light-tissue interaction is predominantly dictated by absorption, scattering, and penetration depth (Tuchin, 2003). Primary tissue absorbers are melanin, lipids and water, which give rise to an optical window in the visible spectrum (Smith et al., 2009). Scattering will be influenced by wavelength and particle size but generally is higher for lower wavelengths, leading to decreased penetration depth. Given the heterogeneity of brain tissues, it may be necessary to optimize acquisition wavelength for specific anatomical structures and regions; we see that for the white matter regions such as the corticospinal tract, there is severe oversaturation at higher wavelength compared to the grey matter regions in the cerebellum. Our measurements may suggest that there is some sensitivity of polarized light to grey matter microstructure, as we observed an increased signature of retardance angle from the cerebellum, which is consistent with the angle of parallel fibers. This becomes more pronounced at higher wavelengths, which may be due to the requisite deeper penetration needed for the light to interact with the parallel fiber structures. In addition, the wavelength of light may influence the size of the tissue structures it primarily interacts with, providing more motivation to further understand how wavelength selection can be used as a tool to optimize the acquisition of microstructural information.
As anticipated, measuring non-flat geometries, such as with whole brain specimens, is particularly challenging and may introduce artifacts into the results. While other groups have been able to image non-flat surface geometries with minimal negative effects on their results (Rodríguez-Núñez et al., 2021b; Liu et al., 2022), they used wide field imaging which may have a larger depth of field than the microscopy system used in this study. To account for the limitations of this system, further studies utilizing tissue phantoms will be undertaken to characterize how curved surfaces may influence the acquisition and reconstruction of Mueller Matrix data. The influence of topology may be correctable through calibration and data processing techniques; alternatively, hardware optimization could also be undertaken to increase the depth of field to enable in-focus imaging of samples with significant topological features. With a two-dimensional acquisition, the technology is only sensitive to in-plane orientation; further innovations could be made with the integration of three-dimensional acquisition through sample or hardware tilting, among other approaches (Menzel et al., 2015; Borovkova et al., 2022).
Conclusion
Evaluation of microscale physiology and microstructural cellular features of the brain is becoming increasingly important to understand the mechanisms of neurodegenerative diseases, development and aging. While imaging modalities such as diffusion magnetic resonance imaging (dMRI) are extremely powerful for noninvasive, three-dimensional, microstructural characterization of tissues, there is a need for robust validation techniques to verify the biological accuracy of dMRI imaging data. Additionally there is a need for in vivo surface level measurements such as intra-operative imaging for guided surgery of tumor resections, or window chamber imaging in animals. Polarization imaging is a promising technique for high resolution direct microstructural imaging, but application is typically limited to thin sectioned samples in transmission mode. We have shown that backscattering Mueller Matrix polarimetry in reflectance mode can be used to map microstructural features of intact brain tissue specimens with high biological accuracy. The experimental results show that backscattering polarimetry can probe white matter fiber coherence and fiber orientation in whole brain specimens, and show promise for probing grey matter microstructure. Ultimately, these preliminary results motivate further study to fully understand how backscattering polarimetry can best be used for validation of in vivo microstructural imaging of the brain.
Data availability statement
The data used in this report can be made available on request through the corresponding author.
Ethics statement
The animal study was reviewed and approved by the Uniformed Services University of the Health Sciences and the National Institutes of Health’s Guide for the Care and Use of Laboratory Animals and all procedures were approved by the University Institutional Animal Care and Use Committee.
Author contributions
KM and RC contributed to data collection. JB assisted with data collection and performed image analysis and processing. CC, RC, and EH contributed to specimen preparation. TS and EH contributed to the study design. JB and TS wrote the first draft of the manuscript. ND contributed to data collection and manuscript preparation. All authors contributed to manuscript revision, read and approved the submitted version.
Funding
This work was funded by Wyant College of Optical Sciences Friends of Tucson Optics (FoTO) Endowed Scholarships.
Acknowledgments
We would like to thank the Nikon Corporation and Nikon Research Corporation of America for the use of the polarimeter system, as well as Saito Naooki and Heather Durko for technical guidance. We also would like to thank Faith Rice and Jennifer Barton for assistance with operating the polarimeter.
Conflict of interest
The authors declare that the research was conducted in the absence of any commercial or financial relationships that could be construed as a potential conflict of interest.
Publisher’s note
All claims expressed in this article are solely those of the authors and do not necessarily represent those of their affiliated organizations, or those of the publisher, the editors and the reviewers. Any product that may be evaluated in this article, or claim that may be made by its manufacturer, is not guaranteed or endorsed by the publisher.
References
Axer, M., Strohmer, S., Gräßel, D., Bücker, O., Dohmen, M., Reckfort, J., et al. (2016). Estimating fiber orientation distribution functions in 3D-polarized light imaging. Front. Neuroanat. 10, 40. doi:10.3389/fnana.2016.00040
Borovkova, M., Sieryi, O., Lopushenko, I., Kartashkina, N., Pahnke, J., Bykov, A., et al. (2022). Screening of Alzheimer’s disease with multiwavelength Stokes polarimetry in a mouse model. IEEE Trans. Med. Imaging 41, 977–982. doi:10.1109/TMI.2021.3129700
Chung, K., Wallace, J., Kim, S.-Y., Kalyanasundaram, S., Andalman, A. S., Davidson, T. J., et al. (2013). Structural and molecular interrogation of intact biological systems. Nature 497, 332–337. doi:10.1038/nature12107
Forouzannezhad, P., Abbaspour, A., Fang, C., Cabrerizo, M., Loewenstein, D., Duara, R., et al. (2019). A survey on applications and analysis methods of functional magnetic resonance imaging for Alzheimer’s disease. J. Neurosci. methods 317, 121–140. doi:10.1016/j.jneumeth.2018.12.012
Fujii, T., Yamasaki, Y., Saito, N., Sawada, M., Narita, R., Saito, T., et al. (2019). Polarization characteristics of dark-field microscopic polarimetric images of human colon tissue. Proc. SPIE 10890, 2509000. doi:10.1117/12.2509000
Ghosh, N., and Vitkin, I. A. (2011). Tissue polarimetry: Concepts, challenges, applications, and outlook. J. Biomed. Opt. 16, 110801. doi:10.1117/1.3652896
Ghosh, N., Wood, M. F. G., Li, S.-h., Weisel, R. D., Wilson, B. C., Li, R.-K., et al. (2009). Mueller matrix decomposition for polarized light assessment of biological tissues. J. Biophot. 2, 145–156. doi:10.1002/jbio.200810040
Ghosh, N., Wood, M. F. G., and Vitkin, I. A. (2008). Mueller matrix decomposition for extraction of individual polarization parameters from complex turbid media exhibiting multiple scattering, optical activity, and linear birefringence. J. Biomed. Opt. 13, 044036. doi:10.1117/1.2960934
Grisot, G., Haber, S. N., and Yendiki, A. (2021). Diffusion MRI and anatomic tracing in the same brain reveal common failure modes of tractography. NeuroImage 239, 118300. doi:10.1016/j.neuroimage.2021.118300
Hutchinson, E. B., Schwerin, S. C., Radomski, K. L., Sadeghi, N., Jenkins, J., Komlosh, M. E., et al. (2017). Population based MRI and DTI templates of the adult ferret brain and tools for voxelwise analysis. NeuroImage 152, 575–589. doi:10.1016/j.neuroimage.2017.03.009
Jain, A., Ulrich, L., Jaeger, M., Schucht, P., Frenz, M., and Akarcay, H. G. (2021). Backscattering polarimetric imaging of the human brain to determine the orientation and degree of alignment of nerve fiber bundles. Biomed. Opt. Express 12, 4452–4466. doi:10.1364/BOE.426491
Jones, R., Maffei, C., Augustinack, J., Fischl, B., Wang, H., Bilgic, B., et al. (2021). High-fidelity approximation of grid- and shell-based sampling schemes from undersampled DSI using compressed sensing: Post mortem validation. NeuroImage 244, 118621. doi:10.1016/j.neuroimage.2021.118621
Kasthuri, N., Hayworth, K. J., Berger, D. R., Schalek, R. L., Conchello, J. A., Knowles-Barley, S., et al. (2015). Saturated reconstruction of a volume of neocortex. Cell. 162, 648–661. doi:10.1016/j.cell.2015.06.054
Lamptey, R. N. L., Chaulagain, B., Trivedi, R., Gothwal, A., Layek, B., and Singh, J. (2022). A review of the common neurodegenerative disorders: Current therapeutic approaches and the potential role of nanotherapeutics. Int. J. Mol. Sci. 23, 1851. doi:10.3390/ijms23031851
Larsen, L., Griffin, L. D., Grässel, D., Witte, O. W., and Axer, H. (2007). Polarized light imaging of white matter architecture. Microsc. Res. Tech. 70, 851–863. doi:10.1002/jemt.20488
Le Bihan, D. (2014). Diffusion MRI: What water tells us about the brain. EMBO Mol. Med. 6, 569–573. doi:10.1002/emmm.201404055
Liu, Y.-R., Sun, W.-Z., and Wu, J. (2022). Effect of the samples’ surface with complex microscopic geometry on 3×3 mueller matrix measurement of tissue bulks. Front. Bioeng. Biotechnol. 10, 841298. doi:10.3389/fbioe.2022.841298
Lu, S.-Y., and Chipman, R. A. (1996). Interpretation of Mueller matrices based on polar decomposition. J. Opt. Soc. Am. A 13, 1106. doi:10.1364/JOSAA.13.001106
Magnain, C., Augustinack, J. C., Tirrell, L., Fogarty, M., Frosch, M. P., Boas, D., et al. (2019). Colocalization of neurons in optical coherence microscopy and Nissl-stained histology in Brodmann’s area 32 and area 21. Brain Struct. Funct. 224, 351–362. doi:10.1007/s00429-018-1777-z
Mehta, S. B., Shribak, M., and Oldenbourg, R. (20132010). Polarized light imaging of birefringence and diattenuation at high resolution and high sensitivity. J. Opt. 15, 094007. doi:10.1088/2040-8978/15/9/094007
Menzel, M., Michielsen, K., De Raedt, H., Reckfort, J., Amunts, K., and Axer, M. (2015). A Jones matrix formalism for simulating three-dimensional polarized light imaging of brain tissue. J. R. Soc. Interface 12, 20150734. doi:10.1098/rsif.2015.0734
Morgan, M. L., Brideau, C., Teo, W., Caprariello, A. V., and Stys, P. K. (2021). Label-free assessment of myelin status using birefringence microscopy. J. Neurosci. methods 360, 109226. doi:10.1016/j.jneumeth.2021.109226
Novikov, D. S., Fieremans, E., Jespersen, S. N., and Kiselev, V. G. (2019). Quantifying brain microstructure with diffusion MRI: Theory and parameter estimation. NMR Biomed. 32, e3998. doi:10.1002/nbm.3998
Oka, K., and Saito, N. (2006). Snapshot complete imaging polarimeter using Savart plates. Proc. SPIE. 6295, 683284. doi:10.1117/12.683284
Qi, J., and Elson, D. S. (2017). Mueller polarimetric imaging for surgical and diagnostic applications: A review. J. Biophot. 10, 950–982. doi:10.1002/jbio.201600152
Ramella-Roman, J. C., Saytashev, I., and Piccini, M. (2020). A review of polarization-based imaging technologies for clinical and preclinical applications. J. Opt. 22, 123001. doi:10.1088/2040-8986/abbf8a
Rodríguez-Núñez, O., Schucht, P., Hewer, E., Novikova, T., and Pierangelo, A. (2021a). Polarimetric visualization of healthy brain fiber tracts under adverse conditions: Ex vivo studies. Biomed. Opt. Express 12, 6674–6685. doi:10.1364/BOE.439754
Rodríguez-Núñez, O., Schucht, P., Lee, H. R., Mezouar, M. H., Hewer, E., Raabe, A., et al. (2021b). Retardance map of brain white matter: A potential game changer for the intra-operative navigation during brain tumor surgery. Eur. Conf. Biomed. Opt. 11919, 2614598. doi:10.1117/12.2614598
Saito, N., Sato, K., Fujii, T., Durko, H. L., Goldstein, G. L., Phillips, A. H., et al. (2019). Multispectral Mueller matrix imaging dark-field microscope for biological sample observation. Proc. SPIE 10890, 2508109. doi:10.1117/12.2508109
Schucht, P., Lee, H. R., Mezouar, H. M., Hewer, E., Raabe, A., Murek, M., et al. (2020). Visualization of white matter fiber tracts of brain tissue sections with wide-field imaging mueller polarimetry. IEEE Trans. Med. Imaging 39, 4376–4382. doi:10.1109/TMI.2020.3018439
Smith, A. M., Mancini, M. C., and Nie, S. (2009). Bioimaging: Second window for in vivo imaging. Nat. Nanotechnol. 4, 710–711. doi:10.1038/nnano.2009.326
Svaasand, L. O., and Ellingsen, R. (1983). Optical properties of human brain. Photochem. Photobiol. 38, 293–299. doi:10.1111/j.1751-1097.1983.tb02674.x
Tuchin, V. V. (2003). “Light-tissue interactions,” in Biomedical Photonics handbook (Boca Raton, Florida: CRC Press), 1–27.
Wang, Z., Xin, J., Wang, Z., Yao, Y., Zhao, Y., and Qian, W. (2021). Brain functional network modeling and analysis based on fMRI: A systematic review. Cogn. Neurodyn. 15, 389–403. doi:10.1007/s11571-020-09630-5
Keywords: backscattering polarimetry, Mueller Matrix, brain tissue, microstructure, MRI validation, microstructural orientation, white matter
Citation: Bonaventura J, Morara K, Carlson R, Comrie C, Daigle N, Hutchinson E and Sawyer TW (2022) Backscattering Mueller Matrix polarimetry on whole brain specimens shows promise for minimally invasive mapping of microstructural orientation features. Front. Photonics 3:1034739. doi: 10.3389/fphot.2022.1034739
Received: 02 September 2022; Accepted: 17 October 2022;
Published: 09 November 2022.
Edited by:
Sergio Fantini, Tufts University, United StatesReviewed by:
Tatiana Novikova, École Polytechnique, FranceJessica Ramella-Roman, Florida International University, United States
Copyright © 2022 Bonaventura, Morara, Carlson, Comrie, Daigle, Hutchinson and Sawyer. This is an open-access article distributed under the terms of the Creative Commons Attribution License (CC BY). The use, distribution or reproduction in other forums is permitted, provided the original author(s) and the copyright owner(s) are credited and that the original publication in this journal is cited, in accordance with accepted academic practice. No use, distribution or reproduction is permitted which does not comply with these terms.
*Correspondence: Travis W. Sawyer, tsawyer9226@arizona.edu