 Eduardo A. Gonzalez
 Camryn A. Graham
 Muyinatu A. Lediju Bell
94% of researchers rate our articles as excellent or good
Learn more about the work of our research integrity team to safeguard the quality of each article we publish.
Find out more
ORIGINAL RESEARCH article
Front. Photonics, 15 October 2021
Sec. Biophotonics
Volume 2 - 2021 | https://doi.org/10.3389/fphot.2021.716656
This article is part of the Research TopicBiophotonics Technologies for Clinical TranslationView all 8 articles
Spectral unmixing techniques for photoacoustic images are often used to isolate signal origins (e.g., blood, contrast agents, lipids). However, these techniques often require many (e.g., 12–59) wavelength transmissions for optimal performance to exploit the optical properties of different biological chromophores. Analysis of the acoustic frequency response of photoacoustic signals has the potential to provide additional discrimination of photoacoustic signals from different materials, with the added benefit of potentially requiring only a few optical wavelength emissions. This study presents our initial results testing this hypothesis in a phantom experiment, given the task of differentiating photoacoustic signals from deoxygenated hemoglobin (Hb) and methylene blue (MB). Coherence-based beamforming, principal component analysis, and nearest neighbor classification were employed to determine ground-truth labels, perform feature extraction, and classify image contents, respectively. The mean ± one standard deviation of classification accuracy was increased from 0.65 ± 0.16 to 0.88 ± 0.17 when increasing the number of wavelength emissions from one to two, respectively. When using an optimal laser wavelength pair of 710–870 nm, the sensitivity and specificity of detecting MB over Hb were 1.00 and 1.00, respectively. Results are highly promising for the differentiation of photoacoustic-sensitive materials with comparable performance to that achieved with more conventional multispectral laser wavelength approaches.
In photoacoustic imaging, spectral unmixing techniques (Glatz et al., 2011) are often used to isolate signal origins in the fields of oxymetry (Tzoumas and Ntziachristos, 2017; Gröhl et al., 2019; Gröhl et al., 2021), reporter genes (Weissleder and Ntziachristos, 2003; Brunker et al., 2017), and molecular details (Weber et al., 2016). Clinical applications include detection of tumors (Dahlstrand et al., 2020) and discriminating among critical chromophores (e.g., blood, contrast agents, lipids) during surgical interventions (Arabul et al., 2019).
Existing spectral unmixing techniques generally consist of generating an overdetermined system of equations (i.e., more equations than variables) from the signal response of each chromophore at different laser wavelengths, which can then be solved with an optimization technique based on the known optical absorption coefficient for each chromophore at each wavelength. For example, Xia et al. (2016) used a pseudo inverse approach to differentiate photoacoustic responses originating from water, blood, and lipids. Ding et al. (2017) investigated the effect of alternative versions with non-negativity constraints to determine the concentration levels of contrast agent injected in in vivo mice. More recently, Grasso et al. (2020) proposed an iterative approach to discriminate blood oxygenation levels by solving the system of equations with a non-negative matrix factorization, which compensates for the ill-conditioned invertibility of the absorption coefficient matrix.
Despite their effectiveness, these spectral unmixing techniques are typically not feasible for most real-time applications because of the lengthy acquisition times associated with transmitting multiple laser wavelengths to achieve a single estimate. Traditional spectral unmixing techniques also do not typically consider differences in acoustic spectra, which has the potential to provide additional information for differentiation between biomarkers or different soft tissues.
An alternative to optimization techniques is to consider an analysis of the acoustic spectra using spectral parameters. Initially, spectral parameters obtained from photoacoustic signals were used for characterization of tissues. For example, Kumon et al. (2011) conducted an in vivo study to detect prostate adenocarcinomas using the intercept, slope, and mid-band fit of the frequency response of photoacoustic RF signals, where the use of mid-band fit resulted in statistically significant differentiation between pathological and healthy tissue (p < 0.01). Similarly, Strohm et al. (2013) used both the slope of a linear fit and the spectral peak to discriminate between concentrations of red blood cells. Later, Wang et al. (2015) used the slope parameter to accurately differentiate (p < 0.01) the photoacoustic signals from particles of different diameters in phantom experiments. However, by reducing the dimensionality of the feature space, spectral parameter methods provide a limited snapshot of frequency characteristics. In addition, these methods use a calibration stage from a reference spectra whose source varies among studies (e.g., hair fibers (Kumon et al., 2011), stainless steel blocks (Cao et al., 2017), gold-films (Strohm et al., 2013), and black-dyed polymer micro-spheres (Wang et al., 2015)), which limits the repeatability of classification performance for in vivo applications.
In contrast to spectral unmixing methods, two distinct approaches (i.e., F-mode imaging (Moore et al., 2019) and a method proposed by Cao et al. (Cao et al., 2017)) utilize the complete acoustic spectra for differentiation of photoacoustic targets. F-mode imaging (Moore et al., 2019) consists of dividing the spectra with filter banks and displaying a series of images of a specific frequency content, which are later combined with a label-free photoacoustic microscopy (PAM) map to selectively enhance the visualization of organelles. The method proposed by Cao et al. (2017) uses the acoustic spectra filtered with the frequency response of the ultrasound transducer to perform k-means clustering of photoacoustic signals originating from two different photoacoustic-sensitive materials. These two approaches share two limitations. First, in contrast to spectral unmixing techniques, labelled regions for each desired chromophore are required. Second, these labelled regions rely on a priori information about the location of materials to be differentiated. These limitations are not ideal for image guidance during surgical interventions and reduce overall classification performance.
To overcome these challenges with traditional spectral unmixing (Xia et al., 2016; Grasso et al., 2020), F-mode (Moore et al., 2019) and k-means clustering (Cao et al., 2017), we propose a novel, more general acoustic frequency-based analysis method to discriminate photoacoustic responses from different materials. The proposed method does not depend on a reference spectrum (as opposed to k-means clustering (Cao et al., 2017)). In addition, the proposed method applies a classification framework using training and testing sets containing known photoacoustic-sensitive materials (i.e., no a priori signal location information is required, unlike F-mode (Moore et al., 2019) and traditional spectral unmixing techniques (Xia et al., 2016; Grasso et al., 2020)). We hypothesize that our proposed method, which relies on an analysis of the acoustic frequency response from a single- or dual-wavelength emission, is sufficient to differentiate biomarkers and has the potential to increase possible frame rates for real-time implementation in the operating room.
To test our hypothesis, a frequency analysis was applied to the received photoacoustic signals from two chromophores—blood and methylene blue. The necessity to differentiate these two chromophores is motivated by recently proposed photoacoustic-guided hysterectomy techniques that require differentiation of uterine arteries from ureters containing methylene blue (Wiacek et al., 2020). Although the focus of this paper is the distinction of these two chromophores, the proposed photoacoustic differentiation is applicable to other chromophores of interest during a surgical procedure.
The remainder of this paper is organized as follows. Section 2 details acquisition, segmentation, and classification methods to identify photoacoustic signals originating from either methylene blue or blood, followed by summaries of existing methods used to benchmark the performance of our approach on the same datasets. Section 3 presents the quantitative and qualitative comparison of the classification performance between the proposed and the existing methods. Section 4 discusses insights from these results and Section 5 summarizes our conclusions.
We designed a phantom that mimics the clinical setup of photoacoustic catheter-based interventions, where an optical fiber is attached to a cardiac catheter as it is being inserted through a major vein (Graham et al., 2020a). Another possibility is that a contrast agent may be injected into this vein through the same catheter. Based on these details, Figure 1 shows the experimental setup used to differentiate the two photoacoustic-sensitive materials of hemoglobin and methylene blue discussed throughout this manuscript. A 29 cm × 18 cm × 10 cm (length × width × height) polyvinyl chloride-plastisol (PVCP) phantom was fabricated to contain ten cylindrical, hollow chambers. Each chamber had a diameter of 15 mm and a depth of 55 mm. Two of the chambers were filled with either a 100 μM aqueous solution of methylene blue (MB, ID: S25431A, Fisher Scientific, Waltham, MA) or human blood (Hb), and a 1-mm-diameter optical fiber was inserted in each of the filled chambers. These fibers originated from a bifurcated fiber bundle that was connected to a Phocus Mobile laser (Opotek Inc., Carlsbad, CA, United States), transmitting laser light with wavelengths ranging from 690 to 950 nm in 10 nm increments.
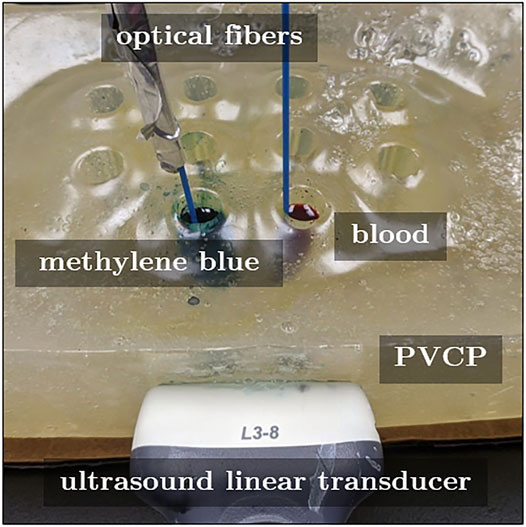
FIGURE 1. Acquisition setup to test the differentiation of methylene blue (MB) from blood (Hb). These photoacoustic-sensitive materials fill the hollow chambers of a custom polyvinyl chloride plastisol phantom.
The tip of each optical fiber was positioned approximately 15 mm below the top surface of the chambers, and light was emitted from each fiber tip. By transmitting light locally into each chamber and not globally illuminating multiple chambers simultaneously, we minimized (or systematically controlled) fluence differences and the related amplitude of responses to the optical excitation. The generated photoacoustic signals were received by an Alpinion L3-8 linear array ultrasound probe (center frequency of 5.5 MHz and pitch of 0.3 mm) that was positioned on the lateral wall of the phantom, approximately 40 mm away from the hollow chamber cross section, as shown in Figure 1.
To evaluate the reproducibility of our proposed method, three datasets were acquired (i.e., Datasets 1, 2, and 3). Dataset 1 was acquired first followed by Dataset 2 (acquired 10 h later), followed by Dataset 3 (acquired 13 h after Dataset 2). The Hb samples were stored with interim refrigeration at a temperature of 4°C. The fluence emitted from each fiber tip measured 1.0 mJ.
To characterize the effects of unequal fluence emitted from each fiber tip, three additional datasets were acquired with fluence pairs in the MB and Hb chambers recorded as 0.4 and 1.8 mJ, 1.0 and 1.8 mJ, and 0.4 and 1.0 mJ, respectively. These three datasets were labeled as “Fluence Pair 1”, “Fluence Pair 2,” and “Fluence Pair 3,” respectively. Each fluence pair dataset comprised three subsets, acquired with the same time intervals described in the preceding paragraph for Datasets 1–3.
To evaluate the performance of our proposed method in more challenging environments, particularly in the presence of an aberrating media composed of mostly fatty tissue, three additional datasets were acquired with 2-, 5-, and 7 mm-thick layers of turkey bacon placed between the phantom and the ultrasound probe. This dataset was acquired immediately prior to Dataset 2, thus it is expected to contain similar Hb degradation to that of Dataset 2. The added tissue layers can be considered to represent the fat that is commonly located within skin and within the subcutaneous region of healthy human tissue (Hinkelman et al., 1998). The fluence emitted from each fiber tip measured 1.0 mJ.
Figure 2 presents an overview of the proposed framework for differentiating photoacoustic signals sources. For each laser wavelength emission, 10 acquisitions of raw radiofrequency data were acquired. Photoacoustic images were then generated using conventional delay-and-sum (DAS) beamforming. Two regions of interest (ROIs) were automatically defined to separate photoacoustic signals generated from MB and Hb, located on the right and the left sides of the photoacoustic images, respectively. These ground-truth labels were automatically segmented using binary-thresholding of locally weighted short-lag spatial coherence (LW-SLSC) images (Gonzalez and Bell, 2018), with a regularization factor of α = 1 and an axial correlation kernel of 0.56 mm. Binary segmentation was performed using a −10 dB threshold mask applied to the LW-SLSC images. A single binary mask was computed per laser wavelength emission, which was the result of the logical inclusive “OR” operation of the 10 masks obtained from the 10 frames. This segmentation resulted in two distinct signals on the left and right sides of the mask, which were assigned the ground-truth labels of MB and Hb, respectively. For each image, only those pixels included in the coherence masks were used for feature extraction, training, and classification.
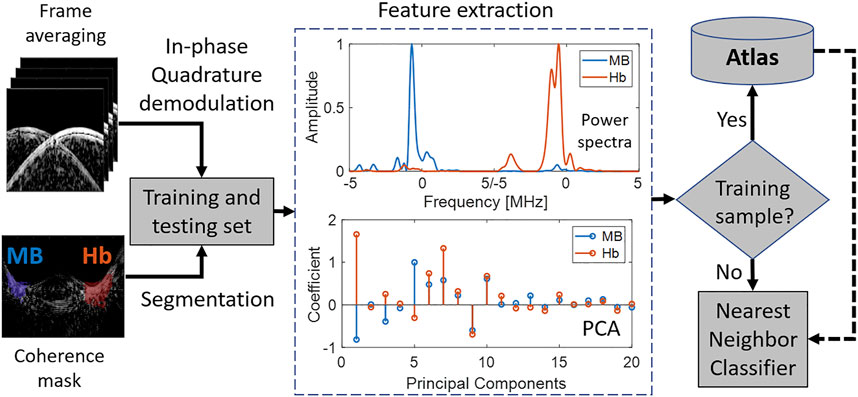
FIGURE 2. Overview of proposed method to differentiate photoacoustic signal sources using acoustic frequency information. The blue and red coherence masks show regions of interest for methylene blue (MB) and blood (Hb), respectively. These regions are known for the training set and need to be correctly classified through atlas comparisons during testing. Spectra are asymmetric with respect to frequency because baseband signals were analyzed after IQ demodulation.
A frequency analysis of the photoacoustic pressure waves was performed. For each material (i.e., MB and Hb), the normalized power spectra were calculated from a sliding window of axial kernels of in-phase and quadrature (IQ) data. Principal component analysis (PCA) was applied to the power spectra of photoacoustic signals acquired at each laser wavelength in order to reduce the complexity of the feature space. When using a training set, the principal components were stored in an “atlas” describing each material. Finally, when evaluating the spectra of a test signal, nearest neighbor (k-NN) classification was applied with the L2-norm as the measure of distance between the PCA of the test spectra and the PCA of the spectra within the atlas.
Datasets 1–3 (described in Section 2.1) were utilized to compare the performance of the proposed atlas-based method with the performance of the existing classification methods described in Section 2.4. Because these atlas methods require a training set in addition to a test set, Dataset 1 was used for training the atlas methods when testing with Datasets 2 and 3. In addition, to include performance when testing with Dataset 1, Dataset 2 was arbitrarily chosen for training in this scenario.
Figure 3 shows two proposed spectral analyses using either one or two wavelengths. In the dual-wavelength analysis, the magnitude of the IQ spectra of the photoacoustic response from a region of interest using two different wavelengths were concatenated, resulting in a region of interest producing a spectrum of size [1 × N] from one wavelength, where N is the number of samples of the spectrum, producing a concatenated spectra P of size [1 × 2N]. This concatenated spectrum was then normalized to its maximum value. No concatenation was required for the single-wavelength analysis.
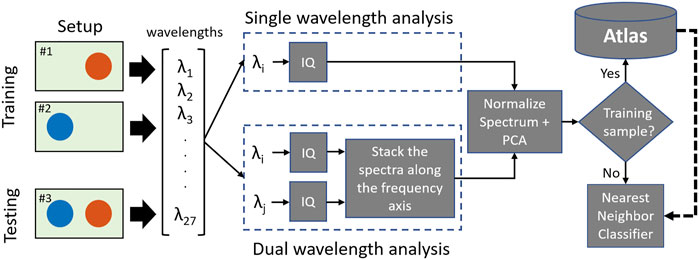
FIGURE 3. Two proposed spectral analyses for characterization based on single (top) and dual (bottom) wavelength emissions.
The initial parameters of the single- and dual-wavelength atlas method used in our previous publication (Gonzalez and Bell, 2020) were modified to maximize the sensitivity, specificity, and accuracy of our approach (see Section 2.6 for metric definitions). In particular, the parameters for in-phase quadrature demodulation, PCA, and k-NN were optimized through an iterative search using laser wavelengths ranging from 650 to 950 nm (see Section 1 of the Supplementary Material for more details). The optimized parameters were utilized for the proposed spectral analyses throughout the manuscript.
Spectral unmixing techniques solve the source component reconstruction C of a scanned region by using the multispectral measurement matrix M and an a priori absorption coefficient matrix S of the number of chromophores present in the image. A conventional spectral unmixing solution is the least square method presented below (Glatz et al., 2011; Taruttis et al., 2014; Xia et al., 2016):
where C segments k number of chromophores over a grid of n pixels, m is the number of laser wavelength acquisitions, and S+ is the Moore-Penrose pseudoinverse of the absorption coefficient matrix S (i.e., S+ = ST (SST)−1). A more robust approach proposed by Grasso et al. (2020) used an iterative non-negative matrix factorization (NNMF) to adjust the initial S and further reduce residual errors:
where ⊗ denotes multiplication. The multiplication and division steps are considered element-wise operations and the stopping criteria is defined by an improvement tolerance η. Equations 1, 2 are considered overdetermined systems (i.e., m > k). Both methods were applied to DAS images of the testing data described in Section 2.2 and Figure 3 for two chromophores (i.e., k = 2). However, because there is no report of absorption coefficients for methylene blue at optical wavelengths greater than 800 nm, only 12 of the 27 wavelength acquisitions were used for the construction of the matrix M (i.e., m = 12). In addition, each equation was regularized by modifying the initial S to:
where A is a matrix of ones, and γ is an additive coefficient that was varied from 10−1 to 103 cm−1 in multiplicative increments of 100.188 (i.e., γ[n] = 10−1 × 100.188n).
Using the testing data, non-normalized DAS images were generated without log-compression and segmented with the coherence mask described in Section 2.2. Log-compressed power spectra were calculated from a sliding window of axial kernels of radiofrequency signals, each 3.85 mm in length. For each spectrum, the integrated frequency content was estimated from four sectors of the frequency domain of 0.2 MHz width and center frequencies of 1, 2, 3, and 4 MHz. Then, for each segmented DAS image, k-means clustering was applied to separate MB and Hb axial kernels. This process was repeated for each single-wavelength acquisition and each frame. Given that the labelling provided by k-mean clustering is arbitrary for each instance of classification, the f value (see Eq. 7) was computed for both original labels (i.e., “1” = Hb and “2” = MB) and inverted labels (i.e., “1” = MB and “2” = Hb) for each testing frame. Then, the labelling convention that provided the highest f value was chosen as the final clustering result.
To perform the acoustic-based clustering method reported by Cao et al. (Cao et al., 2017), the spectra of each radio-frequency axial kernel were first calibrated to a reference spectrum that models the characteristic frequency response of the ultrasound system. The experiment for determining the optimal reference spectra is detailed in Section 2 of the Supplementary Material. The generation of the log spectra was similar to that of F-mode imaging. However, each spectrum was then calibrated over the reference spectrum and then further normalized at 0 dB, as specified in (Cao et al., 2017). Finally, k-means clustering was conducted using the same labelling criteria as described in Section 2.4.2, and the process was repeated for each single-wavelength acquisition and each frame. For the remainder of this manuscript, we refer to this acoustic-based clustering method as the k-means clustering method.
Table 1 summarizes the range of light-emission wavelengths used for each method as well as the corresponding hyperparameter to further improve the robustness of the classification performance. The additive coefficient γ represents a trade off between classification performance and reproducibility for the spectral unmixing methods, as the condition number of matrix S′ increases when γ increases, and the system becomes more ill-posed. The variation of the reference spectra evaluates the consistency of the classification results for the k-means clustering method when considering different materials and acquisition setups.
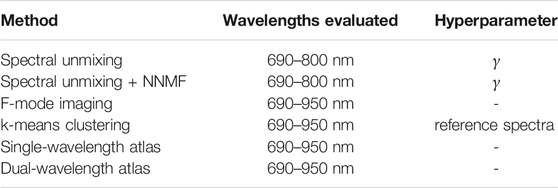
TABLE 1. Wavelengths and hyperparameters evaluated.
MB and Hb were considered to be the positive and negative samples, respectively, when calculating sensitivity, specificity, and accuracy metrics of classification performance. Sensitivity or true positive rate (TPR) measures the fraction of pixels that were correctly classified as methylene blue:
where TMB and FHb are the number of true MB and false Hb pixels, respectively. Similarly, specificity or true negative rate (TNR) measures the fraction of pixels that are correctly classified as deoxygenated blood:
where THb and FMB are the number of true Hb and false MB pixels, respectively. The combination of sensitivity and specificity is described by the accuracy metric, defined as:
To determine the optimal parameter for each method, the three quantitative metrics were considered simultaneously, using the optimization expression:
where λ is either: (1) a single wavelength for the single-wavelength atlas method, k-means clustering or F-mode imaging method; (2) a pair of wavelengths for the dual-wavelength atlas method; or (3) equivalent to the additive coefficient γ for the spectral unmixing methods, while
Finally, a pair-wise t-test was used to evaluate the statistical significance (p < 0.001) of the difference between MB and Hb spectra obtained from either the single-wavelength atlas or dual-wavelength atlas method. This statistical analysis used 56,800 spectral samples of MB and 43,060 spectral samples of Hb for the wavelength pair of 710–870 nm (i.e., one of the wavelength pairs that yielded a classification accuracy of 1.00).
The left column of Figure 4 shows example LW-SLSC photoacoustic images co-registered to a DAS ultrasound image obtained with the laser wavelength indicated on each image. The right column of Figure 4 shows the corresponding segmentation mask, where the blue and red regions represent the ground truth labeled pixels for MB and Hb, respectively. Figure 4D shows example compound masks generated by the “OR” logical operation of a range of masks obtained from 690 to 800 nm wavelengths. Figure 4H shows example compound masks generated by the “OR” logical operation from a mask pair obtained with 690 and 920 nm wavelengths. Note that the varying areas of the LW-SLSC signals and corresponding mask sizes for the MB and Hb regions obtained with different laser wavelength emissions are responsible for different proportions of MB-to-Hb kernel sizes when calculating the quantitative metrics.
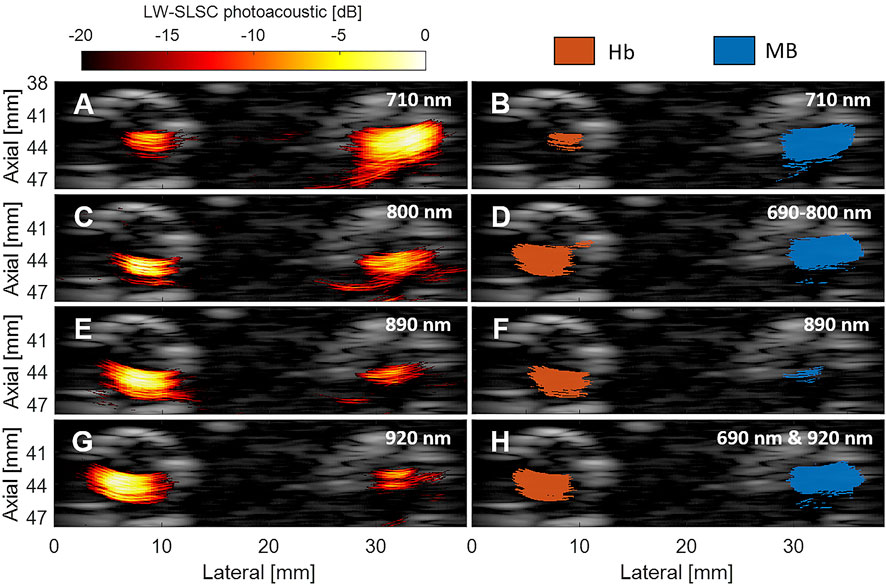
FIGURE 4. Locally-weighted short-lag spatial coherence (LW-SLSC) photoacoustic images overlaid on DAS ultrasound images of MB and Hb, obtained with a laser wavelength emission of (A) 710 nm (C), 800 nm (E) 890 nm, and (G) 920 nm. Segmented masks for MB and Hb after a -10 dB threshold was applied to the LW-SLSC photoacoustic images with single-wavelength masks shown for wavelengths of (B) 710 nm and (F) 890 nm, (D) the compound mask from “OR” logical operation on masks generated from 690 to 800 nm, and (H) the resulting mask from the “OR” logical operation of the 690 and 920 nm masks.
Figure 5 shows segmentation examples of the best results among the three datasets for each of the classification approaches after estimating the corresponding optimal parameter, using the optimization expression f defined by Eq. 7. The blue and red regions represent correctly classified pixels of MB and Hb, respectively, while the yellow regions represent misclassified pixels. As observed previously in Figure 4, the changes in region size among the approaches are caused by the different LW-SLSC coherence masks that were computed for either single, pairs, or groups of wavelengths, depending on the requirements of each classification method. When qualitatively comparing the classified regions, the dual-wavelength atlas method showed the best classification performance, as the majority of each MB and Hb region were labelled correctly (i.e., no yellow regions are shown). Similar performance was observed for the spectral unmixing and spectral unmixing + NNMF, which were generated with an additive coefficient γ of 19.31 cm−1 and 9.10 cm−1, respectively. Conversely, F-mode and k-means clustering could not properly detect signals from MB and Hb, respectively, showing a sensitivity and specificity of 0.76 and 0.79, respectively. A summary of the sensitivity, specificity, and accuracy obtained with the optimal parameter for each method is shown in Table 2.
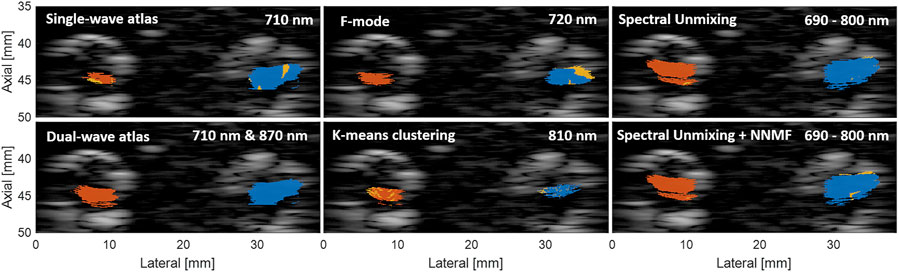
FIGURE 5. Example of segmented regions of MB and Hb using different classification approaches. The blue and red regions represent correctly classified pixels of MB and Hb, respectively, while the yellow regions represent misclassified pixels. Each image shows the frame of the dataset generated with the wavelength emission that achieved the highest accuracy.
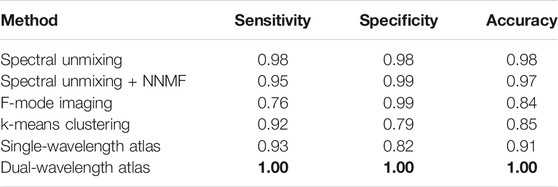
TABLE 2. Best classification result achieved with each method. Bold font indicates the maximum value in each column.
Figure 6 shows the combined results of sensitivity, specificity, and accuracy obtained from Datasets 1–3, using single-wavelength atlas, dual-wavelength atlas, spectral unmixing, F-mode, and k-means clustering methods. Spectral unmixing and spectral unmixing + NNMF were computed with γ = 6.23 cm−1 and γ = 5.18 cm−1, respectively. Defining an accuracy ≥0.80 as good classification, spectral unmixing and spectral unmixing + NNMF showed a good mean accuracy of 0.85 and 0.87, respectively, among the three datasets. Similarly, the dual-wavelength atlas method showed mean accuracy values greater than 0.85 for wavelength pairs of 690 and 810 nm through 840 and 870 nm, as shown in the green-colored middle region of the triangles showed in Figure 6. In contrast, the maximum values of mean accuracy for the single-wavelength atlas method, F-mode imaging, and k-means clustering among the three datasets were 0.77, 0.74, and 0.72 for wavelengths of 890 nm, 750 nm, and 880 nm, respectively. These mean accuracy values were lower than the minimum accuracy required for good classification performance, suggesting that only the dual-wavelength atlas method and the spectral unmixing methods showed overall consistent classification performance.
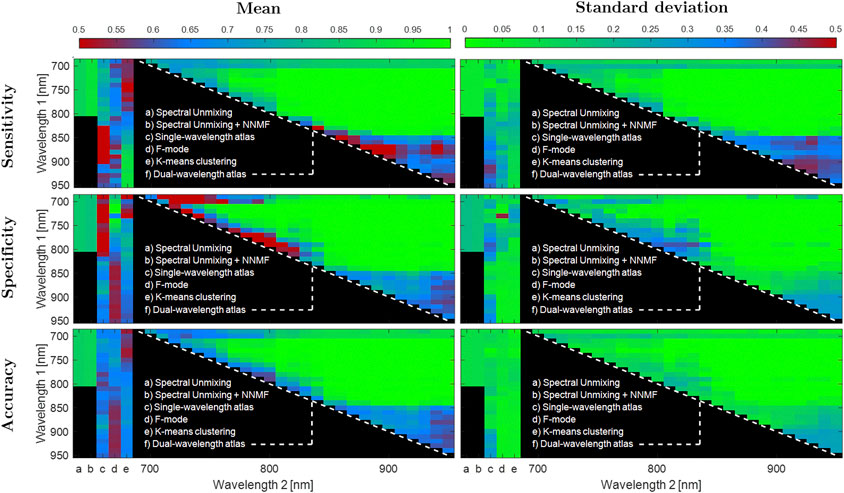
FIGURE 6. Overall classification results with dual-wavelength atlas, single-wavelength atlas, spectral unmixing methods, F-mode, and k-means clustering using Dataset 1, 2, and 3. Top, middle and bottom rows show the sensitivity, specificity and accuracy of classification, respectively. The left and right columns show the mean and standard deviation over 10 frames, respectively. For each image, the first 2 vertical stripes counting from the left represents the results for spectral unmixing and spectral unmixing + NNMF, respectively, which have a single value from 690 to 800 nm wavelengths. The next three stripes represent the results for single-wavelength atlas, F-mode, and k-means clustering, respectively, as a function of wavelength emission. Finally, the triangle represents the results of the dual-wavelength atlas for each pair of wavelength combination.
As it is equally important to identify both MB and Hb regions, a high sensitivity and a low specificity pair, or vice-versa, corresponds in practice to a poor classification performance. Therefore, the totality of graphs shown in Figure 6 must be analyzed from this perspective. For some accuracy regions that are shown in blue (i.e., adequate classification), the same regions are colored in red (i.e., poor classification) for either the corresponding specificity or sensitivity or colored in green (i.e., good classification). For example, the single-wavelength atlas method showed a mean ± one standard deviation accuracy of 0.70 ± 0.06 over the wavelength range of 710–740 nm, while showing a sensitivity and specificity of 0.78 ± 0.08 and 0.40 ± 0.14, respectively, over the same wavelength range. Similarly, the k-means clustering method showed a mean ± one standard deviation sensitivity of 0.89 ± 0.11 over the wavelength range of 860–950 nm, while showing a specificity and accuracy of 0.63 ± 0.05 and 0.67 ± 0.04, respectively, over the same wavelength range. These results further support the importance of evaluating sensitivity, specificity, and accuracy simultaneously, as described by Eq. 7, to determine the overall classification performance of each method. The mean ± one standard deviation for this combination of accuracy, sensitivity, and specificity (i.e., f in Eq. 7), over the same wavelength ranges described above for the single-wavelength atlas and the k-means clustering methods were 0.65 ± 0.06 and 0.72 ± 0.04, respectively.
Table 3 and Table 4 present summaries of quantitative metrics from the average among wavelengths and the average among the best 5 cases for each classification method, respectively. The quantitative results follow the same trend as those described for the qualitative results, where the dual-wavelength atlas method achieved the highest sensitivity, specificity, and accuracy among the other methods. Similarly, the method with the second highest average in the best-5-cases evaluation was the spectral unmixing + NNMF.
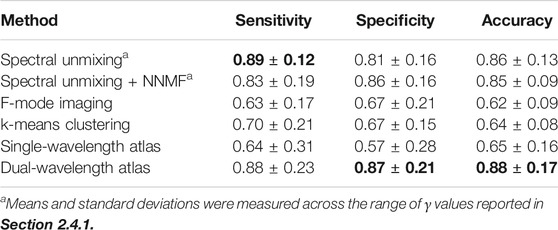
TABLE 3. Mean ± standard deviation of the sensitivity, specificity, and accuracy measured across the wavelengths investigated for each method. Bold font indicates the maximum value in each column.
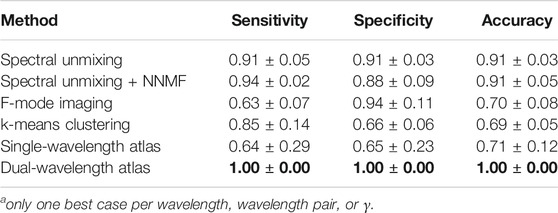
TABLE 4. Average among best five cases for each methoda. Bold font indicates the maximum value in each column.
Figure 7A shows a representative example of spectra from the dual-wavelength atlas method and the equivalent stacked spectra from the single-wavelength atlas method. This display method was chosen to demonstrate the improvement in classification performance when using the dual-wavelength atlas method. For these examples, the testing spectra of 710 and 870 nm wavelengths were used, as this wavelength pair was one of eighty nine to achieve a specificity and sensitivity of 1.00 when using the dual-wavelength atlas method. The mean and standard deviation of the spectra were calculated from the spectra of all segmented pixels of MB and Hb data acquired with 710 nm or 870 nm wavelength for each atlas method. Error bars show one standard deviation of the combined results from all kernels within selected ROIs, from 10 image acquisition frames, and from the three datasets. The overlapping spectra with the single-wavelength atlas method applied to either 710 nm or 870 nm wavelength acquisitions (top of Figure 7A) resulted in no statistically significant differences between the amplitude of the spectra for MB and Hb (p > 0.001), while Hb and MB differentiation was achieved with statistical significance (p < 0.001) when using the dual-wavelength atlas method (bottom of Figure 7A). This example illustrates that the enhanced differentiation achieved with the dual-wavelength atlas method can be attributed to the ability to differentiate the two spectra.
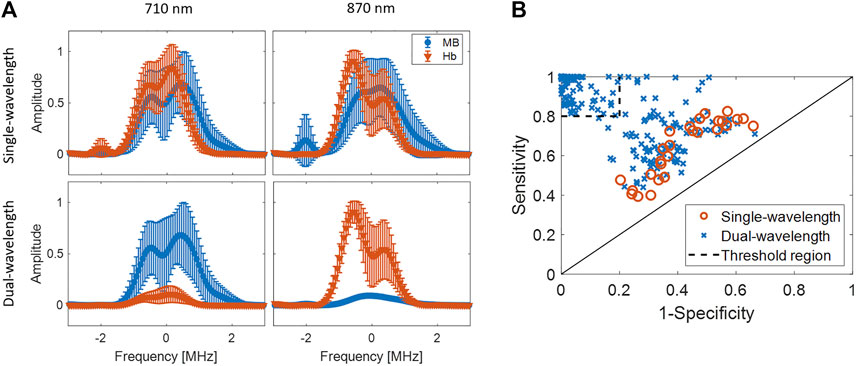
FIGURE 7. (A) Examples of stacked spectra of in-phase quadrature data from MB and Hb using (top) single-wavelength atlas method and (bottom) dual-wavelength atlas method. The spectra show combined results obtained with 710 and 870 nm laser wavelength. (B) Comparison of sensitivity and 1-specificity from single- and dual-wavelengths atlas method using a one frame per wavelength and wavelength pair, respectively. The threshold regions delimits cases with both sensitivity and specificity greater than 0.8, which represents a good classification performance.
Figure 7B shows a comparative evaluation of sensitivity and specificity between the atlas methods in an ROC-curve format. This display is included to support the observation that the dual-wavelength atlas method achieves high classification performance from a range of wavelengths combinations, whereas the other methods achieve their highest classification performance from just a few cases, based on the results shown in Figure 6. For example, when a threshold region of 0.80 sensitivity and 0.80 specificity is defined as the criterion for adequate classification, Figure 7B demonstrates that 241 wavelength pairs and 0 single wavelengths met this criterion for the dual- and single-wavelength atlas methods, respectively. Therefore, the dual-wavelength atlas method provides a flexible range of light emission wavelength pairs such that the ideal pair can be chosen to differentiate between the same chromophores across multiple imaging environments. This flexibility is necessary when an unwanted chromophore produces a considerable photoacoustic response at the originally selected wavelength pair.
Figure 8 shows the accuracy results of the spectral unmixing techniques when tested on Datasets 1–3 while varying the additive coefficient γ in Eq. 3. The dashed line represents the optimal γ that achieved the highest average f(γ) value among the three datasets. When calculating the optimal γ1, γ2, and γ3 for Datasets 1, 2, and 3, respectively, the absolute difference between the optimal γ and each γ1, γ2, and γ3 in the conventional spectral unmixing method was 7.01 cm−1, 21.87 cm−1, and 2.70 cm−1, respectively, resulting in a standard deviation of 12.35 cm−1. In contrast, the difference between the optimal γ and the individual γ1, γ2, and γ3 in spectral unmixing + NNMF resulted in a standard deviation of 1.37 cm−1. This γ difference suggests that the optimal γ of spectral unmixing + NNMF is less sensitive to the testing data than that of conventional spectral unmixing. However, when evaluating the standard deviation of the classification accuracy at the optimal γ, spectral unmixing + NNMF produced standard deviations of 6.47%, 0.54%, and 0.34% for Datasets 1, 2, and 3, respectively, while conventional spectral unmixing produced standard deviations of 1.93%, 0.47%, and 0.48% for Datasets 1, 2, and 3, respectively. Thus, the spectral unmixing techniques did not demonstrate accuracy robustness across different datasets, and this detail must be considered in tandem with the γ differences.
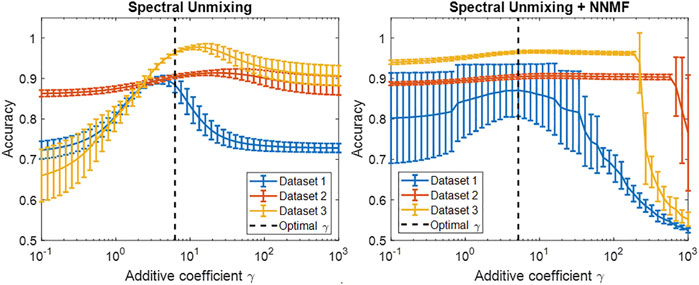
FIGURE 8. Classification accuracy of the spectral unmixing techniques for three testing datasets while varying the additive coefficient γ.
Figure 9A shows a summary of the accuracy results obtained with the spectral unmixing, single- and dual-wavelength atlas, F-mode, and k-means clustering methods using the full range of wavelengths and additive coefficient γ. When comparing the distributions among Datasets 1–3, the maximum difference in median accuracy measured for each dataset when applying spectral unmixing, spectral unmixing + NNMF, F-mode, k-means clustering, and the single-wavelength atlas methods was 15.8%, 21.2%, 6.7%, 4.3%, and 25.5%, respectively, while the dual-wavelength atlas method showed a maximum difference in median accuracy of 1.4%. While these results display wide variations due to the inclusion of a wide range of wavelengths, wavelength pairs, or additive coefficient γ, only specific values can be selected in advance and later used in clinical practice.
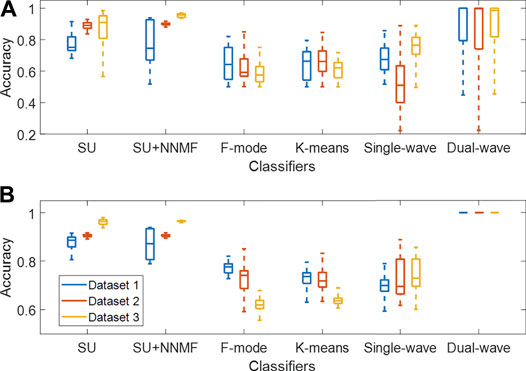
FIGURE 9. Classification accuracy of each method when tested on Datasets 1–3, evaluated with (A) the full range of wavelengths and additive coefficient γ (with each distribution obtained from 270–3,510 samples, i.e., 10 acquired frames × 27–351 wavelengths, wavelength pairs, or γ) and (B) the best 5 cases of wavelengths and γ among the datasets (with each distribution obtained from 50 samples, i.e., 10 frames × 5 cases). SU = Spectral Unmixing, NNMF = Non-negative Matrix Factorization.
Therefore, Figure 9B shows a subset of accuracy distributions obtained from the best 5 cases among the datasets, as defined in Section 2.6. The dual-wavelength atlas method showed a maximum difference in median accuracy between any two datasets of 0%, which was significantly lower than that obtained from spectral unmixing (7.8%), spectral unmixing + NNMF (9.5%), F-mode (15.6%), k-means clustering (10.1%), and the single-wavelength atlas method (3.3%). In addition, when evaluating the dual-wavelength atlas method on Datasets 1-3, the 710–870 nm wavelength pair was present among the five pairs of wavelengths with the highest accuracy, with sensitivity, specificity, and accuracy of 1.00, 1.00, and 1.00 respectively. Therefore, the dual-wavelength atlas method implemented with this wavelength pair shows higher reproducibility of classification performance than spectral unmixing and other acoustic-based methods.
Figure 10 shows the classification accuracy of each dataset acquired with varying fluence pairs. The best 5 cases of wavelengths and additive coefficient γ, as defined in Section 2.6. For each of the five existing methods, the maximum difference between the median accuracy values reported for any two fluence pairs (including the “Equal Fluence” Pair) was 3.3% for spectral unmixing, 3.8% for spectral unmixing + NNMF, 18.4% for F-mode, 12.9% for k-means clustering, and 11.9% for the single-wavelength atlas method. For the dual-wavelength atlas method, the maximum difference between the median accuracy values reported for any two fluence pairs was 0.1%, which is lower than the values reported for the five existing methods. These results demonstrate that the dual-wavelength atlas method is robust against changes in fluence levels when compared to acoustic-based methods that do not apply a normalization step such as F-mode.
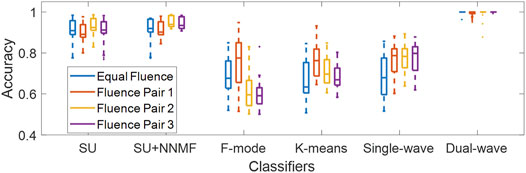
FIGURE 10. Classification accuracy of each method when tested with four fluence pairs, evaluated using the best 5 cases of wavelengths and additive coefficient γ among the datasets. Each distribution was obtained from 150 samples (10 frames × 5 cases × 3 datasets). SU = Spectral Unmixing, NNMF = Non-negative Matrix Factorization.
Figure 11 shows the classification accuracy from the dual-wavelength atlas method tested on the datasets obtained with added tissue layers. The five wavelength pairs are sorted by the median accuracy obtained in the absence of a layer (i.e., in descending order from left to right). When comparing the results obtained in the absence of a tissue layer, the 2 mm tissue layer resulted in no significant change to the median accuracy for the 780–870 nm and 780–950 nm wavelength pairs and decreased median accuracies of 3.0%, 11.9%, and 8.0% for wavelength pairs of 690–950 nm, 690–870 nm, and 690–780 nm, respectively. When comparing the results obtained in the absence of a tissue layer with the 5 mm tissue layer results, the 780–870 nm and 780–950 nm wavelength pair showed a decrease in median accuracy of 3.5% and 4.9%, respectively, which was lower than that obtained with the remaining wavelength pairs, yielding an average median accuracy decrease of 14.4%. Finally, when comparing the results obtained in the absence of a tissue layer with the 7 mm tissue layer results, the 780–870 nm wavelength pair showed a decrease in median accuracy of 7.1%, which was significantly lower than that obtained with the other wavelength pairs, yielding an average median accuracy decrease of 22.5%. Results demonstrate that the aberrating conditions generally reduce performance due to the presence of the fatty tissue, with a median classification accuracy of 92.9% for a 7 mm-thick tissue layer when using a wavelength pair of 780–870 nm.
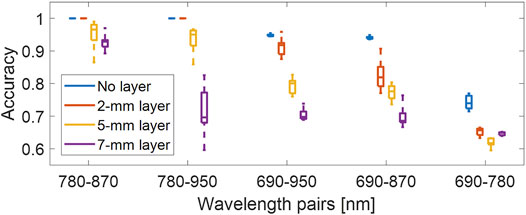
FIGURE 11. Classification accuracy of the dual-wavelength atlas method when varying the thickness of the aberrating tissue layers, evaluated with five different wavelength pairs. Each distribution was obtained from 10 samples (10 frames × one wavelength pair).
We demonstrated a novel method to accurately identify biological markers by analyzing the acoustic frequency response from either a single-wavelength emission (i.e., single-wavelength atlas method) or two consecutive wavelength emissions (i.e., dual-wavelength atlas method). Overall, the best classification accuracy obtained with the dual-wavelength atlas approach outperforms that obtained from previous methods with similar goals, including spectral unmixing (Xia et al., 2016; Grasso et al., 2020), F-mode imaging (Moore et al., 2019), and k-means clustering (Cao et al., 2017).
The dual-wavelength atlas method has three additional advantages over spectral unmixing techniques. First, the dual-wavelength atlas method does not require a significant number of wavelengths, which is often an impediment to both real-time capabilities and surgical implementation. With only two wavelength emissions, the overall acquisition time is significantly reduced as well as the memory bandwidth that is proportional to the number of acquired frames. Second, our method does not heavily depend on a hyperparameter to enhance its classification accuracy, contrary to both conventional and NNMF spectral unmixing techniques. In addition, as observed in Figure 8A, there was no single γ value that ensured the highest classification accuracy for the three datasets using the conventional spectral unmixing technique, which suggests that testing on a fourth dataset would not necessarily have the optimal accuracy result when using the same γ. Third, the dual-wavelength atlas method shows consistent classification performance against different datasets, as observed in Figure 8B. Consequently, finding the same optimal wavelength pair for both datasets further supports the benefit of using only two wavelengths (i.e., 710 and 870 nm) for the identification of biological markers (i.e., MB and Hb) in future cases.
Normalization plays a key role in the single-wavelength atlas, dual-wavelength atlas, and k-means clustering methods because it prevents the use of amplitude as a distinguishing feature for classification. This is particularly important when characterizing structures located at different distances from the light source. By normalizing the spectrum from a single wavelength, both single-wavelength atlas and k-means clustering algorithms rely purely on the acoustic frequency content for tissue differentiation, which is often challenged by the limited frequency content obtained with a limited-bandwidth ultrasound transducer. In contrast, the dual-wavelength atlas method normalizes a pair of spectra, removing the amplitude dependency between two different regions but at the same time preserving the relative amplitude difference of two different light emission responses from the same region. In clinical practice, we envision dual excitation wavelengths illuminating the region of interest with a fast-switching laser source that quickly alternates between wavelengths, providing real-time labeling of photoacoustic-sensitive regions with comparable performance to that achieved with more conventional spectral unmixing techniques. The proposed method could be beneficial for a range of emerging photoacoustic imaging approaches oriented to surgeries and interventions (Lediju Bell, 2020; Wiacek and Lediju Bell, 2021), such as hysterectomies (Allard et al., 2018a; Allard et al., 2018b; Wiacek et al., 2019), neurosurgeries (Bell et al., 2014; Graham et al., 2019; Graham et al., 2020b; Graham et al., 2021), spinal fusion surgeries (Shubert and Lediju Bell, 2018; Gonzalez et al., 2019; Gonzalez et al., 2020), as well as identification and distinction of metallic tool tips (Eddins and Bell, 2017; Allard et al., 2018b), cardiac catheter tips (Graham et al., 2020a), and needle tips (Lediju Bell and Shubert, 2018) from other surrounding structures of interest.
Although the average accuracy values from the dual-wavelength atlas method shown in Table 3 are low (i.e., 0.88) in comparison to the best case of accuracy (i.e., 1.00), this occurs because we included the classification results from the 351 wavelength pairs combinations used in this study in the reported average. As observed in Figure 6, several wavelength pairs yielded classification accuracy values < 0.65, which lowers the overall accuracy. A similar decrease was observed for the single-wavelength atlas, F-mode, and k-means clustering methods, as each method similarly used a range of wavelengths with most wavelengths producing poor classification results. However, in practice, only a reduced set of wavelength pairs would be used for the differentiation of MB and Hb with the dual-wavelength atlas method. Therefore, Table 4 represents a more realistic average from a reduced set of wavelength pairs for the dual-wavelength atlas method, and a reduced set of single wavelengths and hyper parameters for the other classification methods.
One limitation of the atlas approach is the availability of the sample material for generating a significant number of spectra in the training set. While most of the targeted materials for classification are either biological fluids or contrast agents, a non-fluid biological landmark (e.g., bone) would require a new setup to couple the tissue to the background PVCP without using additional photoacoustic-sensitive materials. In addition, the optical and acoustic properties of the biological materials contained in the PVCP chambers must be similar to the expected in vivo properties in order to maximize success. With consideration that the acoustic response from in vivo and ex vivo Hb may differ due to expected degradation of ex vivo blood, the datasets described throughout this manuscript represented Hb in different states of degradation, and the dual-wavelength atlas method showed no significant change in the classification accuracy under these degradation conditions. We additionally demonstrated the robustness of the dual-wavelength atlas method against distortions of the acoustic response due to aberrating media. Future work will explore the impact of additional confounding factors when characterizing biological tissues (e.g., decrease in blood oxygenation (Li et al., 2018), deterioration of the lipid-rich myelin sheath of nerves (Shen et al., 2010)) on the classification performance of the dual-wavelength atlas method.
Additional future work includes improvements to the dual-wavelength atlas method for real-time identification of tissues, through the utilization of common parallelization and optimization strategies. The currently sequential comparison of measurements with atlas spectra can potentially be addressed with at least one of three possible strategies. First, graphical processing units (GPUs) may be employed for concurrent comparisons of a test spectrum with several training spectra. The feasibility of GPU-based NN classification has been widely studied and demonstrated in the literature (Garcia et al., 2010; Florimbi et al., 2018; Zhu et al., 2014; Aydin, 2014; Gil-García et al., 2007). Second, atlas factors that affect the computation time may be carefully adjusted (e.g., increase the coherence threshold of the LW-SLSC mask or reduce the number of acquired frames per wavelength emission) without compromising classification performance. Increasing the coherence threshold would produce smaller masks and thus, less pixels to evaluate for classification. Once a new coherence threshold is defined, the number of frames needed for classification can then be empirically determined by maximizing the combined sensitivity, specificity, and accuracy using Eq. 7. Third, rather than evaluating the photoacoustic spectra with an extensive look-up table (i.e., spectral atlas), the classification time can be reduced by implementing an artificial neural network (ANN) to learn and match features of the acoustic spectra (i.e., bypassing PCA feature extraction), which has been successfully implemented in previous studies (Jain and Mao, 1991; Wang et al., 2018).
The proposed framework could be extended to multinomial classification (i.e., more than 2 tissues to classify), which is often necessary during in vivo interventions as photoacoustic signals originating from the surrounding tissue cannot be neglected. In contrast to binomial classification, multinomial classification would benefit from more robust feature extraction methods such as linear discriminant analysis (Belhumeur et al., 1997; Kwak and Pedrycz, 2005) or more robust classifiers such as sparse representation-based classifiers (Wright et al., 2008; Yang et al., 2013). While the increase in the algorithm complexity can be addressed with the strategies discussed in the preceding paragraph, an alternative solution is to include a clustering criteria within the NN classification. Specifically, for trinomial classification where one of the regions would be labelled as a third component that does not exist in the atlas (e.g., background noise). Then, the acoustic spectra from this region can be identified when the error of the closest match surpasses a specific threshold, indicating the presence of a third component. Alternatively, NN-k or fuzzy C-means classification (Chuang et al., 2006) may be employed to characterize the degree of belonging in regions where two materials are combined, with the potential benefit of assessing the percentage of a specific material within a region of interest.
We developed a novel acoustic-based photoacoustic classifier that relies on training sets to identify photoacoustic-sensitive materials. The proposed method is robust against changes in fluence levels and showed comparable sensitivity, specificity, and accuracy performance to those obtained with conventional and enhanced spectral unmixing methods. In clinical practice, we envision dual excitation wavelengths illuminating the region of interest with a fast-tuning laser source, providing real-time labeling of photoacoustic-sensitive regions with a GPU-based parallelized algorithm version or deep neural network architectures. Results from the presented experiments are promising for the identification of biological or bio-compatible markers (e.g., blood and contrast agents) during surgical interventions. By using the normalized photoacoustic response from two wavelength iterations, surgeons can localize structures of interest and surgical tools while avoiding other structures that are in close proximity to the targeted operating region.
The datasets presented in this article are not readily available because they may be made available for non-commercial reasons upon reasonable request to the senior author, after acceptable completion of the university’s data use agreement. Requests to access the datasets should be directed to bWxlZGlqdWJlbGxAamh1LmVkdQ==.
EG developed the atlas-based methods, designed the experiment, acquired the data, analyzed the results, and drafted the article. CG performed additional investigations and experiments to optimize the dual-wavelength atlas method. MALB conceptualized the idea and edited article drafts. All authors interpreted the experimental results and approved the submitted version of the article.
This work was supported by NSF CAREER Award ECCS-1751522, NSF SCH Award IIS-2014088, NSF EEC-1852155, NIH Trailblazer Award R21-EB025621, and NIH R00-EB018994.
The authors declare that the research was conducted in the absence of any commercial or financial relationships that could be construed as a potential conflict of interest.
All claims expressed in this article are solely those of the authors and do not necessarily represent those of their affiliated organizations, or those of the publisher, the editors, and the reviewers. Any product that may be evaluated in this article, or claim that may be made by its manufacturer, is not guaranteed or endorsed by the publisher.
The authors acknowledge the support of NVIDIA Corporation with the donation of the Titan Xp GPU used for this research.
The Supplementary Material for this article can be found online at: https://www.frontiersin.org/articles/10.3389/fphot.2021.716656/full#supplementary-material
Allard, M., Shubert, J., and Bell, M. A. L. (2018). feasibility of photoacoustic guided hysterectomies with the da vinci robot. Med. Imaging 2018: Image-Guided Procedures, Robotic Interventions, Model. 10576, 105760A. doi:10.1117/12.2293176
Allard, M., Shubert, J., and Bell, M. A. L. (2018). Feasibility of Photoacoustic-Guided Teleoperated Hysterectomies. J. Med. Imaging (Bellingham) 5, 021213. doi:10.1117/1.JMI.5.2.021213
Arabul, M. U., Rutten, M. C. M., Bruneval, P., van Sambeek, M. R. H. M., van de Vosse, F. N., and Lopata, R. G. P. (2019). Unmixing Multi-Spectral Photoacoustic Sources in Human Carotid Plaques Using Non-negative Independent Component Analysis. Photoacoustics 15, 100140. doi:10.1016/j.pacs.2019.100140
Aydin, B. (2014). Parallel Algorithms on Nearest Neighbor Search. Georgia State University: Survey paper.
Belhumeur, P. N., Hespanha, J. P., and Kriegman, D. J. (1997). Eigenfaces vs. Fisherfaces: Recognition Using Class Specific Linear Projection. IEEE Trans. Pattern Anal. Machine Intell. 19, 711–720. doi:10.1109/34.598228
Bell, M. A. L., Ostrowski, A. K., Kazanzides, P., and Boctor, E. (2014). Feasibility of Transcranial Photoacoustic Imaging for Interventional Guidance of Endonasal Surgeries. Photons Plus Ultrasound: Imaging and Sensing 8943, 894307. doi:10.1117/12.2038511
Brunker, J., Yao, J., Laufer, J., and Bohndiek, S. E. (2017). Photoacoustic Imaging Using Genetically Encoded Reporters: a Review. J. Biomed. Opt. 22, 070901. doi:10.1117/1.jbo.22.7.070901
Cao, Y., Kole, A., Lan, L., Wang, P., Hui, J., Sturek, M., et al. (2017). Spectral Analysis Assisted Photoacoustic Imaging for Lipid Composition Differentiation. Photoacoustics 7, 12–19. doi:10.1016/j.pacs.2017.05.002
Chuang, K.-S., Tzeng, H.-L., Chen, S., Wu, J., and Chen, T.-J. (2006). Fuzzy C-Means Clustering with Spatial Information for Image Segmentation. Comput. Med. Imaging Graphics 30, 9–15. doi:10.1016/j.compmedimag.2005.10.001
Dahlstrand, U., Sheikh, R., Merdasa, A., Chakari, R., Persson, B., Cinthio, M., et al. (2020). Photoacoustic Imaging for Three-Dimensional Visualization and Delineation of Basal Cell Carcinoma in Patients. Photoacoustics 18, 100187. doi:10.1016/j.pacs.2020.100187
Ding, L., Deán-Ben, X. L., Burton, N. C., Sobol, R. W., Ntziachristos, V., and Razansky, D. (2017). Constrained Inversion and Spectral Unmixing in Multispectral Optoacoustic Tomography. IEEE Trans. Med. Imaging 36, 1676–1685. doi:10.1109/tmi.2017.2686006
Eddins, B., and Bell, M. A. (2017). Design of a Multifiber Light Delivery System for Photoacoustic-Guided Surgery. J. Biomed. Opt. 22, 41011. doi:10.1117/1.JBO.22.4.041011
Florimbi, G., Fabelo, H., Torti, E., Lazcano, R., Madroñal, D., Ortega, S., et al. (2018). Accelerating the K-Nearest Neighbors Filtering Algorithm to Optimize the Real-Time Classification of Human Brain Tumor in Hyperspectral Images. Sensors 18, 2314. doi:10.3390/s18072314
Garcia, V., Debreuve, E., Nielsen, F., and Barlaud, M. (2010). K-nearest Neighbor Search: Fast Gpu-Based Implementations and Application to High-Dimensional Feature Matching. IEEE Int. Conf. Image Process. (Ieee) 2010, 3757–3760. doi:10.1109/icip.2010.5654017
Gil-García, R., Badía-Contelles, J. M., and Pons-Porrata, A. (2007). Parallel Nearest Neighbour Algorithms for Text Categorization, Springer. Eur. Conf. Parallel Process., 328–337. doi:10.1007/978-3-540-74466-5_36
Glatz, J., Deliolanis, N. C., Buehler, A., Razansky, D., and Ntziachristos, V. (2011). Blind Source Unmixing in Multi-Spectral Optoacoustic Tomography. Opt. Express 19, 3175–3184. doi:10.1364/oe.19.003175
Gonzalez, E., and Bell, M. A. L. (2018). Segmenting Bone Structures in Ultrasound Images with Locally Weighted SLSC (LW-SLSC) Beamforming. IEEE Int. Ultrason. Symp. (Ius) (Ieee) 2018, 1–9. doi:10.1109/ultsym.2018.8579732
Gonzalez, E., Wiacek, A., and Bell, M. A. L. (2019). Visualization of Custom Drill Bit Tips in a Human Vertebra for Photoacoustic-Guided Spinal Fusion Surgeries. Photons Plus Ultrasound: Imaging and Sensing 10878, 108785M. doi:10.1117/12.2510688
Gonzalez, E. A., and Bell, M. A. L. (2020). Acoustic Frequency-Based Differentiation of Photoacoustic Signals from Surgical Biomarkers. IEEE Int. Ultrason. Symp. (Ius) (Ieee) 2020, 1–4. doi:10.1109/ius46767.2020.9251551
Gonzalez, E. A., Jain, A., and Bell, M. A. L. (2020). Combined Ultrasound and Photoacoustic Image Guidance of Spinal Pedicle Cannulation Demonstrated with Intact Ex Vivo Specimens. IEEE Trans. Biomed. Eng. 68 (8), 2479–2489. doi:10.1109/tbme.2020.3046370
Graham, M., Assis, F., Allman, D., Wiacek, A., Gonzalez, E., Gubbi, M., et al. (2020). In Vivo demonstration of Photoacoustic Image Guidance and Robotic Visual Servoing for Cardiac Catheter-Based Interventions. IEEE Trans. Med. Imaging 39, 1015–1029. doi:10.1109/tmi.2019.2939568
Graham, M. T., Creighton, F. X., and Bell, M. A. L. (2021). Validation of Eyelids as Acoustic Receiver Locations for Photoacoustic-Guided Neurosurgery. Photons Plus Ultrasound: Imaging and Sensing 2021 11642, 1164228. doi:10.1117/12.2582562
Graham, M. T., Guo, J. Y., and Bell, M. A. L. (2019). Simultaneous Visualization of Nerves and Blood Vessels with Multispectral Photoacoustic Imaging for Intraoperative Guidance of Neurosurgeries. Adv. Biomed. Clin. Diagn. Surg. Guidance Syst. XVII 10868, 108680R. doi:10.1117/12.2508167
Graham, M. T., Huang, J., Creighton, F. X., and Lediju Bell, M. A. (2020). Simulations and Human Cadaver Head Studies to Identify Optimal Acoustic Receiver Locations for Minimally Invasive Photoacoustic-Guided Neurosurgery. Photoacoustics 19, 100183. doi:10.1016/j.pacs.2020.100183
Grasso, V., Holthof, J., and Jose, J. (2020). An Automatic Unmixing Approach to Detect Tissue Chromophores from Multispectral Photoacoustic Imaging. Sensors 20, 3235. doi:10.3390/s20113235
Gröhl, J., Kirchner, T., Adler, T., and Maier-Hein, L. Estimation of Blood Oxygenation with Learned Spectral Decoloring for Quantitative Photoacoustic Imaging (LSD-qPAI). arXiv preprint arXiv:1902.05839 (2019).
Gröhl, J., Kirchner, T., Adler, T. J., Hacker, L., Holzwarth, N., Hernández-Aguilera, A., et al. (2021). Learned Spectral Decoloring Enables Photoacoustic Oximetry. Sci. Rep. 11, 1–12. doi:10.1038/s41598-021-83405-8
Hinkelman, L. M., Mast, T. D., Metlay, L. A., and Waag, R. C. (1998). The Effect of Abdominal wall Morphology on Ultrasonic Pulse Distortion. Part I. Measurements. The J. Acoust. Soc. America 104, 3635–3649. doi:10.1121/1.423946
Jain, A. K., and Mao, J. (1991). A K-Nearest Neighbor Artificial Neural Network Classifier. IJCNN-91-Seattle Int. Jt. Conf. Neural Networks (Ieee) 2, 515–520.
Kumon, R. E., Deng, C. X., and Wang, X. (2011). Frequency-domain Analysis of Photoacoustic Imaging Data from Prostate Adenocarcinoma Tumors in a Murine Model. Ultrasound Med. Biol. 37, 834–839. doi:10.1016/j.ultrasmedbio.2011.01.012
Kwak, K.-C., and Pedrycz, W. (2005). Face Recognition Using a Fuzzy Fisherface Classifier. Pattern Recognition 38, 1717–1732. doi:10.1016/j.patcog.2005.01.018
Lediju Bell, M. A. (2020). Photoacoustic Imaging for Surgical Guidance: Principles, Applications, and Outlook. J. Appl. Phys. 128, 060904. doi:10.1063/5.0018190
Lediju Bell, M. A., and Shubert, J. (2018). Photoacoustic-based Visual Servoing of a Needle Tip. Sci. Rep. 8, 15519. doi:10.1038/s41598-018-33931-9
Li, M., Tang, Y., and Yao, J. (2018). Photoacoustic Tomography of Blood Oxygenation: a Mini Review. Photoacoustics 10, 65–73. doi:10.1016/j.pacs.2018.05.001
Moore, M. J., Hysi, E., Fadhel, M. N., El-Rass, S., Xiao, Y., Wen, X. Y., et al. (2019). Photoacoustic F-Mode Imaging for Scale Specific Contrast in Biological Systems. Commun. Phys. 2, 1–10. doi:10.1038/s42005-019-0131-y
Shen, J., Zhou, C.-P., Zhong, X.-M., Guo, R.-M., Griffith, J. F., Cheng, L.-N., et al. (2010). Mr Neurography: T1 and T2 Measurements in Acute Peripheral Nerve Traction Injury in Rabbits. Radiology 254, 729–738. doi:10.1148/radiol.09091223
Shubert, J., and Lediju Bell, M. A. (2018). Photoacoustic Imaging of a Human Vertebra: Implications for Guiding Spinal Fusion Surgeries. Phys. Med. Biol. 63, 144001. doi:10.1088/1361-6560/aacdd3
Strohm, E. M., Berndl, E. S. L., and Kolios, M. C. (2013). Probing Red Blood Cell Morphology Using High-Frequency Photoacoustics. Biophysical J. 105, 59–67. doi:10.1016/j.bpj.2013.05.037
Taruttis, A., Rosenthal, A., Kacprowicz, M., Burton, N. C., and Ntziachristos, V. (2014). Multiscale Multispectral Optoacoustic Tomography by a Stationary Wavelet Transform Prior to Unmixing. IEEE Trans. Med. Imaging 33, 1194–1202. doi:10.1109/tmi.2014.2308578
Tzoumas, S., and Ntziachristos, V. (2017). Spectral Unmixing Techniques for Optoacoustic Imaging of Tissue Pathophysiology. Phil. Trans. R. Soc. A. 375, 20170262. doi:10.1098/rsta.2017.0262
Wang, L., Zhu, X., Yang, B., Guo, J., Liu, S., Li, M., et al. (2018). Accelerating Nearest Neighbor Partitioning Neural Network Classifier Based on Cuda. Eng. Appl. Artif. Intelligence 68, 53–62. doi:10.1016/j.engappai.2017.10.023
Wang, S., Tao, C., Yang, Y., Wang, X., and Liu, X. (2015). Theoretical and Experimental Study of Spectral Characteristics of the Photoacoustic Signal from Stochastically Distributed Particles. IEEE Trans. Ultrason. Ferroelect., Freq. Contr. 62, 1245–1255. doi:10.1109/tuffc.2014.006806
Weber, J., Beard, P. C., and Bohndiek, S. E. (2016). Contrast Agents for Molecular Photoacoustic Imaging. Nat. Methods 13, 639–650. doi:10.1038/nmeth.3929
Weissleder, R., and Ntziachristos, V. (2003). Shedding Light onto Live Molecular Targets. Nat. Med. 9, 123–128. doi:10.1038/nm0103-123
Wiacek, A., Wang, K. C., and Bell, M. A. L. (2019). Techniques to Distinguish the Ureter from the Uterine Artery in Photoacoustic-Guided Hysterectomies. Photons Plus Ultrasound: Imaging and Sensing 2019 10878, 108785K. doi:10.1117/12.2510716
Wiacek, A., Wang, K. C., Wu, H., and Bell, M. A. L. (2020). Dual-wavelength Photoacoustic Imaging for Guidance of Hysterectomy Procedures. Adv. Biomed. Clin. Diagn. Surg. Guidance Syst. XVIII 11229, 112291D. doi:10.1117/12.2544906
Wiacek, A., and Lediju Bell, M. A. (2021). Photoacoustic-guided Surgery from Head to Toe [Invited]. Biomed. Opt. Express 12, 2079–2117. doi:10.1364/boe.417984
Wright, J., Yang, A. Y., Ganesh, A., Sastry, S. S., and Ma, Y. (2008). Robust Face Recognition via Sparse Representation. IEEE Trans. Pattern Anal. Mach Intell. 31, 210–227. doi:10.1109/TPAMI.2008.79
Xia, W., West, S. J., Nikitichev, D. I., Ourselin, S., Beard, P. C., and Desjardins, A. E. (2016). Interventional Multispectral Photoacoustic Imaging with a Clinical Linear Array Ultrasound Probe for Guiding Nerve Blocks. Photons Plus Ultrasound: Imaging and Sensing 9708, 97080C. doi:10.1117/12.2209047
Yang, J., Chu, D., Zhang, L., Xu, Y., and Yang, J. (2013). Sparse Representation Classifier Steered Discriminative Projection with Applications to Face Recognition. IEEE Trans. Neural Netw. Learn. Syst. 24, 1023–1035. doi:10.1109/tnnls.2013.2249088
Keywords: photoacoustic imaging, spectral unmixing, principal component analyses (PCA), frequency analyis, nearest neighbor classification (NNC)
Citation: Gonzalez E, Graham C and Lediju Bell M (2021) Acoustic Frequency-Based Approach for Identification of Photoacoustic Surgical Biomarkers. Front. Photonics 2:716656. doi: 10.3389/fphot.2021.716656
Received: 28 May 2021; Accepted: 03 September 2021;
Published: 15 October 2021.
Edited by:
Sergio Fantini, Tufts University, United StatesReviewed by:
Srivalleesha Mallidi, Tufts University, United StatesCopyright © 2021 Gonzalez, Graham and Lediju Bell. This is an open-access article distributed under the terms of the Creative Commons Attribution License (CC BY). The use, distribution or reproduction in other forums is permitted, provided the original author(s) and the copyright owner(s) are credited and that the original publication in this journal is cited, in accordance with accepted academic practice. No use, distribution or reproduction is permitted which does not comply with these terms.
*Correspondence: Eduardo A. Gonzalez , ZWdvbnphMzFAamhtaS5lZHU=
Disclaimer: All claims expressed in this article are solely those of the authors and do not necessarily represent those of their affiliated organizations, or those of the publisher, the editors and the reviewers. Any product that may be evaluated in this article or claim that may be made by its manufacturer is not guaranteed or endorsed by the publisher.
Research integrity at Frontiers
Learn more about the work of our research integrity team to safeguard the quality of each article we publish.