 Lucie Polášková1
 Ondřej Slanař
 Martin Šíma
- 1Department of Clinical Pharmacy, Military University Hospital Prague, Prague, Czechia
- 2Department of Applied Pharmacy, Faculty of Pharmacy, Masaryk University, Brno, Czechia
- 3Department of Clinical Pharmacy, Bulovka University Hospital, Prague, Czechia
- 4Department of Pharmacology, First Faculty of Medicine, Charles University and General University Hospital in Prague, Prague, Czechia
Aim: The aim of this study was to develop a vancomycin population pharmacokinetic model in adult obese patients and propose covariate-based dosing individualization in order to maximize the achievement of the newly recommended PK/PD target, according to a revised consensus guideline from 2020.
Methods: Therapeutic drug monitoring data from initial vancomycin therapy (first 3 days of treatment) in adult obese (BMI ≥ 30 kg/m2) patients from 2013 to 2022 were analyzed using a non-linear mixed-effects modeling method, and Monte Carlo simulations were then used to find the optimal dosage maximizing the PK/PD target attainment.
Results: A total of 147 vancomycin serum levels obtained from 138 patients were included in the analysis. Based on the covariate model diagnosis among all tested variables, no reliable predictor of vancomycin volume of distribution (Vd) was identified, while clearance (CL) was positively correlated with eGFR and lean body mass. Creatinine-based eGFR predicted vancomycin CL better than cystatin C-based eGFR. The median (interquartile range) value from conditional modes of individual estimates of Vd, CL, and elimination half-life in our population was 74.0 (70.5–75.4) L, 6.65 (4.95–8.42) L/h, and 7.7 (6.0–10.0) h, respectively.
Conclusion: We proposed dosing individualization based on the covariate found in order to maximize the achievement of the newly recommended PK/PD target of the AUC/MIC ratio of 400–600. Clinical pharmacy/pharmacology interventions may lead to an improvement in vancomycin dosing with a reflection in PK/PD target attainment.
1 Introduction
Vancomycin is a glycopeptide antibiotic indicated for the treatment of patients with suspected or proven invasive Gram-positive infections, including methicillin-resistant Staphylococcus aureus (MRSA). Because it is a large compound with a molecular weight of approximately 1,450 Da, it is not absorbed efficiently after oral administration and must be administered intravenously to treat systemic infections (Rybak et al., 2009). After administration, vancomycin quickly penetrates various body fluids and tissues, with a volume of distribution (Vd) ranging from 0.4 to 1 L/kg (Rybak, 2006). The majority of vancomycin doses are excreted unchanged via glomerular filtration, with an elimination half-life (t1/2) of 6–12 h, which can be significantly prolonged in patients with renal insufficiency (Rybak, 2006). Therefore, vancomycin dosing must be adjusted according to renal functional status (Sima et al., 2018b). The ratio of the 24-h area under the concentration-time profile (AUC24) to the minimal inhibitory concentration (MIC) of ≥400 was associated with a successful outcome in patients with MRSA pneumonia (Moise-Broder et al., 2004), and therefore, this value was generally considered the most appropriate pharmacokinetic/pharmacodynamics (PK/PD) parameter for vancomycin treatment. To achieve this PK/PD target and prevent vancomycin toxicity, therapeutic drug monitoring (TDM) was traditionally used in widespread clinical practice when promoting trough vancomycin levels in the range of 15–20 mg/L as a surrogate marker for optimal vancomycin exposure (Rybak et al., 2009). However, in light of new studies showing, for example, that many patients with vancomycin trough levels in the range of 15–20 mg/L were overexposed, a revised consensus guideline by the American Society of Health-System Pharmacists, the Infectious Diseases Society of America, the Pediatric Infectious Diseases Society, and the Society of Infectious Diseases Pharmacists was published in 2020 (Rybak et al., 2020). This guideline strongly recommends using the direct PK/PD target of an AUC24 of 400–600 mg h/L (assuming a MIC of 1 mg/L) instead of trough levels of 15–20 mg/L.
Appropriate vancomycin exposure should be achieved early during the course of therapy, preferably within the first 24–48 h. In clinical routines, it is common practice to measure vancomycin concentrations after reaching the expected steady state, i.e., usually prior to the fourth or fifth dose. Therefore, most studies addressing the PK and PK-based dosing of vancomycin in clinical practice focus on maintenance dosing in steady-state, while data describing the initial phase of pharmacotherapy are lacking.
Obesity, defined as a body mass index (BMI) ≥ 30 kg/m2, is often attributed to weight gain caused by increased deposition of adipose tissue, but obesity also involves a number of physiological changes, including increases in muscle mass and connective tissue (Craig, 1998). The hydrophilicity of vancomycin, together with the increase in adipose tissue and muscle mass in obesity, is likely to lead to greater variability in Vd compared with non-obese patients (Grace, 2012). In addition, increased blood flow caused by the increased cardiac output and blood volume in obese patients may also contribute to this phenomenon (Smit et al., 2018). Overweight and obese patients also often exhibit augmented glomerular filtration rate and renal plasma flow, which is attributed to compensatory renal vasodilation overcoming increased tubular sodium reabsorption (Chagnac et al., 2000).
These three points—i.e., PK/PD target correction, lack of data for the initial phase of therapy, and possible changes in PK in obesity—justify the need to address the initial dosing of vancomycin in obese patients. Therefore, the aim of this study was to develop a vancomycin population PK model based on TDM data during initial treatment in adult obese patients and propose covariate-based dosing individualization, maximizing the achievement of the newly recommended vancomycin PK/PD target by a revised consensus guideline from 2020.
2 Methods
2.1 Study design
An open-label retrospective observational study was performed on obese adult patients (age ≥18 years; body mass index, BMI ≥30 kg/m2) treated with vancomycin intravenous infusion admitted to mixed wards of the Military University Hospital in Prague from January 2013 to December 2022. Patients with at least one measured vancomycin serum concentration during initial therapy (the first 3 days of treatment) were included. The exclusion criteria were extracorporeal life support and renal replacement therapy. The study was approved by the local Ethics Committee of the Military University Hospital in Prague under registration number 108/17-42/2022 and followed the principles laid down in the Declaration of Helsinki. Since the retrospective nature of this study involved only the analysis of routine clinical data, study-specific informed consent was waived. The collection of anonymized data and its processing are in the public interest.
2.2 Data retrieval
The clinical records of all evaluated patients were reviewed to collect information concerning age, gender, body weight, height, and serum levels of creatinine and urea. If available, the serum cystatin C level was also collected. The body mass index (BMI) was calculated as body weight (kg) divided by the square of height (m). The body surface area (BSA) and lean body mass (LBM) were calculated using Du Bois and Boer formulas, respectively (Boer, 1984; Du Bois and Du Bois, 1989). Both creatinine- and cystatin C-based (if available) glomerular filtration rates (eGFR) were estimated according to the Chronic Kidney Disease Epidemiology Collaboration (CKD-EPI) formula for each patient (Inker et al., 2012). The vancomycin-dosing regimen, including administration times and infusion rates, was recorded. Vancomycin serum concentrations were determined as a routine part of the TDM monitoring procedure at the Department of Clinical Biochemistry of the Military University Hospital in Prague, and sampling times were also recorded. Vancomycin levels in the serum were determined using the immunoturbidimetric method based on the kinetic interaction of microparticles in solution (KIMS) on the Roche Cobas 8,000 Analyzer (Roche, Basel, Switzerland). The lower limits of detection and quantitation were 1.5 and 4.0 mg/L, respectively, and the measuring range was from 4.0 to 80.0 mg/L. Only levels measured during initial vancomycin therapy (first 3 days of treatment) were included in the PK analysis. If available, the MIC value of vancomycin for the isolated bacterial strain was also recorded. All microbiological samples were processed at the Department of Clinical Microbiology of the Military University Hospital in Prague. Antimicrobial susceptibility testing was performed using the disc diffusion method and broth microdilution method. Results were interpreted according to the European Committee on Antimicrobial Susceptibility Testing (European Committee on Antimicrobial Susceptibility Testing, 2022).
2.3 Population PK analysis
Serum concentration–time profiles of vancomycin were analyzed using the non-linear mixed-effects modeling method. The model parameters were assumed to be log-normally distributed and were estimated by maximum likelihood using the stochastic approximation expectation maximization (SAEM) algorithm within MonolixSuite software version 2021R2 (Lixoft SAS, Antony, France).
For the structural model, one- and two-compartment models with first-order and Michaelis–Menten elimination kinetics were tested. Log-normally distributed inter-individual variability terms with estimated variance were tested on each PK parameter. Constant, proportional, and combined error models were tested for the residual error model. The most appropriate model was selected based on the objective function value (OFV), Akaike information criterion (AIC), Bayesian information criterion (BIC) differences, adequacy of the goodness-of-fit (GOF) plots, and low relative standard errors (R.S.Es) of the estimated PK parameters.
Age, BW, height, LBM, BSA, BMI, serum creatinine, urea, and eGFR were tested as continuous covariates, while gender and diagnosis were tested as categorical covariates of PK parameters. A preliminary graphical assessment and univariate association using Pearson’s correlation test of the effects of covariates on estimated PK parameters were made. The covariates with p < 0.05 were considered for the covariate model. Afterward, a stepwise covariate modeling procedure was performed. For model selection, forward addition and backward elimination methods were used. In the forward addition, a decrease in the OFV of more than 3.84 points between nested models (p < 0.05) was considered statistically significant, assuming a χ2 distribution. In backward elimination, covariates were retained in the model if the difference in the OFV was greater than 6.64 points between nested models (p < 0.01). Additional criteria for model selection were reasonably low R.S.E. values of the estimates of model parameters, the physiological plausibility of the obtained parameter values and the covariates found, and the absence of bias in GOF plots.
Model adequacy was evaluated using GOF plots. For both the structural (non-covariate) model and final covariate model, observed concentrations were plotted against individual and population predictions; the population-weighted residuals (PWRES) were plotted against time and population predictions; and the normalized prediction distribution errors (NPDEs) were plotted against time and population predictions. To evaluate the stability of the model, a bootstrap analysis was performed. In this procedure, 250 replicates of the original data were generated, and the parameter estimates for each of the 250 samples were re-estimated using the R package Rsmlx for MonolixSuite (Lixoft SAS, Antony, France) in the final model. The median and 95% confidence intervals (CI) obtained for each parameter estimated for bootstrap samples were compared with the estimates in the final model.
2.4 Monte Carlo simulations
Monte Carlo simulations (250 replicates of the original dataset) based on the final population PK model were performed to generate the theoretical distribution of areas under the vancomycin concentration–time curves (AUC) during initial treatment (first 60 h) using SimulX version 2021 (Lixoft SAS, Antony, France). The whole study population was stratified according to the covariates found (eGFR of < 0.5, 0.5–1, 1–1.5, and 1.5–2.13 and > 2.13 mL/s/1.73 m2, and LBM of < 70 and > 70 kg), and the administration of various vancomycin dosing regimens was simulated in each subpopulation. Considering a usual MIC of 1 mg/L, vancomycin AUC over 24 h of 400–600 mg h/L was elected as an optimal PK/PD target (Rybak et al., 2020), and a vancomycin dosing regimen showing the highest probability of the target attainment was identified for each subpopulation.
2.5 Calculations and statistics
Vancomycin t1/2 was calculated from Vd and clearance (CL) values using the following formula: t1/2 = 0.693 × Vd/CL. Descriptive parameter medians and interquartile range (IQR) were calculated using MS Excel 2013 (Microsoft Corporation, Redmond, United States). The Mann–Whitney U-test was used to compare vancomycin loading doses (LDs)with and without the guidance of clinical pharmacists and compare trough levels reached after loading dose administration. The linear regression model was used to evaluate the relationships between vancomycin PK parameters (Vd and CL) and continuous variables (BW, LBM, BSA, BMI, creatinine, and cystatin C-based eGFR). GraphPad Prism software version 8.2.1 (GraphPad Inc., La Jolla, CA, USA) was used for all comparisons, and p-levels <0.05 were considered statistically significant.
3 Results
3.1 Study population
A total of 138 patients (82 males and 56 females) were enrolled in the study. Their demographic and laboratory characteristics are summarized in Table 1. There was a broad spectrum of infection severities and origins. Patients received vancomycin to treat infections of the central nervous system (n = 46; 33%), sepsis (n = 25; 18%), orthopedic (n = 21; 15%), ocular (n = 12; 9%), skin (n = 8; 6%), or other infections (n = 26; 19%), such as pneumonia, bacteriuria, bacteremia, endocarditis, or intra-abdominal infection. The most frequent infectious pathogens in this study were various strains of Staphylococcus spp. (aureus, haemolyticus, hominis, capitis, epidermidis, and warneri), Enterococcus spp. (faecalis, faecium, and cloacae), Klebsiella pneumoniae, and Streptococcus agalactiae. The median (min–max) and modus values of the MIC were 1 (≤0.5–2) and 1 mg/L, respectively.
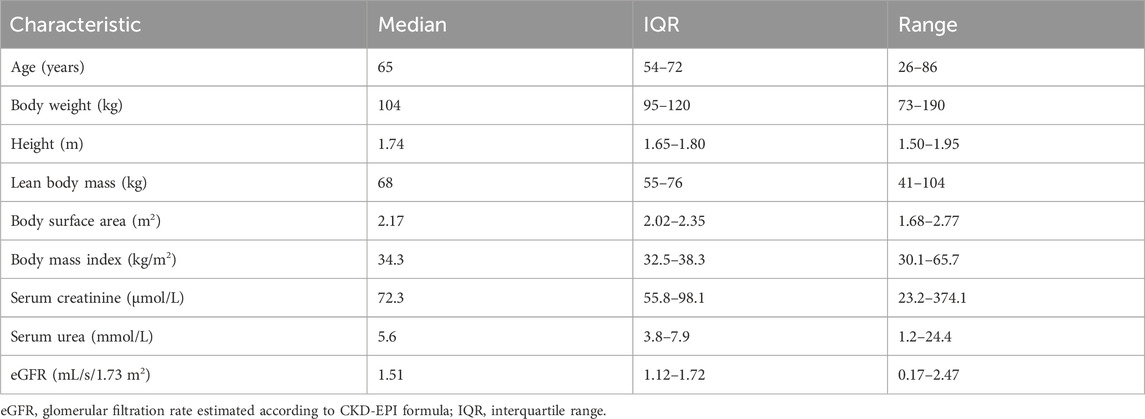
Table 1. Demographic and laboratory data of the patients (n = 138).
A vancomycin LD of 1–4 g (median 2.5 g) via a 0.5–7-h (median 5-h) intravenous infusion was administered to 122 patients. A maintenance dose (MD) ranging from 0.5 to 1.5 g (median 1 g) was administered every 6, 8, 12, or 24 h via a 1–3-h (median 2-h) intravenous infusion. In nine cases, vancomycin MD was administered as a continuous infusion of 1–4 g (median 2 g) per day. LDs administered on the advice of clinical pharmacists were significantly higher than those administered without consulting this service, which was subsequently mirrored in the significant difference in trough levels achieved after these LDs (Figure 1). Median trough levels after LD with and without the guidance of clinical pharmacists were in and out of the recommended therapeutic range for vancomycin troughs (15–20 mg/L), respectively (Rybak et al., 2020).
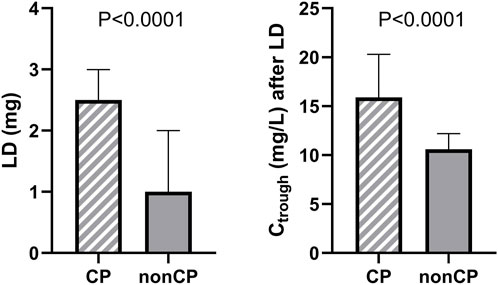
Figure 1. Comparison of vancomycin LDs administered with and without the guidance of clinical pharmacists (CP) and comparison of vancomycin trough levels (Ctrough) reached after these LD administrations.
A total of 147 vancomycin serum concentrations were included in the PK analysis (1–2 per patient), where 11 concentration points (7.5%) were taken as a peak (sample collection up to 2 h after infusion completion), 124 concentration points (84.4%) were taken as a trough level (0–1 h before the next dose is administered), and 12 samples (8.2%) were taken in the course of the dosing interval (with an exact record of the time of sampling).
3.2 Population pharmacokinetic analysis
A one-compartment model with linear elimination kinetics best-fitted vancomycin concentration–time data. A constant error model was the most accurate for the description of residual and interpatient variability. The PK model was parametrized in terms of Vd and CL.
The preliminary graphical assessment showed only a very weak relationship between BMI and vancomycin Vd, whereas the other body size descriptors (BW, LBM, and BSA) were found to be without statistical significance (Figure 2A), which is reflected in the final model, where covariate diagnostics found that none of the covariates tested reliably predicted vancomycin Vd. Based on a preliminary graphical assessment, vancomycin CL was positively related to eGFR, BW, height, LBM, and BSA and negatively related to serum creatinine and urea. Covariate model diagnostics showed that among all tested variables, vancomycin CL was best predicted using eGFR and LBM. In a subgroup of patients in whom cystatin C was also measured (n = 46), we compared the predictive performance of both creatinine- and cystatin C-based eGFR, with creatinine-based eGFR proved to be a better predictor of vancomycin CL in this case (Figure 2B).
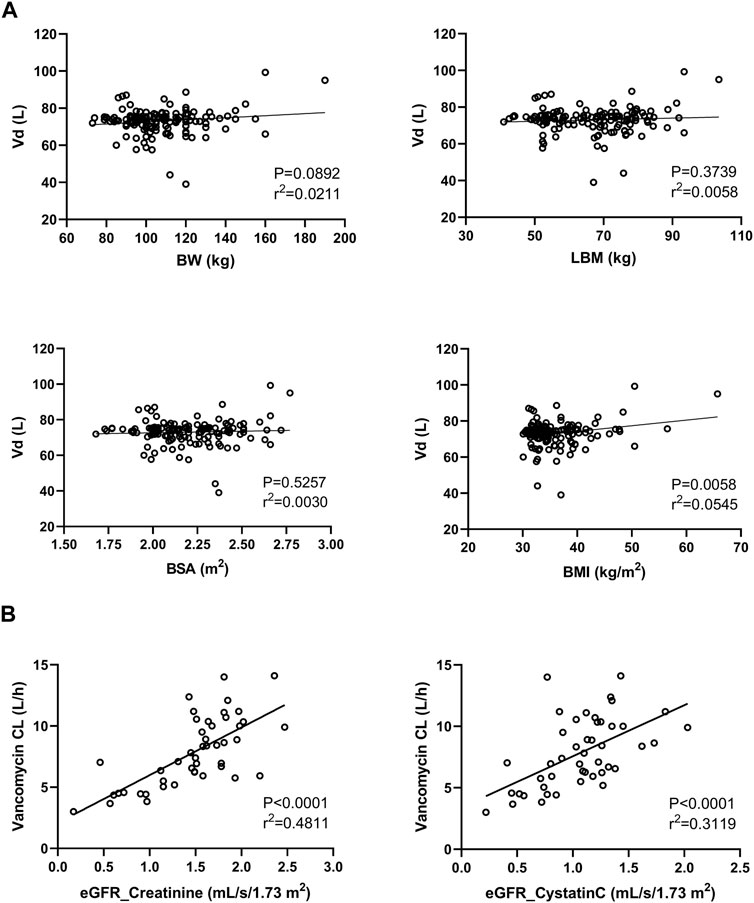
Figure 2. Relationship between the vancomycin volume of distribution (Vd) and body size descriptors (BW, body weight; LBM, lean body mass; BSA, body surface area; and BMI, body mass index) (A). Relationship between vancomycin clearance (CL) and both creatinine- and cystatin C-based estimations of the glomerular filtration rate (B).
The population PK estimates and bootstrap results in the final population model are summarized in Table 2.
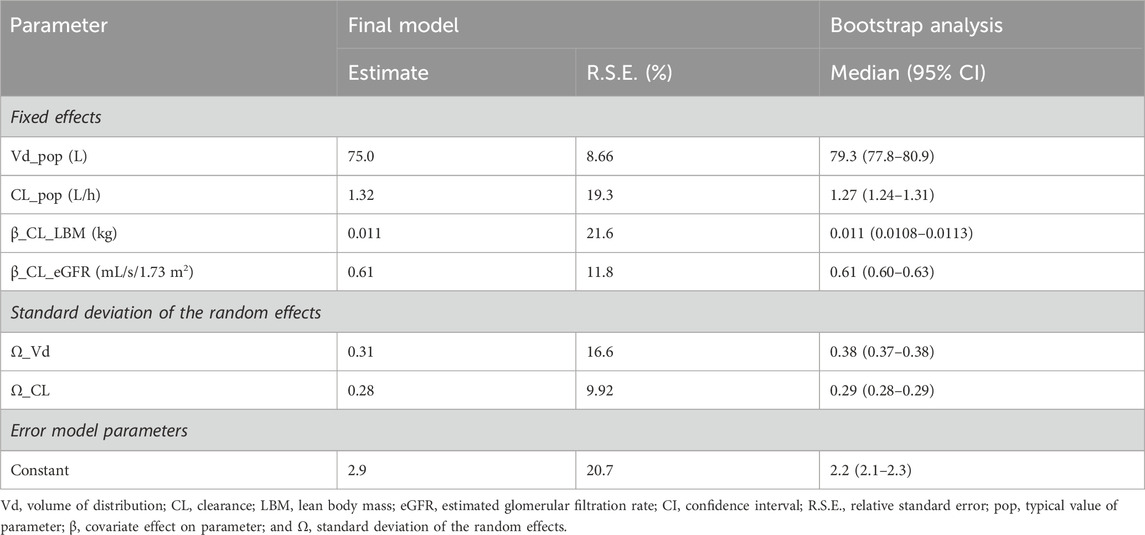
Table 2. Estimates of the final vancomycin population pharmacokinetic model and bootstrap results based on 250 simulations.
The final equations describing the relationships between vancomycin PK parameters and their covariates are as follows:
where pop represents the typical value of the parameter, β represents the covariate effect on the parameter, LBM is the lean body mass according to the Boer formula, and eGFR is the estimated glomerular filtration rate according to the creatinine-based CKD-EPI formula.
In our study population, the median (interquartile range) values from individual estimates of Vd, CL, and t1/2 expressed as conditional modes were 74.0 (70.5–75.4) L, 6.65 (4.95–8.42) L/h, and 7.7 (6.0–10.0) h, respectively.
The diagnostic GOF plots for the final covariate model did not indicate major deviations (Figures 3, 4). As shown in Table 2, the R.S.E. (maximum 21.6%) revealed that all PK parameters in the model were precisely estimated. All median parameter values in the bootstrap procedure were consistent with the values obtained in the final model fit, indicating the reliability of the parameter and the random-effect estimates.
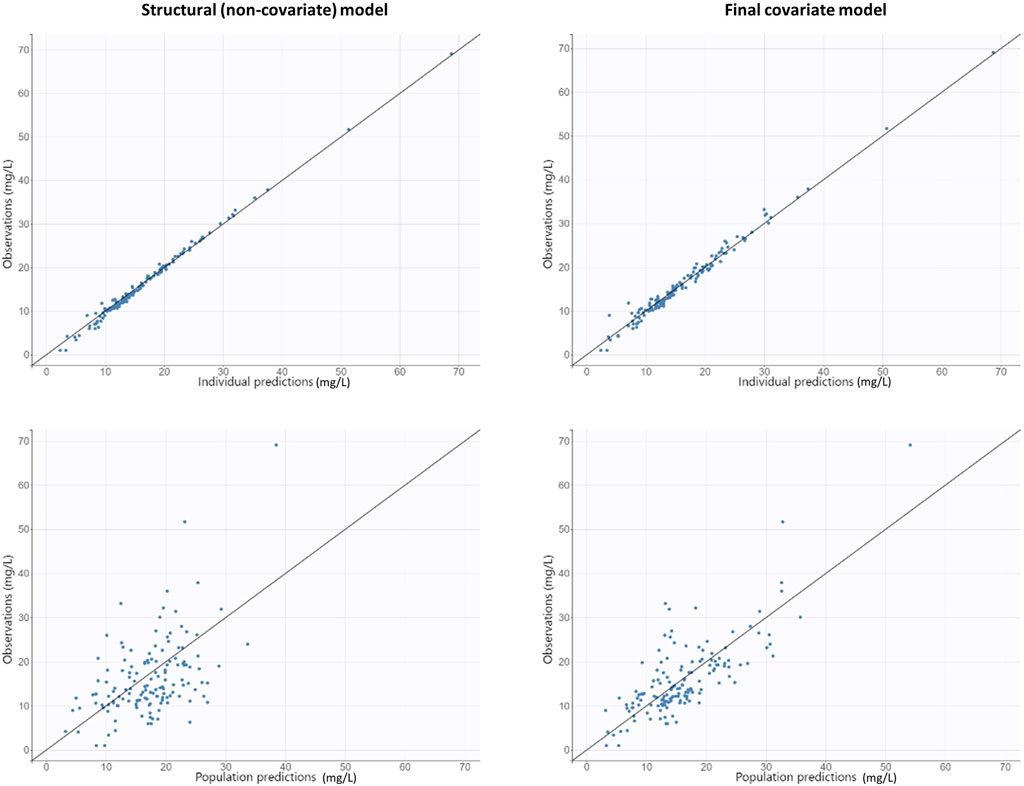
Figure 3. Goodness-of-fit plots obtained from both the structural (non-covariate) and final covariate models for vancomycin: population and individual predictions against observed concentrations.
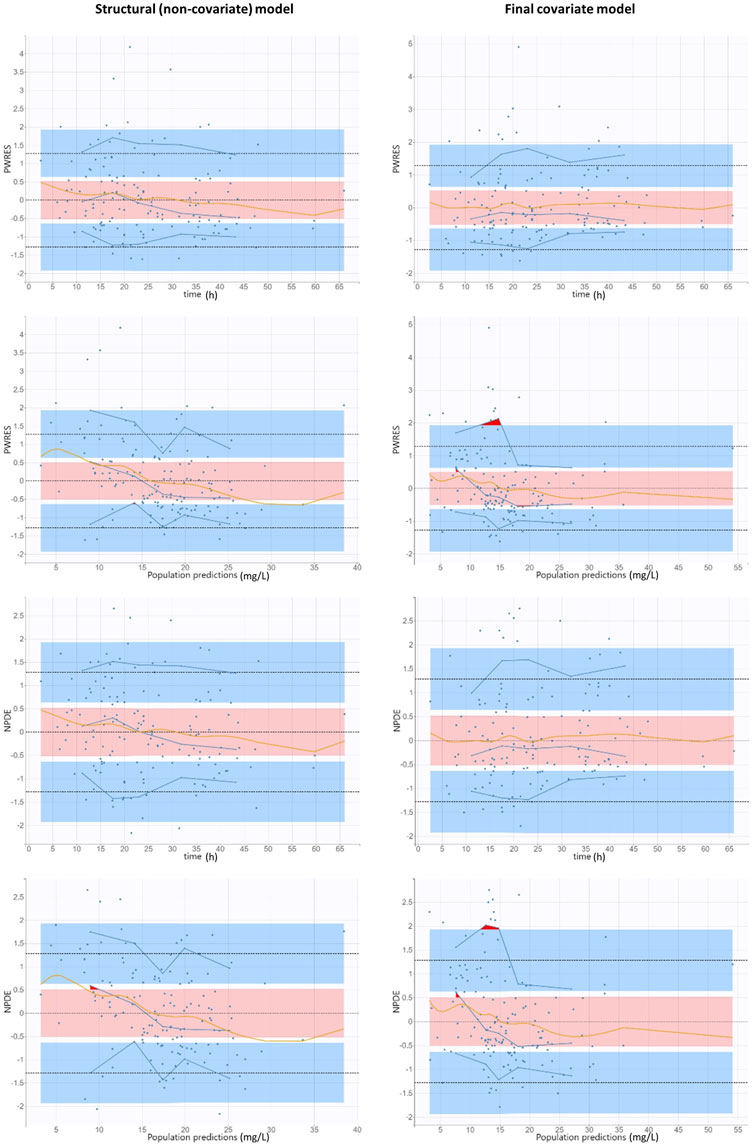
Figure 4. Goodness-of-fit plots obtained from both the structural (non-covariate) and final covariate models for vancomycin: population-weighted residuals and normalized prediction distribution errors versus time after vancomycin dose and versus population predictions. Solid blue lines represent the 10th, 50th, and 90th percentiles of the observed data. Shaded regions represent 95% confidence interval around the 10th (below blue region), 50th (pink region), and 90th (above blue region) percentiles of the simulated data. The observations are represented by blue dots. Orange curves represent smoothing splines. Outliers (empirical percentiles outside the prediction intervals) are marked with red areas.
3.3 Monte Carlo simulations
Table 3 summarizes the covariate-based dosing individualization of vancomycin in obese patients proposed based on Monte Carlo simulations (250 replicates of the original dataset, i.e., 34,500 simulated PK profiles) in order to maximize the probability of target attainment when AUC over 24 h of 400–600 mg h/L was considered a PK/PD target. Using the proposed posology, the overall probability of the target attainment was 57.7% in the whole population. For comparison, when we simulated the administration of vancomycin LD at 2,000 mg followed by the MD at 1,000 mg every 8 h (the most frequent initial dosage used in our real population), the probability of the target attainment was only 44.5%.
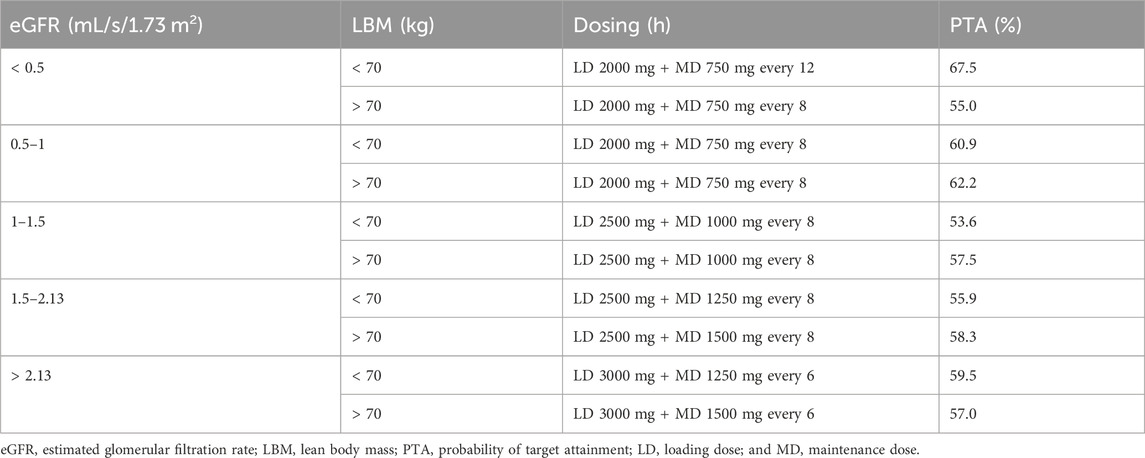
Table 3. Proposed individualization of vancomycin dosing in obese patients in order to maximize the probability of target attainment (AUC24 of 400–600 mg h/L).
4 Discussion
The World Health Organization reported the current obesity prevalence of more than 20% in adult inhabitants of the American and European regions and warned of an ever-increasing trend toward obesity (Boutari and Mantzoros, 2022). The need for appropriate dosing for obese patients will therefore inevitably be encountered with increasing frequency. Body weight gain in obese patients, accompanied by physiological changes, leads to alterations in drug pharmacokinetics, and thus, dosage adjustments in a weight-proportional manner may not be accurate. This is evidenced by studies in which higher trough concentrations of vancomycin were observed in overweight and obese patients in comparison with non-obese patients when dosing was based on total body weight (Miller et al., 2011; Heble et al., 2013). On the other hand, the administration of LDs is often omitted during vancomycin therapy in routine clinical practice, which can lead to significant drug underexposure at the beginning of the treatment. The situation is further complicated by the change in vancomycin TDM recommendations from trough-based to AUC24-based targeting of therapy, which requires either sampling multiple levels or evaluating AUC24 using software with Bayesian estimations. As shown in Figure 1, this issue can significantly improve the availability of clinical pharmacy/pharmacology services. It is important to note, however, that in order to set up vancomycin therapy correctly from the beginning, this consultation service must be requested before starting the treatment and not just for the interpretation of vancomycin levels after its measurement, as is usually the practice. Still, there is a need for an appropriate tool to optimize initial vancomycin therapy in the obese. Therefore, we decided to develop a population PK model focusing on the initial phase of therapy in this specific cohort.
Our PK model best fits concentration–time data using a one-compartment structure. Although this is consistent with findings in some other studies (Adane et al., 2015; Hong et al., 2015), a two-compartment arrangement is generally assumed in vancomycin (Sima et al., 2019). Vancomycin distribution half-life is approximately 7 min, and therefore, the distribution phase duration is approximately 0.5 h (Matzke et al., 1986). Since peak levels were drawn just after the completion of the vancomycin infusion (minimally 1 h), this sampling strategy could not capture the distribution phase. However, since it was described that the distribution phase contributes only negligibly to total vancomycin exposure (<10%) (Shingde et al., 2019), the use of the one-compartment model should not have a clinically relevant impact on the estimation of the PK/PD target attainment.
A typical value of vancomycin population Vd was 75 L in our study, and none of the tested variables was found to be its covariate (Figure 2A). This may seem to be a surprising finding, as it is generally accepted that vancomycin Vd is proportional to body weight (Rybak et al., 2020). However, it is physiologically plausible that the Vd of hydrophilic compounds does not increase proportionally with body weight in obese patients, in whom weight gain is mainly due to the deposition of adipose tissue. This phenomenon leads to high variability, which can overlay the relationship between Vd and body weight. Moreover, some other studies in obese patients corroborate our finding with weight-independent estimates of vancomycin Vd (Hong et al., 2015; Zhang et al., 2023).
In our population model, eGFR and LBM were identified as the most appropriate covariates of vancomycin CL based on the maximum reduction in OFV, RSE, and unexplained variability of this parameter. Exactly, vancomycin CL was calculated as follows:
Although cystatin C is recommended for measuring eGFR when creatinine-based estimates are not considered sufficiently accurate (Carrero et al., 2023) and is often described as superior for estimating the CL of drugs excreted via the kidney (Sima et al., 2017), it can be falsely elevated in obese patients (Carrero et al., 2023). On the other hand, low creatinine production in cachectic patients, which falsely overestimates creatinine-based eGFR, is not very relevant for obese patients.
Based on the final covariate PK model, we proposed the individualization of vancomycin dosing based on eGFR and LBM in order to improve the proportion of patients achieving the newly recommended PK/PD target of AUC24 of 400–600 mg h/L. Vancomycin posology at the beginning of the treatment should consist of both LD and MD administration. Traditionally, MD is derived from the CL of the drug, while the LD is calculated from its Vd. However, it is important to note that Vd only determines the peak level at the end of the distribution phase after drug administration, while for the AUC-targeted dosing, CL is the primary parameter determining the achievement of the PK/PD target. Therefore, although we did not observe any covariates of Vd in our study, our dosing proposal uses eGFR and LBM as covariates of CL to individualize both MD and LD (Table 3). Total daily doses in each eGFR category may appear to be higher than generally reported for normal-weight patients. However, this is consistent with the increase in total drug CL that is often described in obese patients (while a similar body weight-normalized CL is usually described) (Gouju and Legeay, 2023). The higher drug CL in obese patients can also be explained by some physiological changes during obesity, such as increased blood flow, activation of the renin–angiotensin system, and glomerular hyperfiltration (Gouju and Legeay, 2023). Dosing recommendations for vancomycin usually end with an eGFR category of ≥1.5 mL/s/1.73 m2. Since 52% of the patients in our study had an eGFR ≥1.5 mL/s/1.73 m2 and 5% of these even had ≥2.13 mL/s/1.73 m2, we were able to suggest individualization of vancomycin dosing for patients with increased and augmented renal CL, in whom very high daily doses are needed to achieve the PK/PD target. Using the proposed posology, the overall probability of target attainment was 57.7%, which may not seem enough. Nevertheless, for example, at the most commonly used dosage of LD 2000 mg + MD 1000 mg every 8 h, the probability of target attainment would be only 44.5%. It is important to recognize that vancomycin is a drug with highly variable pharmacokinetics and that the suggested dosing is only for initial treatment prior to the measurement of vancomycin levels (no later than the third day of therapy). Thereafter, dosing must, of course, be adjusted and guided using TDM.
We acknowledge several slight limitations arising from the retrospective nature of the study and the fact that we only assessed PK/PD target achievement and not clinical outcomes. Furthermore, the dosage is valid only under the assumption that the MIC of 1 mg/L is the most common value for staphylococcal infections. In the case of targeting different MIC values, doses need to be adjusted. On the other hand, MIC values are typically not available within the first 3 days of therapy in clinical routines, yet current evidence indicates that the vancomycin PK/PD target needs to be optimized early in the course of infection (Rybak et al., 2020). Therefore, targeting and maintaining the AUC24 values between 400 and 600 mg h/L is a generally accepted and widely used practice for the adjustment of vancomycin initial treatment.
5 Conclusion
We developed a vancomycin population PK model in adult obese patients, where eGFR and LBM were found to be the most predictive covariates of vancomycin CL. This covariate-based dosing individualization was proposed in order to maximize the achievement of the newly recommended PK/PD target according to a revised consensus guideline from 2020. Clinical pharmacy/pharmacology interventions may lead to an improvement in vancomycin dosing with reflection in PK/PD target attainment.
Data availability statement
The raw data supporting the conclusion of this article will be made available by the authors, without undue reservation.
Ethics statement
The studies involving humans were approved by the Ethics Committee of the Military University Hospital in Prague. The studies were conducted in accordance with the local legislation and institutional requirements. The ethics committee/institutional review board waived the requirement of written informed consent for participation from the participants or the participants’ legal guardians/next of kin because the retrospective nature of this study involved only analysis of routine clinical data.
Author contributions
LP: data curation, investigation, methodology, project administration, and writing–original draft. IM: conceptualization, data curation, investigation, project administration, and writing–review and editing. JG: methodology, supervision, validation, and writing–review and editing. OS: conceptualization, formal analysis, funding acquisition, supervision, validation, and writing–review and editing. MŠ: conceptualization, formal analysis, investigation, methodology, supervision, validation, and writing–original draft.
Funding
The authors declare that financial support was received for the research, authorship, and/or publication of this article. This study was supported by the Ministry of Health of Czech Republic Project MH CZ-DRO-VFN64165 and the Charles University Project Cooperatio (research area PHAR).
Acknowledgments
The authors are very grateful to the physicians, nurses, and other clinical pharmacists of Military University Hospital Prague for their cooperation in careful collecting samples for this study.
Conflict of interest
The authors declare that the research was conducted in the absence of any commercial or financial relationships that could be construed as a potential conflict of interest.
Publisher’s note
All claims expressed in this article are solely those of the authors and do not necessarily represent those of their affiliated organizations, or those of the publisher, the editors, and the reviewers. Any product that may be evaluated in this article, or claim that may be made by its manufacturer, is not guaranteed or endorsed by the publisher.
References
Adane, E. D., Herald, M., and Koura, F. (2015). Pharmacokinetics of vancomycin in extremely obese patients with suspected or confirmed Staphylococcus aureus infections. Pharmacotherapy 35, 127–139. doi:10.1002/phar.1531
Boer, P. (1984). Estimated lean body mass as an index for normalization of body fluid volumes in humans. Am. J. Physiol. 247, F632–F636. doi:10.1152/ajprenal.1984.247.4.F632
Boutari, C., and Mantzoros, C. S. (2022). A 2022 update on the epidemiology of obesity and a call to action: as its twin COVID-19 pandemic appears to be receding, the obesity and dysmetabolism pandemic continues to rage on. Metabolism 133, 155217. doi:10.1016/j.metabol.2022.155217
Carrero, J. J., Fu, E. L., Sang, Y., Ballew, S., Evans, M., Elinder, C. G., et al. (2023). Discordances between creatinine- and cystatin C-based estimated GFR and adverse clinical outcomes in routine clinical practice. Am. J. Kidney Dis. 82, 534–542. doi:10.1053/j.ajkd.2023.04.002
Chagnac, A., Weinstein, T., Korzets, A., Ramadan, E., Hirsch, J., and Gafter, U. (2000). Glomerular hemodynamics in severe obesity. Am. J. Physiol. Ren. Physiol. 278, F817–F822. doi:10.1152/ajprenal.2000.278.5.F817
Craig, W. A. (1998). Pharmacokinetic/pharmacodynamic parameters: rationale for antibacterial dosing of mice and men. Clin. Infect. Dis. 26, 1–10. doi:10.1086/516284
Du Bois, D., and Du Bois, E. F. (1989). A formula to estimate the approximate surface area if height and weight be known. 1916. Nutrition 5, 303–313.
Ducharme, M. P., Slaughter, R. L., and Edwards, D. J. (1994). Vancomycin pharmacokinetics in a patient population: effect of age, gender, and body weight. Ther. Drug Monit. 16, 513–518. doi:10.1097/00007691-199410000-00013
European Committee on Antimicrobial Susceptibility Testing (2022). Clinical breakpoints - breakpoints and guidance. Available at: https://www.eucast.org/fileadmin/src/media/PDFs/EUCAST_files/Breakpoint_tables/v_12.0_Breakpoint_Tables.pdf (Accessed November 22, 2023).
Gouju, J., and Legeay, S. (2023). Pharmacokinetics of obese adults: not only an increase in weight. Biomed. Pharmacother. 166, 115281. doi:10.1016/j.biopha.2023.115281
Grace, E. (2012). Altered vancomycin pharmacokinetics in obese and morbidly obese patients: what we have learned over the past 30 years. J. Antimicrob. Chemother. 67, 1305–1310. doi:10.1093/jac/dks066
Heble, D. E., Mcpherson, C., Nelson, M. P., and Hunstad, D. A. (2013). Vancomycin trough concentrations in overweight or obese pediatric patients. Pharmacotherapy 33, 1273–1277. doi:10.1002/phar.1321
Hong, J., Krop, L. C., Johns, T., and Pai, M. P. (2015). Individualized vancomycin dosing in obese patients: a two-sample measurement approach improves target attainment. Pharmacotherapy 35, 455–463. doi:10.1002/phar.1588
Inker, L. A., Schmid, C. H., Tighiouart, H., Eckfeldt, J. H., Feldman, H. I., Greene, T., et al. (2012). Estimating glomerular filtration rate from serum creatinine and cystatin C. N. Engl. J. Med. 367, 20–29. doi:10.1056/NEJMoa1114248
Matzke, G. R., Zhanel, G. G., and Guay, D. R. (1986). Clinical pharmacokinetics of vancomycin. Clin. Pharmacokinet. 11, 257–282. doi:10.2165/00003088-198611040-00001
Miller, M., Miller, J. L., Hagemann, T. M., Harrison, D., Chavez-Bueno, S., and Johnson, P. N. (2011). Vancomycin dosage in overweight and obese children. Am. J. Health Syst. Pharm. 68, 2062–2068. doi:10.2146/ajhp110107
Moise-Broder, P. A., Forrest, A., Birmingham, M. C., and Schentag, J. J. (2004). Pharmacodynamics of vancomycin and other antimicrobials in patients with Staphylococcus aureus lower respiratory tract infections. Clin. Pharmacokinet. 43, 925–942. doi:10.2165/00003088-200443130-00005
Pai, M. P. (2012). Drug dosing based on weight and body surface area: mathematical assumptions and limitations in obese adults. Pharmacotherapy 32, 856–868. doi:10.1002/j.1875-9114.2012.01108.x
Rybak, M. J. (2006). The pharmacokinetic and pharmacodynamic properties of vancomycin. Clin. Infect. Dis. 42 (Suppl. 1), S35–S39. doi:10.1086/491712
Rybak, M. J., Le, J., Lodise, T. P., Levine, D. P., Bradley, J. S., Liu, C., et al. (2020). Therapeutic monitoring of vancomycin for serious methicillin-resistant Staphylococcus aureus infections: a revised consensus guideline and review by the American society of health-system pharmacists, the infectious Diseases society of America, the pediatric infectious Diseases society, and the society of infectious Diseases pharmacists. Am. J. Health Syst. Pharm. 77, 835–864. doi:10.1093/ajhp/zxaa036
Rybak, M. J., Lomaestro, B. M., Rotschafer, J. C., Moellering, R. C., Craig, W. A., Billeter, M., et al. (2009). Therapeutic monitoring of vancomycin in adults summary of consensus recommendations from the American society of health-system pharmacists, the infectious Diseases society of America, and the society of infectious Diseases pharmacists. Pharmacotherapy 29, 1275–1279. doi:10.1592/phco.29.11.1275
Shingde, R. V., Graham, G. G., Reuter, S. E., Carland, J. E., Day, R. O., and Stocker, S. L. (2019). Comparison of the area under the curve for vancomycin estimated using compartmental and noncompartmental methods in adult patients with normal renal function. Ther. Drug Monit. 41, 726–731. doi:10.1097/FTD.0000000000000690
Sima, M., Bakhouche, H., Hartinger, J., Cikankova, T., and Slanar, O. (2019). Therapeutic drug monitoring of antibiotic agents: evaluation of predictive performance. Eur. J. Hosp. Pharm. 26, 85–88. doi:10.1136/ejhpharm-2017-001396
Sima, M., Hartinger, J., Cikankova, T., and Slanar, O. (2018a). Estimation of once-daily amikacin dose in critically ill adults. J. Chemother. 30, 37–43. doi:10.1080/1120009X.2017.1376818
Sima, M., Hartinger, J., Stenglova Netikova, I., and Slanar, O. (2018b). Creatinine clearance estimations for vancomycin maintenance dose adjustments. Am. J. Ther. 25, e602–e604. doi:10.1097/MJT.0000000000000616
Sima, M., Vodicka, M., Maresova, V., Salek, T., Cabala, R., and Slanar, O. (2017). Adherence with perindopril therapy: a pilot study using therapeutic drug monitoring of perindoprilat and an evaluation of the clearance estimation. Int. J. Clin. Pharm. 39, 1095–1100. doi:10.1007/s11096-017-0522-7
Smit, C., De Hoogd, S., Bruggemann, R. J. M., and Knibbe, C. a. J. (2018). Obesity and drug pharmacology: a review of the influence of obesity on pharmacokinetic and pharmacodynamic parameters. Expert Opin. Drug Metab. Toxicol. 14, 275–285. doi:10.1080/17425255.2018.1440287
Zhang, T., Krekels, E. H. J., Smit, C., Van Dongen, E. P. A., Bruggemann, R. J. M., and Knibbe, C. A. J. (2023). How to dose vancomycin in overweight and obese patients with varying renal (Dys)function in the novel era of AUC 400-600 mg·h/L-Targeted dosing. Clin. Pharmacokinet. 63, 79–91. doi:10.1007/s40262-023-01324-5
Keywords: clinical pharmacy, glomerular filtration rate, lean body mass, Monte Carlo simulation, non-linear mixed-effects modeling, obesity, therapeutic drug monitoring
Citation: Polášková L, Murínová I, Gregorová J, Slanař O and Šíma M (2024) Vancomycin population pharmacokinetics and dosing proposal for the initial treatment in obese adult patients. Front. Pharmacol. 15:1364681. doi: 10.3389/fphar.2024.1364681
Received: 02 January 2024; Accepted: 13 May 2024;
Published: 04 June 2024.
Edited by:
Pier Giorgio Cojutti, Sant’Orsola-Malpighi Polyclinic, ItalyReviewed by:
Shenghui Mei, Capital Medical University, ChinaJuan He, Shanghai Jiao Tong University, China
Copyright © 2024 Polášková, Murínová, Gregorová, Slanař and Šíma. This is an open-access article distributed under the terms of the Creative Commons Attribution License (CC BY). The use, distribution or reproduction in other forums is permitted, provided the original author(s) and the copyright owner(s) are credited and that the original publication in this journal is cited, in accordance with accepted academic practice. No use, distribution or reproduction is permitted which does not comply with these terms.
*Correspondence: Ondřej Slanař, b25kcmVqLnNsYW5hckBsZjEuY3VuaS5jeg==; Martin Šíma, bWFydGluLnNpbWFAbGYxLmN1bmkuY3o=
†ORCID: Ondřej Slanař, orcid.org/0000-0002-5357-7562; Martin Šíma, orcid.org/0000-0002-6541-738X