 Feng Liang
 Yimei Zhang
- Bethune International Peace Hospital, Shijiazhuang, China
Purpose: This study aimed to develop and validate a physiologically based pharmacokinetic (PBPK) model for osimertinib (OSI) to predict plasma trough concentration (Ctrough) and pulmonary EGFRm+ (T790M and L858R mutants) inhibition in Caucasian, Japanese, and Chinese populations. The PBPK model was also utilized to investigate inter-ethnic and inter-patient differences in OSI pharmacokinetics (PK) and determine optimal dosing regimens.
Methods: Population PBPK models of OSI for healthy and disease populations were developed using physicochemical and biochemical properties of OSI and physiological parameters of different groups. And then the PBPK models were validated using the multiple clinical PK and drug-drug interaction (DDI) study data.
Results: The model demonstrated good consistency with the observed data, with most of prediction-to-observation ratios of 0.8–1.25 for AUC, Cmax, and Ctrough. The PBPK model revealed that plasma exposure of OSI was approximately 2-fold higher in patients compared to healthy individuals, and higher exposure observed in Caucasians compared to other ethnic groups. This was primarily attributed to a lower CL/F of OSI in patients and Caucasian. The PBPK model displayed that key factors influencing PK and EGFRm+ inhibition differences included genetic polymorphism of CYP3A4, CYP1A2 expression, plasma free concentration (fup), albumin level, and auto-inhibition/induction on CYP3A4. Inter-patient PK variability was most influenced by CYP3A4 variants, fup, and albumin level. The PBPK simulations indicated that the optimal dosing regimen for patients across the three populations of European, Japanese, and Chinese ancestry was OSI 80 mg once daily (OD) to achieve the desired range of plasma Ctrough (328–677 nmol/L), as well as 80 mg and 160 mg OD for desirable pulmonary EGFRm+ inhibition (>80%).
Conclusion: In conclusion, this study’s PBPK simulations highlighted potential ethnic and inter-patient variability in OSI PK and EGFRm+ inhibition between Caucasian, Japanese, and Chinese populations, while also providing insights into optimal dosing regimens of OSI.
1 Introduction
Lung cancer is the leading cause of cancer-related deaths globally, contributing to approximately 18.4% of total cancer mortality (Thandra et al., 2021). The majority of lung cancer cases (over 80%) are classified as non-small cell lung cancer (NSCLC) (Fujimoto et al., 2019). Among NSCLC patients, the Epidermal Growth Factor Receptor (EGFR) has been identified as an effective therapeutic target (Liu et al., 2017). EGFR mutations (EGFRm+) are crucial oncogenic driver alterations in NSCLC, occurring in approximately 10%–15% of cases in Caucasians and with a higher frequency of up to 50% among East Asians. (Low et al., 2023). Exon 19 deletions and L858R mutations are the most common types, accounting for 90% of all EGFRm+ (Low et al., 2023). These EGFRm+ mutations still are highly responsive to EGFR tyrosine kinase inhibitors (TKIs) (Low et al., 2023). In 2004, the T790M mutation in exon 20 of EGFR was first discovered and described (Yasuda et al., 2013; Low et al., 2023). Although T790M mutations only account for approximately 5% of all EGFRm+ cases, around 50% of these mutations develop resistance to TKIs (Food and Drug Administration FDA, 2015).
Osimertinib (OSI) is an oral, third-generation EGFR TKI developed by AstraZeneca specifically for the treatment of NSCLC (Greig, 2016). It targets the EGFR T790M mutation present in NSCLC patients who have developed resistance to other EGFR TKIs. The approved dosage strength of OSI tablets for patients is 80 mg (Food and Drug Administration, 2022). The primary metabolic pathway of OSI is through CYP3A, with minor contributions from CYP1A2 and CYP2C9 (Food and Drug Administration FDA, 2015). Furthermore, OSI acts as a competitive inhibitor of CYP3A4 and significantly induces the expression of CYP3A4 (Food and Drug Administration FDA, 2015).
Variability in the plasma area under the curve (AUC) of AZ5104 (metabolite of OSI) has been observed among different ethnic groups, with a 10%–23% decrease in Asian NSCLC patients compared to Caucasian patients (Brown et al., 2017). Moreover, there is a high degree of variability in OSI pharmacokinetics (PK) of inter-patients, with a percentage coefficient of variation (%CV) exceeding 50% and, in some cases, even surpassing 80% (Planchard et al., 2016). The relationship between exposure and response demonstrates that optimal efficacy and safety are achieved when the plasma trough concentration (Ctrough) of OSI falls within the range of 164–338 ng/mL (equivalent to 328–677 nM) (Abu Hamdh and Nazzal, 2023), resulting in longer progression-free survival (PFS) and potentially mitigating certain adverse events. However, it is suggested that the pulmonary EGFRm+ inhibition could serve as a more valuable indicator for clinical efficacy, as it reflects the two EGFR m+ engagement in the targeted tissue.
The variability in the PK of OSI can be influenced by genetic polymorphism of the CYP3A4 enzyme, which plays a key role in OSI metabolism. Differences of CYP3A4 metabolism in ethnic groups can also contribute to PK variability. Another significant enzyme involved in OSI metabolism is CYP1A2 (Food and Drug Administration FDA, 2015). It has been demonstrated that smoking can induce CYP1A2 expression, leading to 1.55-fold higher enzyme activity in smokers compared to non-smokers (Dobrinas et al., 2011). Consequently, PK variability of OSI may occur in both smokers and non-smokers. Two clinical studies have indicated a statistically significant correlation between smoking and clinical efficacy (Rodier et al., 2022; Abu Hamdh and Nazzal, 2023). Additionally, auto-inhibition and induction effects of OSI on CYP3A4 can cause differences in PK between multiple doses (MD) and single dose (SD). OSI has a high plasma albumin binding rate of approximately 99%, with a 10-fold difference in the remaining fraction (fup) at different concentrations (Food and Drug Administration FDA, 2015). Variations in fup can result in greater PK variability. Moreover, several clinical studies have demonstrated that the level of plasma albumin, which predominantly binds to OSI (Food and Drug Administration FDA, 2015), can influence the distribution and clearance of OSI in NSCLC patients, and have a statistically significant correlation with the efficacy of OSI in NSCLC patients (Yokota et al., 2022; Ishikawa et al., 2023).
The current literature includes seven the clinical PK studies on OSI, but a systematic assessment of variability in systemic exposure has not been conducted. To this end, a physiologically based pharmacokinetic (PBPK) model was developed and validated in three populations (Caucasian, Japanese, and Chinese). The PBPK model is then used to evaluate inter-ethnic and inter-patients differences in plasma PK and the inhibition of pulmonary EGFRm+ (T790M and L858R). Furthermore, this study utilized the PBPK model to analyze the impact of several major sensitive factors, including CYP3A4 genetic polymorphism, CYP1A2 activity, auto-inhibition and induction, fup, and albumin level, on the plasma Ctrough of OSI and the inhibition of EGFRm+. Finally, the PBPK model was employed to determine an optimal dosing regimen for OSI in different populations based on the plasma Ctrough and pulmonary EGFRm+ inhibition threshold value for efficacy and safety.
2 Methods
2.1 Development and validation of the PBPK model in three ethnic populations
The PBPK models for healthy and diseased population in three ethnic groups were developed using the PK-Sim® (Version 10.0, Bayer Technology Services, Leverkusen, Germany).
2.1.1 The PBPK model for healthy population
Table 1 provides a summary of the modeling parameters utilized in the PBPK model (Dixon et al., 2003; Barter et al., 2013; Dickinson et al., 2016; Pilla Reddy et al., 2018; Schwenger et al., 2018; Alsmadi et al., 2021; An et al., 2021; Hashino et al., 2023; Pharmaceuticals and Medical Devices Agency PMDA, 2023). Rodgers and Rowland, and PK-Sim’s standard methods provided the human tissue distribution and cellular permeability estimate for OSI. While Rodgers and Rowland’s method can estimate the human tissue-to-plasma partition coefficient, it is preferable to incorporate experimental values into the PBPK model, particularly for the target tissue. The lung-to-plasma partition coefficient (Klu,p) has been experimentally determine for the distribution of OSI in lung tissue. Based on average tissue-to-blood ratios at 1 h and 6 h from reference (Dickinson et al., 2016), the experimental Klu,p-value was manually entered into this model.
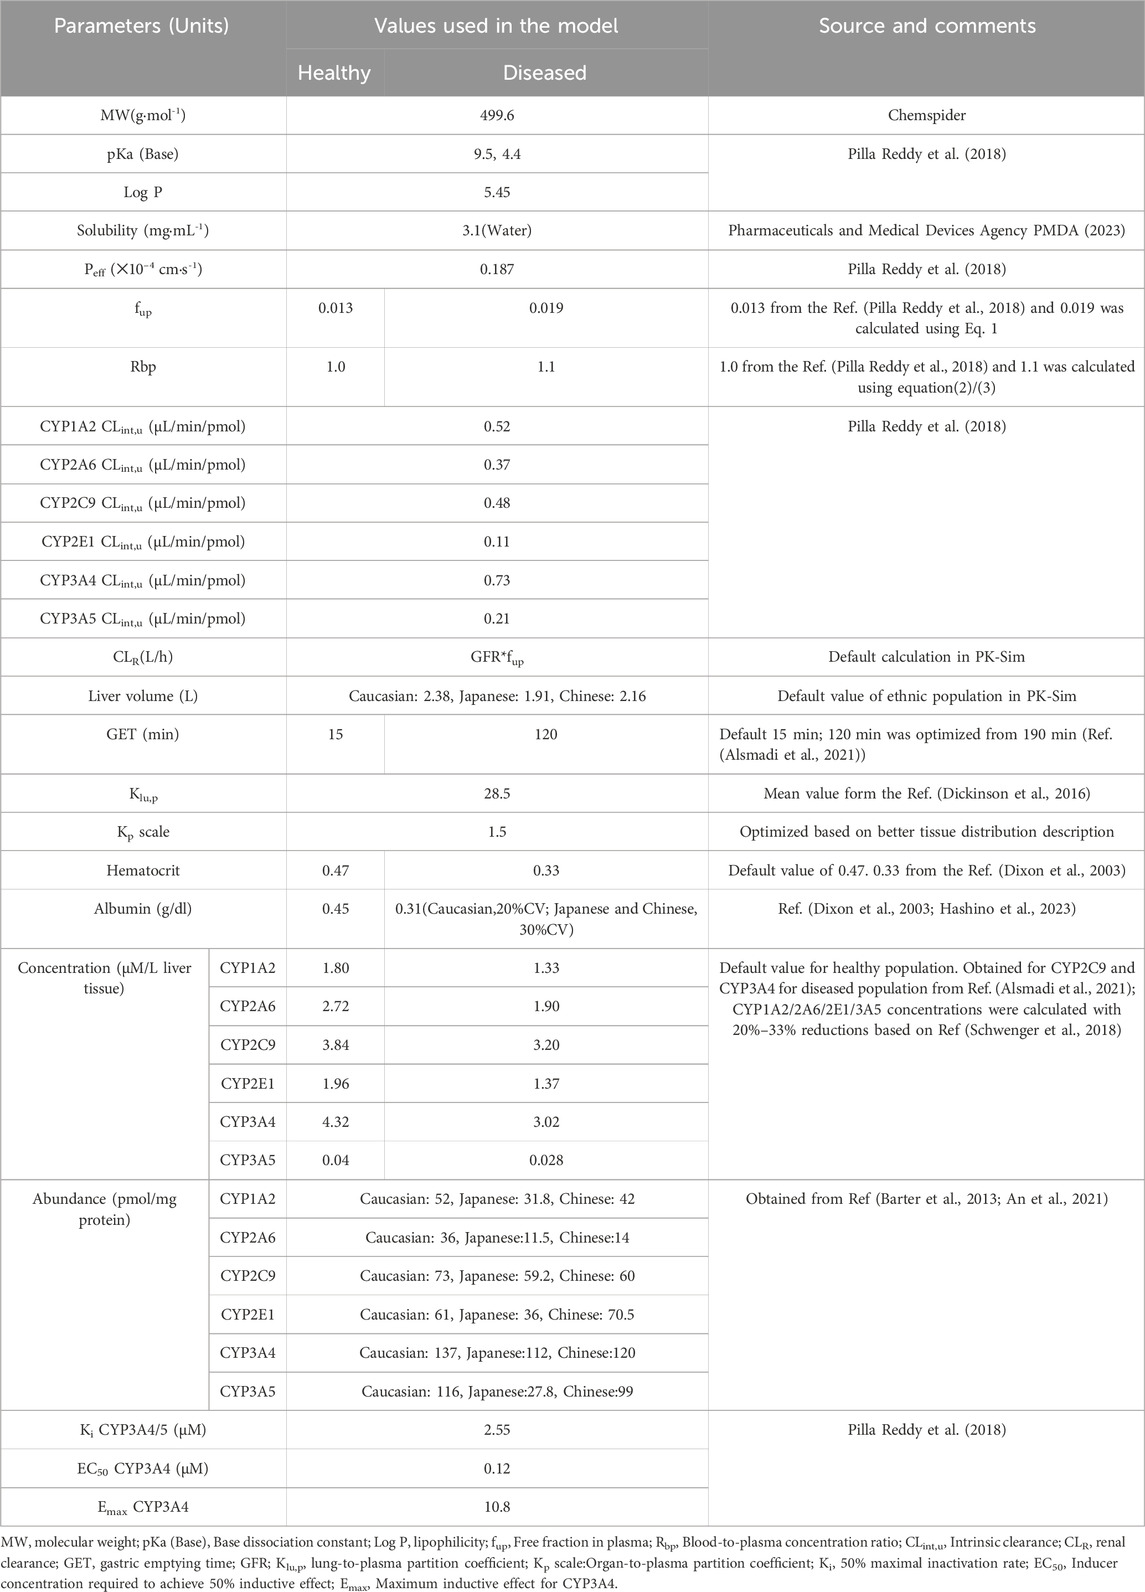
TABLE 1. OSI-specific and physiological parameters used in the development of PBPK model.
Additionally, the Kp scale was optimized to 1.5 to better represent the tissue distribution of OSI. The involvement of kidney transporters or tubules in the uptake or excretion of OLA was not reported. Thus, the fraction of glomerular filtration rate (GFR) was set as 1.0. The renal clearance (CLR) was estimated by the glomerular filtration rate (GFR)✕fup method using PK-Sim. Hepatic clearance of OSI was estimated by considering six metabolism enzymes.
When considering inter-ethnic differences, the enzyme abundances and liver volume are the most commonly considered factors. In this study, default liver volumes of 2.38 L for Caucasians, 2.16 L for Japanese, and 1.91 L for Chinese populations were utilized. Additionally, Table 1 presents the abundance of six metabolizing enzymes in different ethnic groups based on literature data from references (Barter et al., 2013; An et al., 2021). These enzyme abundances are taken into account to capture potential inter-ethnic variations in OSI metabolism.
2.1.2 The PBPK model for diseased population
In the diseased PBPK model, the same model structures as the healthy PBPK model were used, with some modifications specific to NSCLC populations based on previous published papers. Firstly, the gastric emptying time (GET) parameter was optimized to 120 min, different from the previously used value of 190 min, according to reference (Alsmadi et al., 2021). This adjustment was made based on the peak time that better aligned with the clinical PK data. The concentrations of CYP3A4 and CYP2C9 enzymes were assigned based on reference (Alsmadi et al., 2021). The concentration of CYP1A2 in cancer patients was calculated to be 1.33 μM, taking into account a 26% downregulation relative to the healthy population as reported in reference (Schwenger et al., 2018). For the remaining three metabolizing enzymes, their expression levels in patients were calculated assuming a ratio of 0.7 compared to the healthy population. The plasma albumin levels were set at 0.45 g/dL in the healthy population and 0.31 g/dL in the diseased population, based on information from published papers (Dixon et al., 2003; Hashino et al., 2023). Finally, the fup and blood-to-plasma concentration ratio (Rbp) in NSCLC patients were determined using Eqs 1–3:
Where [P](patients) and [P](healthy) represent the plasma albumin levels in patients and healthy population, respectively.
Where Rbp (Patients) represents the patients’ blood-to-plasma concentration ratio in; Hct represents the hematocrit value; KpuBC is affinity of blood cells to the OSI. KpuBC is estimated by:
In the diseased PBPK model, the remaining modeling parameters were assumed to be the same as those used for the healthy population.
2.1.3 Validation of the PBPK model
To validate the predictive performance of the PBPK model, multiple clinically observed PK data of OSI in Caucasian (Planchard et al., 2016; Vishwanathan et al., 2018a; Harvey et al., 2018; Grande et al., 2019; Vishwanathan et al., 2019), Japanese (Planchard et al., 2016; Fujiwara et al., 2023), and Chinese (Zhao et al., 2018) populations were utilized. The model’s accuracy was assessed by comparing the coincidences between predicted and observed PK variables such as area under the curve (AUC) and maximum concentration (Cmax) in healthy and diseased populations after a single dose and repeated doses.
In general, an accurate prediction model is considered acceptable when the ratios of these PK variables between prediction and observation fall within the range of 0.5–2.0. This criterion ensures that the model’s predictions are reasonably close to the observed values, indicating a good level of accuracy and reliability in the PBPK model’s performance for OSI across different ethnic populations.
The fraction metabolic contribution for CYP3A4 on OSI is estimated to be 47.6%, and OSI can inhibit and reduce activity of CYP3A4. Hence, to ensure the accuracy of CYP3A4 metabolism contribution in the PBPK model, the PK interactions between OSI and itraconazole (ITR) as well as rifampicin (RIF) were simulated in Asian populations. The PBPK model and interaction parameters for ITR and RIF were obtained from published papers (Gao et al., 2023). Based on the clinical drug-drug interaction (DDI) study (Vishwanathan et al., 2018b), The DDI simulation between OSI and ITR involved administering OSI at a dose of 80 mg once daily (OD) on day 1 and 10, while ITR was administered at a dose of 200 mg twice daily from day 7 to day 19. Similarly, in the DDI simulation between OSI and RIF, OSI was dosed at 80 mg OD on day 1 and 29, while RIF was administered at a dose of 600 mg OD from day 7 to day 29. The simulated fold difference for the DDIs of OSI with ITR and RIF were then compared with clinically observed ratios. By evaluating the agreement between the simulated and observed data for these DDIs, the reliability and predictive performance of the CYP3A4 metabolism parameters can be verified.
2.2 Sensitivity analysis
The modeling parameters that were optimized and identified as having potentially significant effects on PK variables of OSI (under the steady-state concentration-time curve: AUCss, steady-state peak concentration: Css,max and plasma Ctrough) were chosen for the sensitivity analysis. These specific parameters include: 1) fup, 2) Rbp, 3) GET, 4) Albumin level, 5) CYP CLint,u, 6) CYP3A4 auto inhibition and induction parameters, 7) CYP enzyme expression, and 8) liver volume.
To evaluate the influences of the selected parameters on PK variables, each parameter’s value was altered by ±20% during the sensitivity analysis. The sensitivity coefficient (SC) was then calculated using the following Eq. 4 (Li et al., 2020):
Where ∆Y is the alteration of predicted PK variables; Y is the initial value of predicted PK variables; ∆P is the alteration of model parameters; P is initial value of assessed parameters. If the absolute value of SC is above 1.0, it indicates that this parameter has a significant influence on the predicted PK variables.
2.3 Plasma Ctrough and EGFRm+ inhibition prediction
The developed PBPK model was utilized to simulate the plasma Ctrough and EGFRm+ inhibition time profiles for three ethnic populations with NSCLC. The virtual population’s demographic characteristics and dosage regimes were based on relevant clinical papers (Table 2). Each simulation consisted of ten virtual subjects. The estimation of EGFRm+ (T790M and L858R) inhibition in plasma or lung time profiles was achieved through the utilization of the following Eqs 5–7:
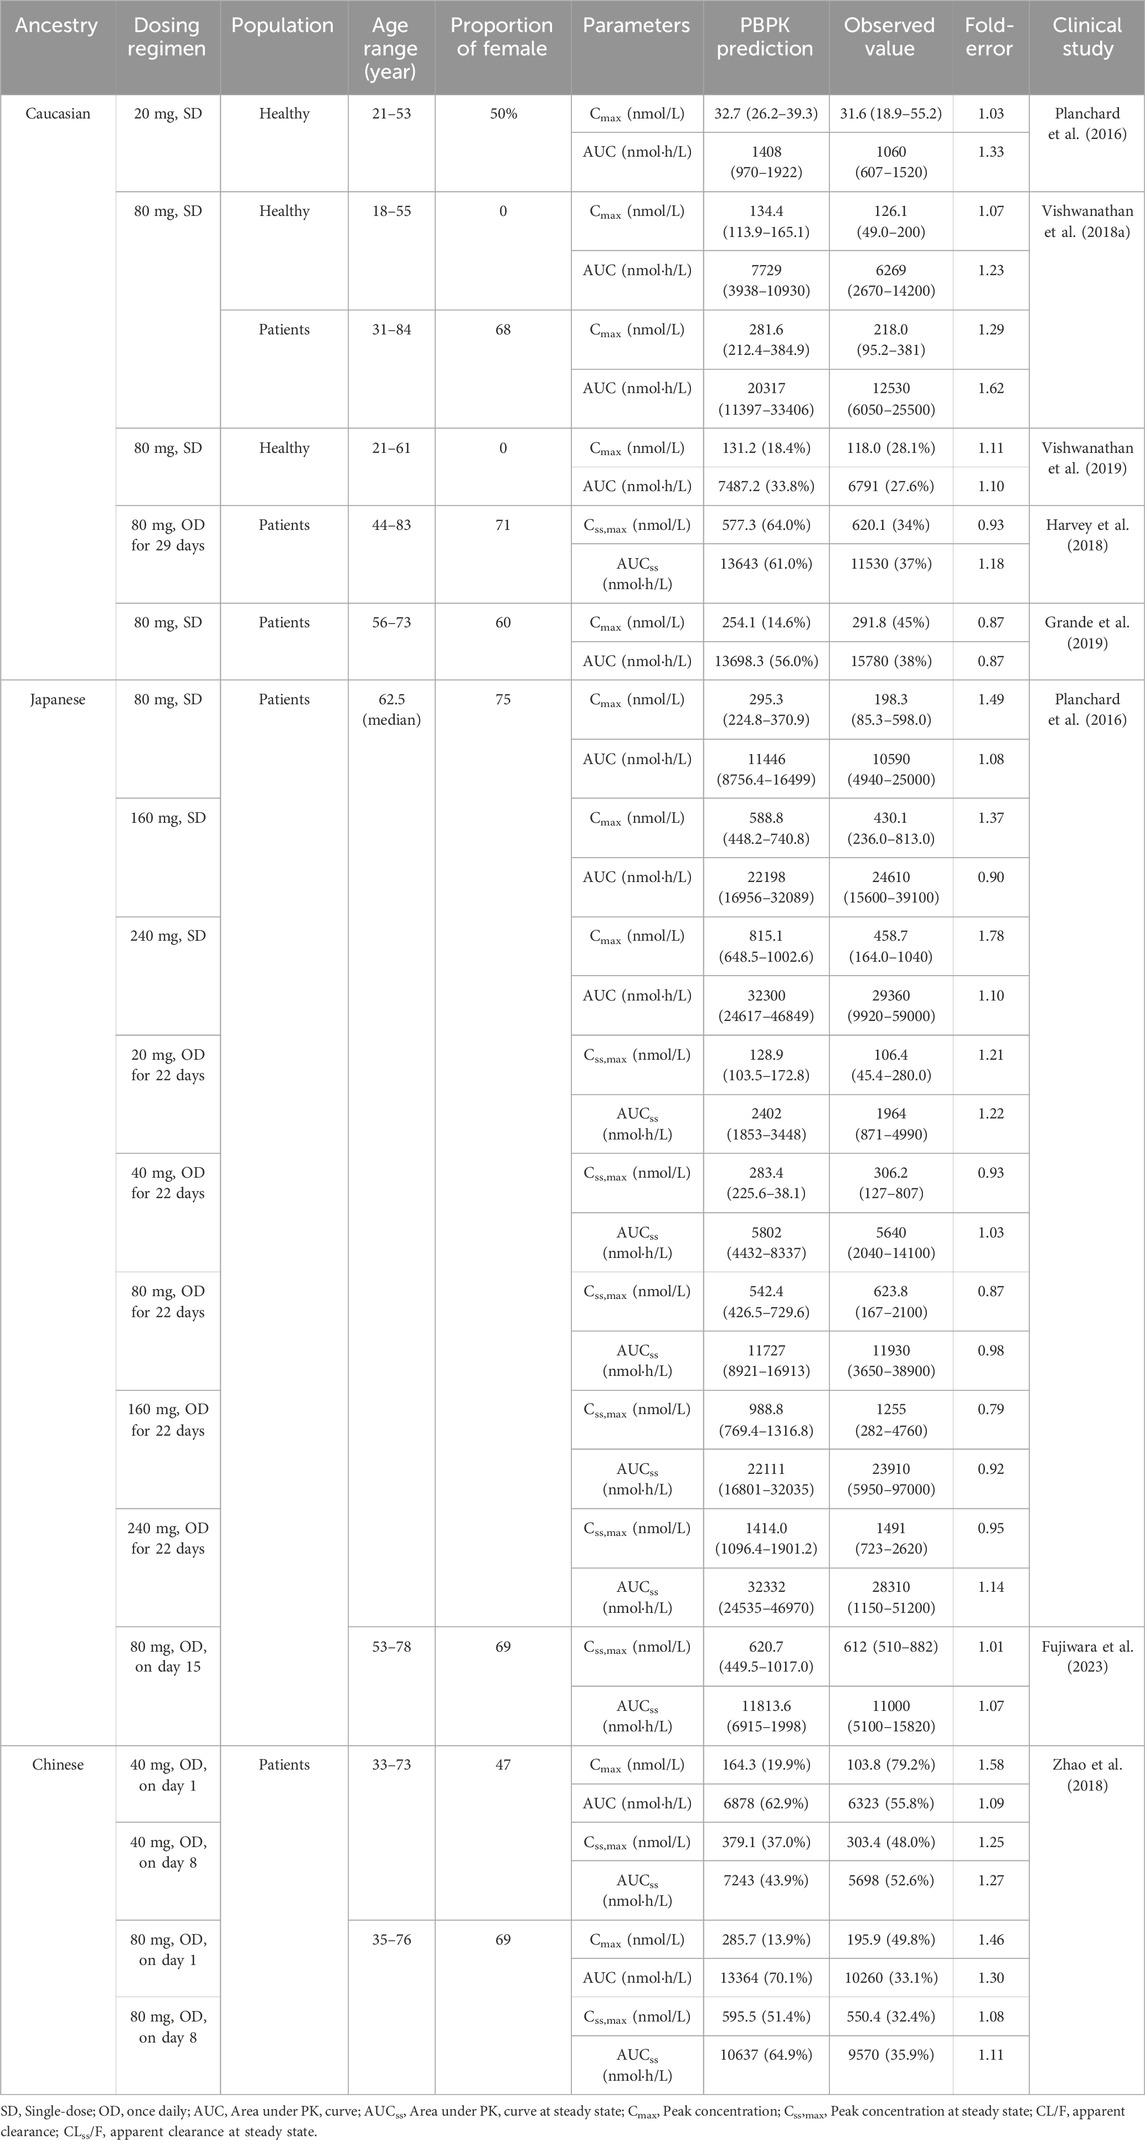
TABLE 2. Comparisons of the geometric mean values between predicted and observed PK variables in different population ancestry.
Where OEm is the concentration of OSI-EGFRm+ complex formed. Emfree is the free concentration of EGFRm+. Em0 is starting concentration of EGFRm+, and was set 0.299 μM based on the paper (Bartelink et al., 2022). Clung, kon, koff, and kturnover are the free OSI concentration in the lung, association, dissociation rate constant of OSI, and re-synthesis rate constant of EGFRm+, respectively. The kon values of 0.91 (binding to T790M) and 0.44 (binding to L858R) μM−1s−1 were obtained from the paper (Zhai et al., 2020), equivalent to the ratio of Kinact/Ki. koff was assumed to be 0 due to irreversible covalent binding to EGFR for OSI. kturnover was obtained to be 0.025 h−1 from the paper (Greig et al., 2015).
2.4 Effect of the key factors on Plasma Ctrough and EGFRm+ inhibition
The diseased PBPK model was used to evaluate the influence of CPY3A4 variants, CYP1A2 CLint,u, auto-inhibition/induction on CYP3A4, fup, and albumin level on plasma Ctrough and pulmonary EGFRm+ inhibition. 26 CPY3A4 variant CLint,u values from a referenced paper (Gao et al., 2022) were incorporated into the PBPK model to assess the impact. The CYP1A2 CLint,u was varied within the range of 0.52–5.2 μL/min/pmol. Additionally, Auto-inhibition and induction were set at 0 for Ki/Emax CYP3A4 and 2.5 μM (Ki CYP3A4)/10.8 (Emax CYP3A4), respectively. The fup values were set within the range of 0.009–0.034, while the albumin levels were set within the range of 1.1–6.1 g/dL. The dosing regimen involved taking 80 mg MD for 14 consecutive days, with the assumption that steady-state is reached after 14 days of OSI intake. The virtual population’s demographic characteristics were set to Caucasian, as mentioned in Table 2.
2.5 Statistical analysis
In the analysis conducted using JMP software (JMP Pro 16.0.0, SAS Institute Inc., NC, United States), a one-way analysis of variance (ANOVA) was performed. The Tukey-Kramer test was used to compare multiple groups. A p-value of less than 0.05 and 0.01 was considered statistically significant, indicating a significant difference between the groups being compared.
3 Results
3.1 Development and validation of the PBPK model
According to Table 2, the ratios of predicted and observed geometric mean AUC and Cmax for OSI were within the acceptable range of 0.5–2.0, indicating that the population PBPK model accurately predicts the PK variables of OSI at single-dose and steady-state in the three ethnic populations (Caucasian, Japanese, and Chinese). Moreover, it is notable that most of the predicted/observed ratios fell within the range of 0.8–1.25, further suggesting a high level of accuracy in the PBPK model’s predictions. This indicates that the model is capable of accurately capturing the PK behavior of OSI in individuals from different ethnic backgrounds, both in terms of OSI exposure (AUC, Cmax). Overall, the simulations validate the predictive performance of the PBPK model for OSI in healthy and diseased populations, also providing confidence in its ability to estimate PK parameters across diverse ethnic populations.
Additionally, the predicted ratios of PK variables for OSI co-administered with ITR and RIF are provided in Supplementary Table S1. These predicted ratios were found to be consistent with the clinical data (Vishwanathan et al., 2018b), further confirming the accuracy of the CYP3A4 metabolic contribution in the PBPK model.
3.2 Sensitivity analysis
According to Table 3, the most sensitive parameters with a significant impact on the AUCss, Css,max and plasma Ctrough of OSI are fup and albumin level. The albumin level has a significant impact on all three PK variables, in particular on plasma Ctrough, with a SC value of −2.10. Similarly, fup also has a significant impact on two PK variables. Additionally, CYP3A4 CLint,u, CYP3A4 concentration, and liver volume also exhibit a relatively large influence on PK variables. However, the majority of the modeling parameters had only a slight impact on the PK variables of OSI, as revealed by the sensitivity analysis.
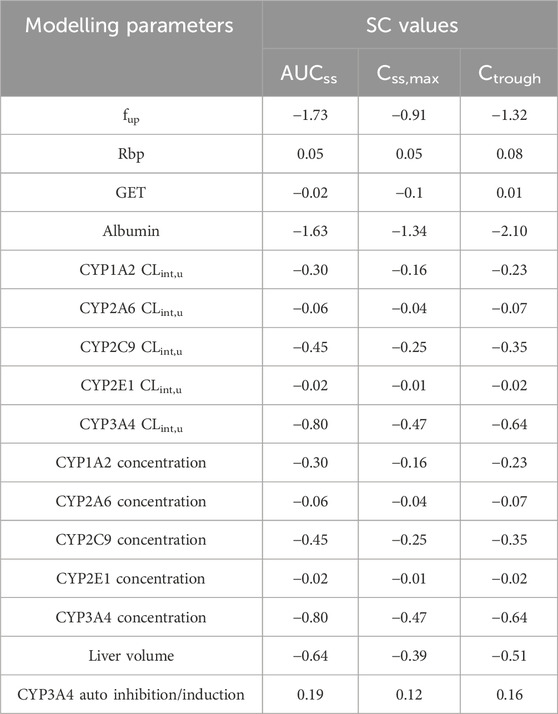
TABLE 3. Sensitivity analysis of modelling parameters.
3.3 Plasma Ctrough and EGFRm+ inhibition prediction
Table 4 displays the predicted plasma Ctrough values for various dosing regimens in NSCLC patients of three ethnic groups, as determined by the PBPK model. The observed ratios ranged from 0.80 to 1.25, indicating a good agreement between the predicted and actual Ctrough values. These simulations demonstrate that the diseased PBPK model is capable of accurately predicting steady-state OSI plasma Ctrough in NSCLC patients.
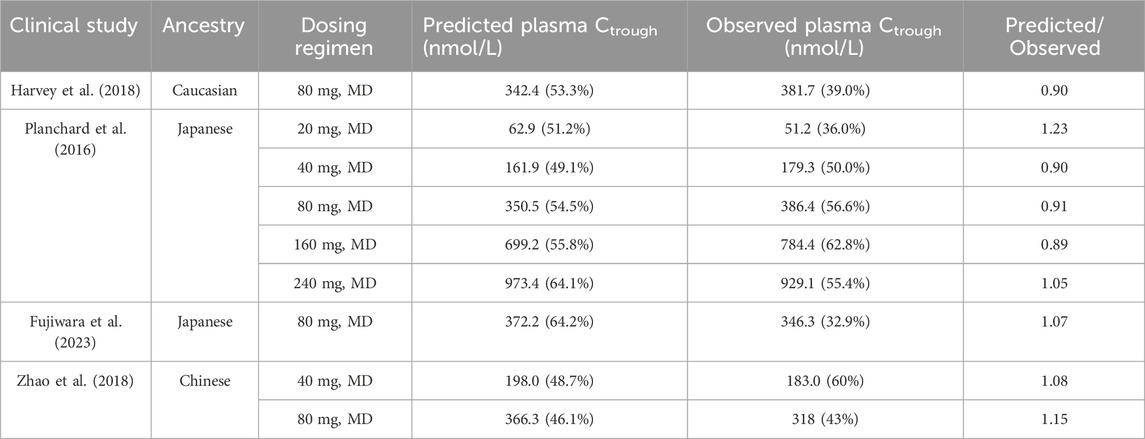
TABLE 4. Comparisons of the geometric mean plasma Ctrough between predicted and observed data in different population ancestry.
Figure 1 illustrates the time profiles of plasma and pulmonary EGFRm+ (T790M and L858R mutants) inhibition in the three ethnic groups during a 14-day period of treatment with 80 mg MD of OSI. According to a study on the effect of EGFRm+ suppression (Food and Drug Administration FDA, 2015), an effective pharmacodynamics (PD) threshold for OSI was defined as more than 80% EGFRm+ inhibition. The time-course of plasma and pulmonary T790M and L858R inhibition is similar across the three ethnic groups. Notably, the minimal rates of pulmonary inhibition for both mutants exceed 80%, which is significantly higher than in plasma. The simulations of pulmonary 80% inhibition align well with a study conducted on NCI H1975 cells (Food and Drug Administration FDA, 2015). As a result, the prediction of pulmonary T790M and L858R inhibition, as target tissue, over time proves valuable for assessing clinical efficacy compared to plasma EGFRm+ inhibition.
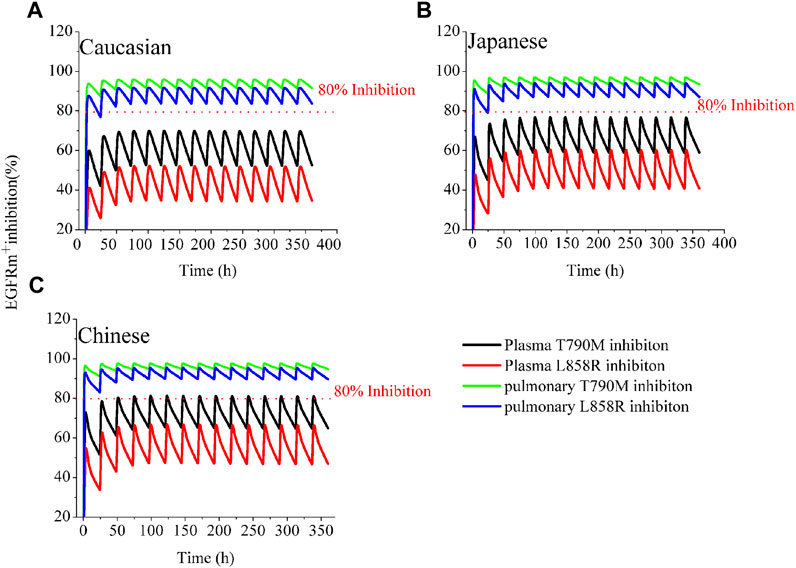
FIGURE 1. Simulations of EGFRm+ inhibition in plasma and lung in the three ethnic groups by OSI. The time-course of plasma and pulmonary EGFRm+ inhibition in Caucasian (A), Japanese (B), and Chinese (C) following 80 mg OD for 14 consecutive days. The blue and green solid lines represent pulmonary EGFRm+ inhibition; the black and red solid lines represent plasma EGFRm+ inhibition.
3.4 Assessment of inter-ethnic differences and Plasma Ctrough variability
3.4.1 Apparent CL/F simulations of OSI in healthy and diseased populations
Figure 2A illustrates the predicted CL/F of OSI in both healthy and diseased Caucasian populations. The CL/F in the healthy population is statistically significant higher (p < 0.01) compared to that in patients. This disparity can account for the observed clinical OSI exposure, which is approximately two times higher in Caucasian patients when compared to healthy individuals (Harvey et al., 2018; Vishwanathan et al., 2019). The difference in exposure between healthy and diseased populations is primarily attributed to variations in fup and albumin levels. When the fup and albumin levels in the diseased PBPK model were adjusted to the same values with the healthy PBPK model, an approximately 1.29-fold difference in exposure was observed between the two groups. This difference of 1.29-fold can be further explained by variations in CYP enzyme concentration between healthy and diseased populations. Moreover, the PBPK model prediction of relative contribution of the three factors to total CL/F of OSI is present in Supplementary Table S2.
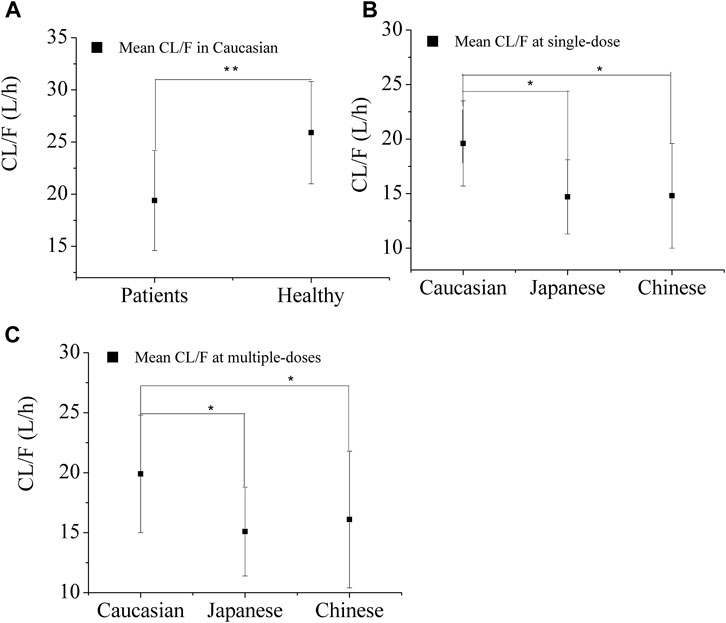
FIGURE 2. Predicted apparent clearance (CL/F) of OSI in the three ethnic groups for healthy Caucasian (A) and Patients (B and C) after single-dose (B) and multiple-doses (C). Note:* and ** denotes statistically significant difference, p < 0.05 and p < 0.01.
Figures 2B, C displays the predicted apparent CL/F of OSI in the three ethnic groups. ANOVA analysis of the simulated CL/F values indicated a significant difference between Caucasian and Japanese patient s (p<0.05), as well as between Caucasian and Chinese patients (p < 0.05), for both single-dose (80 mg) and multiple-dose (80 mg) regimens. However, no significant difference was observed between Japanese and Chinese patients. The geometric mean CL/F in Caucasian patients was approximately 1.3-fold higher than in Japanese and Chinese patients for the single-dose regimen, and 1.2-fold lower for the multiple-dose regimen. The lower CL/F in Asian patients resulted in a lower AZ5104 AUC compared to Caucasian patients, indicating a 10%–23% decrease in AZ5104 AUC in Asian NSCLC patients relative to Caucasian patients (Brown et al., 2017).
3.4.2 Effect of CPY3A4 variants on Plasma Ctrough and EGFRm+ inhibition
In Figure 3A, it is evident that CYP3A4 variants have a significant impact on the plasma Ctrough of OSI. The most substantial decrease in OSI plasma Ctrough was observed with the CYP3A4.29 variant, which resulted in approximately 61% lower plasma Ctrough levels compared to the wild type. Conversely, the maximal increase in plasma Ctrough was seen with CYP3A4.2 variants, where the plasma Ctrough were approximately 1.93-times higher than the wild type. Among these CYP3A4 variants, two plasma Ctrough values (CYP3A4.2/17) exceeded the PK threshold for safety, while six Ctrough values (CYP3A4.15/28/29/32/33/34) fell below the effective PK threshold. On the other hand, only slight changes were observed in pulmonary EGFRm+ E790M inhibition, within a range of 15% compared to the wild type. However, three inhibition values against L858R were below the 80% inhibition threshold (Figure 3B).
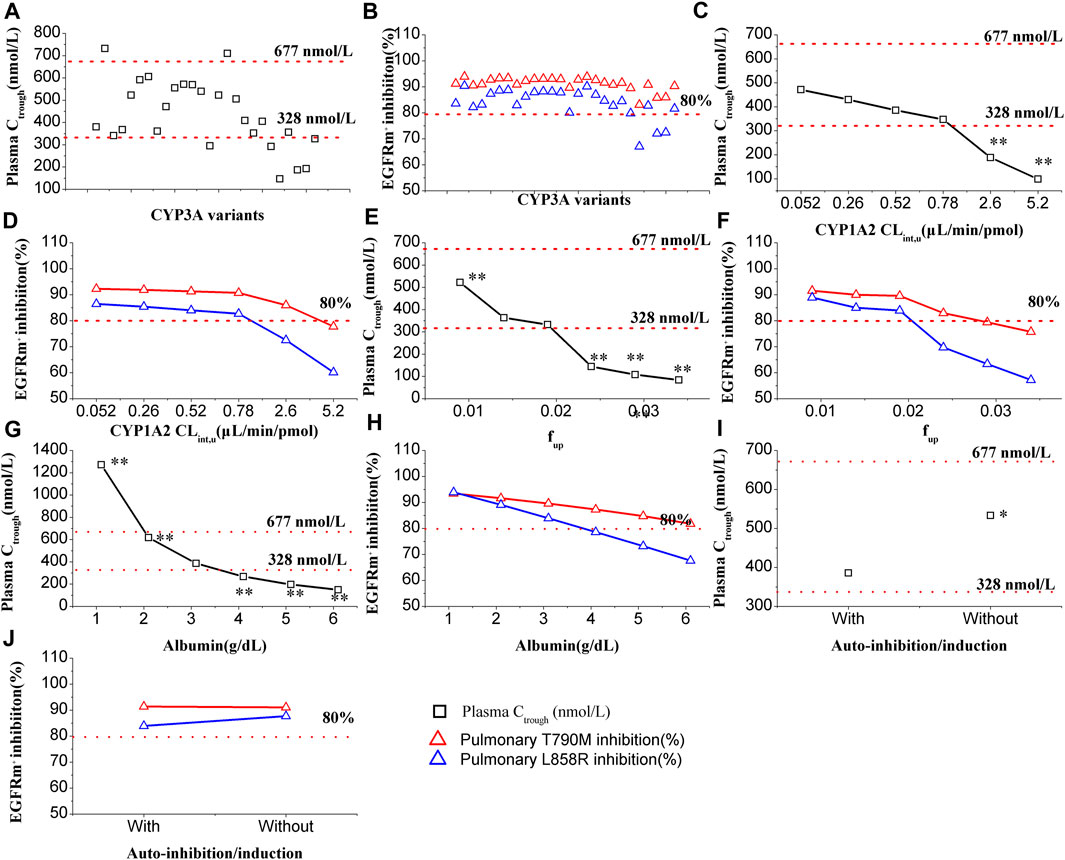
FIGURE 3. Effect of multiple factors on plasma Ctrough and pulmonary EGFRm+ inhibition. Plasma Ctrough values are affected by CYP3A4 variants (A), CYP1A2 Clint,u (C), fup (E), albumin level (G), and with or without auto-inhibition/induction (I). EGFRm+ inhibition values are affected by CYP3A4 variants (B), CYP1A2 Clint,u (D), fup (F), albumin level (H), and with or without auto-inhibition/induction (J). One-way ANOVA was performed with the Tukey test. Note:*, ** denotes statistically significant difference, p < 0.05 and p < 0.01, respectively.
3.4.3 Effect of CPY1A2 activity on Ctrough and EGFRm+ inhibition
In Figure 3C, the influence of CYP1A2 activity on the plasma Ctrough of OSI is demonstrated. The simulations indicate that CYP1A2 activity has a statistically significant impact (p < 0.01) on the plasma Ctrough of OSI at tow data points. Specifically, when the CYP1A2 CLint,u increased to 5- and 10-fold higher than the original value (0.52 μL/min/pmol) in the model, the two plasma Ctrough values were below 328 nmol/L of PK effective threshold. On the other hand, in Figure 3D, it can be observed that pulmonary T790M inhibition is less affected by CYP1A2 activity. However, for pulmonary L858R inhibition, two data points were below the 80% inhibition threshold when the CYP1A2 CLint,u increased to 5- and 10-fold higher compared to the original value.
3.4.4 Effect of fup on Ctrough and EGFRm+ inhibition
In Figure 3E, the influence of fup on the plasma Ctrough of OSI is shown. The simulations demonstrate that fup has a highly statistically significant impact on the plasma Ctrough of OSI, with four values having p < 0.01. As fup increases, the plasma Ctrough gradually decreases, and three data points fall below the PK efficacy threshold. Similarly, in Figure 3F, a significant influence of fup is observed in both pulmonary T790M and L858R inhibition. Specifically, for pulmonary L858R inhibition, three data points were below the 80% inhibition PD threshold.
3.4.5 Effect of albumin level on Ctrough and EGFRm+ inhibition
In Figure 3G, the influence of albumin levels on the plasma Ctrough of OSI is depicted. The simulations reveal that albumin levels have an extremely significant impact on the plasma Ctrough of OSI. The ANOVA analysis of the simulated data indicates that all values differ statistically significantly compared to the original level (0.31 g/dL) in the model. Additionally, four data points fall outside the range of efficacy and safety PK thresholds, suggesting inadequate clinical efficacy and potential safety. Similarly, in Figure 3H, a significant impact of albumin levels is observed on pulmonary EGFRm+ inhibition. As albumin levels increase, there is a gradual decrease in EGFRm+ inhibition, with several data points falling below 80% for L858R inhibition.
3.4.6 Effect of auto-inhibition/induction Ctrough and EGFRm+ inhibition
In Figure 3I, the influence of auto-inhibition/induction on the plasma Ctrough of OSI is presented. The simulations indicate that auto-inhibition/induction towards CYP3A4 has a statistically significant impact (p < 0.05) on the plasma Ctrough of OSI. However, this impact remains within the range of efficacy and safety PK thresholds, suggesting that it may not significantly compromise the effectiveness or safety of the OSI. On the other hand, in Figure 3J, only a slight impact on pulmonary EGFRm+ inhibition is observed due to auto-inhibition/induction. This suggests that changes in CYP3A4 activity resulting from auto-inhibition/induction have minimal effects on the inhibition of pulmonary EGFRm+ inhibition.
3.4.7 Key factors of affecting the PK variability of inter-patients
Figure 4 demonstrates the impact of %CV of CYP3A4 CLint,u, %CV of fup, and %CV of albumin level on the PK variability of inter-patients. The PBPK model simulations reveal that the %CV of albumin level primarily contributes to the PK variability among patients (as shown in Figures 4E, F). Notably, the influence of %CV of albumin on PK variability is more prominent in Caucasian than in Japanese, and Chinese populations. Specifically, it is observed that a 20% CV of albumin in Caucasian and 30% CV in Japanese and Chinese populations can result in an approximate 50% CV of PK variability among patients. Considering the diseased PBPK model, it is reasonable to set the %CV of albumin level at 20% in Caucasians and 30% in Japanese and Chinese populations to account for the observed PK variability.
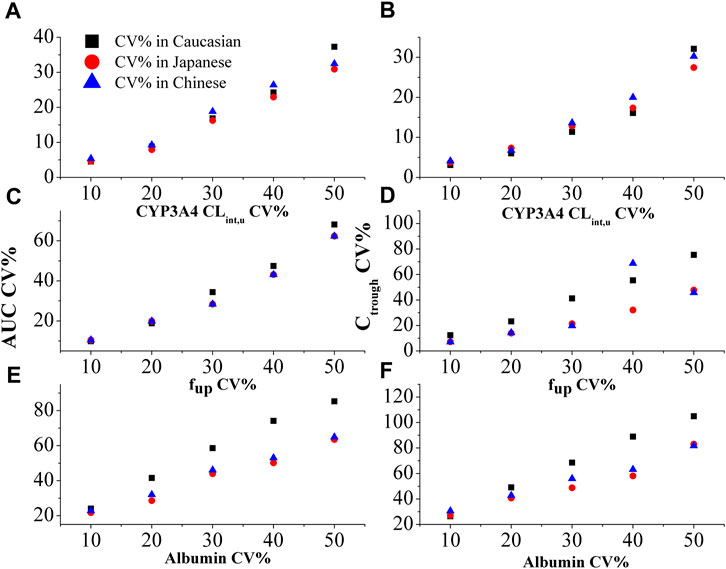
FIGURE 4. The effect of %CV of CYP3A4 CLint,u (A and B), fup (C and D), and albumin level (E and F) on the variability in AUC and plasma Ctrough in three ethnic populations.
3.5 Optimal dosage recommendation based on the PBPK model
Based on Figures 5A, B, the plasma Ctrough and pulmonary EGFRm+ inhibition in three ethnic populations were evaluated for four dosing regimens of OSI. The optimal dosing regimens for each ethnic group were determined based on the geometric mean of Ctrough and minimal EGFRm+ inhibition (Calculated using pulmonary Ctrough), along with a 95% confidence interval (95% CI). The results show that the plasma Ctrough values at the dose of 80 mg OD in all three ethnic NSCLC patients fall within the desired PK threshold range. This ensures both clinical efficacy (Ctrough > 338 nmol/L) and safety (Ctrough < 677 nmol/L). Additionally, the minimal EGFRm+ inhibition achieved at the doses of 80 mg and 160 mg OD in all three ethnic NSCLC patients exceeds the desired 80% inhibition. Moreover, it is observed that the minimal EGFRm+ inhibition approaches 100% at the dose of 80 mg OD compared to 160 mg OD. This suggests that higher dosing regimens may have limited increases in clinical efficacy, and result in more adverse event. Therefore, the recommended dose of 80 mg OD in NSCLC patients, as suggested by the PBPK model, aligns well with the clinical dose suggestion.
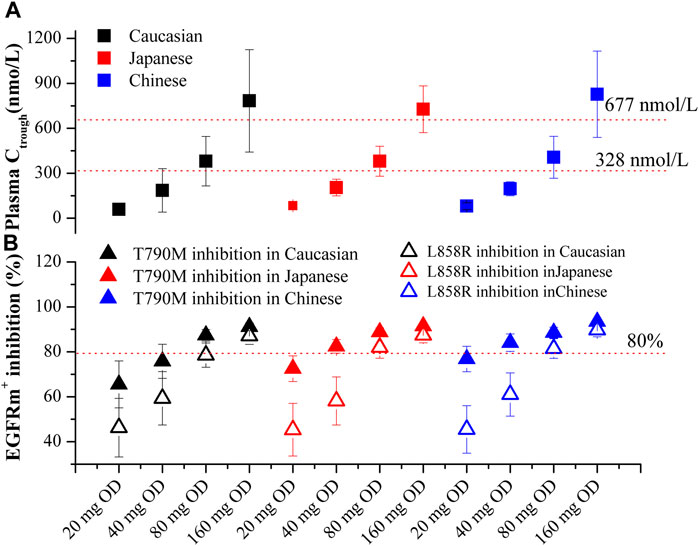
FIGURE 5. PBPK simulations of OSI plasma Ctrough (A) and pulmonary EGFRm+ inhibition (B) in three ethnic populations. Data were shown as geometric mean values ±95% CI. In Figure 4B, Solid Square and Open Square denote minimal inhibition against T790M and L858R mutants, respectively.
4 Discussion
This study successfully developed the PBPK models for OSI in healthy and diseased populations across three ethnic groups. These models were utilized to simulate the plasma Ctrough and time-profiles of pulmonary EGFRm+ inhibition (specifically T790M and L858R mutants). The accuracy of the PBPK predictions was supported by multiple clinical PK studies (provided in Table 2/4) conducted on different ethnic populations and a clinical DDI study (Supplementary Table S1). Furthermore, the study investigated the impact of five factors on OSI plasma Ctrough and pulmonary EGFRm+ inhibition. Additionally, the research aimed to identify key factors influencing the inter-patient and inter-ethnic PK variability of OSI. Notably, this study is the first to assess the PK and EGFRm+ inhibition of OSI in three ethnic populations while also evaluating the crucial factors that contribute to the PK variability of OSI.
4.1 Simulation of OSI distribution and EGFRm+ inhibition
The Klu,p parameter plays a crucial role in characterizing the lung distribution of OSI from the plasma. According to the Rodgers and Rowland approach, the predicted Klu,p-value was 14.3. However, experimental analysis revealed a mean Klu,p-value of 28.5 (Dickinson et al., 2016). The impact of the Klu,p-value on OSI plasma and lung PK is detailed in Supplementary Table S3. The analysis revealed that the Klu,p-value has a significant impact on lung PK but hardly impact on plasma PK. Consequently, in this model, a Klu,p-value of 28.5 was ultimately utilized to enhance the accuracy of lung concentration prediction.
4.2 Key factors of affecting the plasma Ctrough and pulmonary EGFRm+ of OSI in PBPK model
In this study, the PBPK model was employed to simulate the impact of key parameters on OSI plasma Ctrough and pulmonary EGFRm+ inhibition. The simulations revealed that CYP3A4 variants, fup, and albumin levels significantly influence these PK and PD outcomes. Sensitivity analysis further emphasized that fup and albumin level are the most sensitive parameters affecting the PK variables of OSI. Given the significance of three parameters, adjustments were made in the diseased PBPK model. As no differences in fup were observed among the different ethnic groups, the same fup value was utilized for the PBPK model across all three ethnic populations. However, hypoalbuminemia is commonly observed in NSCLC patients and those with hepatic impairment, leading to a decrease in albumin levels. This decrease can substantially alter the plasma protein binding of OSI, which has a high affinity for albumin. The simulations conducted in this study strongly demonstrated that albumin level has a substantial impact on the PK variables of OSI as well as EGFRm+ inhibition. These findings align well with multiple clinical observations where albumin levels in patients have shown a strong correlation with clinical efficacy (Brown et al., 2017; Yokota et al., 2022; Ishikawa et al., 2023).
In this study, despite CYP3A4 CLint,u not showing high sensitivity in the sensitivity analysis, it still exhibits a large impact on OSI plasma Ctrough as shown in Figure 3A. Additionally, the effect of CYP1A2 activity on OSI (a CYP1A2 substrate) plasma Ctrough and pulmonary EGFRm+ inhibition was also examined, considering that smoking can induce CYP1A2 activity. The simulation demonstrated that significant changes occur in OSI plasma Ctrough and pulmonary EGFRm+ inhibition when CYP1A2 activity is increased by 5- or 10-fold. On the other hand, OSI plasma Ctrough and pulmonary EGFRm+ inhibition exhibited a decreasing trend but no significant change when CYP1A2 activity increased to 1.5-fold (approximately 1.55-fold higher in enzyme activity caused by smoking). This finding aligns with multiple clinical observations where there is no significant impact on the clinical efficacy between smokers and nonsmokers (Food and Drug Administration FDA, 2015; Kishikawa et al., 2020; Jin et al., 2022; Yokota et al., 2022), despite two clinical studies suggesting a potential impact (Rodier et al., 2022; Abu Hamdh and Nazzal, 2023).
It's worth noting that OSI inhibits its own metabolism through competitive inhibition against CYP3A4 and also enhances its own metabolism through induction of CYP3A4 expression. Although the sensitivity analysis did not show significant effects of auto-inhibition and induction parameters on PK variables of OSI (as seen in Table 3), statistically significant changes in plasma Ctrough were observed with or without auto-inhibition and induction (Figure 3I). Hence, it is necessary that auto-inhibition/induction parameters were incorporated into the PBPK model of OSI.
Overall, this study highlights the crucial role of several factors in influencing the plasma Ctrough and pulmonary EGFRm+ inhibition of OSI, particularly in diseased populations. The study supports the clinical relevance of fup and albumin levels in predicting OSI efficacy. Additionally, the CYP3A4 and CYP1A2 activities also play relative important roles in determining OSI plasma Ctrough and pulmonary EGFRm+ inhibition. The impact of smoking-induced CYP1A2 activity on OSI appears to be less significant compared to the influence of CYP3A4 activity. Additionally, the competitive inhibition and induction of CYP3A4 by OSI may contribute to changes in plasma Ctrough, even though these effects were not prominently reflected in the sensitivity analysis.
In addition, the study revealed that T790M inhibition is less impacted by multiple factors compared to L858R inhibition. This disparity is primarily attributed to the larger kon value of OSI against T790M than L858R (0.91 μM−1s−1 vs. 0.44 μM−1s−1). These key factors equally influence the plasma concentration of OSI, potentially resulting in smaller variations in pulmonary T790M inhibition due to the larger kon value.
4.3 Efficacy and safety PK and PD thresholds defining
In certain clinical studies (Brown et al., 2017; Boosman et al., 2022; Hashino et al., 2023), when patients’ plasma Ctrough levels for OSI were divided into only two groups, the relationship between exposure and efficacy was not observed. This is likely because clinical efficacy requires a minimal plasma Ctrough, while excessive Ctrough levels can lead to adverse events and result in shorter progression-free survival (PFS). However, in a specific clinical study (Abu Hamdh and Nazzal, 2023), when patients’ plasma Ctrough levels were divided into four groups, it was found that a Ctrough level above 328 nmol/L was associated with longer PFS, whereas a Ctrough level below 677 nmol/L could avoid some adverse events and also induce longer PFS. Therefore, for OSI, defining the range of 328 nmol/L to 677 nmol/L for efficacy and safety PK seems appropriate. However, the exact target inhibition level for clinical efficacy is not yet fully defined. In some relevant papers, thresholds such as >90% inhibition for soluble epoxide hydrolase (Lee et al., 2019), >70% inhibition for α-Glucosidase (Wang et al., 2019), and >75% inhibition for ALK (Yamazaki, 2013) have been established. Considering these references, in this study, a duration of >80% pulmonary EGFRm+ inhibition was selected as the efficacy PD threshold. This choice aligns with a study on NCI H1975 cells (Food and Drug Administration FDA, 2015).
4.4 PK variability between healthy and patient populations, inter-patient, and inter-ethnic group for OSI
In NSCLC patients, the exposure and CL/F of OSI are much lower compared to healthy subjects. The fup, albumin level, and metabolizing enzyme concentration may contribute to a significant increase in exposure among patients compared to healthy individuals (Figure 3). There is significant variability observed in OSI plasma concentration among individuals, with some patients showing more than 50% and even up to 80% variability (Planchard et al., 2016). Additionally, plasma exposure to AZ5104 is reported to be 10%–23% higher in Caucasian individuals compared to Asians (Brown et al., 2017). To account for these variabilities, the PBPK model analyzes key factors that influence the PK of OSI (as shown in Figures 2–4). The higher CL/F observed in Caucasians compared to Japanese and Chinese individuals is likely a main contribution of differences in healthy subjects and NSCLC patients (Figure 2). The observed higher CL/F in Caucasians may be linked to the greater abundance of CYP enzymes and larger liver volume in this population. Sensitivity analysis has shown that CYP3A4 concentration and liver volume have a relatively significant impact on AUC. (Table 3). The higher CL/F in healthy subjects may result from the difference in fup, CYP enzyme abundance and albumin level in the two populations. The inter-patient PK variability can be attributed to variations in %CV of albumin levels and metabolism enzyme variants among different patients (Figure 4). The %CV of albumin levels is approximately 20% CV in Caucasians and 30% CV in Japanese and Chinese populations, leading to a 50% PK variability among patients (Figure 4). Moreover, The PK variability in inter-ethnic group may be attributed to metabolism difference of CYP enzyme in the three inter-ethnic groups.
4.5 The PBPK model suggesting optimal dosage of OSI
In this study, the optimal dosage regimens of OSI for each ethnic population were determined based on the geometric mean and 95% CI of plasma Ctrough and pulmonary EGFRm+ inhibition (Figure 5). These values were assessed to ensure they fell within the range of efficacy and safety PK/PD thresholds. This approach builds upon strategies proposed in previous studies (Johnson et al., 2019) and utilized in another research paper (Einolf et al., 2017). The PBPK model for patient population suggested that a dosage of 80 mg OD for OSI can achieve desirable values for both efficacy and safety based on plasma Ctrough. Additionally, pulmonary EGFRm+ inhibition was observed to be above 80% at both 80 mg and 160 mg OD dosages. Furthermore, the 95% CI values for T790M inhibition (a specific mutation) in the three ethnic groups were found to be above 80%, indicating a favorable therapeutic response.
4.6 The PBPK model limitations
The present model has several limitations that should be acknowledged. Firstly, the time-course of pulmonary EGFRm+ inhibition by OSI could not be directly verified using human clinical study data, which limits the ability to fully validate the model’s predictions in this regard. Secondly, the two active metabolites of OSI have not been incorporated into the current PBPK approach, which may lead to incomplete representation of the potential EGFRm+ inhibition. This could affect the accuracy of the model’s predictions. Additionally, it is worth noting that the mean value of albumin levels was used in the PBPK model due to the lack of experimentally determined albumin data in multiple PK studies. However, individual variations in albumin levels can exist, and not accounting for this variability may introduce some errors or inaccuracies in the predictions of plasma concentrations and PK parameters.
5 Conclusion
In conclusion, this study effectively developed and validated PBPK models for OSI in both healthy individuals and patient populations from three different ethnic groups. The models provided valuable insights into the PK and EGFRm+ inhibition profiles across these populations. Furthermore, the study explored the key factors that contribute to inter-patient variability and the differences in PK between healthy individuals and patients, as well as between different ethnic groups. By addressing these important aspects, this study advances our understanding of the PK characteristics of OSI and provides a foundation for optimizing dosage regimens for different patient populations. The insights gained from this research have the potential to guide personalized treatment approaches and improve the therapeutic outcomes of OSI in diverse patient populations.
Data availability statement
The original contributions presented in the study are included in the article/Supplementary Material, further inquiries can be directed to the corresponding authors.
Ethics statement
Ethical approval was not required for the study involving humans in accordance with the local legislation and institutional requirements. Written informed consent to participate in this study was not required from the participants or the participants’ legal guardians/next of kin in accordance with the national legislation and the institutional requirements.
Author contributions
FL: Writing–original draft, Writing–review and editing, Visualization, YZ: Data curation, Writing–review and editing, QX: Data curation, Writing–review and editing, NY: Conceptualization, Formal Analysis, Methodology, Supervision, Writing–review and editing.
Funding
The author(s) declare that no financial support was received for the research, authorship, and/or publication of this article.
Conflict of interest
The authors declare that the research was conducted in the absence of any commercial or financial relationships that could be construed as a potential conflict of interest.
Publisher’s note
All claims expressed in this article are solely those of the authors and do not necessarily represent those of their affiliated organizations, or those of the publisher, the editors and the reviewers. Any product that may be evaluated in this article, or claim that may be made by its manufacturer, is not guaranteed or endorsed by the publisher.
Supplementary material
The Supplementary Material for this article can be found online at: https://www.frontiersin.org/articles/10.3389/fphar.2024.1363259/full#supplementary-material
References
Abu Hamdh, B., and Nazzal, Z. (2023). A prospective cohort study assessing the relationship between long-COVID symptom incidence in COVID-19 patients and COVID-19 vaccination. Sci. Rep. 13 (1), 4896. doi:10.1038/s41598-023-30583-2
Alsmadi, M. M., Al-Daoud, N. M., Jaradat, M. M., Alzughoul, S. B., Abu Kwiak, A. D., Abu Laila, S. S., et al. (2021). Physiologically-based pharmacokinetic model for alectinib, ruxolitinib, and panobinostat in the presence of cancer, renal impairment, and hepatic impairment. Biopharm. Drug Dispos. 42 (6), 263–284. doi:10.1002/bdd.2282
An, X.-X., Yu, Y., Li, G.-F., and Yu, G. (2021). Abundance and associated variations of cytochrome P450 drug-metabolizing enzymes in the liver of East asian adults: a meta-analysis. Eur. J. Drug Metab. Pharmacokinet. 46, 225–233. doi:10.1007/s13318-020-00667-9
Bartelink, I., van de Stadt, E., Leeuwerik, A., Thijssen, V., Hupsel, J., van den Nieuwendijk, J., et al. (2022). Physiologically based pharmacokinetic (PBPK) modeling to predict PET image quality of three generations EGFR TKI in advanced-stage NSCLC patients. Pharmaceuticals 15 (7), 796. doi:10.3390/ph15070796
Barter, Z. E., Tucker, G. T., and Rowland-Yeo, K. (2013). Differences in cytochrome p450-mediated pharmacokinetics between Chinese and caucasian populations predicted by mechanistic physiologically based pharmacokinetic modelling. Clin. Pharmacokinet. 52, 1085–1100. doi:10.1007/s40262-013-0089-y
Boosman, R. J., Jebbink, M., Veldhuis, W. B., Groenland, S. L., van Veggel, B. A., Moeskops, P., et al. (2022). Exposure–response analysis of osimertinib in EGFR mutation positive non-small cell lung cancer patients in a real-life setting. Pharm. Res. 39 (10), 2507–2514. doi:10.1007/s11095-022-03355-2
Brown, K., Comisar, C., Witjes, H., Maringwa, J., de Greef, R., Vishwanathan, K., et al. (2017). Population pharmacokinetics and exposure-response of osimertinib in patients with non-small cell lung cancer. Br. J. Clin. Pharmacol. 83 (6), 1216–1226. doi:10.1111/bcp.13223
Dickinson, P. A., Cantarini, M. V., Collier, J., Frewer, P., Martin, S., Pickup, K., et al. (2016). Metabolic disposition of osimertinib in rats, dogs, and humans: insights into a drug designed to bind covalently to a cysteine residue of epidermal growth factor receptor. Drug Metab. Dispos. 44 (8), 1201–1212. doi:10.1124/dmd.115.069203
Dixon, M. R., Haukoos, J. S., Udani, S. M., Naghi, J. J., Arnell, T. D., Kumar, R. R., et al. (2003). Carcinoembryonic antigen and albumin predict survival in patients with advanced colon and rectal cancer. Arch. Surg. 138 (9), 962–966. doi:10.1001/archsurg.138.9.962
Dobrinas, M., Cornuz, J., Oneda, B., Kohler Serra, M., Puhl, M., and Eap, C. (2011). Impact of smoking, smoking cessation, and genetic polymorphisms on CYP1A2 activity and inducibility. Clin. Pharmacol. Ther. 90 (1), 117–125. doi:10.1038/clpt.2011.70
Einolf, H. J., Lin, W., Won, C. S., Wang, L., Gu, H., Chun, D. Y., et al. (2017). Physiologically based pharmacokinetic model predictions of panobinostat (LBH589) as a victim and perpetrator of drug-drug interactions. Drug Metab. Dispos. 45 (12), 1304–1316. doi:10.1124/dmd.117.076851
Food and Drug Administration (2022). DailyMed database. (Washington: FDA). Available at: https://dailymed.nlm.nih.gov/dailymed/getFile.cfm?setid=5e81b4a7-b971-45e1-9c31-29cea8c87ce7&type=pdf.
Food and Drug Administration (FDA) (2015). Center for drug evaluation and research. Available at: https://www.accessdata.fda.gov/drugsatfda_docs/nda/2015/208065Orig1s000ClinPharmR.pdf.
Fujimoto, D., Yoshioka, H., Kataoka, Y., Morimoto, T., Hata, T., Kim, Y. H., et al. (2019). Pseudoprogression in previously treated patients with non–small cell lung cancer who received nivolumab monotherapy. J. Thorac. Oncol. 14 (3), 468–474. doi:10.1016/j.jtho.2018.10.167
Fujiwara, Y., Makihara, R., Hase, T., Hashimoto, N., Naito, T., Tsubata, Y., et al. (2023). Pharmacokinetic and dose-finding study of osimertinib in patients with impaired renal function and low body weight. Cancer Sci. 114 (5), 2087–2097. doi:10.1111/cas.15736
Gao, D., Wang, G., Wu, H., Wu, J., and Zhao, X. (2023). Prediction for plasma trough concentration and optimal dosing of imatinib under multiple clinical situations using physiologically based pharmacokinetic modeling. ACS omega 8 (15), 13741–13753. doi:10.1021/acsomega.2c07967
Gao, N., Zhang, X., Hu, X., Kong, Q., Cai, J., Hu, G., et al. (2022). The influence of CYP3A4 genetic polymorphism and proton pump inhibitors on osimertinib metabolism. Front. Pharmacol. 13, 794931. doi:10.3389/fphar.2022.794931
Grande, E., Harvey, R. D., You, B., Batlle, J. F., Galbraith, H., Sarantopoulos, J., et al. (2019). Pharmacokinetic study of osimertinib in cancer patients with mild or moderate hepatic impairment. J. Pharmacol. Exp. Ther. 369 (2), 291–299. doi:10.1124/jpet.118.255919
Greig, M. J., Niessen, S., Weinrich, S. L., Feng, J. L., Shi, M., and Johnson, T. O. (2015). Effects of activating mutations on EGFR cellular protein turnover and amino acid recycling determined using SILAC mass spectrometry. Int. J. Cell Biol. 798936, 798936. doi:10.1155/2015/798936
Greig, S. L. (2016). Osimertinib: first global approval. Drugs 76, 263–273. doi:10.1007/s40265-015-0533-4
Harvey, R. D., Aransay, N. R., Isambert, N., Lee, J. S., Arkenau, T., Vansteenkiste, J., et al. (2018). Effect of multiple-dose osimertinib on the pharmacokinetics of simvastatin and rosuvastatin. Br. J. Clin. Pharmacol. 84 (12), 2877–2888. doi:10.1111/bcp.13753
Hashino, Y., Hatsuyama, T., Iwayama, K., Hoshi, T., Wakamoto, A., Ohtaki, K., et al. (2023). The relationship between efficacy and safety of osimertinib blood concentration in patients with EGFR mutation-positive lung cancer: a prospective observational study. Vivo 37 (6), 2669–2677. doi:10.21873/invivo.13376
Ishikawa, E., Yokoyama, Y., Chishima, H., Kasai, H., Kuniyoshi, O., Kimura, M., et al. (2023). Population pharmacokinetics, pharmacogenomics, and adverse events of osimertinib and its two active metabolites, AZ5104 and AZ7550, in Japanese patients with advanced non-small cell lung cancer: a prospective observational study. Invest. New Drugs. 41 (1), 122–133. doi:10.1007/s10637-023-01328-9
Jin, Y., Lin, C., Shi, X., He, Q., Yan, J., Yu, X., et al. (2022). Impact of clinical and molecular features on efficacy and outcome of patients with non-small cell lung cancer receiving second-line osimertinib. BMC Cancer 22 (1), 586. doi:10.1186/s12885-022-09683-1
Johnson, T. N., Cleary, Y., Parrott, N., Reigner, B., Smith, J. R., and Toovey, S. (2019). Development of a physiologically based pharmacokinetic model for mefloquine and its application alongside a clinical effectiveness model to select an optimal dose for prevention of malaria in young Caucasian children. Br. J. Clin. Pharmacol. 85 (1), 100–113. doi:10.1111/bcp.13764
Kishikawa, T., Kasai, T., Okada, M., Nakachi, I., Soda, S., Arai, R., et al. (2020). Osimertinib, a third-generation EGFR tyrosine kinase inhibitor: a retrospective multicenter study of its real-world efficacy and safety in advanced/recurrent non-small cell lung carcinoma. Thorac. Cancer 11 (4), 935–942. doi:10.1111/1759-7714.13378
Lee, K. S. S., Yang, J., Niu, J., Ng, C. J., Wagner, K. M., Dong, H., et al. (2019). Drug-target residence time affects in vivo target occupancy through multiple pathways. ACS central Sci. 5 (9), 1614–1624. doi:10.1021/acscentsci.9b00770
Li, X., Frechen, S., Moj, D., Lehr, T., Taubert, M., Hsin, C.-H., et al. (2020). A physiologically based pharmacokinetic model of voriconazole integrating time-dependent inhibition of CYP3A4, genetic polymorphisms of CYP2C19 and predictions of drug–drug Interactions. Clin. Pharmacokinet. 59, 781–808. doi:10.1007/s40262-019-00856-z
Liu, T.-C., Jin, X., Wang, Y., and Wang, K. (2017). Role of epidermal growth factor receptor in lung cancer and targeted therapies. Am. J. Cancer Res. 7 (2), 187–202.
Low, J. L., Lim, S. M., Lee, J. B., Cho, B. C., and Soo, R. A. (2023). Advances in the management of non-small-cell lung cancer harbouring EGFR exon 20 insertion mutations. Ther. Adv. Med. Oncol. 15, 17588359221146131–19. doi:10.1177/17588359221146131
Pharmaceuticals and Medical Devices Agency (PMDA) (2023). PMDA. Available at: https://www.info.pmda.go.jp/go/interview/1/670227_4291045F1027_1_091_1F.pdf.
Pilla Reddy, V., Walker, M., Sharma, P., Ballard, P., and Vishwanathan, K. (2018). Development, verification, and prediction of osimertinib drug–drug interactions using PBPK modeling approach to inform drug label. CPT Pharmacometrics Syst. Pharmacol. 7 (5), 321–30. doi:10.1002/psp4.12289
Planchard, D., Brown, K. H., Kim, D.-W., Kim, S.-W., Ohe, Y., Felip, E., et al. (2016). Osimertinib Western and Asian clinical pharmacokinetics in patients and healthy volunteers: implications for formulation, dose, and dosing frequency in pivotal clinical studies. Cancer Chemother. Pharmacol. 77, 767–76. doi:10.1007/s00280-016-2992-z
Rodier, T., Puszkiel, A., Cardoso, E., Balakirouchenane, D., Narjoz, C., Arrondeau, J., et al. (2022). Exposure–response analysis of osimertinib in patients with advanced non-small-cell lung cancer. Pharmaceutics 14 (9), 1844. doi:10.3390/pharmaceutics14091844
Schwenger, E., Reddy, V. P., Moorthy, G., Sharma, P., Tomkinson, H., Masson, E., et al. (2018). Harnessing meta-analysis to refine an oncology patient population for physiology-based pharmacokinetic modeling of drugs. Clin. Pharmacol. Ther. 103 (2), 271–80. doi:10.1002/cpt.917
Thandra, K. C., Barsouk, A., Saginala, K., Aluru, J. S., and Barsouk, A. (2021). Epidemiology of lung cancer. Contemp. Oncol. 25 (1), 45–52. doi:10.5114/wo.2021.103829
Vishwanathan, K., Dickinson, P. A., Bui, K., Cassier, P. A., Greystoke, A., Lisbon, E., et al. (2018a). The effect of food or omeprazole on the pharmacokinetics of osimertinib in patients with non-small-cell lung cancer and in healthy volunteers. J. Clin. Pharmacol. 58 (4), 474–84. doi:10.1002/jcph.1035
Vishwanathan, K., Dickinson, P. A., So, K., Thomas, K., Chen, Y. M., De Castro Carpeño, J., et al. (2018b). The effect of itraconazole and rifampicin on the pharmacokinetics of osimertinib. Br. J. Clin. Pharmacol. 84 (6), 1156–69. doi:10.1111/bcp.13534
Vishwanathan, K., So, K., Thomas, K., Bramley, A., English, S., and Collier, J. (2019). Absolute bioavailability of osimertinib in healthy adults. Clin. Pharm. Drug Dev. 8 (2), 198–207. doi:10.1002/cpdd.467
Wang, G., Ji, Y., Li, X., Wang, Q., Gong, H., Wang, B., et al. (2019). Utilizing the combination of binding kinetics and micro-pharmacokinetics link in vitro α-Glucosidase inhibition to in vivo target occupancy. Biomolecules 9 (9), 493. doi:10.3390/biom9090493
Yamazaki, S. (2013). Translational pharmacokinetic-pharmacodynamic modeling from nonclinical to clinical development: a case study of anticancer drug, crizotinib. AAPS J. 15, 354–66. doi:10.1208/s12248-012-9436-4
Yasuda, H., Park, E., Yun, C.-H., Sng, N. J., Lucena-Araujo, A. R., Yeo, W.-L., et al. (2013). Structural, biochemical, and clinical characterization of epidermal growth factor receptor (EGFR) exon 20 insertion mutations in lung cancer. Sci. Transl. Med. 5 (216), 216ra177. doi:10.1126/scitranslmed.3007205
Yokota, H., Sato, K., Sakamoto, S., Okuda, Y., Fukuda, N., Asano, M., et al. (2022). Effects of CYP3A4/5 and ABC transporter polymorphisms on osimertinib plasma concentrations in Japanese patients with non-small cell lung cancer. Invest. New Drugs. 40 (6), 1254–62. doi:10.1007/s10637-022-01304-9
Zhai, X., Ward, R. A., Doig, P., and Argyrou, A. (2020). Insight into the therapeutic selectivity of the irreversible EGFR tyrosine kinase inhibitor osimertinib through enzyme kinetic studies. Biochemistry 59 (14), 1428–41. doi:10.1021/acs.biochem.0c00104
Keywords: osimertinib, PBPK model, ethnic differences, inter-patients variability, optimal dosing regimens
Citation: Liang F, Zhang Y, Xue Q and Yao N (2024) Exploring inter-ethnic and inter-patient variability and optimal dosing of osimertinib: a physiologically based pharmacokinetic modeling approach. Front. Pharmacol. 15:1363259. doi: 10.3389/fphar.2024.1363259
Received: 30 December 2023; Accepted: 22 February 2024;
Published: 04 March 2024.
Edited by:
Yurong Lai Faaps, Gilead, United StatesReviewed by:
Cindy Xia, ReNAgade Therapeutics, United StatesJames William Thomas Yates, AstraZeneca, United Kingdom
Copyright © 2024 Liang, Zhang, Xue and Yao. This is an open-access article distributed under the terms of the Creative Commons Attribution License (CC BY). The use, distribution or reproduction in other forums is permitted, provided the original author(s) and the copyright owner(s) are credited and that the original publication in this journal is cited, in accordance with accepted academic practice. No use, distribution or reproduction is permitted which does not comply with these terms.
*Correspondence: Na Yao, MTMwMTQzNzQxNjdAMTYzLmNvbQ==