 Xiaoqing Li
 Yunhai Bo1
 Lei Diao
 Fen Yang
95% of researchers rate our articles as excellent or good
Learn more about the work of our research integrity team to safeguard the quality of each article we publish.
Find out more
ORIGINAL RESEARCH article
Front. Pharmacol. , 04 March 2024
Sec. Drug Metabolism and Transport
Volume 15 - 2024 | https://doi.org/10.3389/fphar.2024.1322557
Background: ORIN1001, a first-in-class oral IRE1-α endoribonuclease inhibitor to block the activation of XBP1, is currently in clinical development for inhibiting tumor growth and enhancing the effect of chemical or targeted therapy. Early establishment of a population pharmacokinetic (PopPK) model could characterize the pharmacokinetics (PK) of ORIN1001 and evaluate the effects of individual-specific factors on PK, which will facilitate the future development of this investigational drug.
Methods: Non-linear mixed effect model was constructed by Phoenix NLME software, utilizing the information from Chinese patients with advanced solid tumors in a phase I clinical trial (Register No. NCT05154201). Statistically significant PK covariates were screened out by a stepwise process. The final model, after validating by the goodness-of-fit plots, non-parametric bootstrap, visual predictive check and test of normalized prediction distribution errors, was further applied to simulate and evaluate the impact of covariates on ORIN1001 exposure at steady state up to 900 mg per day as a single agent.
Results: A two-compartment model with first-order absorption (with lag-time)/elimination was selected as the best structural model. Total bilirubin (TBIL) and lean body weight (LBW) were considered as the statistically significant covariates on clearance (CL/F) of ORIN1001. They were also confirmed to exert clinically significant effects on ORIN1001 steady-state exposure after model simulation. The necessity of dose adjustments based on these two covariates remains to be validated in a larger population.
Conclusion: The first PopPK model of ORIN1001 was successfully constructed, which may provide some important references for future research.
Unfolded protein response (UPR), which is triggered by the accumulation of misfolded proteins exceeding the tolerable threshold of endoplasmic reticulum (ER), repairs the ER protein folding ability by enhancing the transcription and translation of chaperones and protein degradation factors (Wang and Kaufman, 2014). It has been confirmed as a major survival pathway of eukaryotes under stress (Ron and Walter, 2007; Hetz and Glimcher, 2009; Walter and Ron, 2011), and also a supporter for the growth of tumor cells, matrix and vascular systems through synthesizing anti-apoptotic proteins and secreting a variety of cytokines (Wang and Kaufman, 2014; Papaioannou and Chevet, 2018; Song et al., 2018). UPR promotes tumorigenicity, metastasis, drug resistance and adaptation to adverse micro-environment (nutrient deprivation, oxygen restriction, high metabolic demand and oxidative stress as examples) (Cubillos-Ruiz et al., 2017) of some solid tumors, such as breast, pancreatic, lung and skin cancers (Wang and Kaufman, 2016; Avril et al., 2017; Cubillos-Ruiz et al., 2017; Logue et al., 2018).
IRE1-α, a unique trans-membrane kinase-endoribonuclease signaling molecule of ER, is the most conservative and prominent enzyme in UPR (Lee et al., 2008; Lu et al., 2014). The transcription factor XBP1 could be activated by IRE1-α endoribonuclease (RNase), and then send signals including protein folding, glycosylation, quality control and lipid synthesis (Yoshida et al., 2001; Chen et al., 2020). Therefore, the small molecule inhibitor targeting IRE1-α and XBP1 to suppress UPR is considered as an important agent for tumor treatment and recurrence (Xie et al., 2018; Zhao et al., 2018).
ORIN1001 is a first-in-class IRE1-α RNase inhibitor to block the activation of XBP1 (Gabrail et al., 2021). In preclinical studies, ORIN1001 exhibited moderate anti-tumor efficacy when applied alone and also synergistic activity when used with standard therapeutic agents (such as docetaxel or paclitaxel). Accordingly, ORIN1001 is being studied for single-use or combined-use with standard treatment in clinical trials in order to explore its safety and effectiveness.
This study aims to establish a precise population pharmacokinetic (PopPK) model of ORIN1001 in order to evaluate the effects of internal and external factors on its pharmacokinetics (PK), based on existing information from a phase I clinical trial (single-use). The final developed PopPK model was used to not only characterize the PK of ORIN1001 but also explore some covariates with clinical significance on drug steady-state exposure after model simulation. This PopPK model will provide an important reference for subsequent clinical research of ORIN1001.
The dataset used for PopPK modeling was from the phase I clinical trial (Register No. NCT05154201) of ORIN1001, a basket clinical trial currently underway in Chinese patients with advanced solid tumors. This trial, approved by the Ethics Committee of Peking University Cancer Hospital and in accordance with the Declaration of Helsinki, was an open-label, dose-increasing and dose-extending study. All recruited subjects had signed informed consent forms. They were divided into seven groups and received ORIN1001 tablets orally once a day at different dose levels (100, 200, 300, 400, 500, 650 and 900 mg). Throughout the research process, they were observed for 4 days following a single dose (single-dose period) and then for a cycle of 21 days after being administered daily (multiple-dose period). Sparse blood samples were mainly collected before and after the administration at 1, 2, 4, 6, 8, 12, 24, 48, 72 and 96 h in the single-dose period, and at 1, 2, 4, 6, 8, 12 and 24 h on day 21 in the multiple-dose period.
The concentration of ORIN1001 in plasma was determined by a validated liquid chromatography-tandem mass spectrometry (LC-MS/MS) method with ORIN1001-d8 applied as the internal standard. After protein precipitated using methanol, the samples were chromatographed on the Waters Xbridge C18 column (2.1*50 mm, 3.5 μm particle size) with a column temperature at 40°C. The mobile phase A was water (containing 0.1% formic acid), and the mobile phase B was the combination of acetonitrile and methanol (50:50, v/v, containing 0.1% formic acid). The gradient was performed with the total flow at 0.6 mL/min as follows: 0–0.3 min 25%–25% B, 0.3–1.5 min 25%–55% B, 1.5–1.6 min 55%–95% B, 1.6–2.5 min 95%–95% B, followed by the re-equilibration for 2.0 min before the next injection. Mass spectrometric analysis was conducted on Sciex API 5500 equipped with a positive electrospray ionization source (ESI+). The settings for ESI source were as follows: IonSpray voltage, 5,500 V; Source temperature, 500°C; Collision gas, 9 units; Curtain gas, 40 psi; Nebulizing gas, 50 psi; Auxiliary gas, 60 psi; Entrance potential, 10 V. Multiple reaction monitoring (MRM) transitions and related collision energy were m/z 362.2→247.0 (30 eV) for ORIN1001 and m/z 370.3→247.1 (30 eV) for ORIN1001-d8. The linear range of ORIN1001 in plasma was 50–20,000 ng/mL. Accuracy and precision were both within the acceptable range of bioanalytical assay validation criteria (e.g., ±15%) issued by the Food and Drug Administration.
The PK parameters of ORIN1001 were calculated by the non-compartmental analysis (NCA) using Phoenix (RRID:SCR_003163) WinNonlin software (version 8.3, Pharsight Corporation, CA, United States), including clearance rate (CL/F), apparent distribution volume (Vz/F), elimination half-life (t1/2), the area under the concentration-time curve from zero to the last time (AUC0-t) and from zero to infinity (AUC0-inf). Other parameters were acquired directly from the observations, for instance, maximum observed plasma concentration (Cmax) and time to Cmax (Tmax).
The dose proportionality of ORIN1001 was assessed in both single- and multiple-dose. The calibration curve of ORIN1001 ranging from 100 to 900 mg was constructed by regression of the mean exposure (Y) of all subjects versus the dose (X). The linearity was assessed in terms of the correlation coefficient (R) which should be ≥0.99.
Non-linear mixed effect model was constructed using Phoenix (RRID:SCR_003163) NLME (Version 8.3, Pharsight Corporation, CA, United States), in which the first-order conditional estimation-extended least-squares (FOCE-ELS) method was used for model parameter estimation and test. R studio was applied for statistical analysis and data visualization during the modeling process (Version 4.2.0, R Project for Statistical Computing, RRID:SCR_001905, http://www.r-project.org/).
Based on the results of the dose proportionality, one-, two- and three-compartment models with zero-/first-order absorption and first-order elimination were attempted as the structural model, respectively. The parameter lag-time (Tlag) was tried to add in the absorption phase to explain the delay between administration and absorption. Inter-individual variability (η, eta, IIV) of the model parameters was described as an exponential model in Eq. (1):
where TVPi represented the typical estimation of the ith PopPK parameter, Pij and ηij were the estimation and IIV of the ith parameter for the jth subject, respectively.
Intra-individual variability (ε, epsilon, residual variability), was initially estimated by an additive, proportional or additive plus proportional error model. All random effects followed the normal distribution, including IIV with a mean of zero and a variance of ω2 (omega), as well as the intra-individual variability with a mean of 0 and a variance of σ2 (sigma).
The influence of continuous covariates on PK parameters was modeled using the power function (Eq. (2)), with normalization by the population median of the study cohort:
where Effecti represented the influence of the ith covariate on specific PK parameters, Covij was the actual covariate value of the ith covariate in the jth subject, Covmedian was the median of the covariate in study crowd, and θcovi was regarded as the fixed effects on PK parameters from covariate i.
The detailed information of some continuous covariates was directly gained from the computer-based medical record of patients, including age, height, weight, blood urea nitrogen (BUN), blood creatinine (Cr), alkaline phosphatase (ALP), lactate dehydrogenase (LDH), total bilirubin (TBIL), direct bilirubin (DBIL), indirect bilirubin (IBIL), aspartate aminotransferase (AST) and alanine aminotransferase (AST). Derived covariates such as body mass index (BMI) (Keys et al., 1972), body surface area (BSA) (Stevenson, 1937), lean body weight (LBW) (Janmahasatian et al., 2005), ideal body weight (IBW) (Robinson et al., 1983), creatinine clearance rate (CLcr) (Cockcroft and Gault, 1976), the percentage of body fat (BF%) and adjusted CLcr (adj CLcr, calculated using adjusted weight for BMI>25 kg/m2) (Winter et al., 2012), were calculated for fully utilizing covariate information.
In order to avoid covariate collinearity, the Pearson test was applied for correlation analysis between two covariates before the covariate model establishment. Only one of them could be selected by the univariate analysis process when the correlation coefficient was larger than 0.5 (p < 0.05). Then this covariate would be considered as the candidate covariate in the subsequent stepwise approach, which is implemented to search statistically significant variables. In forward addition, one covariate would be remained if the decline in objective function value (OFV) was larger than 3.84 (p < 0.05, df = 1) after adding it. Then, in backward addition, one covariate would be kicked out when the increase in OFV was larger than 6.64 (p < 0.01, df = 1) after deleting it. Moreover, a non-diagonal variance-covariance matrix for IIVs was also assessed to improve the PopPK model fitting.
At every stage of model establishment, model superiority comparisons were performed in order to obtain the best final model. Except for better examination of diagnostic plots, the reduction value of indicators (for example, the OFV, Akaike Information Criteria (AIC) and Bayesian information criteria (BIC)) exceeding 3.84 (p < 0.05, df = 1) also implied the superiority of PopPK model.
The precision and accuracy (expressed as residual standard error, RSE%) of final PopPK parameter estimations were evaluated to illustrate the model fitness. Goodness of fit (GOF) plots, visual predictive check (VPC), non-parametric bootstrap and test of normalized distribution errors (NPDE) were all crucial validation methods for demonstrating model reliability and robustness. GOF plots of ORIN1001 concentration in plasma included the scatterplots of (i) the observation value (DV) versus (vs.) population predicted value (PRED), (ii) the DV vs. individual predicted value (IPRED), (iii) the conditional weighted residuals (CWRES) vs. PRED and (iv) CWRES vs. time. VPC, simulated by the Monte Carlo technique, was calculated at 1,000 replicates per time. Subsequently, VPC simulations were compared with observations in the fifth, 50th and 95th percentiles to evaluate the predictive ability of the PopPK model. During the bootstrap screening process, estimated PK parameters and their 95% confidence interval (CI) were figured out using the virtual population (randomly sampling 1,000 times from the original datasets), and then compared with the results of the final model. NPDE values, simulated 1,000 runs of the observations, were considered to follow the standard normal distribution if the PopPK model was sufficiently superior.
In order to explore the impact of statistically significant covariates on ORIN1001 exposure at steady state (minimum concentration, Cmin,ss; maximum concentration, Cmax,ss; area under concentration-time curve, AUCss), simulations (n = 500 in every scenario) were conducted using final PopPK model in the virtual patients, whose covariates are defined as median (reference patients), 5th and 95th percentiles of covariate distribution (collectively considered as simulated patients). If the fold change of ORIN1001 steady-state exposure in simulated patients was within the range of 80%–125% relative to the reference patients after 900 mg dosing, inspected covariates were considered to have no clinical significance.
Modeling dataset was composed of 471 plasma drug concentrations (Figure 1) and clinical characteristics (Table 1) from 25 subjects. Corresponding PK parameters are calculated and displayed in Table 2. In the dose proportionality assessment (Supplementary Figure S1), the R values were 0.99 (Cmax-single dose), 0.99 (AUC0-t-single dose), 0.99 (Cmax-multiple dose), and 0.97 (AUC0-t-multiple dose), indicating the exposures of ORIN1001 were basically proportional to the dose. The dose-normalized plasma concentrations in the multiple-dose stage are shown in Supplementary Figure S2.
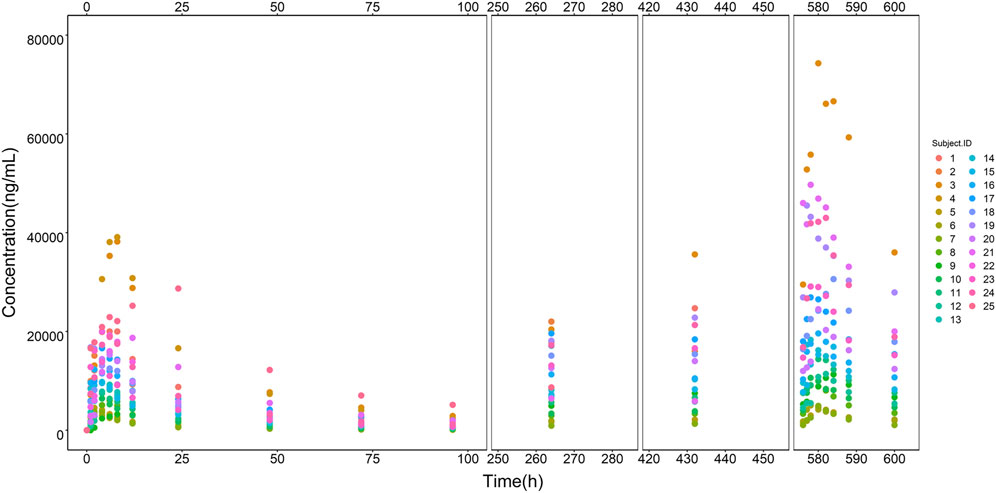
FIGURE 1. ORIN1001 concentration versus time points from all recruited subjects. The legend on the right shows the identification (ID) of each subject.
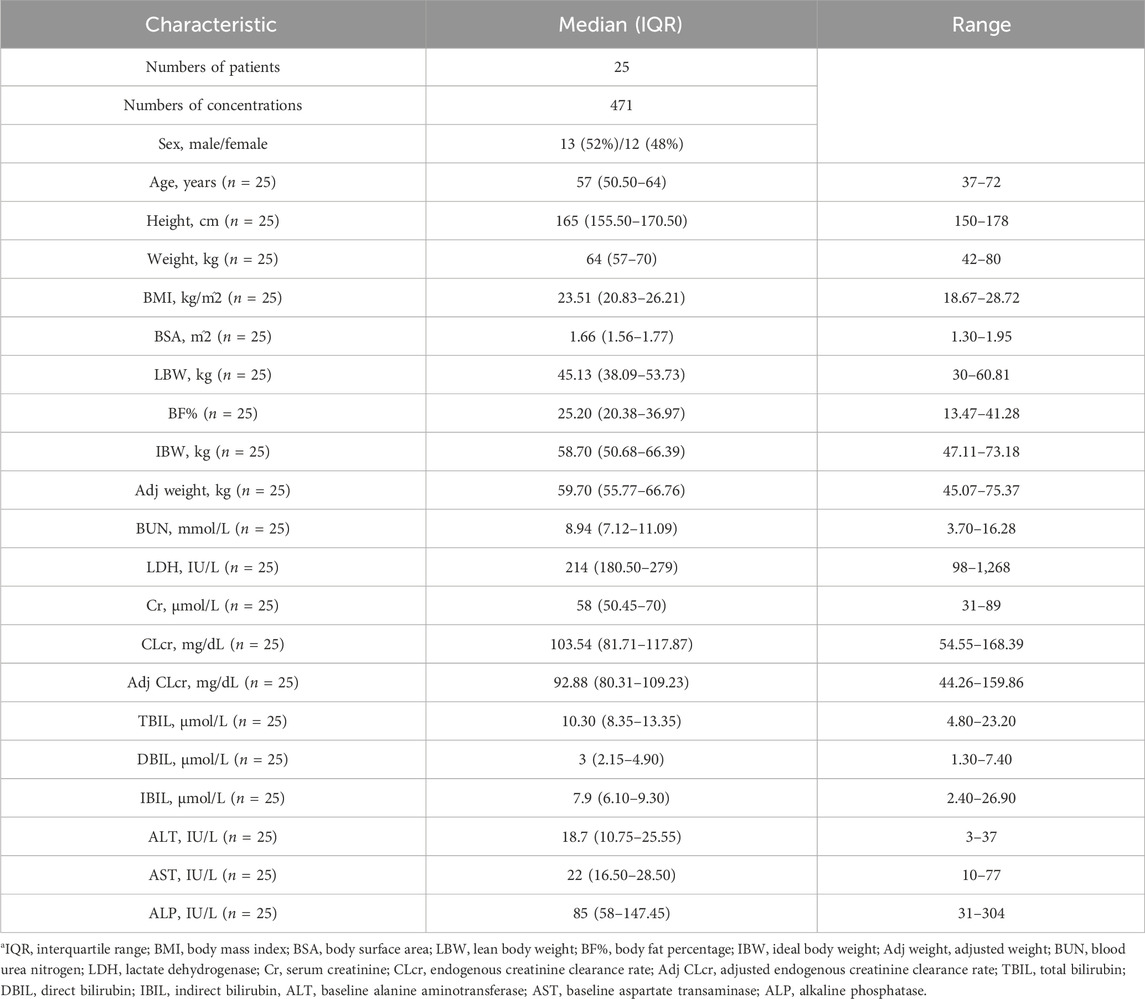
TABLE 1. Characteristics of baseline demographic and laboratory examinationsa.
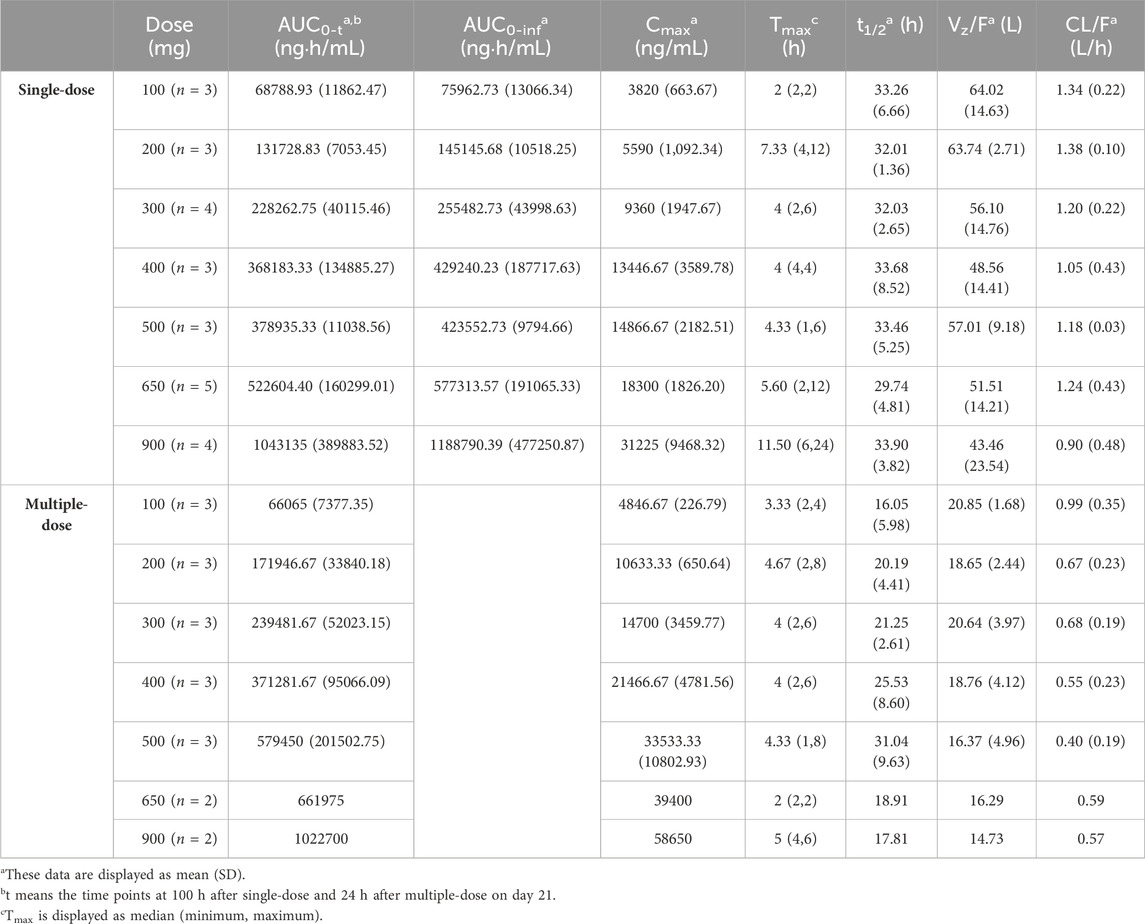
TABLE 2. Summary of the ORIN1001 pharmacokinetic parameters calculated using the non-compartmental analysis (NCA).
A two-compartment model with first-order absorption (with Tlag)/elimination was selected as the best structural model. Exponential model and proportional model were applied to describe the inter- and intra-individual variability, respectively. In the establishment stage of the covariate model, Pearson correlation coefficient between every two continuous variables was evaluated (Figure 2). Remained covariates were then entered into the stepwise screening process, including BUN, ALP, LDH, TBIL, AST, BMI, LBW and adj CLcr. The results of stepwise procedures after forward and backward selection are presented in Table 3. Detailed stepwise screening processes are shown in the Supplementary Material. The decrease in OFV by more than 3.84, observed upon incorporating covariate effects, signified the statistical significance of TBIL, LBW, and LDH as covariates in this PopPK model. The computational formulas of CL/F in the final model are shown below in Eq. (3):
where 1.07 L/h is the typical value of CL/F, as well as 10.3 μmol/L and 45.13 kg is the median of the covariate TBIL and LBW, respectively. The estimated effect coefficients such as −0.46 and 1.11, represent their covariate effect on PK parameters. The computational formulas of CL2/F, V/F and V2/F in the final model are shown in Supplementary Equations S1–S3.
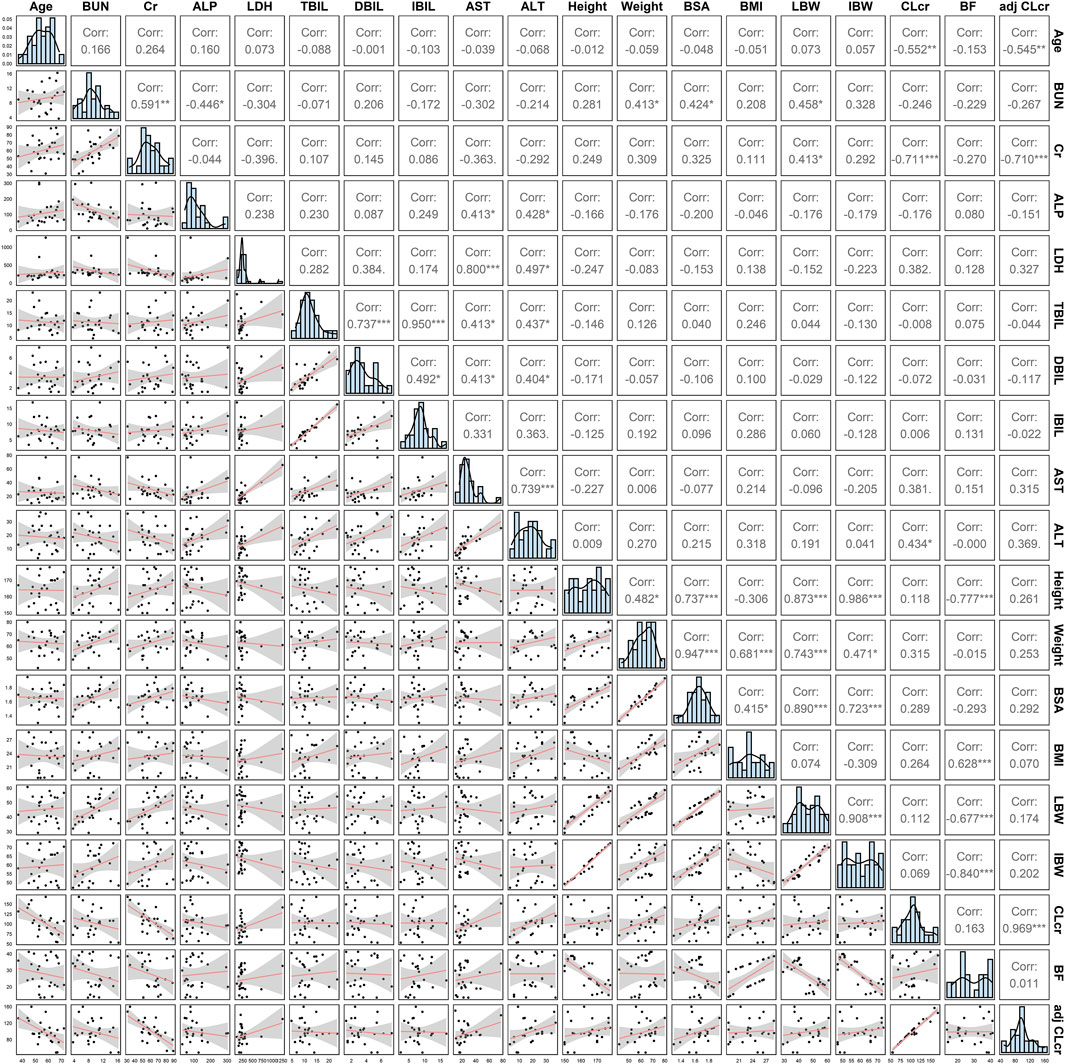
FIGURE 2. The covariate distribution and Pearson correlation between every two continuous covariates.
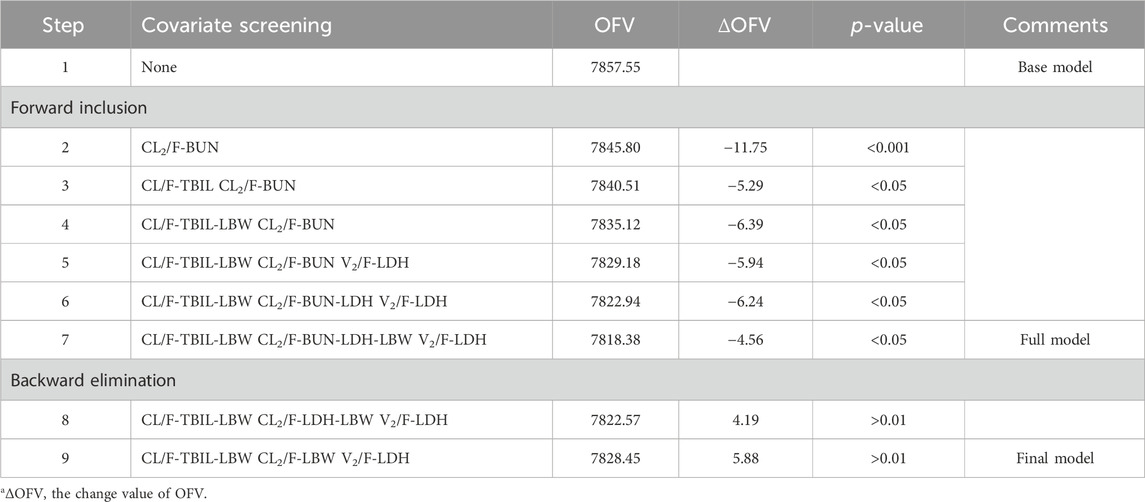
TABLE 3. Results of stepwise procedure including forward inclusion and backward eliminationa.
Typical values, inter-individual variability and residual variability of PK parameters were estimated in the base model (Supplementary Table S1) and final model with RSE% less than 30% (Table 4). Furthermore, it is displayed in Figure 3 that the individual simulated concentration-time curves of the final model could match all the observations well.
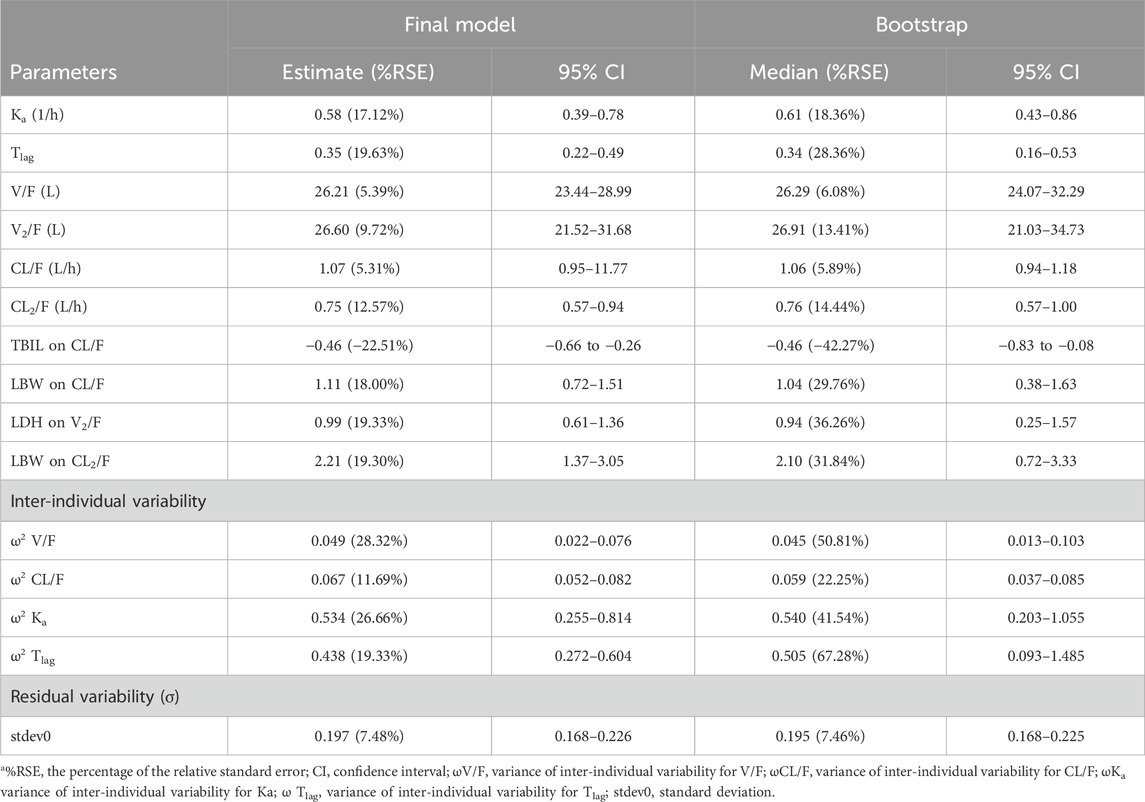
TABLE 4. Estimation of pharmacokinetics parameters in the best final model and bootstrap procedurea.
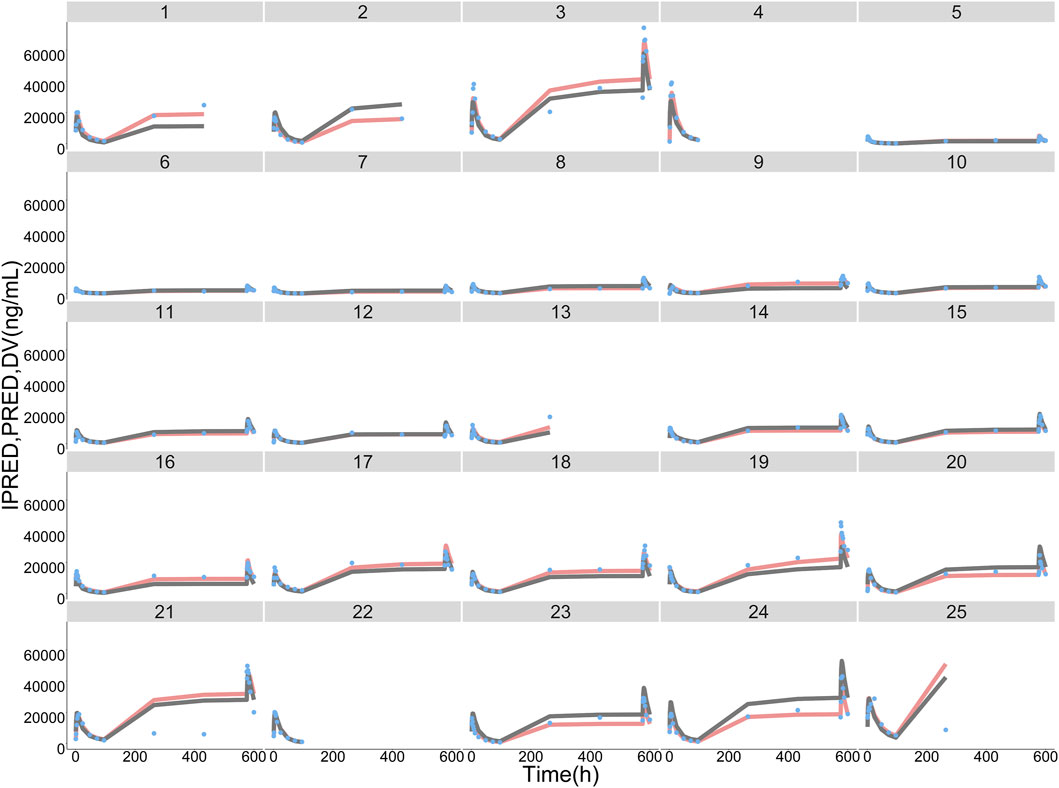
FIGURE 3. ORIN1001 concentration observations (DV, sky blue dots), population predictions (PRED, dark grey lines) and individual predictions (IPRED, pink lines) of the final population pharmacokinetic model. The numbers on the top of facets represent the corresponding subject identification.
The final PopPK model was also proved to be reliable and robust by the results of other model validation, including GOF plots, VPC, non-parametric bootstrap and NPDE. GOF plots are shown in Supplementary Figure S3. Observations (DV) versus PRED or IPRED plots were symmetrically distributed around the solid line (y = x), and CWRES versus PRED or time plots showed a random distribution of data points around the horizontal axis (y = 0) between −2 and 2, so no obvious model misspecifications were monitored. VPC plots (Figure 4) showed that the fifth, 50th and 95th quantiles of predicted values lie within the 95% CIs of the corresponding quantiles of the observations, demonstrating the excellent predictive performance of the final model. The VPC plots of the base model are shown in Supplementary Figure S4, indicating that the final model was proved to have a superior capacity than the base model in prediction accuracy. The estimations of final parameters were within the 95% CI of bootstrap predictions (Table 4), indicating the stability of the final PopPK model. NPDE values (Figure 5) followed the standard normal distribution, expressed by their even distribution around 0 and falling within the range of −1.96 to 1.96 (Statistical summary: Student’s t-test, p > 0.99; Fisher test, p = 0.682; Shapiro-Wilks test of normality, p = 0.51), which indicated the good predictability of the final model.
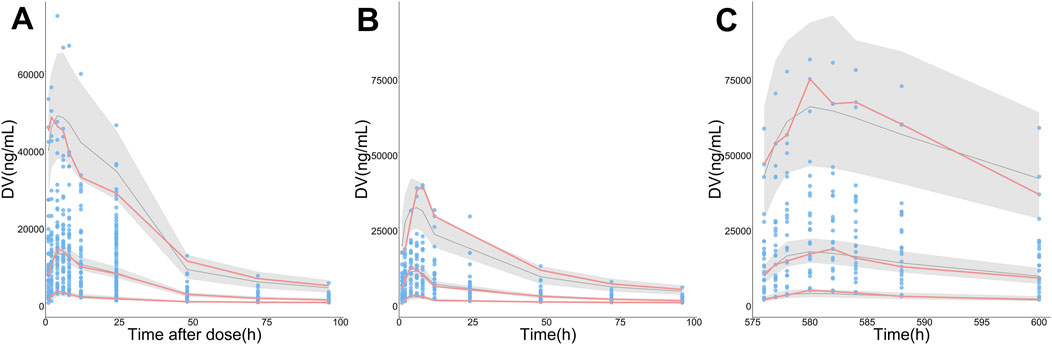
FIGURE 4. Visual predictive check (VPC) plots for the observations (DV) of ORIN1001. (A) DV versus time since the nearest administration (Time after dose), (B) DV versus time after the first administration (0–96 h, pharmacokinetic induction period), (C) DV versus time after the first administration (576–600 h, the last administration of continuous administration period, day 21 in cycle 1). The sky-blue points represent DV, while the pink solid lines represent the fifth, 50th, and 95th percentiles of DV. The black solid lines show the fifth, 50th and 95th percentiles of simulations, and the shaded regions represent their 95% confidence intervals.
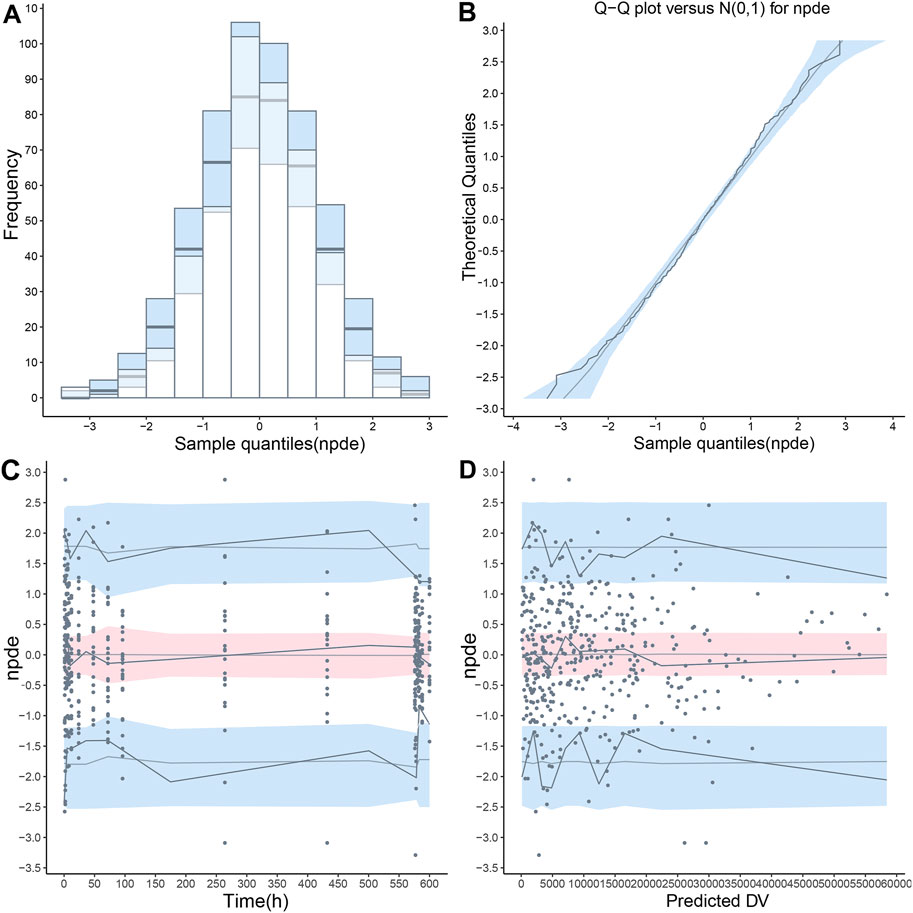
FIGURE 5. The normalized prediction distribution error (NPDE) value was calculated using the final population pharmacokinetic model. (A) Distribution histogram of NPDE value compared with the ideal standard normal distribution (sky blue histogram), (B) Quantile-quantile (QQ) plot of NPDE value against theoretical standard normal distribution (sky blue shade), (C) A scatterplot presenting NPDE value versus time, (D) A scatterplot presenting NPDE value versus population predictions (PRED). In the last two scatterplots, the observations were shown as blue points. The fifth, 50th and 95th percentiles of observations were shown as solid blue lines, and their 95% confidence intervals were shown as pink or sky-blue fields.
The clinically meaningful effect of TBIL and LBW on ORIN1001 steady-state exposure was observed after the simulation (Figure 6). Compared with typical 45.13 kg (median, LBW) patients, Cmin,ss was 34.7% lower in 59.98 kg patients (95th percentile, LBW) and 71.8% higher in 30.11 kg patients (fifth percentile, LBW). Compared with reference patients with TBIL of 10.3 μmol/L, Cmin,ss was 37.4% lower in patients with TBIL of 5.22 μmol/L (fifth percentile) and 58.6% higher in patients with TBIL of 22.24 μmol/L (95th percentile). The impact of LBW and TBIL on Cmax,ss and AUCss was identified to be similar to that on Cmin,ss, but to a lesser extent.
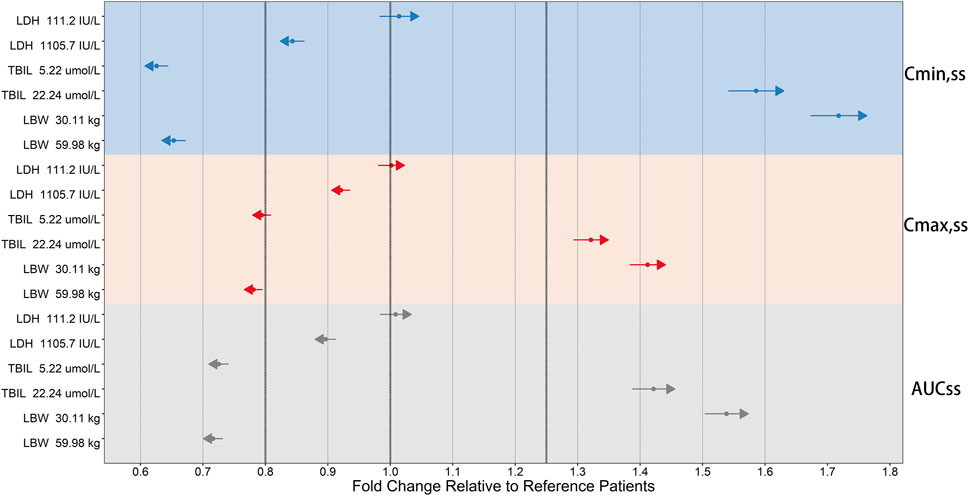
FIGURE 6. Forest plot of the influence of significant covariates on ORIN1001 steady-state exposure in patients with advanced solid tumors. Steady-state exposure indicators: AUCss, the area under the drug concentration-time profiles; Cmax,ss, the maximum blood drug concentration; Cmin,ss, the minimum blood drug concentration. The sky blue, pink, and gray backgrounds represent the influence of covariates on Cmin,ss, Cmax,ss and AUCss, respectively. Reference patients: lactate dehydrogenase (LDH) of 214 IU/L, total bilirubin (TBIL) of 10.3 μmol/L and lean body weight (LBW) of 45.13 kg. The covariate values for simulated patients were fixed at the 5th and 95th percentiles of the distribution of the modeling dataset. Calculate their steady-state exposure indicators and obtain the fold changes in the simulated population relative to the reference population. The fold changes of 0.8, 1 and 1.25 are shown as the three thick black dashed lines. The solid points and length of the arrows represent the mean and 95% confidence interval for the fold change (if the mean is greater than 1, the arrows point to the right; otherwise, they point to the left).
ORIN1001 is a first-in-class IRE1-α RNase inhibitor to treat tumors by blocking the XBP1 activation selectively and the drug is under clinical research currently. It is necessary to establish the PopPK model in the early stage of the clinical study because knowing about the sources of ORIN1001 PK differences between individuals will be helpful in guiding dose adjustments, improving efficacy and reducing toxicity. In this PopPK study, a two-compartment model with first-order absorption (with Tlag)/elimination was selected as the optimum structural model, in which Tlag, V/F and CL/F were estimated as 0.35 h, 26.21 L and 1.07 L/h, respectively. Following stepwise covariate selection, LDH, TBIL and LBW were considered to have statistically significant impacts on PK, but only TBIL and LBW were found to have clinically meaningful effects on ORIN1001 steady-state exposure.
The elimination of ORIN1001 in rats was associated with the liver and kidneys based on the results from preclinical studies, in which ORIN1001 was found to be mainly metabolized by the liver through aldehyde reduction and excreted through feces (64.4%) and urine (12.2%). Therefore, the liver and kidney functions were predicted to be related to ORIN1001 clearance in human. In this PopPK model, TBIL, an indicator of the metabolic and excretory functions of the liver (Tajiri and Shimizu, 2008), was recognized as a significant covariate affecting CL/F and exposure of ORIN1001. This result keeps pace with similar to that from the preclinical study mentioned above. However, CLcr and adj CLcr, indicators of kidney excretion, were not found to have statistically significant effects on the ORIN1001 PK in this study, partly due to the relatively lower contribution of ORIN1001 excretion through the kidney.
It was reported that LBW is a composite indicator derived from weight and BMI (McLeay et al., 2012). And LBW is more appropriate than body weight to contribute to quantifying variations in liver and kidney clearance among individuals because it facilitates a more effective conceptual transition between body composition and clearance, which has been confirmed in previous studies (Han et al., 2007). In the present study, LBW is also found to be a noteworthy covariate, which is consistent with the results from the previous research.
The limited number of subjects in this model seems to be an unneglected drawback, leading to the limit in the extrapolation and application of the model. However, the dense sampling of subjects can compensate for this disadvantage to some extent, fully utilizing the PK information of patients. In this study, TBIL and LBW were observed to play a significant role in explaining the between-subject variability in ORIN1001 PK. However, the necessity of dose adjustments based on these two covariates remains to be validated in a larger population. The reliability and robustness of the model will be further confirmed by means of another dataset from newly recruited subjects in subsequent research. Then, it will be utilized to simulate the concentration-time curves and forecast PK parameters of diverse subjects across various dosing regimens. The results may provide references for the design of clinical studies and accelerate the research process.
In this study, the first PopPK model of the novel anti-cancer drug ORIN1001 was successfully constructed in Chinese patients with advanced solid tumors. A two-compartment model with first-order absorption (with Tlag)/elimination was selected as the best structural model. TBIL and LBW were found to have statistically and clinically significant effects on ORIN1001 PK. This PopPK model will provide an important reference for future research on ORIN1001.
The datasets presented in this article are not readily available because of the confidentiality of innovative anti-tumor drugs. This article contains the original contributions proposed in the study, and further inquiries can be sought from the corresponding author. Requests to access the datasets should be directed to FY, eWY3ODU0QDE2My5jb20=.
The studies involving humans were approved by Ethics Committee of Peking University Cancer Hospital. The studies were conducted in accordance with the local legislation and institutional requirements. The participants provided their written informed consent to participate in this study.
FY: Data curation, Funding acquisition, Methodology, Supervision, Writing–original draft, Writing–review and editing, Resources, Software. XL: Data curation, Methodology, Software, Validation, Visualization, Writing–original draft. YB: Project administration, Supervision, Writing–review and editing, Software, Methodology. QZ: Data curation, Supervision, Writing–review and editing, Methodology, Project administration. LD: Data curation, Methodology, Writing–review and editing, Supervision. SG: Data curation, Methodology, Supervision, Writing–review and editing. JP: Data curation, Methodology, Supervision, Writing–review and editing. LL: Data curation, Writing–review and editing, Methodology, Supervision.
The author(s) declare that financial support was received for the research, authorship, and/or publication of this article. This work was supported by National Natural Science Foundation of China (No. 82073817), Beijing Natural Science Foundation (L232032) and Beijing Municipal Science and Technology Commission (No. Z231100004623006).
We would like to acknowledge all the investigators, participants and site/lab personnel who participated in this study.
Authors QZ, SG, and JP were employed by Fosun Orinove, Inc. Authors LD and LL were employed by Shanghai Fosun Pharmaceutical Development Co., Ltd.
The remaining authors declare that the research was conducted in the absence of any commercial or financial relationships that could be construed as a potential conflict of interest.
All claims expressed in this article are solely those of the authors and do not necessarily represent those of their affiliated organizations, or those of the publisher, the editors and the reviewers. Any product that may be evaluated in this article, or claim that may be made by its manufacturer, is not guaranteed or endorsed by the publisher.
The Supplementary Material for this article can be found online at: https://www.frontiersin.org/articles/10.3389/fphar.2024.1322557/full#supplementary-material
Avril, T., Vauleon, E., and Chevet, E. (2017). Endoplasmic reticulum stress signaling and chemotherapy resistance in solid cancers. Oncogenesis 6 (8), e373. doi:10.1038/oncsis.2017.72
Chen, S., Chen, J., Hua, X., Sun, Y., Cui, R., Sha, J., et al. (2020). The emerging role of XBP1 in cancer. Biomed. Pharmacother. 127, 110069. doi:10.1016/j.biopha.2020.110069
Cockcroft, D. W., and Gault, M. H. (1976). Prediction of creatinine clearance from serum creatinine. Nephron 16 (1), 31–41. doi:10.1159/000180580
Cubillos-Ruiz, J. R., Bettigole, S. E., and Glimcher, L. H. (2017). Tumorigenic and immunosuppressive effects of endoplasmic reticulum stress in cancer. Cell 168 (4), 692–706. doi:10.1016/j.cell.2016.12.004
Gabrail, N. Y., Hamilton, E. P., Elias, A. D., Rimawi, M. F., Li, C., Corvez, M. M., et al. (2021). A phase 1/2 trial of ORIN1001, a first-in-class IRE1 inhibitor, in patients with advanced solid tumors. Philadelphia, Pennsylvania, United States: Wolters Kluwer Health.
Han, P. Y., Duffull, S. B., Kirkpatrick, C. M., and Green, B. (2007). Dosing in obesity: a simple solution to a big problem. Clin. Pharmacol. Ther. 82 (5), 505–508. doi:10.1038/sj.clpt.6100381
Hetz, C., and Glimcher, L. H. (2009). Fine-tuning of the unfolded protein response: assembling the IRE1alpha interactome. Mol. Cell 35 (5), 551–561. doi:10.1016/j.molcel.2009.08.021
Janmahasatian, S., Duffull, S. B., Ash, S., Ward, L. C., Byrne, N. M., and Green, B. (2005). Quantification of lean bodyweight. Clin. Pharmacokinet. 44 (10), 1051–1065. doi:10.2165/00003088-200544100-00004
Keys, A., Fidanza, F., Karvonen, M. J., Kimura, N., and Taylor, H. L. (1972). Indices of relative weight and obesity. J. Chronic Dis. 25 (6), 329–343. doi:10.1016/0021-9681(72)90027-6
Lee, K. P., Dey, M., Neculai, D., Cao, C., Dever, T. E., and Sicheri, F. (2008). Structure of the dual enzyme Ire1 reveals the basis for catalysis and regulation in nonconventional RNA splicing. Cell 132 (1), 89–100. doi:10.1016/j.cell.2007.10.057
Logue, S. E., McGrath, E. P., Cleary, P., Greene, S., Mnich, K., Almanza, A., et al. (2018). Inhibition of IRE1 RNase activity modulates the tumor cell secretome and enhances response to chemotherapy. Nat. Commun. 9 (1), 3267. doi:10.1038/s41467-018-05763-8
Lu, Y., Liang, F. X., and Wang, X. (2014). A synthetic biology approach identifies the mammalian UPR RNA ligase RtcB. Mol. Cell 55 (5), 758–770. doi:10.1016/j.molcel.2014.06.032
McLeay, S. C., Morrish, G. A., Kirkpatrick, C. M., and Green, B. (2012). The relationship between drug clearance and body size: systematic review and meta-analysis of the literature published from 2000 to 2007. Clin. Pharmacokinet. 51 (5), 319–330. doi:10.2165/11598930-000000000-00000
Papaioannou, A., and Chevet, E. (2018). Driving cancer tumorigenesis and metastasis through UPR signaling. Curr. Top. Microbiol. Immunol. 414, 159–192. doi:10.1007/82_2017_36
Robinson, J. D., Lupkiewicz, S. M., Palenik, L., Lopez, L. M., and Ariet, M. (1983). Determination of ideal body weight for drug dosage calculations. Am. J. Hosp. Pharm. 40 (6), 1016–1019. doi:10.1093/ajhp/40.6.1016
Ron, D., and Walter, P. (2007). Signal integration in the endoplasmic reticulum unfolded protein response. Nat. Rev. Mol. Cell Biol. 8 (7), 519–529. doi:10.1038/nrm2199
Song, M., Sandoval, T. A., Chae, C. S., Chopra, S., Tan, C., Rutkowski, M. R., et al. (2018). IRE1α-XBP1 controls T cell function in ovarian cancer by regulating mitochondrial activity. Nature 562 (7727), 423–428. doi:10.1038/s41586-018-0597-x
Stevenson, P. J. c.j.o.p. (1937). Height. weight. surface formula for the estimation of surface area in Chinese subjects. 12, 327–330.
Tajiri, K., and Shimizu, Y. (2008). Practical guidelines for diagnosis and early management of drug-induced liver injury. World J. Gastroenterol. 14 (44), 6774–6785. doi:10.3748/wjg.14.6774
Walter, P., and Ron, D. (2011). The unfolded protein response: from stress pathway to homeostatic regulation. Science 334 (6059), 1081–1086. doi:10.1126/science.1209038
Wang, M., and Kaufman, R. J. (2014). The impact of the endoplasmic reticulum protein-folding environment on cancer development. Nat. Rev. Cancer 14 (9), 581–597. doi:10.1038/nrc3800
Wang, M., and Kaufman, R. J. (2016). Protein misfolding in the endoplasmic reticulum as a conduit to human disease. Nature 529 (7586), 326–335. doi:10.1038/nature17041
Winter, M. A., Guhr, K. N., and Berg, G. M. (2012). Impact of various body weights and serum creatinine concentrations on the bias and accuracy of the Cockcroft-Gault equation. Pharmacotherapy 32 (7), 604–612. doi:10.1002/j.1875-9114.2012.01098.x
Xie, H., Tang, C. H., Song, J. H., Mancuso, A., Del Valle, J. R., Cao, J., et al. (2018). IRE1α RNase-dependent lipid homeostasis promotes survival in Myc-transformed cancers. J. Clin. Invest. 128 (4), 1300–1316. doi:10.1172/JCI95864
Yoshida, H., Matsui, T., Yamamoto, A., Okada, T., and Mori, K. (2001). XBP1 mRNA is induced by ATF6 and spliced by IRE1 in response to ER stress to produce a highly active transcription factor. Cell 107 (7), 881–891. doi:10.1016/s0092-8674(01)00611-0
Keywords: population pharmacokinetic model, ORIN1001, model construction, model evaluation, model simulation
Citation: Li X, Bo Y, Zeng Q, Diao L, Greene S, Patterson J, Liu L and Yang F (2024) Population pharmacokinetic model for oral ORIN1001 in Chinese patients with advanced solid tumors. Front. Pharmacol. 15:1322557. doi: 10.3389/fphar.2024.1322557
Received: 16 October 2023; Accepted: 19 February 2024;
Published: 04 March 2024.
Edited by:
Jiangxin Wang, Shenzhen University, ChinaCopyright © 2024 Li, Bo, Zeng, Diao, Greene, Patterson, Liu and Yang. This is an open-access article distributed under the terms of the Creative Commons Attribution License (CC BY). The use, distribution or reproduction in other forums is permitted, provided the original author(s) and the copyright owner(s) are credited and that the original publication in this journal is cited, in accordance with accepted academic practice. No use, distribution or reproduction is permitted which does not comply with these terms.
*Correspondence: Fen Yang, eWY3ODU0QDE2My5jb20=
Disclaimer: All claims expressed in this article are solely those of the authors and do not necessarily represent those of their affiliated organizations, or those of the publisher, the editors and the reviewers. Any product that may be evaluated in this article or claim that may be made by its manufacturer is not guaranteed or endorsed by the publisher.
Research integrity at Frontiers
Learn more about the work of our research integrity team to safeguard the quality of each article we publish.