
94% of researchers rate our articles as excellent or good
Learn more about the work of our research integrity team to safeguard the quality of each article we publish.
Find out more
ORIGINAL RESEARCH article
Front. Pharmacol., 28 February 2023
Sec. Translational Pharmacology
Volume 14 - 2023 | https://doi.org/10.3389/fphar.2023.912962
 Yuancheng Chen1,2,3,4†
 Xiaojie Wu1,2,3,4†Chengyuan Tsai5Liwen Chang5Jicheng Yu1,2,3,4Guoying Cao1,2,3,4Beining Guo1,2,3Yaoguo Shi1,2,3,4Demei Zhu1,2,3
 Fupin Hu1,2,3Jinyi Yuan1,3
 Yang Liu1,3Xu Zhao1,3Yingyuan Zhang1,2,3Jufang Wu1,2,3,4
 Jing Zhang1,2,3,4*
Introduction: Nemonoxacin is an innovative quinolone antibiotic for treatment of community-acquired pneumonia (CAP). As more data are available from clinical studies, it is necessary to perform an integrative pharmacokinetic/pharmacodynamic (PK/PD) analysis to support and justify the optimal dosing regimen of nemonoxacin in clinical practice.
Methods and Results: We developed a population PK model using non-linear mixed effect model based on the data of 195 Chinese subjects receiving nemonoxacin in phase I to III clinical trials. The base model was a standard two-compartment PK model defined by clearance (12 L/h) and central volume of distribution (86 L). Covariates included creatinine clearance (CLcr), body weight (BW), sex, disease status and food. Compared to the subject with BW 60 kg, Cmax and
Conclusion: Integrative PK/PD analysis justifies the reliable clinical and microbiological efficacy of nemonoxacin 500 mg q24 h in treating CAP caused by S. pneumoniae, S. aureus, and K. pneumoniae, irrespective of patient sex, mild renal impairment, empty stomach or not. However, nemonoxacin 750 mg q24 h would provide better efficacy than 500 mg q24 h for the CAP caused by H. parainfluenzae in terms of CFR.
Nemonoxacin is a novel non-fluorinated quinolone developed by TaiGen Biotechnology. It has been approved for treatment of community-acquired pneumonia (CAP) in adult patients. Nemonoxacin has potent in vitro activities against target pathogens of CAP. Especially for penicillin-resistant Streptococcus pneumoniae and methicillin-resistant Staphylococcus aureus (MRSA), nemonoxacin is more active than levofloxacin (Li et al., 2010). In addition, nemonoxacin also has in vitro activity against Gram-negative bacteria equivalent to levofloxacin (Arjona et al., 2009; Chen Y H et al., 2009). The clinical study conducted in the United States (US) indicated that nemonoxacin had an apparent linear pharmacokinetic (PK) profile. Early clinical trials have proved the good clinical efficacy of nemonoxacin 500 mg q24 h in CAP patients, which was equivalent to levofloxacin (Chung et al., 2010; Lin et al., 2010; van Rensburg et al., 2010). However, the PK profile of nemonoxacin has not been characterized in CAP patients so far.
CAP is one of the most common infectious diseases threatening human health (Nair & Niederman, 2011), and resulting in heavy medical cost, about 8.4–9.7 billion dollars in the US each year (Arnold et al., 2003). CAP is pulmonary infection caused by the pathogens in community, most of which are S. pneumoniae (15%–76%), H. influenzae (3%–46%), S. aureus (3%–14%), other Gram-negative bacteria (6%–20%), and atypical pathogen such as Mycoplasma pneumoniae and Chlamydia pneumoniae (Reimer & Carroll, 1998). Quinolones are broad-spectrum antimicrobial agents with potent activity against the pathogens of CAP. Chinese guidelines recommend quinolones as an important treatment of CAP (Respiratory Branch of Chinese Medical Association, 2006). However, quinolone-resistant strains are increasingly prevalent in S. pneumoniae and MRSA due to selective pressure caused by extensive and intensive clinical use of quinolone drugs (Rice, 2006). It is therefore urgently needed to develop more innovative quinolone drugs with more potent antibacterial activities and better safety profile. Nemonoxacin is one of the first achievements in such efforts (Wiles et al., 2010).
Pharmacokinetic/pharmacodynamic (PK/PD) analysis aims to develop a mathematical model which correlates PK with PD by comprehensively analyzing the relationship between time, drug concentration, and treatment effect (Gabrielsson & Green, 2009). After incorporating the variability between and/or within individuals, the PK/PD model could show the probability of concentration or response in the specified interval, thus the population PK/PD model could be also regarded as a statistical model. Population PK/PD study is especially useful for simulating the potential results of clinical trial with the available PK and PD data (Williams & Ette, 2000; Lu, 2004). The simulation based on population PK/PD model could improve the decision-making of clinicians in clinical treatment and facilitate the research and development of new drugs. Population PK/PD study has been successfully used in the clinical development of quinolone drugs such as moxifloxacin (Simon et al., 2003), levofloxacin (Preston et al., 1998), and garenoxacin (Van Wart et al., 2004). To our knowledge, no population PK/PD study has been published for nemonoxacin in CAP patients.
Nemonoxacin capsule has been licensed as innovative new drug in China for treatment of CAP. As more and more data are available from phase I to III clinical trials of nemonoxacin capsules (Guo et al., 2012a; Liu et al., 2017; Yuan et al., 2019), it is necessary to perform an integrative population PK/PD study to characterize the time profile of nemonoxacin in CAP patients, identify the potential significant covariates, derive PK/PD targets using logistic regression and other methods, and so to support and justify the optimal dosing regimen of nemonoxacin via Monte Carlo simulation.
The data included in this PK/PD analysis were derived from clinical studies of nemonoxacin capsules, including phase I clinical trial of oral nemonoxacin capsule (Study TG-873870-C-1), phase II clinical trial of oral nemonoxacin capsule in treatment of CAP (Study TG-873870-C-3), and phase III clinical trial to evaluate the efficacy and safety of oral nemonoxacin capsule versus levofloxacin in treatment of CAP (Study TG-873870-C-4) (Supplementary Table S1).
All the clinical trials were approved by the Ethics Committee of corresponding study center. The studies were conducted in compliance with good clinical practice guidelines and the Declaration of Helsinki. All subjects signed informed consent before study entry. Nemonoxacin was provided as 250 mg capsules (product of Huayu Wuxi Pharmaceutical Co., Ltd.). The inclusion and exclusion criteria for healthy volunteers and CAP patients were reported previously (Guo et al., 2012a; Liu et al., 2017; Yuan et al., 2019) (Supplementary Material, the first item, page 1–2).
Blood sample (4 ml) was collected at each sampling time point, and processed by centrifugation at 4°C (3,000 r/min, 10 min) within 1 h to separate plasma. The plasma (2 ml) was stored at 20°C and sent to the central laboratory at Huashan Hospital within 1 month for determining nemonoxacin concentration using liquid chromatography-tandem mass spectrometry. The assay method was validated successfully (Guo et al., 2012b), evidenced by lower limit of quantification (LLOQ) 0.005 mg/L, and linear range from 0.005 to 1 mg/L (R2 > 0.99). The intra- and inter-day precision was 2.2%–5.9% and 2.7%–6.9%, respectively, and intra- and inter-day accuracy was -0.7%–3.8% and −0.5%–11.0%, respectively.
The efficacy of nemonoxacin in treatment of CAP, including clinical efficacy and microbiological efficacy, was appropriately evaluated based on the predefined criteria (Supplementary Material).
The inappropriate data were removed in order to improve the robustness of PPK model, such as the data in case of poor subject compliance, mishandling of blood samples, inappropriately higher plasma concentrations or outliers, plasma concentrations lower than LLOQ, significant deviation of plasma concentration at the same time point based on Chauvenet Criterion (data will be removed if it meets the following requirement: |observation - mean| > Wn*(standard deviation), where Wn is the Chauvenet coefficient. Cumulative normal distribution probability of Chauvenet coefficient is 1–1/(4*n), where n is sample size (Ni et al., 2019)), or abnormal data revealed by diagnostic plot of PPK model, and the absolute value of weighted residual (|WRES|) > 5.
A total of 39 covariates were collected, including demographic data, vital signs, hematology tests, serum chemistry, disease status, food, concomitant medications, and clinical study center. The serum creatinine was measured using enzymatic method, and creatinine clearance (CLcr) was calculated by Cockcroft Gault formula. The missing data of covariates were imputed by the mean value of other subjects at the same time point (Supplementary Table S2). Some hematology and serum chemistry covariates were converted as follows in order to eliminate the effects of different normal ranges on calculation: measured value/[0.5×(upper limit of normal range + lower limit of normal range)]. The distribution of data was assessed visually based on histogram.
PPK analysis was performed using NONMEM (Version 7.4, ICON PLC, Ireland) and PDxPop software (Version 4.0, ICON PLC, Ireland). Intel Visual Fortran Compiler (Version 11.0, Intel Company, United States). R (Version 2.4.1, R Development Core Team), Xpose (Version 4.0, Uppsala University) and Phoenix WinNonlin (Version 6.0, Certara Company) were used to analyze the export results of PPK calculation. First-order (FO) and first-order conditional estimation with interaction (FOCEI) was used in parameter estimation. Model optimization was determined by objective function value (OBJ) and goodness-of-fit plot.
Compartment modeling based on mean concentration data from phase I trial showed that the PK profile of nemonoxacin in healthy subjects was consistent with two-compartment model, where the absorption was a first-order process. Therefore, it was used as the structure of base model in PPK analysis. Distribution of PK parameters was assumed to conform to lognormal distribution, and the exponential model was used to describe inter-individual variation:
where
Intra-individual variation of PK parameters was consistent with mixed model:
where Y and
For continuous variables, power (Eq. 3) or linear model (Eq. 4) were used to describe the effects of covariates on PK parameters:
Where Cov means covariate, θ is parameter. For categorical variables, the power (Eq. 5) or proportional model (Eq. 6) were used:
Value of Cov was 0 or 1. During the screening, the covariate model was tested on the PK parameter if one of the followings are met: 1) adding covariate on PK parameter could significantly reduce OBJ in the pre-screening (p < 0.05); 2) the relationship between covariate and PK parameter could be explained reasonably; 3) there are some correlation between ETA and covariate in the ETA-covariate plot (R2 ≥ 0.02).
Screening of covariates was performed by forward inclusion and backward elimination method. A covariate was included in the model when OBJ reduction was greater than 6.63 (p < 0.01) during forward inclusion. Power model, linear model, or proportional models were tested. A covariate was removed when OBJ increase was less than 10.8 (p > 0.001) during backward elimination.
Before covariate screening, the following priori information was added in the base model: 1) CLcr was added on CL since nemonoxacin was mainly eliminated by kidney (Guo et al., 2012a); 2) body weight (BW) was added on CL, V2, V3 and Q using power model, because pre-screening of covariates showed that introduction of BW on clearance and distribution volume could significantly reduce OBJ. The power exponent was set as 0.75, 1, 1 and 0.75, respectively, according to the literature (Germovsek et al., 2017; Holford & Anderson, 2017; Sinha et al., 2019). The power base was 70 kg (Germovsek et al., 2019).
Bootstrap analysis was used to evaluate the PPK model. The principle of bootstrap method has been described in our previous paper (Chen Y C et al., 2009). Bootstrap analysis was repeated 300 times. Visual predictive check (VPC) was used to verify PPK model (Wang & Zhang, 2012) using PsN software (Version 5.0.0, Uppsala University), where each subject was simulated 1000 times.
The effect of renal dysfunction on PK parameters was evaluated because CAP patients with moderate and severe renal dysfunction were not recruited in clinical trials. CLcr was specified as 0, 30, 50, 90, 150 or 200 ml/min, while measured values were used for other covariates. NONMEM was used to simulate the time profile of nemonoxacin following administration of 500 mg q24 h for 10 days. Each subject was simulated 50 times. Based on individual predicted values (IPRE), non-compartment PK parameters at steady state, such as AUC0-24,ss, Cmax,ss, Tmax, T1/2, CLss/F, Vss/F, MRT0-inf and Cmin,ss were calculated (Wu et al., 2015) using Matlab software (Version 7.0.1, Mathworks Co. Ltd., United States). Changes of PK parameters in patients with moderate and severe renal impairment were evaluated using subjects with normal renal function as control.
For other covariates, similar method was used to obtain the non-compartment PK parameters when the covariate took the specified value. Changes of PK parameters were evaluated to investigate the impact of covariate.
In order to verify that the covariates are indeed clinically significant, randomization test was used. In detail, the values in the randomized covariate column will be shuffled 1000 times, and then the model was run with each of the new dataset. Comparison between randomization test results and results based on original data were performed, including OBJ, estimation time and parameter values. This was implemented using PsN software.
The PK profile of nemonoxacin in all the subjects participating in phase II-III clinical trials was simulated using their actual dosing regimen in the trial. Each subject was simulated 100 times. AUC0-24 and Cmax of nemonoxacin at steady state were calculated.
The pathogenic bacteria were isolated from the blood or sputum cultures of CAP patients in phase II/III clinical trials. The minimum inhibitory concentration (MIC) of nemonoxacin was determined using the microdilution method recommended by the Clinical and Laboratory Standards Institute. MIC data were analyzed in terms of MIC50, MIC90, and distribution frequency.
The CAP patients with baseline isolate and efficacy data were selected to develop the PK/PD dataset. The PK/PD indices including AUC0-24/MIC, Cmax/MIC, and %T > MIC were calculated. The correlation between these PK/PD indices and efficacy was analyzed. Logistic regression, classification and regression tree (CART), receiver operating characteristic (ROC) curve, and contingency table were used to perform exposure-response analysis. The model for logistic regression was shown as follows [using Ln (AUC0-24/MIC)∼Clinical effect as the example]:
If the p-value for slope [the test statistic is Wald χ2, the formula is χ2=(slope/standard error (slope))2] is lower, the significance of the logistic regression model is higher.
PK/PD target was searched as follows: the range of PK/PD index was divided by 1000; after contingency table analysis, the area with p ≤ 0.05 was found. Within these areas, PK/PD target was further searched as follows: 1) p-value obtained from logistic regression was ≤0.05; 2) Youden index from ROC analysis [It both measures the effectiveness of a diagnostic marker and enables the selection of an optimal threshold value (cutoff point). Youden index = sensivity + specificity-1 (Fluss et al., 2005)] was the highest; 3) potential PK/PD target could be found by CART analysis. Lastly, PK/PD index (continuous variable) was converted to binary variable according to potential target, and subjected to logistic regression. The PK/PD target was confirmed when p-value was still ≤0.05.
In addition, putting the PK/PD target of nemonoxacin against various bacteria together, the correlation between PK/PD target and MIC data was analyzed using linear model. The MIC data means MIC50, or MIC90 or base-2 logarithm of them.
Probability of target attainment (PTA) and cumulative fraction of response (CFR: the probability for PK/PD index reach the target against specific bacteria with various MIC level) for two dosing regimens (500 mg or 750 mg, q24 h, 10 days) of nemonoxacin were evaluated by MCS using Matlab software as previously reported (Cao et al., 2013), in which the PK/PD target was obtained from exposure-response analysis.
Overall, 161 subjects (195 cases) were enrolled in phase I to III clinical trials of nemonoxacin, including 125 CAP patients. A total of 2027 plasma concentrations were available from these subjects for building the PPK dataset of nemonoxacin (Supplementary Table S1). The baseline characteristics of subjects were summarized in Table 1. Significant difference was found for some parameters between healthy subjects and CAP patients (Supplementary Table S3): 1) heart rate and body temperature increased; 2) white blood cell count and neutrophils increased, but the hemoglobin reduced by 6.4%; 3) alanine aminotransferase, γ-glutamyl transpeptidase, creatine kinase, serum creatinine and glucose increased, while the albumin decreased by 14% (all p < 0.01).
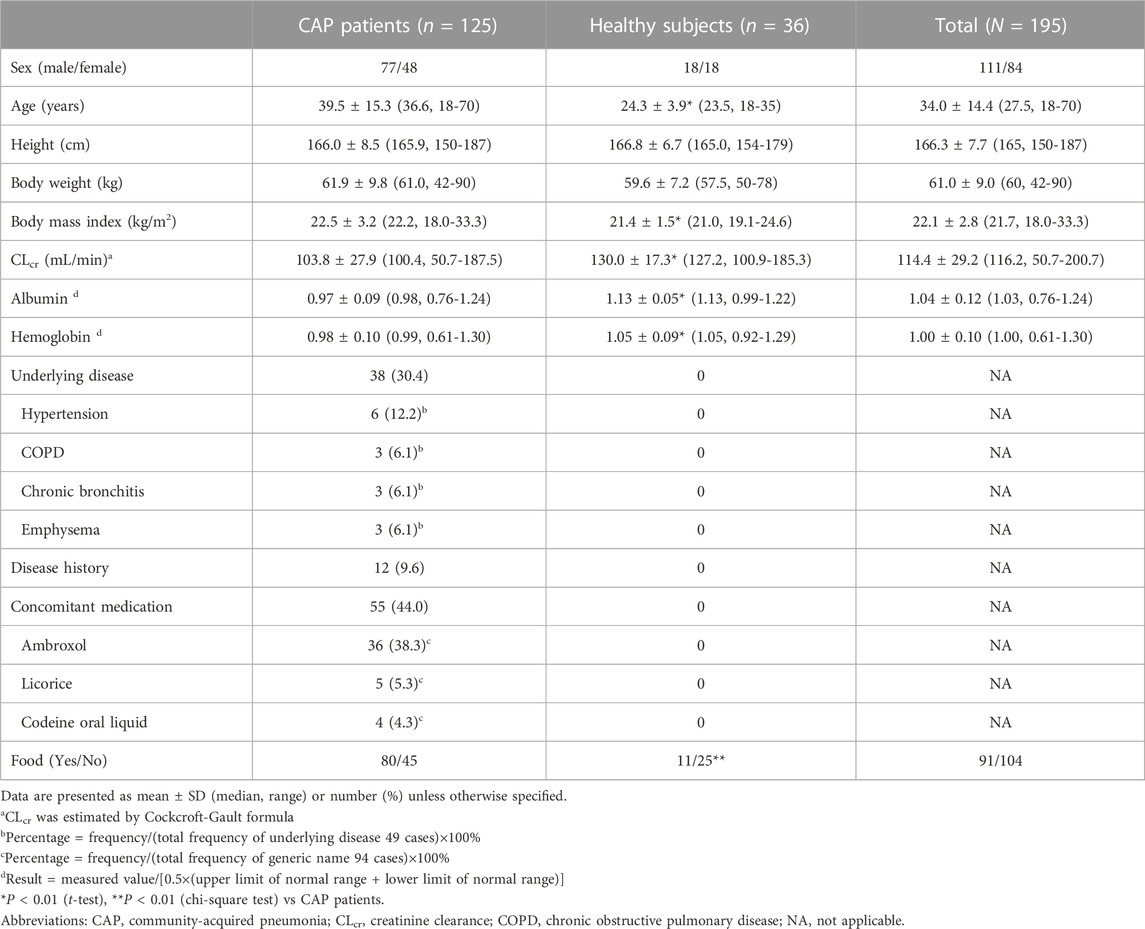
TABLE 1. Baseline characteristics of subjects in phase I to III clinical trials of nemonoxacin.
Finally, 2007 concentrations were included in the PPK database of nemonoxacin after removing the inappropriate data (20 concentrations, 0.987%), e.g., concentration below LLOQ, plasma concentration outliers based on Chauvenet Criterion, or revealed by diagnostic plot, or concentrations from the subjects with poor compliance.
The base PPK model of nemonoxacin was a two-compartment model, where the absorption was a first-order process with a Tlag. Model fitting improved significantly when inter-occasion variability (IOV) was introduced into clearance (CL), and the result of calculation became stable. Typical values of PK parameters were shown in Table 2. Meanwhile, the IIV (SD) and IOV (SD) of CL were 3.6% and 13%, and the IIV of V2 and V3 was 5.7% and 8.8%, respectively. The IIV of Ka and Tlag were 81% and 83%. IIV of bioavailability (F) was 19%. The proportional and additive errors were 0.18 and 0.0062, respectively.
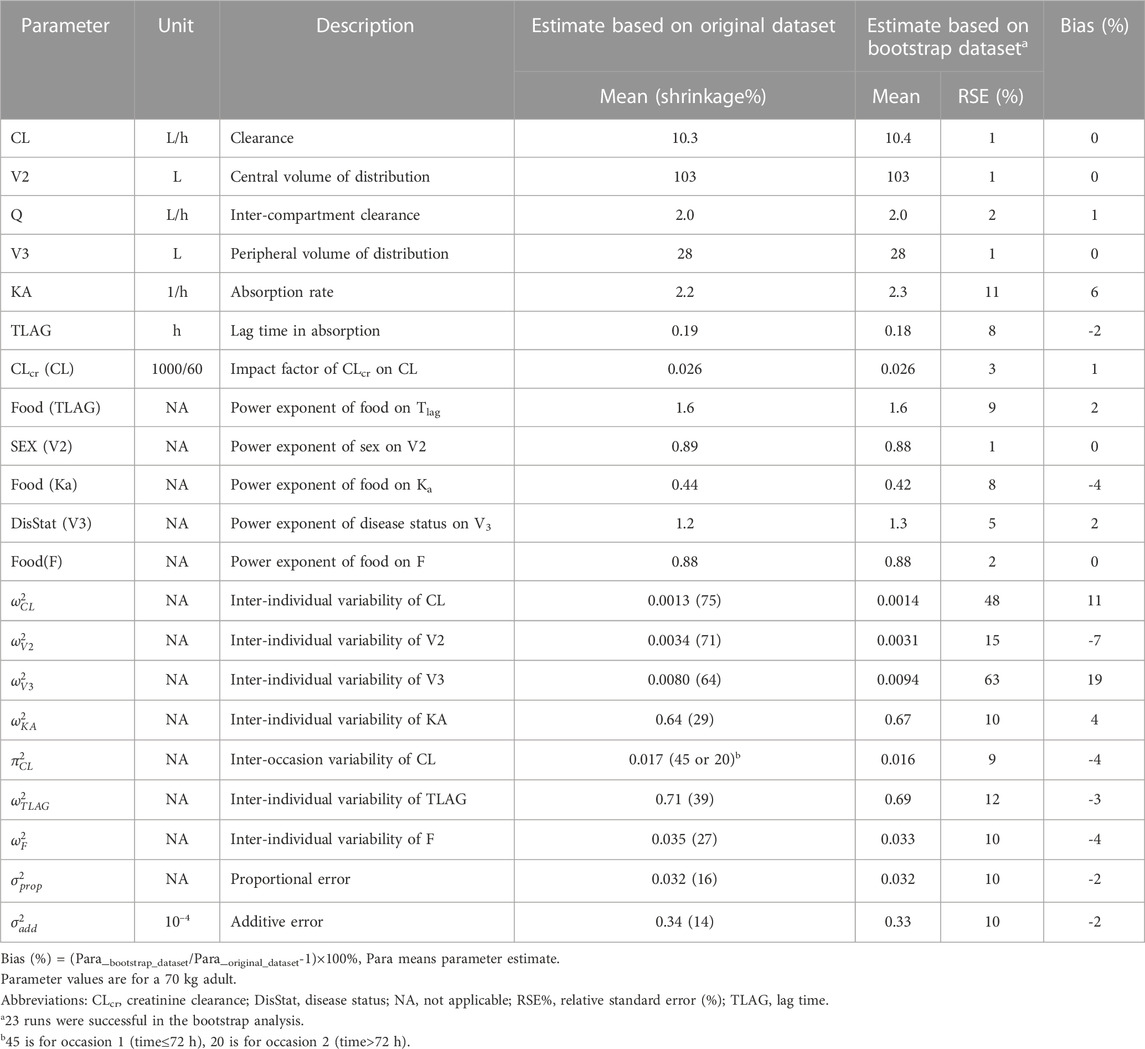
TABLE 2. Parameter estimates for final population pharmacokinetic model of nemonoxacin.
Age, bilirubin and concomitant medication were not included in the final model due to their variable effects on PK parameters. Using FO algorithm, seven covariates (CLcr, weight, sex, albumin, hemoglobin, food, and age) were preliminarily identified as significant covariates of PK parameters. Further screening by FOCEI algorithm confirmed that five covariates (CLcr, body weight, DisStat, sex, and food) were significant covariates of nemonoxacin PK parameters: CLcr was the covariates on CL, while food was the covariate on Ka, Tlag and F. Sex was the covariate on V2. Disease status (DisStat) was the covariate on V3. Body weight was the covariate on CL, V2, Q and V3.
The final PPK model was as follows, and parameter estimates are presented in Table 2.
Where CLcr denotes creatinine clearance. Value of sex was 0 for male and 1 for female. Value of food was 1 if taking food within 2 h before administration or within 30 min after administration, otherwise the value was 0. DisStat indicates disease status, 0 for healthy subjects and 1 for CAP patients.
In the backward elimination, the OBJ increased by 45, 33 and 16 if KA-Food, TLAG-Food or F1-Food was removed from final model, respectively. Meanwhile, the OBJ increased by 25 and 46 respectively, if V3-DisStat or V2-Sex was removed from the model. This suggested that these relations have significant impact on reducing OBJ of PPK model.
Final PPK model of nemonoxacin demonstrated that 1) clearance of nemonoxacin increased with CLcr; 2) central volume of distribution (V2) decreased by 11% in female subjects compared to male subjects; 3) absorption rate of nemonoxacin under fed condition was only 44% of that under fasting condition. Meanwhile, the lag in absorption time increased by 60%, and the absolute bioavailability reduced by 12%; 4) peripheral volume of distribution (V3) increased by 23% in CAP patients compared to healthy subjects; 5) CL, V2, Q and V3 increased along with body weight.
Based on the final PPK model, the correlation between population predicted values (PRED), IPRE, and observed concentrations (dependent variable, DV) are illustrated in Figure 1. Correlation coefficient (R2) was 0.79 and 0.95, indicating that the model explained most of the variances among PK data. Correlation between conditional weighted residuals (CWRES) and TIME was also shown in Figure 1. The data distributed evenly across the zero-horizontal line, and the correlation coefficient was very low (R2 = 2E-5). Histogram showed that the CWRES was consistent with normal distribution, while the PK parameters and their IIVs were consistent with log-normal and normal distribution, respectively. Correlations among the PK parameters of nemonoxacin were shown in Supplementary Table S4: 1) 4 pairs had high correlation (R2 > 0.7): V2-Q (R2 = 0.91), F-F_IIV (R2 = 0.83), Tlag-Tlag_IIV (R2 = 0.79) and V3-Q (R2 = 0.73). 2) 8 pairs had medium correlation (0.3 < R2 ≤ 0.7). For example, V2-V3 (R2 = 0.68), CL-Q (R2 = 0.60), KA-KA_IIV (R2 = 0.58) and CL_IIV-CL_IOV2 (R2 = 0.63). 3) Other pairs had low correlation (R2 ≤ 0.3).
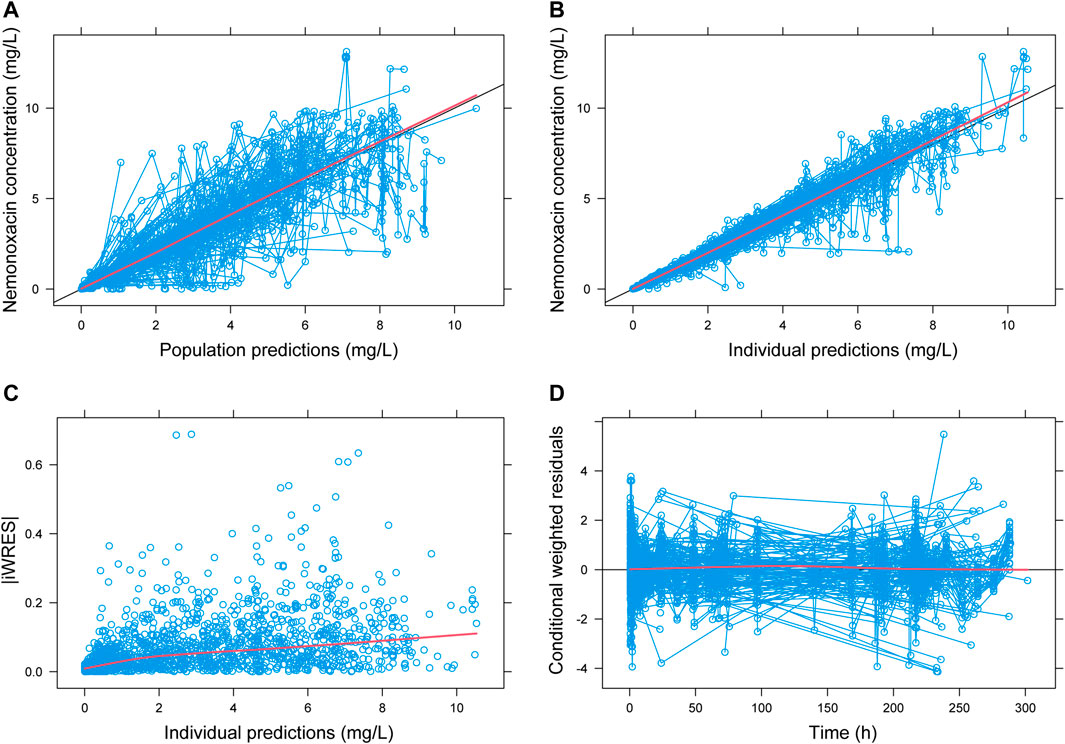
FIGURE 1. Goodness-of-fit plot for population PK model of nemonoxacin. iWRES: individual weighted residual. Blue circle: actual data. Black line: unity line (A,B) or zero horizontal line (D). Red line: locally weighted linear regression.
Bayesian analysis based on PPK model showed that nemonoxacin AUC0-24 was 42.0 and 65.5 mg·h/L, respectively after administration of 500 mg or 750 mg, which was close to the actual AUC0-24 (46.9 mg·h/L at dose of 500 mg, 62.5 mg·h/L at dose of 750 mg) in CAP patients. The predicted Cmax was 5.00 and 7.50 mg/L following dose of 500 or 750 mg, which was also close to the actual Cmax (5.42 mg/L at dose of 500 mg, 8.49 mg/L at dose of 750 mg) in CAP patients. These findings further confirmed the robustness of PPK model in predicting the exposure of nemonoxacin in CAP patients. Bayesian analysis predicted the AUC0-24 and Cmax in healthy subjects (37.8 mg·h/L and 4.94 mg/L) slightly lower than the actual AUC0-24 (42.4 mg·h/L) and Cmax (5.91 mg/L). This may be due to the inclusion of relevant covariates (such as sex) in the PPK model.
PK parameter estimates based on bootstrap dataset were close to that based on original dataset (Table 2). The range for relative bias was (-7%, 19%), most of the relative bias were within the range (-4%, 4%), indicating that the PPK model estimates were reliable. Based on bootstrap dataset, histograms demonstrated that: 1) 3 PK parameters (V3, F1-Food and V2-Sex) were consistent with normal distribution; 2) 12 PK parameters (such as CL, V2 and Ka-IIV) were consistent with left skewness; 3) 6 PK parameters (such as V2-IIV, CL-IOV and σadd) were consistent with right skewness (Supplementary Figure S1).
VPC results for the final PPK model are shown in Supplementary Figure S2. Most of the concentrations after single- and multiple-dose in healthy subjects located in 95% confidence interval (CI) of the simulated values based on PPK model. For CAP patients, the change pattern of plasma concentration was close to that of PPK model simulation. Most of the values located in 95% CI. VPC results for 750 mg and 250 mg of nemonoxacin were similar to that of 500 mg dose.
Effect of renal function on nemonoxacin PK parameters is shown in Supplementary Figures S3–S10. Compared to the subjects with normal renal function (CLcr = 200 ml/min), Vss/F and CLss/F of nemonoxacin reduced by 8% and 22%, respectively in subjects with mild renal insufficiency (60 < CLcr ≤ 89 ml/min). Cmax,ss and AUC0-24,ss increased by 8% and 28%, while T1/2 and MRT0-inf increased by 1.3 h (25%) and 2 h (25%), respectively. For CAP patients with renal failure (CLcr ≤ 15 ml/min), Cmax,ss and AUC0-24,ss of nemonoxacin increased by 13% and 47% respectively compared to the subjects with normal renal function.
As shown in the Supplementary Figures S3–S10, impact of BW on Cmax, AUC0-24, CLss/F and Vss/F ranks the first in that of all covariates. Compared to the subject with BW 60 kg, Cmax and AUC0-24,ss reduced by 24% and 19% in the subject with BW 80 kg, respectively. Meanwhile, CLss/F and Vss/F increased by 25% and 29%, respectively.
Impacts of food on PK parameters were mainly shown in Tmax, Cmax and Vss/F. Compared to the fasted status, Tmax of nemonoxacin increased by 1.2 h (65%) in the subject with fed status (Supplementary Figure S5). Meanwhile, Cmax reduced by 23% (Supplementary Figure S3), and Vss/F increased by 24% (Supplementary Figure S8). Impacts of food on other PK parameters were mild.
Generally, impacts of sex and disease status on PK parameters of nemonoxacin were small (change of PK parameters ≤19%). Compared to healthy subjects, Cmin,ss of nemonoxacin increased by 19% in CAP patients (Supplementary Figure S10), while Tmax increased by 11% (Supplementary Figure S5). Compared to male subjects, Cmin,ss reduced by 13% in female subjects.
Compared to final model, the reduction of OBJ decreased obviously after using randomization test (Supplementary Figure S11). OBJ reduction in final dataset was statistically significant lower than that in randomization dataset (p < 0.05) (Supplementary Table S5).
Baseline isolate was available for 246 CAP patients. Among them, 158 CAP patients had the efficacy data. A total of 175 strains were included in the evaluation dataset, including K. pneumoniae (25.7%), Haemophilus (25.7%), S. pneumoniae (17.7%) and S. aureus (11.4%). MIC distribution of nemonoxacin against CAP pathogens is illustrated in Figure 2. The MIC90 of nemonoxacin was both 0.125 mg/L against S. pneumoniae and S. aureus (MIC range 0.015–1 mg/L for both species). Most of the MIC values (80%) against K. pneumoniae were in the range of 0.125–0.5 mg/L (MIC90, 4 mg/L). Most of the MIC values (38.5% and 84.2%) for H. parainfluenzae and H. influenzae were in the range of 0.008–0.06 mg/L (MIC90, 2 and 1 mg/L).
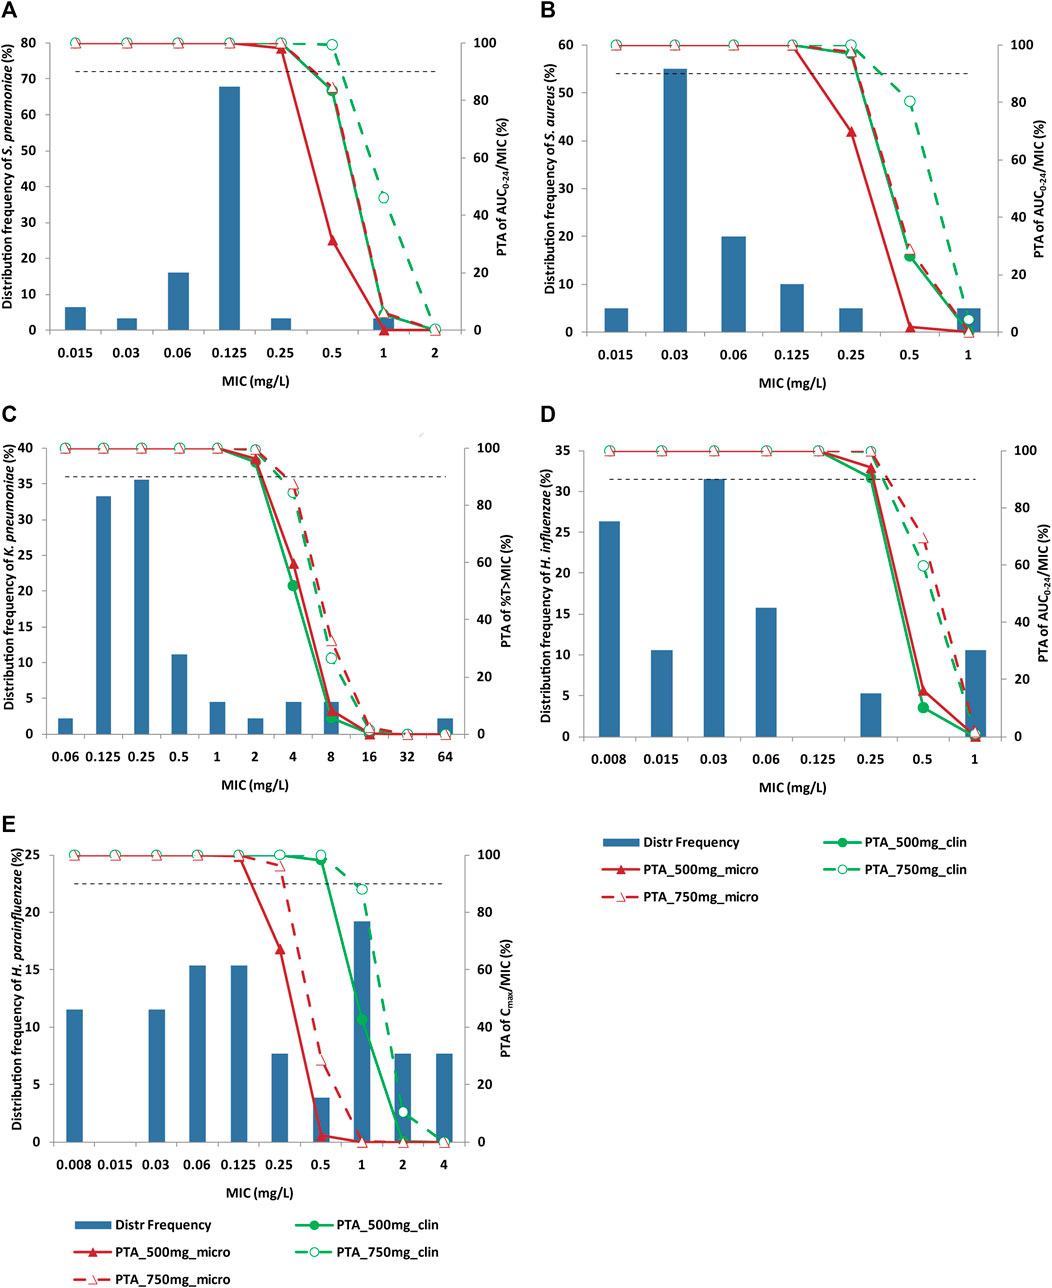
FIGURE 2. Distribution of nemonoxacin MIC against specific pathogen and PTA of PK/PD index. Panel (A) S. pneumoniae; Panel (B) S. aureus; Panel (C) K. pneumoniae; Panel (D) H. influenzae; Panel (E) H. parainfluenzae. Histograms and broken lines correspond to left and right y-axis, respectively. Solid line and dash line represent PTA for nemonoxacin 500 mg q24 h and 750 mg q24 h, respectively. Green and dark red colors represent clinical and microbiological targets, respectively. Horizontal dash line denotes 90% PTA. Nemonoxacin was administered q24 h for 10 days. MIC: minimum inhibitory concentration; PK/PD: pharmacokinetic/pharmacodynamic; PTA: probability of target attainment.
Figure 3 depicts the correlation between nemonoxacin PK/PD index and clinical efficacy. Probability for clinical success increased with the value of PK/PD index. The natural logarithm of AUC0-24/MIC and Cmax/MIC correlated with clinical efficacy much better than AUC0-24/MIC or Cmax/MIC. p-value of slope for Ln (AUC0-24/MIC), Ln (Cmax/MIC) and %T > MIC was 0.125, 0.151, and 0.112, respectively.
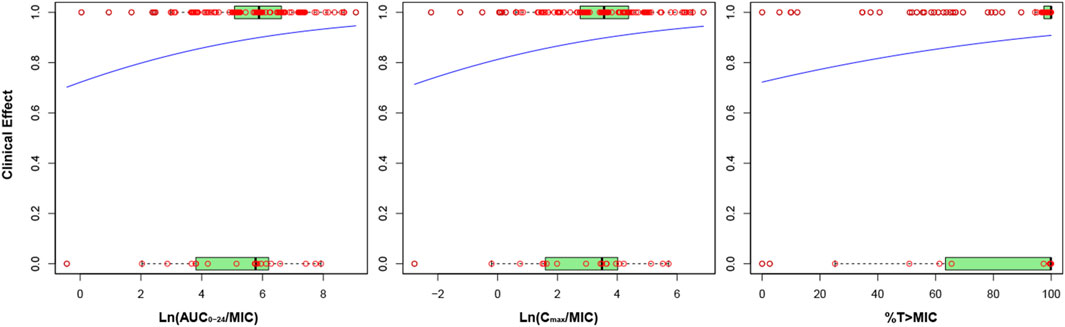
FIGURE 3. Correlation between nemonoxacin PK/PD index and clinical efficacy. Y axis indicates probability of successful clinical efficacy. Red circles indicate actual data, and blue line indicate fitting from the logistic regression model. The box plot with light green characterizes the distribution pattern of actual data: the left limit, inner line and right limit of box are 25%, 50% and 75% percentile of actual data, respectively.
The correlation between PK/PD index and clinical efficacy was also analyzed in terms of specific pathogen of CAP (Supplementary Table S6, Supplementary Figure S12). Slope for S. pneumoniae dataset was negative, and close to zero for S. aureus dataset. For K. pneumoniae, slope was positive for %T > MIC and the p-value was the lowest, suggesting it was time-dependent. For H. influenzae and H. parainfluenzae, slope for Ln (AUC0-24/MIC) and Ln (Cmax/MIC) was positive and the p-value was lower than that for %T > MIC, indicating the PK/PD was concentration-dependent.
Nemonoxacin PK/PD targets are summarized in Table 3. Overall, AUC0-24/MIC, Cmax/MIC and %T > MIC targets for clinical efficacy were 45.6, 7.32, and 51.01%, respectively. Probability for clinical success was 91% when PK/PD index ≥ corresponding target. AUC0-24/MIC, Cmax/MIC and %T > MIC targets were the same for either microbiological efficacy or clinical efficacy. For S. pneumoniae and S. aureus, the AUC0-24/MIC target for clinical efficacy was 63.3 and 97.8, respectively. For K. pneumoniae, the %T > MIC target for clinical and microbiological efficacy was 7.96% and 4.31%, respectively. For H. influenzae, the AUC0-24/MIC target for clinical and microbiological efficacy was 115.7 and 107.8, respectively. Cmax/MIC target for clinical and microbiological efficacy was 4.9 and 16.3 against H. parainfluenzae, respectively.
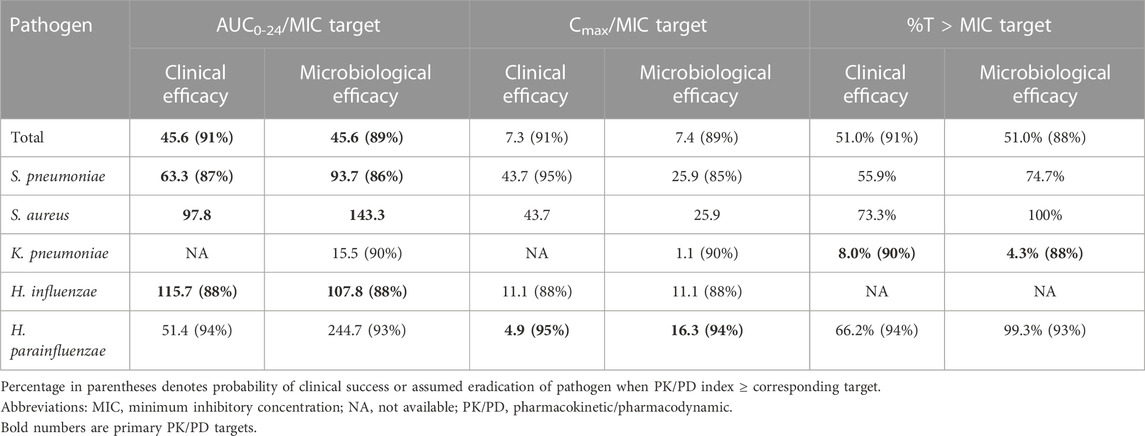
TABLE 3. Nemonoxacin PK/PD target against Gram positive and negative bacteria.
The correlations between nemonoxacin PK/PD targets and MIC are depicted in Supplementary Figure S13. When putting the PK/PD target against various bacteria together, PK/PD target reduced as MIC increased. For clinical efficacy, Log2 (MIC50) showed the best correlation with AUC0-24/MIC target (R2 = 0.67). For microbiological efficacy, MIC90 had the best correlation with Cmax/MIC target (R2 = 0.47).
PTA of nemonoxacin PK/PD indices against main CAP pathogens are shown in Figure 2. PK/PD cutoff values (the maximal MIC with PTA≥ 90%) are summarized in Table 4. For S. pneumoniae and S. aureus, PTA of AUC0-24/MIC and Cmax/MIC for 500 mg dose were greater than 90% based on clinical target when MIC ≤0.25 mg/L. For K. pneumoniae, when MIC ≤2 mg/L, PTA of %T > MIC was greater than 90% for clinical efficacy. For H. influenzae, PK/PD cutoff value of AUC0-24/MIC was 0.25 mg/L both for 500 mg and 750 mg q24 h dosing regimen. For H. parainfluenzae, PK/PD cutoff value of Cmax/MIC for clinical and microbiological efficacy was 0.5 and 0.125 mg/L, respectively for 500 mg dose of nemonoxacin, and 0.5 and 0.25 mg/L respectively for 750 mg dose.
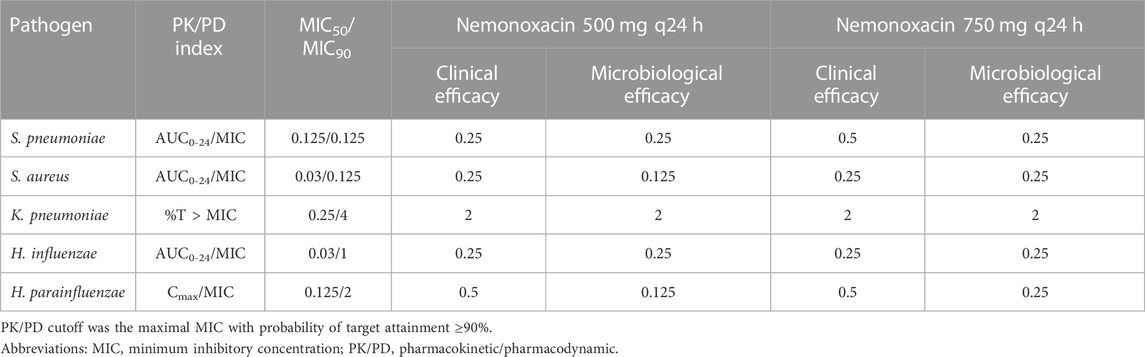
TABLE 4. PK/PD cutoff values of nemonoxacin (mg/L).
CFR of nemonoxacin PK/PD indices are presented in Table 5. CFR was >93% against S. pneumoniae and S. aureus and >91% against K. pneumoniae at dose of 500 mg. For H. influenzae, CFR of AUC0-24/MIC was about 89%–90%. For H. parainfluenzae, CFR of Cmax/MIC was 74% for clinical efficacy at 500 mg dose of nemonoxacin, and 83% in case of 750 mg dose.
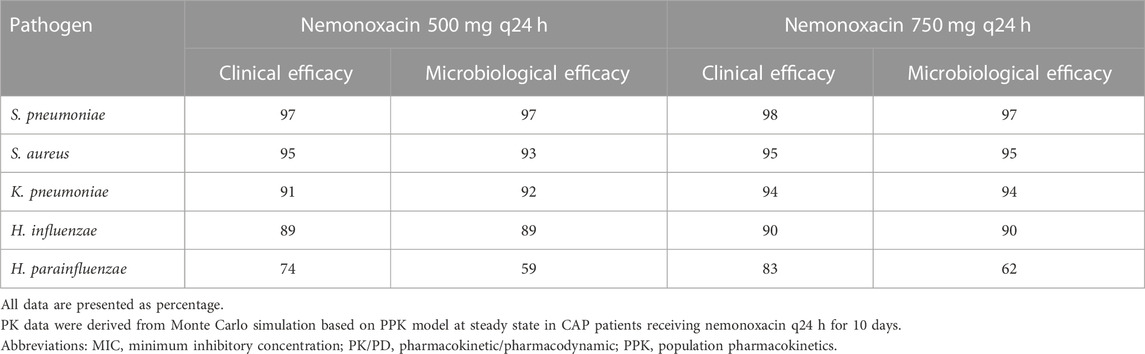
TABLE 5. Cumulative fraction of response of nemonoxacin PK/PD indices.
The cumulative urinary excretion (Ae0-24%) of nemonoxacin was 56.1% and 73.59%, respectively following multiple oral doses of 500 mg and 750 mg in healthy subjects (Guo et al., 2012a). The corresponding Ae0-24% was 57.61% and 73.38% in CAP patients (Wu, 2012). These findings suggested that nemonoxacin was mainly eliminated via kidney, which was consistent with the results of covariate screening for the PPK model of nemonoxacin.
This PPK analysis revealed the PK profile of nemonoxacin consistent with quinolones in CAP patients. PPK study of sitafloxacin indicated that CLcr was covariate on CL in patients with community-acquired respiratory tract infection (CARTI). Taking sitafloxacin with food could reduce absorption rate (Ka) by 56.7% (Tanigawara et al., 2013). These data were consistent with the results of PPK analysis for nemonoxacin. Another PPK study showed that CLcr, ideal weight, fat, age, and pseudoephedrine were the covariate on CL, and sex was covariate on Vd of garenoxacin in patients with CARTI (Van Wart et al., 2004). This is also close to the results of nemonoxacin. PPK analysis of gemifloxacin (Owens et al., 2005) and levofloxacin (Zhang et al., 2009) reported that the base model was a two-compartment model for both gemifloxacin and levofloxacin. CLcr was a significant covariate on CL, just like in the PPK model of nemonoxacin.
Monte Carlo simulation based on PPK model showed that AUC0-24 and Cmax of nemonoxacin increased by 44% and 12% in case of CLcr ≤ 15 ml/min compared to normal renal function (CLcr = 200 ml/min). This is similar to the results of PPK analysis for other quinolones in patients with CARTI. Taking sitafloxacin for example, the AUC0-12 and Cmax increased by 2.73 times and 1.71 times respectively in case of reduced CLcr (20 ml/min) compared to the control (CLcr = 75 ml/min) (Tanigawara et al., 2013). Similarly, the AUC0-24 of levofloxacin increased by 62.4% and 152.5% when CLcr reduced to 50 and 10 ml/min, respectively compared to the corresponding values in subjects with normal renal function (CLcr = 120 ml/min) (Zhang et al., 2009). The corresponding Cmax increased by 56.7% and 22.3%, respectively. The authors concluded that it was not necessary to adjust the dose of levofloxacin when CLcr ≥ 50 ml/min.
During covariate screening, OBJ reduced significantly when respiratory rate and neutrophils count (neutrophil) were introduced on CL. Using FO method, the OBJ reduced by 19.3 or 11.0 if adding respiratory rate on CL or V2, respectively. For neutrophils, the OBJ reduced by 8.1 if adding it on V3. Using FOCEI method, the OBJ reduced by 15.3 or 8.3 if adding neutrophils on CL and Tlag, respectively. However, considering that 1) the relationship between respiratory rate and drug clearance could not be explained; 2) neutrophil was often used as the PD index in clinical studies (Toffoli et al., 2001; van Hasselt et al., 2013), respiratory rate and neutrophil were not included in fixed effect model. OBJ also reduced significantly when glucose was added on V1 or Ka. However, to our knowledge, glucose was not regarded as a covariate on PK parameter. In addition, introduction of QTc interval, sodium or chloride on Ka could reduce OBJ significantly. However, the relationship between these indices and the absorption rate was hard to explain, so these indices were not included in the final PPK model.
As for the ethnic differences in PK, we compared the PK of nemonoxacin in healthy subjects in China and United States because there no reports on PK of nemonoxacin in patients in other country besides China. We summarized two tables (Supplementary Tables S7, S8). For single PK, compared with subjects in United States, the AUC0-inf and Cmax of nemonoxacin increased by 31% and 73% in Chinese subjects, while the Vd/F decreased by 27% in Chinese subjects (Supplementary Table S7). As for multiple PK, compared with subjects in United States, the AUC0-24 and Cmax of nemonoxacin at steady state in Chinese subjects elevated by 22% and 25%, while T1/2 reduced by 32% (Supplementary Table S8). The main reason for the difference of PK parameter maybe the body weight: compared with subjects in United States, the body weight of Chinese subjects decreased by 19% and 25% in single and multiple PK study, respectively. After correction by body weight, the difference of Vd/F between China and United States population reduced to 11%, while CL/F in China population was equal to that in United States population (Supplementary Table S7). We searched the reports on race difference of PK parameters of quinolones. Results showed that the PK of levofloxacin, moxifloxacin and ciprofloxacin do not show race difference (Fish & Chow, 1997; North et al., 1998; Hasunuma et al., 2016; Kaneko et al., 2018; Tolentino-Hernandez et al., 2020). For each drug, the PK parameters in various races get close to each other after correction by weight (Fish & Chow, 1997; Kaneko et al., 2018; Tolentino-Hernandez et al., 2020). Hence, we predict that the probability for race difference on PK of nemonoxacin in CAP patients is low.
Our PPK model may predict the probability for adjustment of nemonoxacin dosing regimen in the CAP patients with severe renal impairment. As shown in Supplementary Table S9, compared to the patients with normal renal function (CLcr = 250 ml/min), the probability for AUC0-inf ratio (AUC0-inf_CLcr=0/AUC0-inf_control) greater than 2 was 40% in the CAP patients with CLcr = 0 ml/min. This probability was 13% if selecting the patients with CLcr = 90 ml/min as control. The clinical trial of nemonoxacin in patients with severe renal adjustment showed that, four of ten patients with severe renal impairment [mean CLcr: 21 ml/min] had AUC0-inf ratio ≥2 compared to the patients with normal renal function (mean CLcr: 106 ml/min) (Li et al., 2020; Li Y et al., 2021). This percentage (40%) was similar to the simulation results from the PPK model.
The fAUC0-24/MIC and fCmax/MIC targets of nemonoxacin derived from in vitro data (Liang et al., 2013), animal studies (Li X et al., 2021) and clinical studies were compared. The fAUC0-24/MIC target based on in vitro data (47.05) was close to the clinical target (0.84 × 63.3 = 53.2, 0.84 denotes free fraction of nemonoxacin). Clinical target of fAUC0-24/MIC (53.2) was also close to that from animal studies (44.4, 2-log reduction). However, the clinical target of fCmax/MIC (0.84 × 43.7 = 36.7) was higher than that based on in vitro data (5.07, 3-log reduction) or animal data (about 20, Figure 2 in (Li X et al., 2021). This may be due to the prediction from the model (Supplementary Figure S13) because all isolates of S. pneumoniae were eradicated after multiple doses of nemonoxacin.
Previously, we analyzed the PK/PD data of nemonoxacin using the reported AUC/MIC (Frei & Burgess, 2005; Owens et al., 2005; Louie et al., 2009) and Cmax/MIC targets of quinolones (Kiser et al., 2006; Yoshida et al., 2011) against S. pneumoniae in literature. PK/PD cutoff values were dependent on target level: PK/PD cutoff value was 1 and 0.5 mg/L when AUC/MIC target was 25 and 63, respectively. PK/PD cutoff value was 0.5 mg/L when the target from in vitro PK/PD study (fAUC0-24/MIC = 47.05) was used (Liang et al., 2013). Cutoff value was the same for both 500 mg and 750 mg dosing regimens. PK/PD analysis showed similar results for Cmax/MIC and AUC/MIC. Hence, the results of PK/PD analysis based on in vitro PK/PD target of nemonoxacin were more reliable than the results based on the target reported in literature.
PK/PD cutoff value of nemonoxacin was 0.25 mg/L against S. pneumoniae. MIC90 of S. pneumoniae was 0.125 mg/L. Hence, S. pneumoniae was susceptible to nemonoxacin treatment because PK/PD cutoff value was higher than the MIC90. This is similar to the results of PK/PD analysis in phase I trial (Wu et al., 2015): PK/PD cutoff value for S. pneumoniae was 0.361 (500 mg) or 0.722 mg/L (750 mg). MIC90 of S. pneumoniae was 0.043 (penicillin-resistant S. pneumoniae) or 0.090 mg/L (penicillin-susceptible and -intermediate S. pneumoniae). Thus, nemonoxacin 500 mg is adequate for treatment of CAP in adult patients. PK/PD cutoff value of nemonoxacin was 2 mg/L against K. pneumoniae. MIC90 of K. pneumoniae was 4 mg/L. From the viewpoint of cutoff, 500 mg dose q24 h is not enough for treatment of CAP caused by K. pneumoniae, while 750 mg nemonoxacin q24 h is expected to achieve good clinical and microbiological efficacy because PTA (86%) was closed to 90% at MIC = 4 mg/L.
We attempted to analyze the correlation between nemonoxacin PK/PD index and treatment efficacy in treating the CAP caused by P. aeruginosa. PK/PD was both time- and concentration-dependent, and %T > MIC and AUC0-24/MIC targets were 47% and 30.0, respectively. For clinical efficacy, PK/PD cutoff value was 0.5 mg/L at dose of 500 mg and 1 mg/L at dose of 750 mg. CFR against P. aeruginosa was 66.8% at dose of 500 mg and 81.4% at dose of 750 mg. However, P. aeruginosa as pathogen was isolated from only 8 CAP patients, more data are required to confirm the clinical significance of this finding for P. aeruginosa infection.
In clinics, there are subjects infected by multiple bacteria. However, the percentage of these subjects is relatively low. For nemonoxacin, the percentage of CAP patients infected by multiple bacteria was 11% (17/175) in the phase II and III clinical trial. Most of CAP patients (89%) were infected by single bacteria. Since the aim of this paper was to obtain the PK/PD target against each bacteria, we did not consider the calculation of PK/PD target for the subjects infected by multiple bacteria simultaneously. If one patient was infected by two bacteria simultaneously, we treated him as ‘two patients’, where one patient was infected by one bacteria.
For the safety of nemonoxacin, phase II study showed that, when nemonoxacin dose was 750 mg, the occurrence of treatment-related adverse events (TRAE) was 35.9% (21/59), which mainly includes: nausea (10.2%), leukopenia (10.2%), vomiting (6.8%), abnormal liver function (5.1%) and QT interval prolongation (5.1%) (Liu et al., 2017). The TRAE occurrence for 750 mg dose was similar to that of 500 mg dose in phase II clinical trial (30.6%). Hence we believe that the safety of nemonoxacin is acceptable when the nemonoxacin dose increases from 500mg to 750 mg for the treatment of infection caused by H. parainfluenzae.
This integrative PK/PD study added some new knowledge to the understanding of nemonoxacin in CAP patients. Specifically, nemonoxacin PK/PD target was proposed against S. aureus and K. pneumoniae, H. parainfluenzae, and H. influenzae. Monte Carlo simulation supported that higher nemonoxacin dose (750 mg) was effective for the CAP caused by H. parainfluenzae. A new algorithm was proposed and successfully used to derive PK/PD target by combining logistic regression or CART with contingency table, which is more objective because it is not necessary to arbitrarily set the anticipated pharmacological level like using logistic regression alone.
Some limitations may affect the interpretation of our findings. First, the PK/PD target for S. pneumoniae and S. aureus was not derived from actual data. All isolates of S. pneumoniae and S. aureus were eradicated after multiple doses of nemonoxacin. Hence, we predicted the PK/PD target for S. pneumoniae and S. aureus by linear regression in dataset (PK/PD target vs. MIC50 or MIC90). Second, patients ≥75 years of age or with moderate/severe renal impairment had been excluded from the clinical trials of nemonoxacin, this PK/PD analysis is not applicable for such patients. Third, we used data from patients with or without mild renal dysfunction and simulate the PK for patients with moderate or severe renal dysfunction (Supplementary Figures S3–S10). This extrapolation is far outside the range of observed CLcr. It is necessary to validate the PK predictions of nemonoxacin in CAP patients with moderate or severe renal dysfunction in the future. Fourth, clinical study in patients with severe renal impairment (Li Y et al., 2021) is very important because nemonoxacin PK may change significantly in case of severe renal impairment. When more data of nemonoxacin are available from studies in special populations (Kang et al., 2019; Li Y et al., 2021), we will perform more comprehensive population PK/PD analysis.
Population PK/PD study of nemonoxacin in Chinese adult patients with CAP confirmed that the PK profile was consistent with a two-compartment model. AUC0-24/MIC and %T > MIC were the best PK/PD indices for predicting clinical efficacy of nemonoxacin. The dosing regimen of nemonoxacin 500 mg q24 h for 7–10 days is effective in treatment of CAP caused by S. pneumoniae, S. aureus and K. pneumoniae, irrespective of patient sex, mild renal impairment, empty stomach or not. However, nemonoxacin 750 mg q24 h would provide better efficacy than 500 mg q24 h for the CAP caused by H. parainfluenzae in terms of CFR.
The original contributions presented in the study are included in the article/Supplementary Material, further inquiries can be directed to the corresponding author.
The studies involving human participants were reviewed and approved by Institutional Review Board of Huashan Hospital (HIRB). The patients/participants provided their written informed consent to participate in this study.
YZ, JZ, and CT designed this study. LC, JY, GC, BG, YS, DZ, FH, JY, YL, XZ, and JW performed the clinical trials. XW and BG carried out the drug concentration assay. YC and XW analyzed the data. YC and XW wrote the manuscript. JZ and CT contributed to manuscript revision. All authors read and approved the final manuscript.
This study was financially supported by the Major Research and Development Project of Innovative Drugs, Ministry of Science and Technology of China (Nos. 2012ZX09303004-001, 2017ZX09304005, 2014ZX09101005-006).
We would express our gratitude to 69 hospitals for their contribution to this PPK study by participating in the phase II/III clinical trials of nemonoxacin (Supplementary Material). We also acknowledged the contribution of all the subjects and investigators in phase II and III clinical trials of nemonoxacin. Lena E Friberg has provided important advice on this population PK/PD study of nemonoxacin. Dr. Shengli Li has provided the help of language editing on the manuscript.
CT and LC were employed by the company TaiGen Biopharmaceuticals Beijing Co., Ltd.
The remaining authors declare that the research was conducted in the absence of any commercial or financial relationships that could be construed as a potential conflict of interest.
All claims expressed in this article are solely those of the authors and do not necessarily represent those of their affiliated organizations, or those of the publisher, the editors and the reviewers. Any product that may be evaluated in this article, or claim that may be made by its manufacturer, is not guaranteed or endorsed by the publisher.
The Supplementary Material for this article can be found online at: https://www.frontiersin.org/articles/10.3389/fphar.2023.912962/full#supplementary-material
Supplementary Figure S1 | Histogram of PK parameters of nemonoxacin based on bootstrap dataset.
Supplementary Figure S2 | Visual predictive check for the final PPK model of nemonoxacin.
Supplementary Figure S3 | Effect of covariate on Cmax of nemonoxacin at steady state.
Supplementary Figure S4 | Effect of covariate on AUC0-24 of nemonoxacin at steady state.
Supplementary Figure S5 | Effect of covariate on Tmax of nemonoxacin at steady state.
Supplementary Figure S6 | Effect of covariate on T1/2 of nemonoxacin at steady state.
Supplementary Figure S7 | Effect of covariate on CL/F of nemonoxacin at steady state.
Supplementary Figure S8 | Effect of covariate on V/F of nemonoxacin at steady state.
Supplementary Figure S9 | Effect of covariate on MRT0-inf of nemonoxacin at steady state.
Supplementary Figure S10 | Effect of covariate on Cmin of nemonoxacin at steady state.
Supplementary Figure S11 | Change in OBJ (deltaOBJ) for randomization test of final PPK model of nemonoxacin.
Supplementary Figure S12 | Correlation between nemonoxacin PK/PD index and clinical efficacy against each bacteria.
Supplementary Figure S13 | Correlations between nemonoxacin PK/PD target and MIC against various pathogens.
Supplementary Table S1 | Summary of the phase I to III clinical trials of nemonoxacin capsule.
Supplementary Table S2 | Summary of the imputation for the missing covariate data.
Supplementary Table S3 | Baseline of the covariates for vital sign, blood routine and biochemistry.
Supplementary Table S4 | Correlation of PK parameters for the final PPK model of nemonoxacin (R2).
Supplementary Table S5 | Summary of deltaOBJ (dOBJ) in the randomization test.
Supplementary Table S6 | Correlation between nemonoxacin PK/PD index and clinical efficacy for CAP caused by specific pathogen.
Supplementary Table S7 | PK parameter of nemonoxacin in healthy subjects following single oral administration of 500 mg nemonoxacin capsule.
Supplementary Table S8 | PK parameter of nemonoxacin at steady state in healthy subjects following multiple oral administration of 500 mg nemonoxacin capsule.
Supplementary Table S9 | Probability for ratio of AUC0-inf of nemonoxacin greater than 2 in CAP patients with CLcr=0 mL/min.
Arjona, A., Castaner, R., and Bolos, J. (2009). Nemonoxacin. Drugs Future 34, 196. doi:10.1358/dof.2009.034.03.1350294
Arnold, F. W., Ramirez, J. A., McDonald, L. C., and Xia, E. L. (2003). Hospitalization for community-acquired pneumonia: The pneumonia severity index vs clinical judgment. Chest 124, 121–124. doi:10.1378/chest.124.1.121
Cao, G., Zhang, J., Wu, X., Yu, J., Chen, Y., Ye, X., et al. (2013). Pharmacokinetics and pharmacodynamics of levofloxacin injection in healthy Chinese volunteers and dosing regimen optimization. J. Clin. Pharm. Ther. 38, 394–400. doi:10.1111/jcpt.12074
Chen, Y. C., Cao, Y. G., Zhou, J., and Liu, X. Q. (2009). Mechanism-based pharmacokinetic-pharmacodynamic modeling of bidirectional effect of danshensu on plasma homocysteine in rats. Pharm. Res. 26, 1863–1873. doi:10.1007/s11095-009-9899-x
Chen, Y. H., Liu, C. Y., Lu, J. J., King, C. H., and Hsueh, P. R. (2009). In vitro activity of nemonoxacin (TG-873870), a novel non-fluorinated quinolone, against clinical isolates of Staphylococcus aureus, enterococci and Streptococcus pneumoniae with various resistance phenotypes in Taiwan. J. Antimicrob. Chemother. 64, 1226–1229. doi:10.1093/jac/dkp370
Chung, D. T., Tsai, C. Y., Chen, S. J., Chang, L. W., King, C. H., Hsu, C. H., et al. (2010). Multiple-dose safety, tolerability, and pharmacokinetics of oral nemonoxacin (TG-873870) in healthy volunteers. Antimicrob. Agents Chemother. 54, 411–417. doi:10.1128/AAC.00683-09
Fish, D. N., and Chow, A. T. (1997). The clinical pharmacokinetics of levofloxacin. Clin. Pharmacokinet. 32, 101–119. doi:10.2165/00003088-199732020-00002
Fluss, R., Faraggi, D., and Reiser, B. (2005). Estimation of the Youden Index and its associated cutoff point. Biom J. 47, 458–472. doi:10.1002/bimj.200410135
Frei, C. R., and Burgess, D. S. (2005). Pharmacodynamic analysis of ceftriaxone, gatifloxacin,and levofloxacin against Streptococcus pneumoniae with the use of Monte Carlo simulation. Pharmacotherapy 25, 1161–1167. doi:10.1592/phco.2005.25.9.1161
Gabrielsson, J., and Green, A. R. (2009). Quantitative pharmacology or pharmacokinetic pharmacodynamic integration should be a vital component in integrative pharmacology. J. Pharmacol. Exp. Ther. 331, 767–774. doi:10.1124/jpet.109.157172
Germovsek, E., Barker, C. I., Sharland, M., and Standing, J. F. (2017). Scaling clearance in paediatric pharmacokinetics: All models are wrong, which are useful? Br. J. Clin. Pharmacol. 83, 777–790. doi:10.1111/bcp.13160
Germovsek, E., Barker, C. I. S., Sharland, M., and Standing, J. F. (2019). Pharmacokinetic-pharmacodynamic modeling in pediatric drug development, and the importance of standardized scaling of clearance. Clin. Pharmacokinet. 58, 39–52. doi:10.1007/s40262-018-0659-0
Guo, B., Wu, X., Zhang, Y., Shi, Y., Yu, J., Cao, G., et al. (2012a). Safety and clinical pharmacokinetics of nemonoxacin, a novel non-fluorinated quinolone, in healthy Chinese volunteers following single and multiple oral doses. Clin. Drug Investig. 32, 475–486. doi:10.2165/11632780-000000000-00000
Guo, B., Zhang, J., Yu, J., Wu, X., Shi, Y., and Tsai, C. Y. (2012b). A liquid chromatography-tandem mass spectrometry assay for the determination of nemonoxacin (TG-873870), a novel nonfluorinated quinolone, in human plasma and urine and its application to a single-dose pharmacokinetic study in healthy Chinese volunteers. Biomed. Chromatogr. 26, 1333–1340. doi:10.1002/bmc.2699
Hasunuma, T., Tohkin, M., Kaniwa, N., Jang, I. J., Yimin, C., Kaneko, M., et al. (2016). Absence of ethnic differences in the pharmacokinetics of moxifloxacin, simvastatin, and meloxicam among three East Asian populations and Caucasians. Br. J. Clin. Pharmacol. 81, 1078–1090. doi:10.1111/bcp.12884
Holford, N. H., and Anderson, B. J. (2017). Why standards are useful for predicting doses. Br. J. Clin. Pharmacol. 83, 685–687. doi:10.1111/bcp.13230
Kaneko, M., Aoyama, T., Ishida, Y., Miyamoto, A., Saito, Y., Tohkin, M., et al. (2018). Lack of ethnic differences of moxifloxacin and metabolite pharmacokinetics in East Asian men. J. Pharmacokinet. Pharmacodyn. 45, 199–214. doi:10.1007/s10928-017-9556-7
Kang, Y., Li, Y., Xu, F., Zhang, J., Wang, K., Chen, Y., et al. (2019). Population pharmacokinetics study of nemonoxacin among Chinese patients with moderate hepatic impairment. Clin. Ther. 41, 505–517. doi:10.1016/j.clinthera.2019.01.015
Karlsson, M. O., and Sheiner, L. B. (1993). The importance of modeling interoccasion variability in population pharmacokinetic analyses. J. Pharmacokinet. Biopharm. 21, 735–750. doi:10.1007/BF01113502
Kiser, T. H., Hoody, D. W., Obritsch, M. D., Wegzyn, C. O., Bauling, P. C., and Fish, D. N. (2006). Levofloxacin pharmacokinetics and pharmacodynamics in patients with severe burn injury. Antimicrob. Agents Chemother. 50, 1937–1945. doi:10.1128/AAC.01466-05
Li, C. R., Li, Y., Li, G. Q., Yang, X. Y., Zhang, W. X., Lou, R. H., et al. (2010). In vivo antibacterial activity of nemonoxacin, a novel non-fluorinated quinolone. J. Antimicrob. Chemother. 65, 2411–2415. doi:10.1093/jac/dkq341
Li, X., Chen, Y., Xu, X., Li, Y., Fan, Y., Liu, X., et al. (2021). Pharmacokinetics and pharmacodynamics of nemonoxacin in a neutropenic murine lung infection model against Streptococcus pneumoniae. Front. Pharmacol. 12, 658558. doi:10.3389/fphar.2021.658558
Li, Y., Lu, J., Kang, Y., Xu, X., Li, X., Chen, Y., et al. (2021). Nemonoxacin dosage adjustment in patients with severe renal impairment based on population pharmacokinetic and pharmacodynamic analysis. Br. J. Clin. Pharmacol. 87, 4636–4647. doi:10.1111/bcp.14881
Li, Y., and Zhang, J. Zhejiang Medicine Co. Ltd. (2020). Pharmacokinetics of nemonoxacin malate capsule in subjects with severe renal impairment: Pharmacokinetic analysis report. Zhejiang: Zhejiang Medicine Co. Ltd, 73. XCNN-150830-2.
Liang, W., Chen, Y. C., Cao, Y. R., Liu, X. F., Huang, J., Hu, J. L., et al. (2013). Pharmacokinetics and pharmacodynamics of nemonoxacin against Streptococcus pneumoniae in an in vitro infection model. Antimicrob. Agents Chemother. 57, 2942–2947. doi:10.1128/AAC.01098-12
Lin, L., Chang, L. W., Tsai, C. Y., Hsu, C. H., Chung, D. T., Aronstein, W. S., et al. (2010). Dose escalation study of the safety, tolerability, and pharmacokinetics of nemonoxacin (TG-873870), a novel potent broad-spectrum nonfluorinated quinolone, in healthy volunteers. Antimicrob. Agents Chemother. 54, 405–410. doi:10.1128/AAC.00682-09
Liu, Y., Zhang, Y., Wu, J., Zhu, D., Sun, S., Zhao, L., et al. (2017). A randomized, double-blind, multicenter Phase II study comparing the efficacy and safety of oral nemonoxacin with oral levofloxacin in the treatment of community-acquired pneumonia. J. Microbiol. Immunol. Infect. 50, 811–820. doi:10.1016/j.jmii.2015.09.005
Louie, A., Fregeau, C., Liu, W., Kulawy, R., and Drusano, G. L. (2009). Pharmacodynamics of levofloxacin in a murine pneumonia model of Pseudomonas aeruginosa infection: Determination of epithelial lining fluid targets. Antimicrob. Agents Chemother. 53, 3325–3330. doi:10.1128/AAC.00006-09
Lu, W. (2004). “Population pharmacokinetics,” in Biopharmaceutics and pharmacokinetics (Beijing: Peking University Medical Press).
Nair, G. B., and Niederman, M. S. (2011). Community-acquired pneumonia: An unfinished battle. Med. Clin. North Am. 95, 1143–1161. doi:10.1016/j.mcna.2011.08.007
Ni, W., Qi, J., Liu, L., and Li, S. (2019). A pulse signal preprocessing method based on the Chauvenet criterion. Comput. Math. Methods Med. 2019, 2067196. doi:10.1155/2019/2067196
North, D. S., Fish, D. N., and Redington, J. J. (1998). Levofloxacin, a second-generation fluoroquinolone. Pharmacotherapy 18, 915–935. doi:10.1002/j.1875-9114.1998.tb03925.x
Owens, R. C., Bhavnani, S. M., and Ambrose, P. G. (2005). Assessment of pharmacokinetic-pharmacodynamic target attainment of gemifloxacin against Streptococcus pneumoniae. Diagn Microbiol. Infect. Dis. 51, 45–49. doi:10.1016/j.diagmicrobio.2004.08.019
Preston, S. L., Drusano, G. L., Berman, A. L., Fowler, C. L., Chow, A. T., Dornseif, B., et al. (1998). Levofloxacin population pharmacokinetics and creation of a demographic model for prediction of individual drug clearance in patients with serious community-acquired infection. Antimicrob. Agents Chemother. 42, 1098–1104. doi:10.1128/AAC.42.5.1098
Reimer, L. G., and Carroll, K. C. (1998). Role of the microbiology laboratory in the diagnosis of lower respiratory tract infections. Clin. Infect. Dis. 26, 742–748. doi:10.1086/514583
Respiratory Branch of Chinese Medical Association (2006). Guidance on diagnosis and treatment of community-acquired pneumonia (Chinese). Chin. J. Tuberc. Respir. Dis. 29, 651–655.
Rice, L. B. (2006). Unmet medical needs in antibacterial therapy. Biochem. Pharmacol. 71, 991–995. doi:10.1016/j.bcp.2005.09.018
Simon, N., Sampol, E., Albanese, J., Martin, C., Arvis, P., Urien, S., et al. (2003). Population pharmacokinetics of moxifloxacin in plasma and bronchial secretions in patients with severe bronchopneumonia. Clin. Pharmacol. Ther. 74, 353–363. doi:10.1016/S0009-9236(03)00201-7
Sinha, J., Al-Sallami, H. S., and Duffull, S. B. (2019). Choosing the allometric exponent in covariate model building. Clin. Pharmacokinet. 58, 89–100. doi:10.1007/s40262-018-0667-0
Tanigawara, Y., Kaku, M., Totsuka, K., Tsuge, H., and Saito, A. (2013). Population pharmacokinetics and pharmacodynamics of sitafloxacin in patients with community-acquired respiratory tract infections. J. Infect. Chemother. 19, 858–866. doi:10.1007/s10156-013-0580-2
Toffoli, G., Corona, G., Sorio, R., Robieux, I., Basso, B., Colussi, A. M., et al. (2001). Population pharmacokinetics and pharmacodynamics of oral etoposide. Br. J. Clin. Pharmacol. 52, 511–519. doi:10.1046/j.0306-5251.2001.01468.x
Tolentino-Hernandez, S. J., Cruz-Antonio, L., Perez-Urizar, J., Cabrera-Fuentes, H. A., and Castaneda-Hernandez, G. (2020). Oral ciprofloxacin pharmacokinetics in healthy Mexican volunteers and other populations: Is there interethnic variability? Arch. Med. Res. 51, 268–277. doi:10.1016/j.arcmed.2020.02.008
van Hasselt, J. G., Gupta, A., Hussein, Z., Beijnen, J. H., Schellens, J. H., and Huitema, A. D. (2013). Population pharmacokinetic-pharmacodynamic analysis for eribulin mesilate-associated neutropenia. Br. J. Clin. Pharmacol. 76, 412–424. doi:10.1111/bcp.12143
van Rensburg, D. J., Perng, R. P., Mitha, I. H., Bester, A. J., Kasumba, J., Wu, R. G., et al. (2010). Efficacy and safety of nemonoxacin versus levofloxacin for community-acquired pneumonia. Antimicrob. Agents Chemother. 54, 4098–4106. doi:10.1128/AAC.00295-10
Van Wart, S., Phillips, L., Ludwig, E. A., Russo, R., Gajjar, D. A., Bello, A., et al. (2004). Population pharmacokinetics and pharmacodynamics of garenoxacin in patients with community-acquired respiratory tract infections. Antimicrob. Agents Chemother. 48, 4766–4777. doi:10.1128/AAC.48.12.4766-4777.2004
Wang, D. D., and Zhang, S. (2012). Standardized visual predictive check versus visual predictive check for model evaluation. J. Clin. Pharmacol. 52, 39–54. doi:10.1177/0091270010390040
Wiles, J. A., Bradbury, B. J., and Pucci, M. J. (2010). New quinolone antibiotics: A survey of the literature from 2005 to 2010. Expert Opin. Ther. Pat. 20, 1295–1319. doi:10.1517/13543776.2010.505922
Williams, P. J., and Ette, E. I. (2000). The role of population pharmacokinetics in drug development in light of the food and drug administration's 'guidance for industry: Population pharmacokinetics. Clin. Pharmacokinet. 39, 385–395. doi:10.2165/00003088-200039060-00001
Wu, X. J. (2012). Population pharmacokinetics and pharmacokinetic/pharmacodynamic study of a new NFQ nemonoxacin. Shanghai: Fudan University.
Wu, X. J., Zhang, J., Guo, B. N., Zhang, Y. Y., Yu, J. C., Cao, G. Y., et al. (2015). Pharmacokinetics and pharmacodynamics of multiple-dose intravenous nemonoxacin in healthy Chinese volunteers. Antimicrob. Agents Chemother. 59, 1446–1454. doi:10.1128/AAC.04039-14
Yoshida, K., Okimoto, N., Kishimoto, M., Fukano, H., Hara, H., Yoneyama, H., et al. (2011). Efficacy and safety of moxifloxacin for community-acquired bacterial pneumonia based on pharmacokinetic analysis. J. Infect. Chemother. 17, 678–685. doi:10.1007/s10156-011-0282-6
Yuan, J., Mo, B., Ma, Z., Lv, Y., Cheng, S. L., Yang, Y., et al. (2019). Safety and efficacy of oral nemonoxacin versus levofloxacin in treatment of community-acquired pneumonia: A phase 3, multicenter, randomized, double-blind, double-dummy, active-controlled, non-inferiority trial. J. Microbiol. Immunol. Infect. 52, 35–44. doi:10.1016/j.jmii.2017.07.011
Zhang, J., Xu, J. F., Liu, Y. B., Xiao, Z. K., Huang, J. A., Si, B., et al. (2009). Population pharmacokinetics of oral levofloxacin 500 mg once-daily dosage in community-acquired lower respiratory tract infections: Results of a prospective multicenter study in China. J. Infect. Chemother. 15, 293–300. doi:10.1007/s10156-009-0714-8
Keywords: nemonoxacin, community-acquired pneumonia, population pharmacokinetics, pharmacokinetic/pharmacodynamic analysis, Streptococcus pneumoniae, Klebsiella pneumoniae, Haemophilus, Staphylococcus aureus
Citation: Chen Y, Wu X, Tsai C, Chang L, Yu J, Cao G, Guo B, Shi Y, Zhu D, Hu F, Yuan J, Liu Y, Zhao X, Zhang Y, Wu J and Zhang J (2023) Integrative population pharmacokinetic/pharmacodynamic analysis of nemonoxacin capsule in Chinese patients with community-acquired pneumonia. Front. Pharmacol. 14:912962. doi: 10.3389/fphar.2023.912962
Received: 21 April 2022; Accepted: 06 February 2023;
Published: 28 February 2023.
Edited by:
Jessica K. Roberts, Cognigen, United StatesReviewed by:
Eva Germovsek, Boehringer Ingelheim, GermanyCopyright © 2023 Chen, Wu, Tsai, Chang, Yu, Cao, Guo, Shi, Zhu, Hu, Yuan, Liu, Zhao, Zhang, Wu and Zhang. This is an open-access article distributed under the terms of the Creative Commons Attribution License (CC BY). The use, distribution or reproduction in other forums is permitted, provided the original author(s) and the copyright owner(s) are credited and that the original publication in this journal is cited, in accordance with accepted academic practice. No use, distribution or reproduction is permitted which does not comply with these terms.
*Correspondence: Jing Zhang, emhhbmdqX2Z1ZGFuQGFsaXl1bi5jb20=
†These authors have contributed equally to this work
Disclaimer: All claims expressed in this article are solely those of the authors and do not necessarily represent those of their affiliated organizations, or those of the publisher, the editors and the reviewers. Any product that may be evaluated in this article or claim that may be made by its manufacturer is not guaranteed or endorsed by the publisher.
Research integrity at Frontiers
Learn more about the work of our research integrity team to safeguard the quality of each article we publish.