- 1Department of Anesthesiology, Xiangya Hospital, Central South University, Changsha, China
- 2National Clinical Research Center for Geriatric Disorders, Xiangya Hospital, Central South University, Changsha, China
Neuropathic pain often leads to negative emotions, which in turn can enhance the sensation of pain. This study aimed to investigate the molecular mechanisms mediating neuropathic pain and negative emotions. Chronic constriction injury (CCI) rats were used as model animals and behavioral tests were conducted to assess pain and negative emotions. Then, the rat anterior cingulate cortex (ACC) was analyzed using UPLC-MS/MS and subsequently integrated with our previously published transcriptome data. Metabolomics analysis revealed that 68 differentially expressed metabolites (DEMs) were identified, mainly in amino acid metabolites and fatty acyls. Combined with our previously published transcriptome data, we predicted two genes that potentially exhibited associations with these metabolites, respectively Apolipoprotein L domain containing 1 (Apold1) and WAP four-disulfide core domain 1 (Wfdc1). Taken together, our results indicated that peripheral nerve injury contributing to neuropathic pain and pain-related depression may be associated with these metabolites and genes. This research provides new insights into the molecular regulatory mechanism, which could serve as a reference for the treatment of neuropathic pain and pain-related depression.
1 Introduction
Epidemiological research suggests that neuropathic pain is prevalent in approximately 7%–10% of the general population, significantly impacting individuals’ physical and mental wellbeing (Colloca et al., 2017). The coexistence of neuropathic pain with psychiatric disorders renders it less responsive to conventional therapeutic approaches (Simon et al., 1999; McWilliams et al., 2004). The presence of abnormal psychiatric conditions may exacerbate the duration and severity of pain, perpetuating a detrimental cycle of pain and emotional distress (Goyal et al., 2014; Gilam et al., 2020). Consequently, it is imperative to find novel and efficacious interventions for neuropathic pain and negative emotions.
It is noteworthy that the anterior cingulate cortex (ACC) has gained significant recognition as a region that effectively processes pain signals both physiologically and pathologically (Zhuo, 2008; Barthas et al., 2015; Kummer et al., 2020). Its rostral part plays important roles in pain-induced negative emotions, while the caudal part is primarily involved in the perception of pain (Zhuo, 2008; Kummer et al., 2020). ACC modulates pain and negative emotions through mechanisms including activation of microglia (Duan et al., 2022), altered synaptic plasticity (Chen et al., 2020), and reduction of extracellular matrix protein (Li et al., 2021). Activation of ACC leads to pain unpleasantness (Tang et al., 2005), while inhibition of ACC could reduce chronic pain and unpleasantness (Vogt, 2005; Zhuo, 2007; Zhuo, 2014). We have previously published transcriptome analysis of neuropathic pain in the ACC after nerve injury and found interesting gene changes in this region (Zhang et al., 2022). Therefore, our next research on ACC will further contribute to the pathogenesis of neuropathic pain and negative emotions, as well as offer viable therapeutic alternatives.
The brain is the most metabolically active organ in the body. Previous researches have established a strong correlation between the occurrence of neuropathic pain and abnormalities in central nervous system metabolites including glutamate, glutamine (Zunhammer et al., 2016; Archibald et al., 2020) and tetrahydrobiopterin (Latremoliere et al., 2015). Abnormal changes in these metabolites have also been associated with negative emotions such as depression. For example, the cerebrospinal fluid of a macaque model of depression exhibited metabolites that were predominantly marked by disruptions in fatty acyls, biosynthesis, ABC transport systems, and amino acid metabolism (Deng et al., 2019). However, the relationship between changes in metabolites in the ACC and neuropathic pain as well as negative emotions remains unclear.
Transcriptomics can help scientists study the effect of diverse biomarkers and identify their mechanisms. Metabolomics, on the other hand, enables the identification of comprehensive metabolic pathways that occur during particular pathological and physiological processes (Johnson et al., 2016). The integration of metabolomics and transcriptomics has emerged as a potent approach for providing novel insights into pivotal genes and metabolites from the complex regulatory networks of multisystem diseases. This methodology has been widely used in neurological diseases (Horgusluoglu et al., 2022; Wang et al., 2023). Nevertheless, there are no studies combining metabolomics and transcriptomics analysis to unravel the underlying mechanisms of neuropathic pain and negative emotions.
The main purpose of this study was to explore the occurrence of neuropathic pain and pain-related depression in rats after the implementation of the chronic constriction injury (CCI) model, as well as to investigate potential molecular mechanisms associated with these conditions through metabolomic and transcriptomic methodologies. Researchers may be able to apply these findings to the diagnosis and treatment of neuropathic pain and pain-related depression in the future.
2 Methods
2.1 Animals
Adult male Sprague-Dawley rats (Hunan SLAC Laboratory Animal Co., Ltd., Changsha, China), weighing 220g–250 g, were utilized for experiments. Six rats were housed per cage in a temperature-controlled environment (25°C–28°C) with a 12-h light/dark cycle. We obtained approval from the Institutional Ethics Committee of Xiangya Hospital for all procedures, and performed experiments according to the National Institutes of Health Guidelines for Laboratory Animal Care and Ethical Guidelines.
2.2 CCI model
The CCI model was established using the method of Bennett and Xie (Bennett and Xie, 1988). Expose the sciatic nerve by cutting the left thigh and rats were anesthetized with pentobarbitone sodium. Four knots were tied at 1-mm intervals on the main nerve trunk using a 4–0 chromic gut wire. The sciatic nerve was ligated with enough force to cause transient twitching of the surrounding muscles and mild compression of the sciatic nerve membrane, without affecting the nerve’s blood supply. A ligation of the nerve was performed with the same tightness. In the sham group, the left sciatic nerve was exposed without ligation.
2.3 Behavioral assessment
All behavioral tests were conducted in the following order: paw withdrawal mechanical threshold (PWMT), paw withdrawal thermal latency (PWTL), sucrose preference test (SPT) and forced swimming test (FST).
PWMT was assessed on 1 day before CCI surgery and 3, 7, 14, 21 days after CCI surgery (n = 8). Measurements on 1 day before CCI surgery were used as the baseline. The rats were stimulated vertically with Von Frey filaments (North Coast Medical, San Jose, CA, United States) (Shen et al., 2019) on the mid-foot of the left hind limb, starting from 0.4 g and reaching a maximum of 15 g. PWMT of the rats was calculated using the UP AND DOWN method (Shen et al., 2019).
PWTL was assessed using a thermal pain tester (Tes7370, Ugo Basile, Comerio, Italy) (Porsolt et al., 1978; Shen et al., 2019) (n = 8). Continuous thermal stimulation was applied to the plantar surface of the left hind limb after the rats were accustomed to the cage for 30 min. When the rats lifted or licked the paw, timer and radiant heat were automatically shut off. The mean of the three latency periods was taken to obtain the PWTL.
SPT was assessed on 1 day before CCI surgery and 7, 14, 21 days after CCI surgery (n = 8). SPT is a good indicator of depression-like behavior as it reflects the lack of interest in the animal. According to a previous study (Wang et al., 2008), the rats were acclimatized to sugar water for 3–5 days before the test. The rats were housed in a single cage and given a weighed bottle of 1% sugar water and a bottle of plain water. To avoid the effect of water position, the positions were swapped once after 12 h. The quality of the sugar water and pure water was measured after 24 h.
FST is a behavioral despair test that assesses animals’ depressive state based on the level of despair (n = 8). Freshwater (24°C ± 1°C) was poured into a clear cylinder for the test, which was enough to submerge animals. We recorded the entire 5-min session and calculated the duration of immobility in the last 3 min offline. The definition of despair behavior was to float without making any movements other than keeping one’s nose above water.
2.4 RNA sequence and data analysis
Both sides of ACC were dissected under RNase-free conditions. Shanghai Biotechnology Corporation prepared the cDNA library from all ACC samples and performed the sequencing. The expression of annotated genes was analyzed by calculating fragments per kilobase of transcript per million mapped reads (FPKM) (Mortazavi et al., 2008). Fold change (FC) was calculated based on the FPKM value.
2.5 Extraction of metabolites and metabolome profiling
Steel beads were added to homogenize the ACC (20mg) samples for 20 s using a ball mill (30HZ). The samples were then centrifuged at 3,000 r/min for 30 s at 4°C. Next, 400 μL of 70% methanolic water internal standard extract was added, and the samples were centrifuged at 12,000 rpm for 30 min at 4°C. The resulting supernatants were transferred to vials for analysis. The samples were analyzed using ultra-performance liquid chromatography (UPLC, SCIEX, United Kingdom) coupled with tandem mass spectrometry (MS/MS, SCIEX, United Kingdom). An ACQUITY UPLC T3 column was used to separate the samples. Detection was performed using electrospray ionization.
2.6 Data processing of untargeted metabolomics
To further analyze the raw data, Proteowizard (http://proteowizard.sourceforge.net/) was used to convert it to mzXML.After pareto-scaling preprocessing, multivariate data analysis was performed, including quality control (QC), principal component analysis (PCA), orthogonal partial least squares-discriminant analysis (OPLS-DA), and univariate statistical analysis, such as FC analysis and t-tests. Calculations of FC values were based on the mean concentrations of metabolites in each group. The screening criteria for selecting differentially expressed metabolites was variable importance in projection (VIP) > 1 and p < 0.05. Analyzing the interactions among differentially expressed ACC metabolites was carried out using Ingenuity pathway analysis (IPA) (www.ingenuity.com). In brief, an interaction network with a score >2 was generated using IPA software.
2.7 Combined metabolome and transcriptome analysis
Differentially expressed metabolites (DEMs) were obtained from metabolome data and differentially expressed genes (DEGs) from transcriptome data based on metabolite content and gene expression data. All DEMs and DEGs were determined by comparisons between two different groups, each with at least three biological replicates. Association analysis was performed for metabolites and genes.
2.8 Real-time quantitative polymerase chain reaction (RT-qPCR)
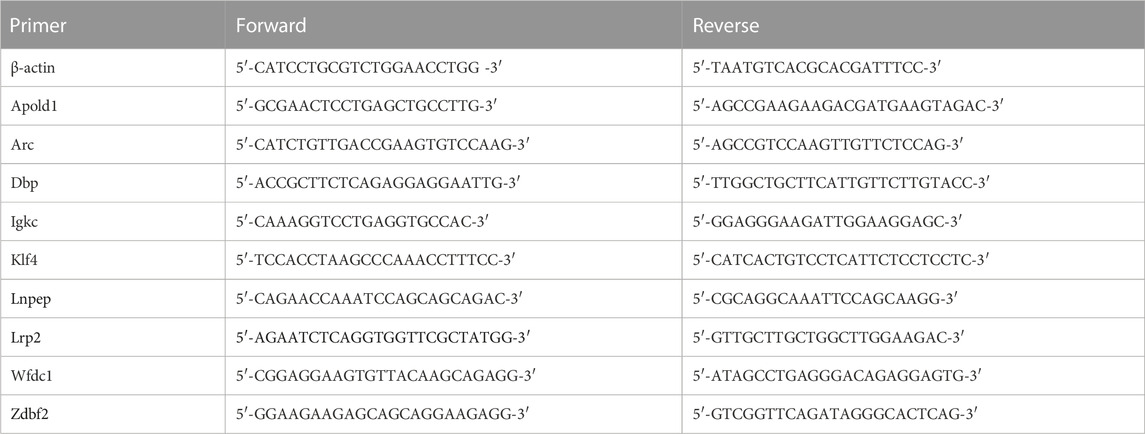
Under deep anesthesia, rats were sacrificed at different times. Following phosphate-buffered saline perfusion, ACC were tracted from each rat. RT-qPCR reagent mixes were prepared with the TransStart Tip Green qPCR SuperMix Kit (TransGen Biotech, Beijing, China) and performed using an ABI Prism 7300 PCR system (Applied Biosystems). The relative expression of the target gene compared to the housekeeping gene ACTIN was calculated by 2−ΔΔCt method. All primers were obtained from Shanghai Biotechnology Company and the primer sequences are listed in Table 1.
2.9 Statistical analysis
For behavioral and biochemical data, GraphPad Prism (GraphPad Software, San Diego, CA, United States)was used for statistical analysis. The significance of the differences between the two groups was analyzed using unpaired Student’s t-test, and multiple comparisons were performed by one-way or two-way analysis of variance (ANOVA) followed by Tukey’s multiple comparison test. p < 0.05 was considered statistically significant. Metabolome and transcriptome analysis have been detailed in Sections 2.6, 2.7.
3 Results
3.1 Behavioral characterization of rats after CCI surgery and QC analysis
To determine the mechanical and thermal allodynia in rats, the PWMT and PWTL were assessed in the sham and CCI rats at 3, 7, 14 and 21 days postoperatively. The CCI group showed significantly lower ipsilateral PWMT and PWTL on postoperative day 7 compared to the sham group, and this difference persisted throughout the 21-day observation period (Figures 1A, B, n = 8, p < 0.001), suggesting that rats in the CCI group exhibited significant hyperalgesia.
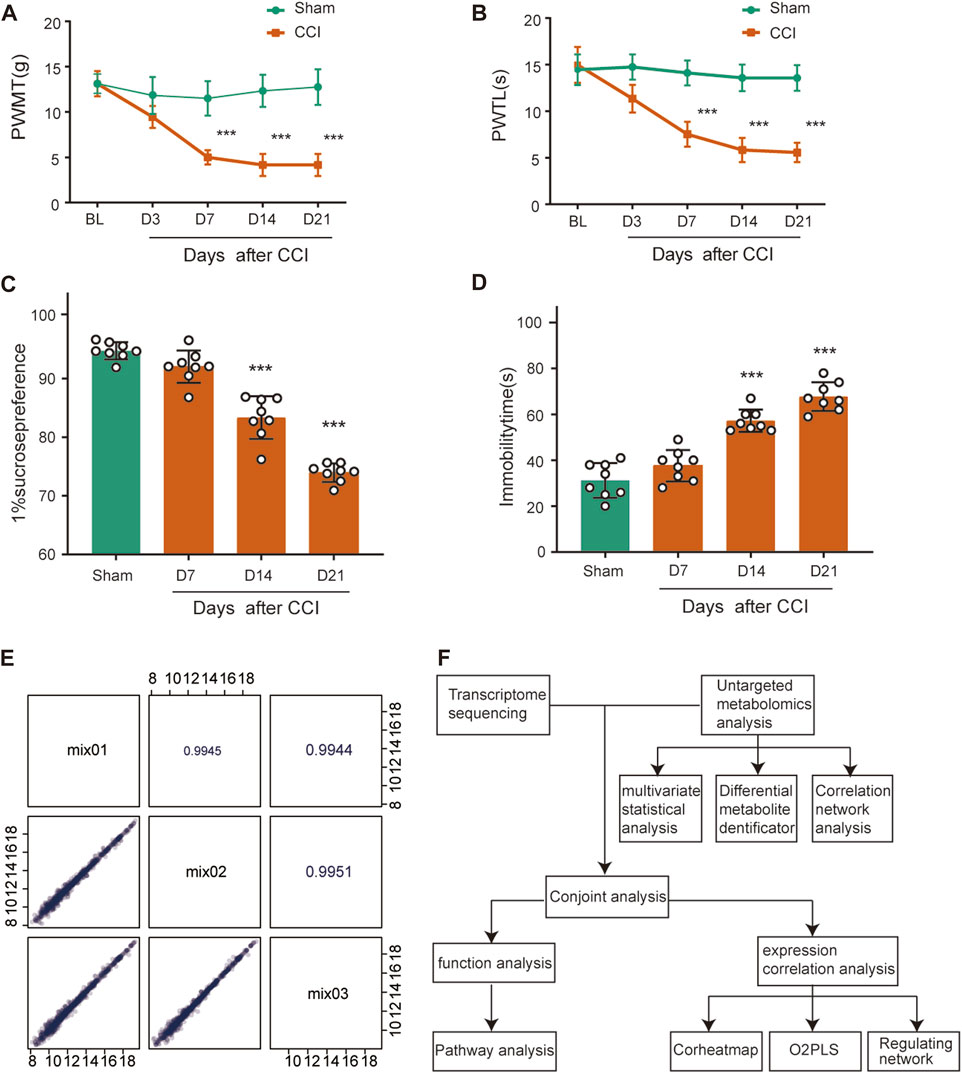
FIGURE 1. Behavioral characterization of rats following CCI surgery and QC analysis. (A,B) Mechanical allodynia and thermal hyperalgesia were induced after CCI surgery (n = 8). (C) Sucrose preference test. (D) Forced Swimming Test. ***p < 0.001, n = 8, one-way or two-way ANOVA followed by Tukey’s multiple comparison test. (E) Pearson correlation analysis for QC samples. The horizontal and vertical coordinates are the metabolite contents, and each point represents a metabolite. The upper-right diagonal square is the Pearson correlation coefficient of the corresponding QC samples. (F) The flowchart of combined metabolomics and transcriptomics analysis.
SPT and FST were used as a measure of depression-like behavior. Rats at CCI 14 days and 21 days had less preference for sucrose compared with the sham group (Figure 1C, n = 8, p < 0.001), which showed anhedonia, a core symptom of depression. The sham and CCI rats were forced to swim for 5 min and immobility time in the last 3 min was recorded. The CCI 14 days and 21 days groups spent 26.0% and 36.5% less time immobile, respectively, than the sham group (Figure 1D, n = 8, p < 0.001), also indicating depressed emotion after peripheral nerve injury.
We then conducted QC analysis for the obtained ACC samples. A mixture of sample extracts was used to prepare QC samples that were used to test the reproducibility of analyzed samples processed in the same way. Pearson correlation analysis was performed on QC samples in Figure 1E. The diagonal squares represent the QC sample names, and the lower-left diagonal squares are scatter plots of the correlation of the corresponding QC samples, with the horizontal and vertical coordinates being the metabolite contents, and each point representing a metabolite. The upper-right diagonal square is the Pearson correlation coefficient of the corresponding QC samples, and the R2 value for each QC sample is close to 1, which suggests that the experiment data is stable.
3.2 Statistical analysis of ACC samples
In order to visualize the overall differences between individual group samples, unsupervised multivariate principal component analysis was used. The 3D-PCA plot (Figures 2A, B) displayed the results with the PC1 (x-axis), the PC2 (y-axis) and PC3 (z-axis) representing the scores of the first, second and third principal components, respectively. Slight differences in the samples will result in closer scattering points. The 3D-PCA plot proved an obvious metabolic differentiation between sham group and CCI 7 days/CCI 21 days group.
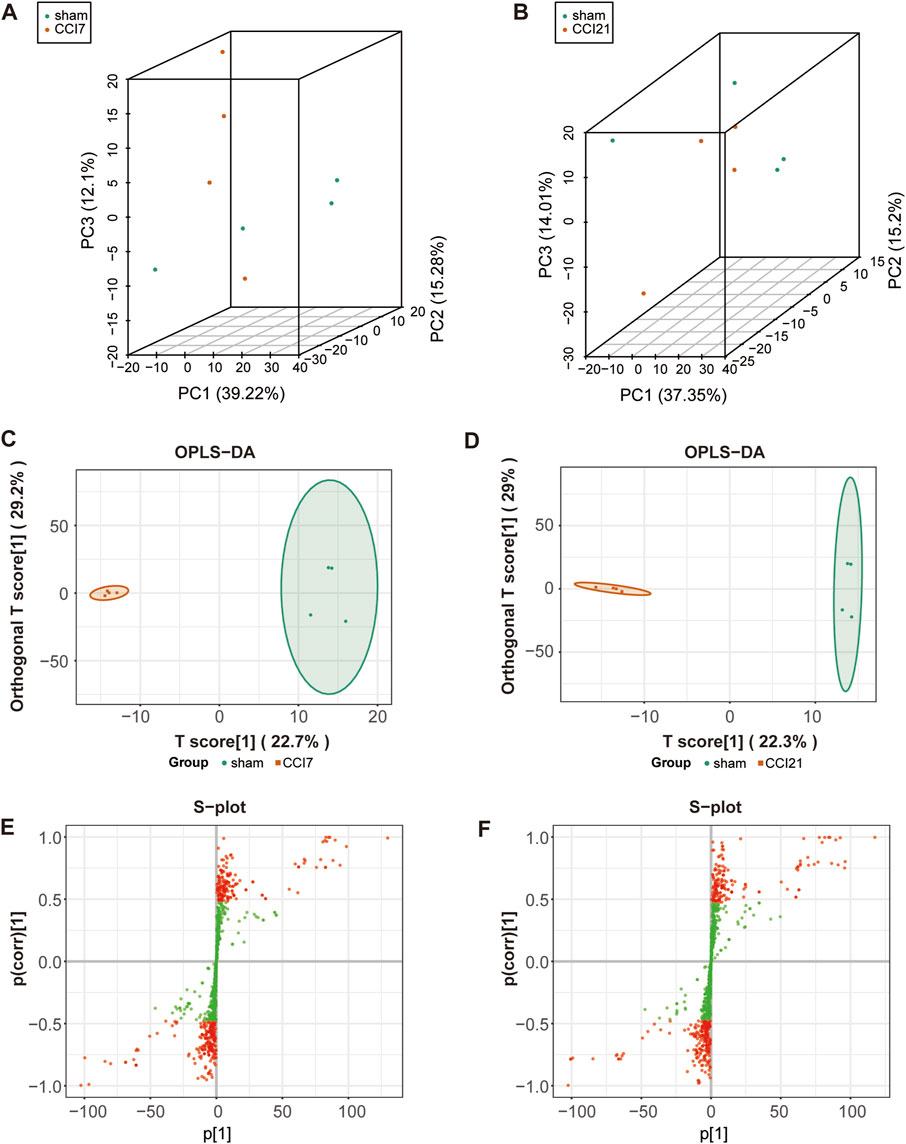
FIGURE 2. 3D-PCA plot, OPLS-DA model and S-plot map of the rats following CCI surgery. (A,B) 3D-PCA plot showing CCI 7 days (A)/CCI 21d (B) (red) group and sham (green) group (n = 4 per each group). Each point represents a sample, and the distance between the points represents the magnitude of the feature difference between the samples. (C,D) OPLS-DA scores plot between CCI 7 days (C)/CCI 21d group (D) and sham group. (E,F) S-plot map between CCI 7 days (E)/CCI 21 days group (F) and sham group. The red dot means VIP >1.0.
OPLS-DA model (Figures 2C, D) was used in the experiment to find potential markers by maximizing the differences and highlighting key variables. A successful distinction between CCI 7 days (R2X = 0.513, R2Y = 0.996 and Q2 = 0.609)/CCI 21 days (R2X = 0.519, R2Y = 0.993 and Q2 = 0.524) and the sham group was shown in OPLS-DA score plot. The horizontal coordinate indicated the predictive component scores and the horizontal direction showed the gap between the CCI 7 days/CCI 21 days group and sham group. The vertical coordinate indicated the orthogonal component scores and the vertical direction showed the gap within groups. The results showed that the sham group and CCI 7 days/CCI 21 days group could be well separated. The S-map (Figures 2E, F) was used to identify key metabolites that contribute to CCI 7 days, CCI 21 days and sham group differentiation. From the S-map, various metabolites were identified responsible for the separation between each pair of groups and were considered to be potential biomarkers.
3.3 Differential metabolite identification and pathway analysis
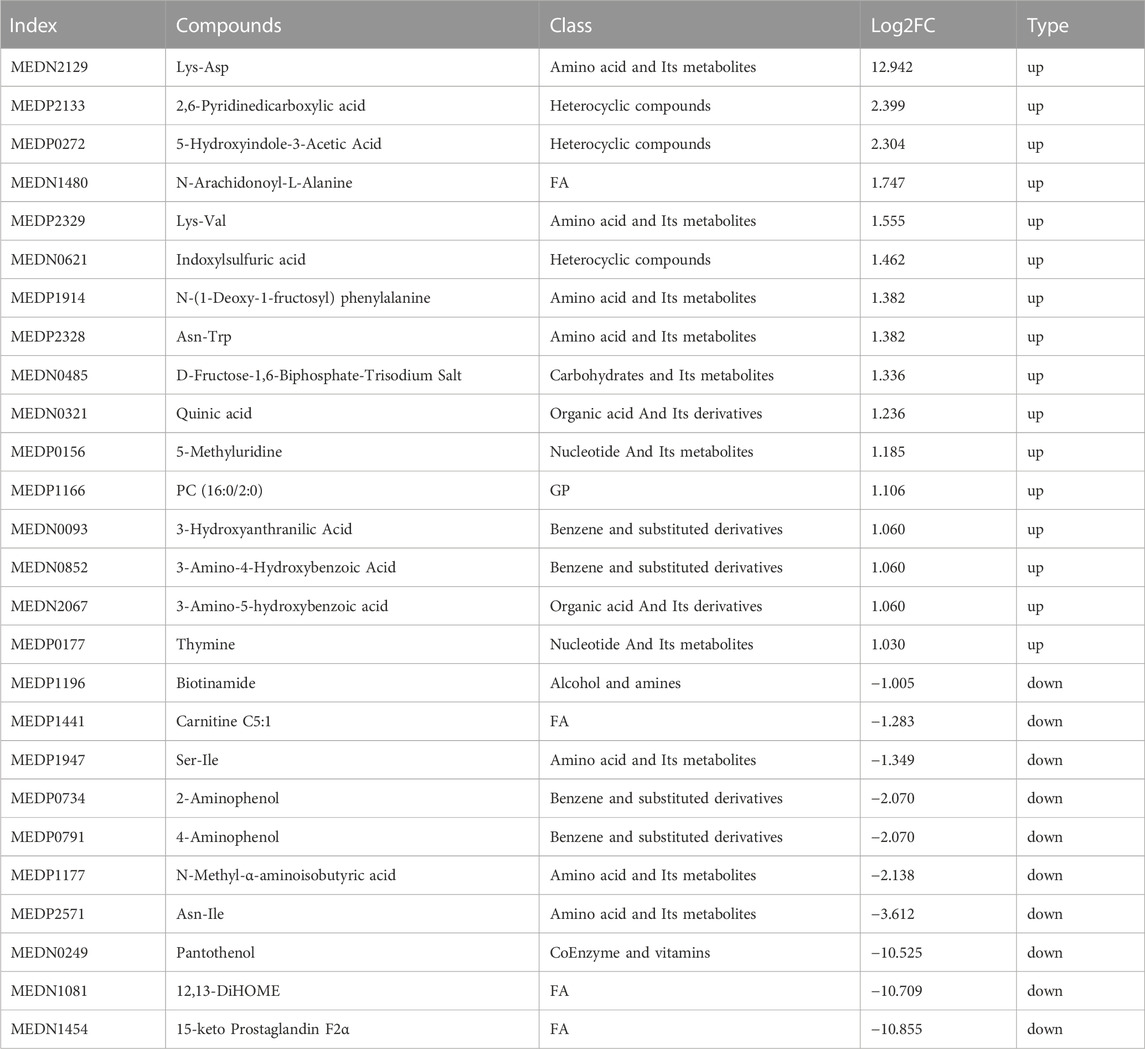
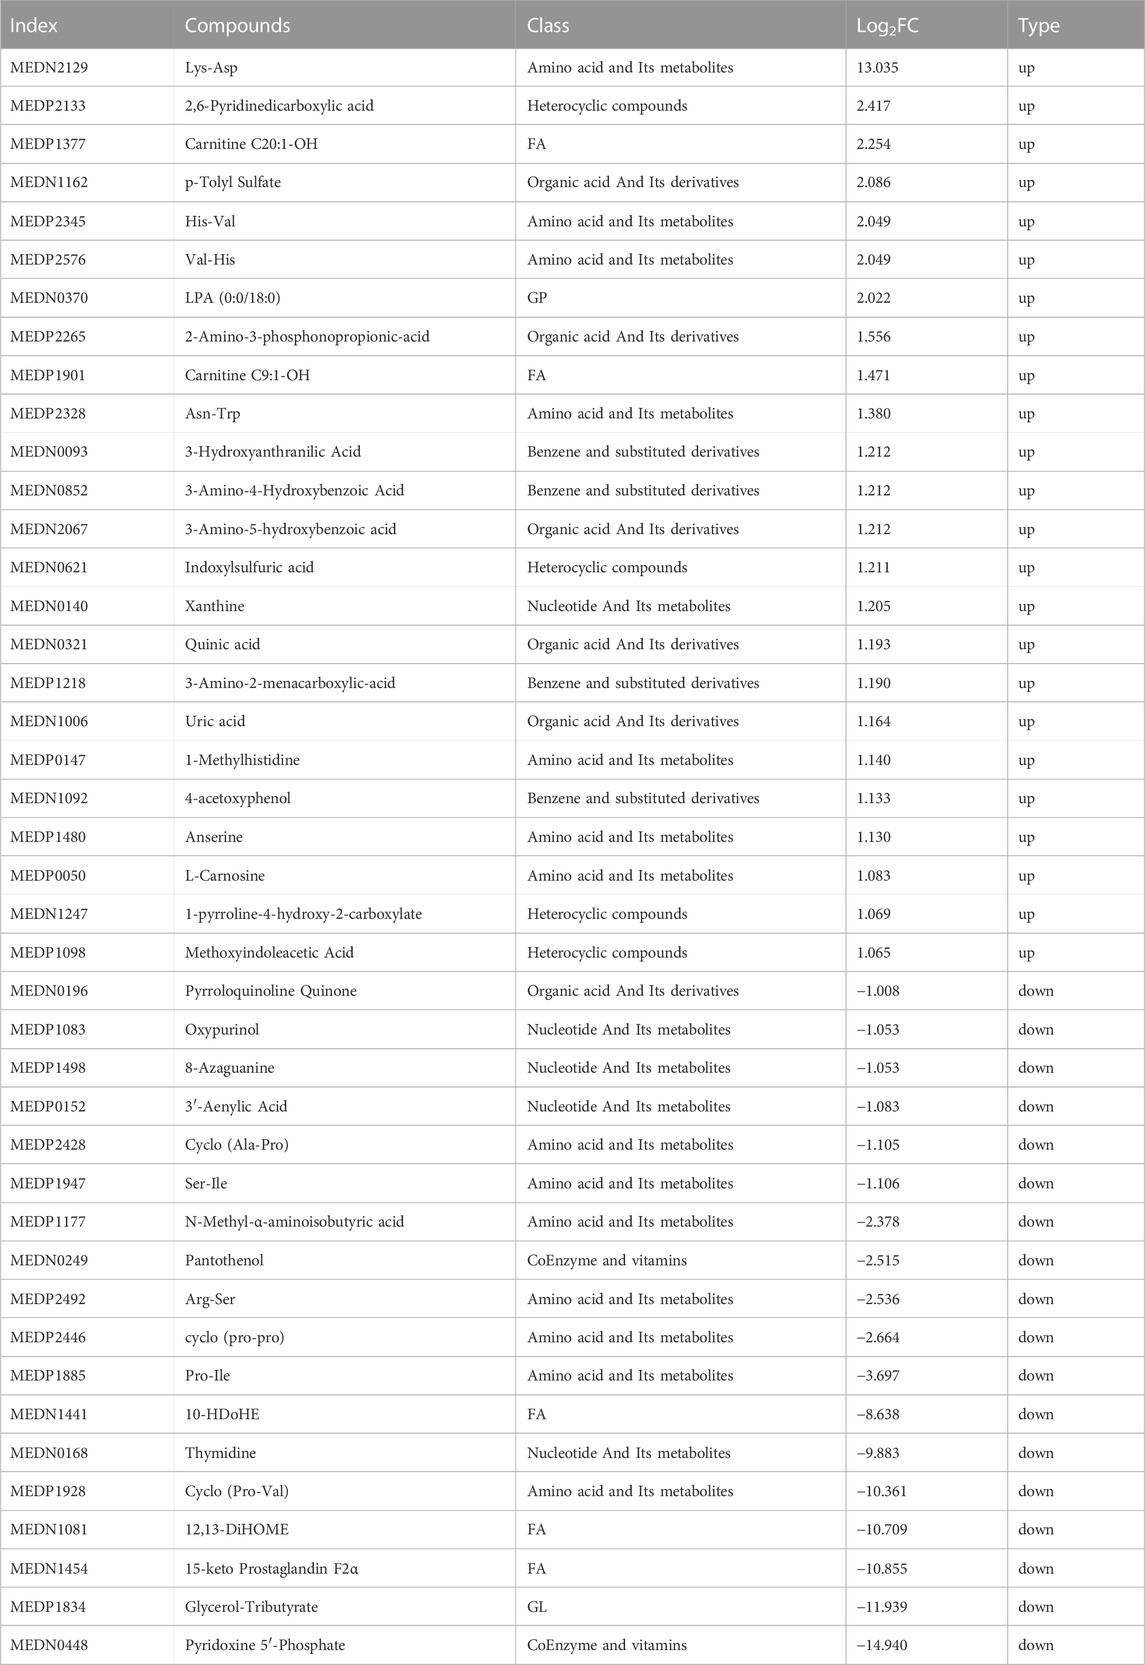
The metabolites that were significantly different between the sham and CCI groups were screened (metabolites with VIP >1,∣log2FC∣>1 and p < 0.05 are generally considered to be significantly different) and listed in Tables 2, 3. Compared to the sham group, as many as 26 (16 up- and 10 downregulated) DEMs and 42 (24 up- and 18 downregulated) DEMs respectively occurred in CCI 7 days and CCI 21 days groups (Figures 3A–C). Metabolites with significant changes could be classified into amino acid metabolites, organic acid and its derivatives, benzene and substituted derivatives, carbohydrates and their metabolites, nucleotide and its metabolites, alcohol and amines, glycerol phospholipids, glycerol lipids, coenzyme and vitamins, heterocyclic compounds and fatty acyls, with amino acid metabolites being the largest group. Compared to the sham group, the most significantly upregulated metabolites of CCI 7 days and 21 days group were lysine-aspartic acid (Lys-Asp) and 2,6-pyridine dicarboxylic acid. The most significantly downregulated metabolites of CCI 7 days were 15-keto prostaglandin F2α (15-keto-PGF2α) and 12,13-dihydroxy-9Z-octadecenoic acid (12,13-diHOME). CCI 21 days group presented different results, showing that pyridoxine 5′-phosphate (PNP) and glycerol-tributyrate were most downregulated. We separately integrated the metabolites that were significantly up- and downregulated at CCI 7 days and CCI 21 days. Eight metabolites were significantly upregulated at both CCI 7 days and CCI 21 days, with Lys-Asp and 2,6-pyridine dicarboxylic acid being the most notable changes (Figure 3D). Five metabolites were significantly downregulated at both CCI 7 days and CCI 21 days, with 15-keto-PGF2α and 12,13-diHOME changed the most notably (Figure 3E).
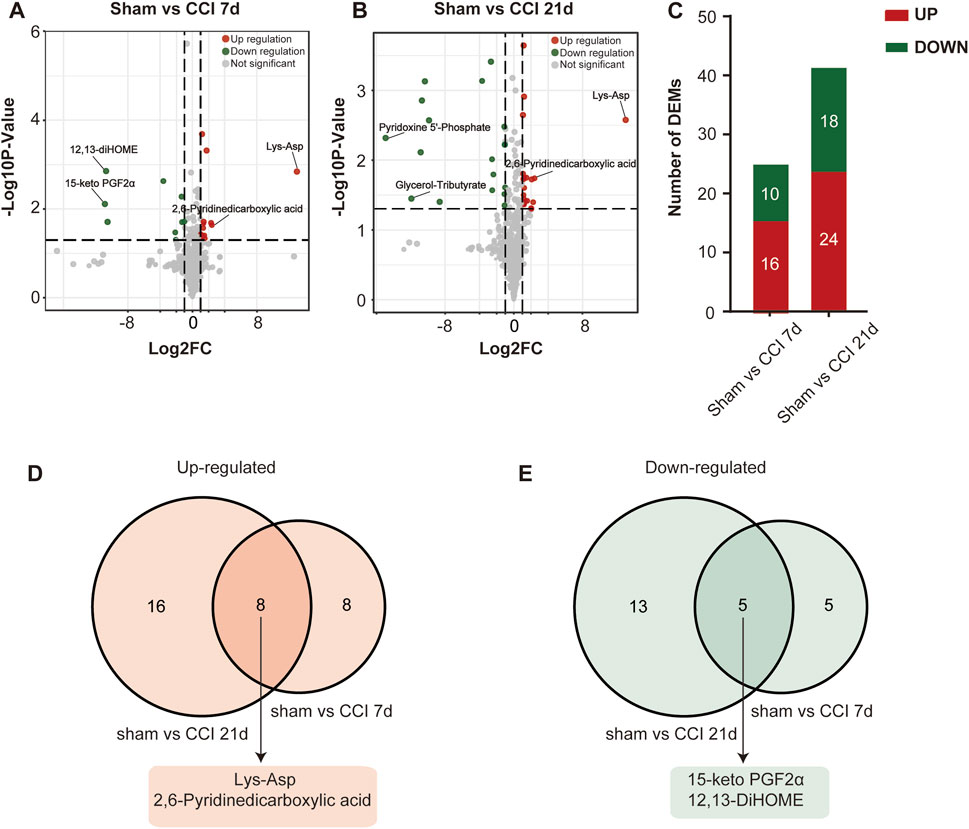
FIGURE 3. Differential metabolite identification. (A,B) Volcano plots of all the DEMs of the sham group compared with CCI 7 days (A) and 21 days (B) groups. Log2FC is plotted as the abscissa, and -log10 (p-value) is plotted as the ordinate. Upregulated genes are red and downregulated genes are green. Gray dots represent genes with no significant difference. (C) Histogram showing the statistics of up-and downregulated DEMs at CCI 7 days and CCI 21 days compared with the sham group. (D,E) The intersection of CCI 7 days and CCI 21 days upregulated (D) and downregulated (E) metabolites. The top two metabolites with the most significant changes in the intersection were listed separately.
To further investigate the regulation of metabolites after peripheral nerve injury, we constructed two correlation networks combining 26 metabolites from sham vs. CCI 7 days and 42 metabolites from sham vs. CCI 21 days. Only the pairs with a Pearson correlation coefficient >0.8 were included in this analysis (Figures 4A, B). The network in Figure 4A (visualized using Cytoscape) included 26 nodes connected by 96 edges. Pairwise correlations between metabolites showed that 54 and 42 pairs of nodes were positively and negatively correlated, respectively. The network in Figure 4B included 42 nodes connected by 291 edges. The pairwise correlations between metabolites showed that 147 and 144 pairs of nodes exhibited positive and negative correlations. Nodes with more connections to other nodes were considered to be important metabolites for the correlation network. As shown in Figures 4A, B, amino acid metabolites had a close connection with other metabolites, indicating that this class of metabolites played an important role in neuropathic pain and pain-related depression.

FIGURE 4. Metabolic correlation network analysis. (A,B) Dots represent significantly different metabolites. Differential metabolites with | r | > 0.8 and p < 0.05 are selected. Metabolic correlation network of 26 significant differential metabolites based on sham vs. CCI 7 days (A). Metabolic correlation network of 42 significant differential metabolites based on sham vs. CCI 21 days (B). (C,D) KEGG pathway analysis of DEMs at CCI 7 days (C) and CCI 21 days (D). The comparison of pathway enrichment in the ACC of rats following CCI surgery. The significantly enriched KEGG pathways are shown. The KEGG terms are plotted as the ordinate and the rich factor is plotted as the abscissa. The size of the dots represented the gene number. The color saturation from blue to red indicated p-value (Student-Newman-Keuls test, n = 4).
In addition, to explore the pathways influenced by peripheral nerve injury, the DEMs (including upregulated and downregulated) in sham vs. CCI 7days and sham vs. CCI 21days were annotated according to the pathway types in KEGG (Figures 4C, D). Specifically, tryptophan metabolism, pantothenate and CoA biosynthesis, arachidonic acid metabolism, and biosynthesis of cofactors pathways significantly altered in the rats at CCI 7 days and CCI 21 days compared to that of the sham group. The serotonergic synapse pathway only changed at 7 days after CCI surgery. The vitamin B6 metabolism, purine metabolism, histidine metabolism and beta-alanine metabolism pathways specifically changed at 21 days after CCI surgery. Our metabolome sequencing results showed that the amino acid metabolites changed most significantly in the ACC of rats after peripheral nerve injury, and KEGG analysis also involved several amino acid metabolic pathways such as tryptophan metabolism, histidine metabolism and beta-alanine metabolism. These metabolites may play a role in the development of neuropathic pain and pain-related depression.
3.4 Integrated analysis of metabolomics and transcriptomics
We have reported previously the transcriptomic profiles of the ACC in sham group and CCI group rats which suggested that neuropathic pain is initiated and maintained differently by chemokines and their targeting genes (Zhang et al., 2022). Combined with above transcriptome data, we performed conjoint analysis of metabolomics and transcriptomics to screen out the genes and metabolites. To find marker genes and metabolites involved in neuropathic pain and pain-related depression, and to highlight functional associations between these genes and metabolisms, data integration was performed of the other expressed by loading. Figures 5A, B showed the top 10 substances that had a strong influence on the other omics. The top 10 metabolites included NA-Ala, n-(1-deoxy-1-fructosyl) phenylalanine, oxypurinol, glycerol-tributyrate, 10-HDoHE, 8-azaguanine, PNP, Carnitine C9:1-OH, 2-aminophenol and 4-aminophenol. The top 10 genes included zinc finger DBF-type containing 2 (Zdbf2), nuclear receptor subfamily 4 group A member 3 (Nr4a3), apolipoprotein L domain containing 1 (Apold1), Fas ligand (Faslg), Cd27 molecule (Cd27), eomesodermin (Eomes), KLF transcription factor 4 (Klf4), activity regulated cytoskeletal-associated protein (Arc), toll-like receptor 11 (Tlr11) and immunoglobulin kappa constant (Igkc). The KEGG enrichment analysis showed the co-enrichment pathways of DEMs and DEGs (Figures 5C, D). As shown in Figures 5C, D, the most remarkably enriched pathway was the metabolic pathway, which is enriched to 5 metabolites and 7 genes at CCI 7 days, 13 metabolites and 3 genes at CCI 21 days, including cofactor PNP, tryptophan metabolites 3-hydroxy anthranilic acid, 5-hydroxyindole-3-acetic acid and 2-aminophenol, histone metabolites L-carnosine, anserine and 1-methylhistidine, purine metabolites xanthine and uric acid and pyrimidine metabolite thymidine.
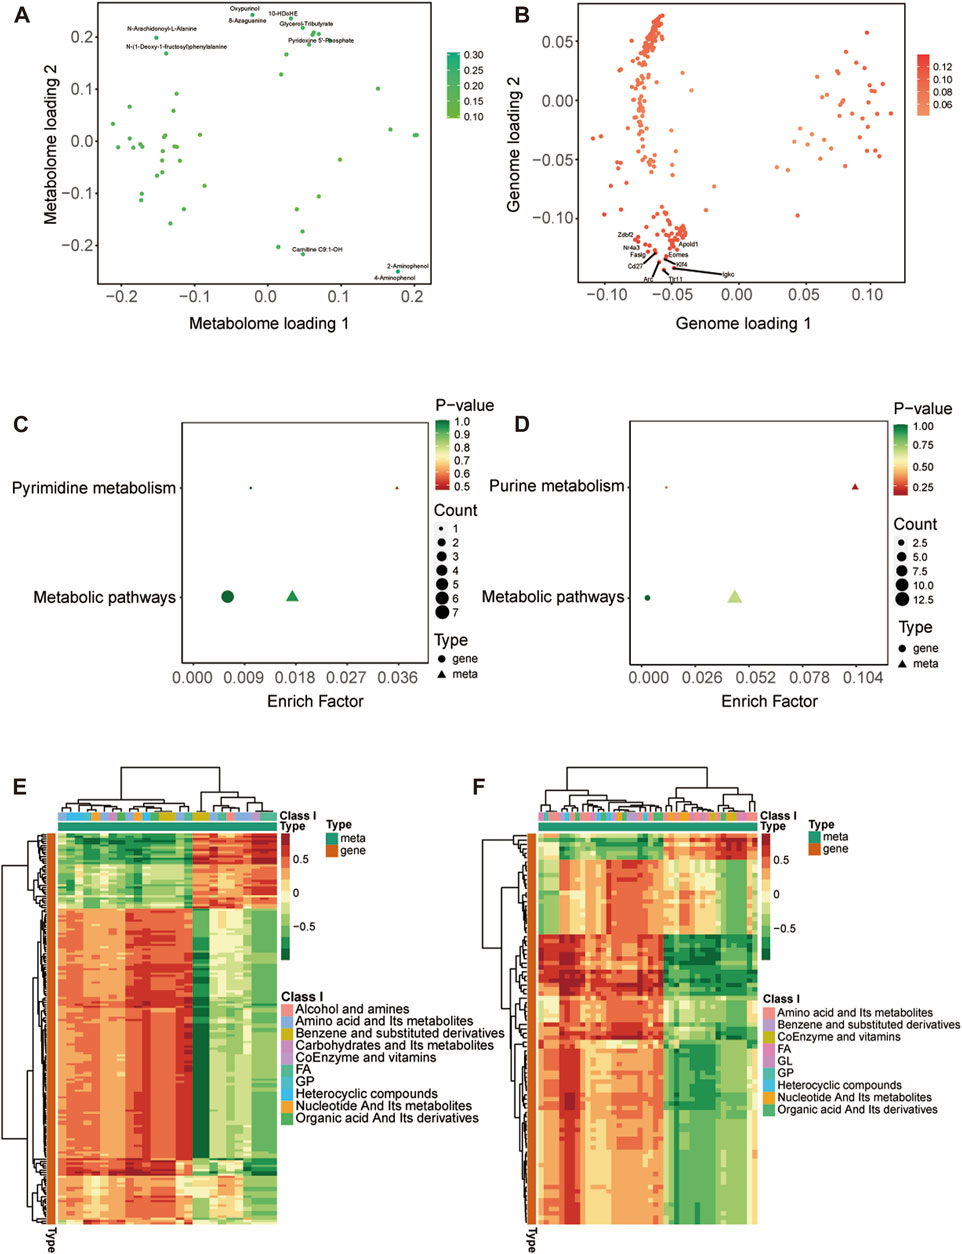
FIGURE 5. Integrated analysis of metabolomics and transcriptomics. (A,B) O2PLS analysis of the sham group and CCI group. Loading 1 represents a one-dimensional loading value and loading 2 represents a two-dimensional loading value. The loading value indicates the explanatory power of the variable in each component, positive or negative loading value indicates a positive or negative correlation with another group, the larger the absolute value of the loading value, the stronger the correlation. The top 10 substances that have a strong influence on the other group are labeled in the metabolomic (A) and transcriptomic (B) association load maps. (C,D) KEGG pathway enrichment of differential genes and metabolites at CCI 7 days (C) and CCI 21 days (D). (E,F) Heatmap of correlation coefficient matrix between differential metabolites and differential genes with the Pearson correlation coefficient above 0.8. Red represents positive gene-metabolite correlation and green represents negative gene-metabolite correlation. The color labels represent Pearson correlation coefficient values.
The cor program in R was used to calculate the Pearson correlation coefficients (PCCs) between genes and metabolites. We selected the genes and metabolites which had a PCC greater than 0.8 and created a clustered heatmap (Figures 5E, F). In Figure 5E, the clustered heatmap indicated that the differential metabolites associated with differential genes could be sorted into 10 categories, among which amino acid metabolites and fatty acyls were the largest. In Figure 5F, the clustering heat map revealed that the differential metabolites related to differential genes could be categorized into 9 groups, with amino acid metabolites and fatty acyls being the largest group.
3.5 Regulating network of DEMs and DEGs and verification of gene expression levels
We focused on the effects of amino acid metabolites and fatty acyls on neuropathic pain, pain-related depression and their possible mechanisms. We chose Lys-Asp, PNP, 15-keto-PGF2α, glycerol-tributyrate, 12,13-diHOME, histidine-related and tryptophan-related metabolites for the analysis of the regulation network between the differential genes and metabolites after peripheral nerve injury. Positive correlations could result from two metabolites originating from a common precursor or occurring adjacent to each other in a metabolic pathway. Negative correlations may indicate that one metabolite generates the other directly or indirectly. Figure 6A showed the regulatory network of differential metabolites after peripheral nerve injury. We subsequently verified the expression of these genes by RT-qPCR (Figures 6B–J) and found that Apold1 elevated and WAP four-disulfide core domain 1 (Wfdc1) downregulated both at CCI 7 days and CCI 21 days. According to the regulating network of DEMs and DEGs, Apold1 was negatively correlated with PNP and glycerol-tributyrate. Wfdc1 was positively associated with 12,13-diHOME and 15-keto-PGF2α, and negatively associated with Lys-Asp. In summary, further study are required to validate the relationship involving the mechanism of peripheral nerve injury resulting in neuropathic pain, pain-related depression, and these metabolites and genes.
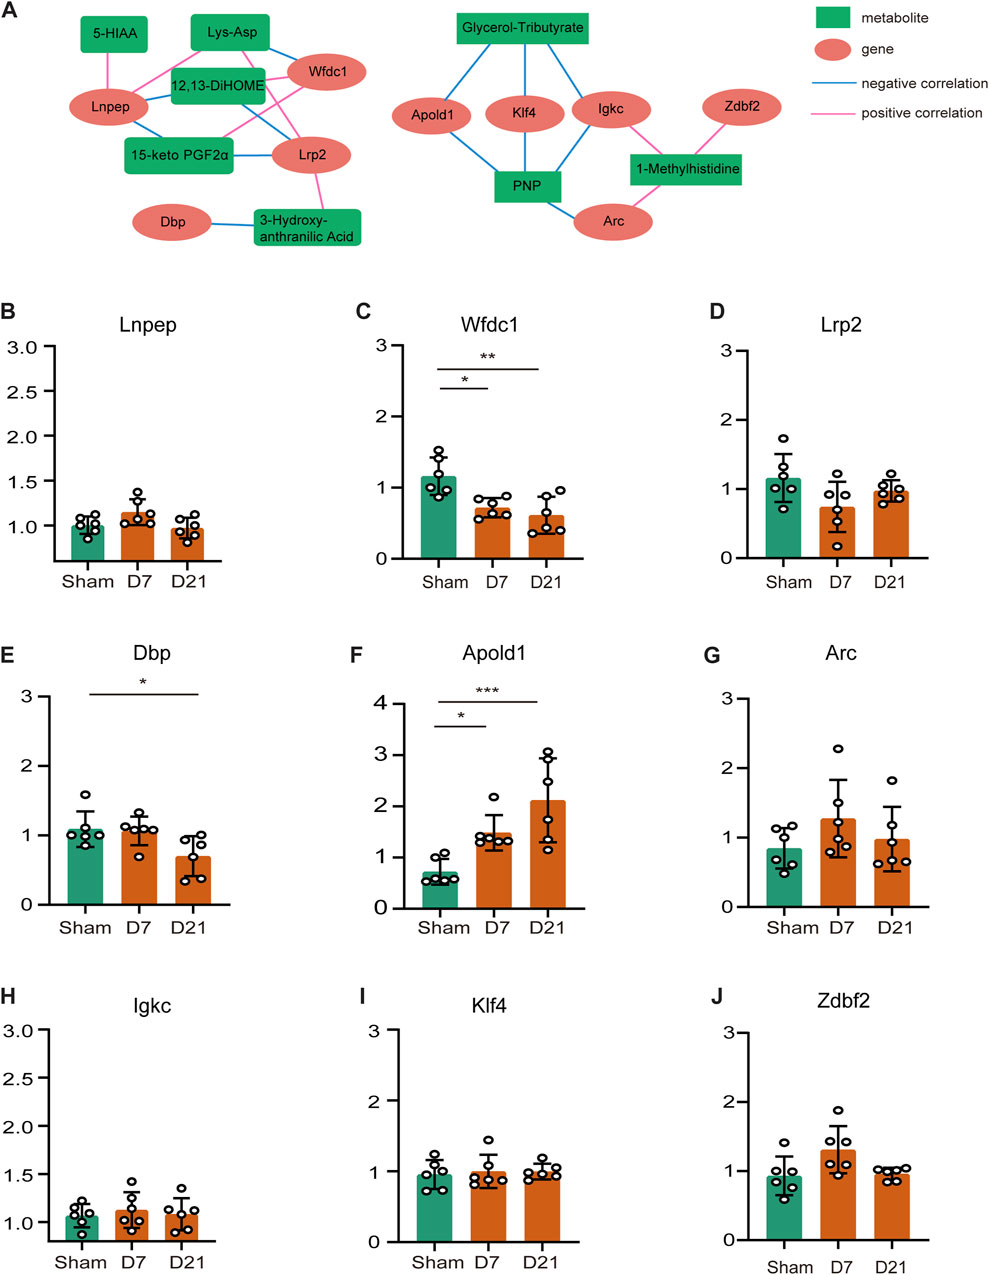
FIGURE 6. Regulating network of DEMs and DEGs and verification of gene expression levels. (A) Regulating network between the genes and metabolites. Metabolites are marked with green squares and genes are marked with red circles. Pink lines represent positive correlations and blue lines represent negative correlations. (B–J) Genes that appeared on the network were measured by qRT-PCR to ensure mRNA expression. (*p < 0.05, **p < 0.01, ***p < 0.001, n = 6, one-way ANOVA followed by Tukey’s multiple comparison test.)
4 Discussion
The purpose of this study was to investigate the metabolic changes and potential gene associations in a rat model of CCI using metabolomic and transcriptomic analysis. We observed significant alterations in amino acid metabolites and fatty acyls, suggesting their potential roles in neuropathic pain and pain-related depression caused by peripheral nerve injury. Combined analysis with our previously published transcriptome data indicated that some genes were connected with these metabolites. Apold1 was negatively correlated with PNP. Wfdc1 was positively associated with 12,13-diHOME acid and 15-keto PGF2α, and negatively associated with Lys-Asp. This study serves as reference for further research of the neuropathic pain and pain-related depression caused by peripheral nerve injury, which suggests that the changes of amino acid metabolites and fatty acyls may play important roles. However, the effects and mechanisms of the metabolites and genes need to be further validated.
In our untargeted metabolomics analysis of the CCI model, we observed substantial changes in amino acid metabolites and fatty acyls. These findings are consistent with previous studies highlighting the involvement of these pathways in neuropathic pain (Larson et al., 2000; Hua et al., 2021) and negative emotions (Menzies et al., 2021). Our KEGG analysis demonstrated pathways which have been reported to function in the initiation, progression, and therapeutic progress of neuropathic pain and pain-related depression. Specifically, tryptophan metabolites were found to have both neurotoxic and neuroprotective effects in response to inflammation and play a crucial role in chronic pain and depression (Athnaiel et al., 2022). Indole sulfate, a metabolic product of tryptophan (Huć et al., 2018), has been revealed to induce oxidative stress and inflammation in CNS cells (Adesso et al., 2017), leading to neuroinflammation and brain dysfunction (Ohtsuki et al., 2002; Watanabe et al., 2014). Purine metabolism has been identified as the pathway associated with major depressive disorder in young patients (Zhou et al., 2019). Our results showed a significant increase in indole sulfate, 5-hydroxy indole-3-acetic acid, 3-hydroxy anthranilic acid, xanthine and uric acid in the ACC after peripheral nerve injury, which was consistent with most studies. Furthermore, deficiencies in pantothenic acid and vitamin B6 have been associated with pro-inflammatory responses and various symptoms, including arthritic pain, depression, and insomnia (Ueland et al., 2017; Menzies et al., 2021; Ghavidel-Parsa et al., 2022). In line with this, our results demonstrated decreased levels of panthenol and PNP (a form of vitamin B6) in the ACC following peripheral nerve injury. Our metabolomics results highlight roles for tryptophan metabolism, purine metabolism, and vitamin B6 metabolism in neuropathic pain and pain-related depression, suggesting that we should focus on these metabolic pathways. However, not all metabolites changed as reported in the literature. We observed a significant reduction in 15-keto-prostaglandin F2α and 12,13-DiHOME, which were expected to be upregulated according to the published studies (Muratani et al., 2003; Zimmer et al., 2018). The above results suggest that it is difficult to figure out the changes occurring in rat ACC by metabolomics alone, so we combined previously published transcriptomic data for joint analysis.
When integrating our metabolomic findings with previously published transcriptome data, we observed consistent changes in metabolites associated with inflammation and oxidative stress, including xanthine (Stover et al., 1997), uric acid (Stover et al., 1997), 15-keto-PGF2α (Saenger et al., 2007), 12,13-diHOME (Zimmer et al., 2018), L-carnosine (Fleisher-Berkovich et al., 2009), anserine (Song et al., 2014), glyceryl tributyrate (Segain et al., 2000; Vinolo et al., 2012; Xin et al., 2018), etc. These findings align with transcriptomic studies (Zhang et al., 2022), reporting the differential genes in ACC of rats after peripheral nerve injury were involved in biological processes such as “immune system processes”, “defense responses”, “regulation of immune system processes”, and “regulation of cellular processes”. We confirmed that Apold1 elevated and Wfdc1 downregulated both at CCI 7 days and CCI 21 days. Apold1 and Wfdc1 were generally located in endothelial cells and regulated endothelial cell signaling and vascular function (Regard et al., 2004; Zhu et al., 2021). There are also some reports indicating Apold1 may be expressed in neurons and astrocytes and Wfdc1 could be expressed in neurons (Koshimizu et al., 2021). It has been reported that heightened levels of Apold1 have been observed in the prefrontal cortex, cerebellum, and hippocampus of stressed mice (Roszkowski et al., 2014) and Wfdc1 had the anti-inflammatory function (Reading et al., 2012). Nevertheless, the relationship between the two genes and pain has not yet been shown. Our study predicted that Apold1 was negatively correlated with PNP and glycerol-tributyrate. Wfdc1 was positively associated with 12,13-diHOME and 15-keto-PGF2α, and negatively associated with Lys-Asp. We should pay close attention to these genes and their associated metabolites when exploring potential mechanisms of neuropathic pain and pain-related depression after peripheral nerve injury.
This study is the first to probe the molecular changes of ACC in rats with neuropathic pain and pain-related depression both metabolically and transcriptionally. The present study has some limitations that need to be acknowledged. Firstly, the model used in this study is limited to CCI, which may not fully represent all types of neuropathic pain. Additionally, the brain region examined in this study is restricted to the ACC, and it is important to consider that other brain regions may also play significant roles in neuropathic pain and pain-related depression. Importantly, it should be noted that our study provides correlative evidence, and no direct manipulation of the molecular changes or assessment of their impact on behavior was conducted. The observed molecular changes may co-occur due to the injury and neuroinflammation rather than being causal factors. Nonetheless, our findings shed light on the potential involvement of these metabolites and genes in peripheral nerve injury-induced neuropathic pain and pain-related depression, offering valuable insights for future research and therapeutic approaches.
Data availability statement
The datasets presented in this study can be found in online repositories. The names of the repository/repositories and accession number(s) can be found in the article/supplementary material.
Ethics statement
The animal study was approved by the Institutional Ethics Committee of Xiangya Hospital, Central South University. The study was conducted in accordance with the local legislation and institutional requirements.
Author contributions
CX: Writing–original draft, Writing–review and editing. LH: Writing–original draft, Writing–review and editing. ZH: Methodology, Software, Writing–review and editing. JZ: Data curation, Formal Analysis, Writing–review and editing. KZ: Data curation, Methodology, Writing–review and editing. QG: Methodology, Supervision, Writing–review and editing. CH: Writing–original draft, Writing–review and editing.
Funding
The author(s) declare financial support was received for the research, authorship, and/or publication of this article. This work was supported by National Natural Science Foundation of China (82071249 and 81771207) and the Research Project Funded by Hunan Medical Association (HMA202101001).
Conflict of interest
The authors declare that the research was conducted in the absence of any commercial or financial relationships that could be construed as a potential conflict of interest.
Publisher’s note
All claims expressed in this article are solely those of the authors and do not necessarily represent those of their affiliated organizations, or those of the publisher, the editors and the reviewers. Any product that may be evaluated in this article, or claim that may be made by its manufacturer, is not guaranteed or endorsed by the publisher.
References
Adesso, S., Magnus, T., Cuzzocrea, S., Campolo, M., Rissiek, B., Paciello, O., et al. (2017). Indoxyl sulfate affects glial function increasing oxidative stress and neuroinflammation in chronic kidney disease: interaction between astrocytes and microglia. Front. Pharmacol. 8, 370. doi:10.3389/fphar.2017.00370
Archibald, J., MacMillan, E. L., Enzler, A., Jutzeler, C. R., Schweinhardt, P., and Kramer, J. L. K. (2020). Excitatory and inhibitory responses in the brain to experimental pain: a systematic review of MR spectroscopy studies. NeuroImage 215, 116794. doi:10.1016/j.neuroimage.2020.116794
Athnaiel, O., Ong, C., and Knezevic, N. N. (2022). The role of kynurenine and its metabolites in comorbid chronic pain and depression. Metabolites 12 (10), 950. doi:10.3390/metabo12100950
Barthas, F., Sellmeijer, J., Hugel, S., Waltisperger, E., Barrot, M., and Yalcin, I. (2015). The anterior cingulate cortex is a critical hub for pain-induced depression. Biol. psychiatry 77 (3), 236–245. doi:10.1016/j.biopsych.2014.08.004
Bennett, G. J., and Xie, Y. K. (1988). A peripheral mononeuropathy in rat that produces disorders of pain sensation like those seen in man. Pain 33 (1), 87–107. doi:10.1016/0304-3959(88)90209-6
Chen, Q. Y., Zhang, Z. L., Liu, Q., Chen, C. J., Zhang, X. K., Xu, P. Y., et al. (2020). Presynaptic long-term potentiation requires extracellular signal-regulated kinases in the anterior cingulate cortex. Mol. pain 16, 1744806920917245. doi:10.1177/1744806920917245
Colloca, L., Ludman, T., Bouhassira, D., Baron, R., Dickenson, A. H., Yarnitsky, D., et al. (2017). Neuropathic pain. Nat. Rev. Dis. Prim. 3, 17002. doi:10.1038/nrdp.2017.2
Deng, F. L., Pan, J. X., Zheng, P., Xia, J. J., Yin, B. M., Liang, W. W., et al. (2019). Metabonomics reveals peripheral and central short-chain fatty acid and amino acid dysfunction in a naturally occurring depressive model of macaques. Neuropsychiatric Dis. Treat. 15, 1077–1088. doi:10.2147/NDT.S186071
Duan, Y. W., Chen, S. X., Li, Q. Y., and Zang, Y. (2022). Neuroimmune mechanisms underlying neuropathic pain: the potential role of TNF-α-necroptosis pathway. Int. J. Mol. Sci. 23 (13), 7191. doi:10.3390/ijms23137191
Fleisher-Berkovich, S., Abramovitch-Dahan, C., Ben-Shabat, S., Apte, R., and Beit-Yannai, E. (2009). Inhibitory effect of carnosine and N-acetyl carnosine on LPS-induced microglial oxidative stress and inflammation. Peptides 30 (7), 1306–1312. doi:10.1016/j.peptides.2009.04.003
Ghavidel-Parsa, B., Naeimi, A., Gharibpoor, F., Sattari, N., Jafari, A., Masooleh, I. S., et al. (2022). Effect of vitamin B6 on pain, disease severity, and psychological profile of fibromyalgia patients; a randomized, double-blinded clinical trial. BMC Musculoskelet. Disord. 23 (1), 664. doi:10.1186/s12891-022-05637-7
Gilam, G., Gross, J. J., Wager, T. D., Keefe, F. J., and Mackey, S. C. (2020). What is the relationship between pain and emotion? Bridging constructs and communities. Neuron 107 (1), 17–21. doi:10.1016/j.neuron.2020.05.024
Goyal, M., Singh, S., Sibinga, E. M., Gould, N. F., Rowland-Seymour, A., Sharma, R., et al. (2014). Meditation programs for psychological stress and well-being: a systematic review and meta-analysis. JAMA Intern. Med. 174 (3), 357–368. doi:10.1001/jamainternmed.2013.13018
Horgusluoglu, E., Neff, R., Song, W. M., Wang, M., Wang, Q., Arnold, M., et al. (2022). Integrative metabolomics-genomics approach reveals key metabolic pathways and regulators of Alzheimer's disease. Alzheimer's dementia J. Alzheimer's Assoc. 18 (6), 1260–1278. doi:10.1002/alz.12468
Hua, D., Li, S., Li, S., Wang, X., Wang, Y., Xie, Z., et al. (2021). Gut microbiome and plasma metabolome signatures in middle-aged mice with cognitive dysfunction induced by chronic neuropathic pain. Front. Mol. Neurosci. 14, 806700. doi:10.3389/fnmol.2021.806700
Huć, T., Nowinski, A., Drapala, A., Konopelski, P., and Ufnal, M. (2018). Indole and indoxyl sulfate, gut bacteria metabolites of tryptophan, change arterial blood pressure via peripheral and central mechanisms in rats. Pharmacol. Res. 130, 172–179. doi:10.1016/j.phrs.2017.12.025
Johnson, C. H., Ivanisevic, J., and Siuzdak, G. (2016). Metabolomics: beyond biomarkers and towards mechanisms. Nat. Rev. Mol. Cell Biol. 17 (7), 451–459. doi:10.1038/nrm.2016.25
Koshimizu, H., Matsuoka, H., Nakajima, Y., Kawai, A., Ono, J., Ohta, K. I., et al. (2021). Brain-derived neurotrophic factor predominantly regulates the expression of synapse-related genes in the striatum: insights from in vitro transcriptomics. Neuropsychopharmacol. Rep. 41 (4), 485–495. doi:10.1002/npr2.12208
Kummer, K. K., Mitrić, M., Kalpachidou, T., and Kress, M. (2020). The medial prefrontal cortex as a central hub for mental comorbidities associated with chronic pain. Int. J. Mol. Sci. 21 (10), 3440. doi:10.3390/ijms21103440
Larson, A. A., Giovengo, S. L., Russell, J. I., and Michalek, J. E. (2000). Changes in the concentrations of amino acids in the cerebrospinal fluid that correlate with pain in patients with fibromyalgia: implications for nitric oxide pathways. Pain 87 (2), 201–211. doi:10.1016/s0304-3959(00)00284-0
Latremoliere, A., Latini, A., Andrews, N., Cronin, S. J., Fujita, M., Gorska, K., et al. (2015). Reduction of neuropathic and inflammatory pain through inhibition of the tetrahydrobiopterin pathway. Neuron 86 (6), 1393–1406. doi:10.1016/j.neuron.2015.05.033
Li, Z. Z., Han, W. J., Sun, Z. C., Chen, Y., Sun, J. Y., Cai, G. H., et al. (2021). Extracellular matrix protein laminin β1 regulates pain sensitivity and anxiodepression-like behaviors in mice. J. Clin. investigation 131 (15), e146323. doi:10.1172/JCI146323
McWilliams, L. A., Goodwin, R. D., and Cox, B. J. (2004). Depression and anxiety associated with three pain conditions: results from a nationally representative sample. Pain 111 (1-2), 77–83. doi:10.1016/j.pain.2004.06.002
Menzies, V., Starkweather, A., Yao, Y., Kelly, D. L., Garrett, T. J., Yang, G., et al. (2021). Exploring associations between metabolites and symptoms of fatigue, depression and pain in women with fibromyalgia. Biol. Res. Nurs. 23 (1), 119–126. doi:10.1177/1099800420941109
Mortazavi, A., Williams, B. A., McCue, K., Schaeffer, L., and Wold, B. (2008). Mapping and quantifying mammalian transcriptomes by RNA-Seq. Nat. Methods 5 (7), 621–628. doi:10.1038/nmeth.1226
Muratani, T., Nishizawa, M., Matsumura, S., Mabuchi, T., Abe, K., Shimamoto, K., et al. (2003). Functional characterization of prostaglandin F2alpha receptor in the spinal cord for tactile pain (allodynia). J. Neurochem. 86 (2), 374–382. doi:10.1046/j.1471-4159.2003.01840.x
Ohtsuki, S., Asaba, H., Takanaga, H., Deguchi, T., Hosoya, K., Otagiri, M., et al. (2002). Role of blood-brain barrier organic anion transporter 3 (OAT3) in the efflux of indoxyl sulfate, a uremic toxin: its involvement in neurotransmitter metabolite clearance from the brain. J. Neurochem. 83 (1), 57–66. doi:10.1046/j.1471-4159.2002.01108.x
Porsolt, R. D., Anton, G., Blavet, N., and Jalfre, M. (1978). Behavioural despair in rats: a new model sensitive to antidepressant treatments. Eur. J. Pharmacol. 47 (4), 379–391. doi:10.1016/0014-2999(78)90118-8
Reading, J. L., Meyers, A. F., and Vyakarnam, A. (2012). Whey acidic proteins (WAPs): novel modulators of innate immunity to HIV infection. Curr. Opin. HIV AIDS 7 (2), 172–179. doi:10.1097/COH.0b013e32835005d9
Regard, J. B., Scheek, S., Borbiev, T., Lanahan, A. A., Schneider, A., Demetriades, A. M., et al. (2004). Verge: a novel vascular early response gene. J. Neurosci. 24 (16), 4092–4103. doi:10.1523/JNEUROSCI.4252-03.2004
Roszkowski, M., Bohacek, J., and Mansuy, I. J. R. G. (2014). The effects of acute stress on Apold1 gene expression and blood-brain barrier permeability. Thesis. Zurich: University of Zurich.
Saenger, A. K., Laha, T. J., Edenfield, M. J., and Sadrzadeh, S. M. (2007). Quantification of urinary 8-iso-PGF2alpha using liquid chromatography-tandem mass spectrometry and association with elevated troponin levels. Clin. Biochem. 40 (16-17), 1297–1304. doi:10.1016/j.clinbiochem.2007.07.023
Segain, J. P., Raingeard de la Blétière, D., Bourreille, A., Leray, V., Gervois, N., Rosales, C., et al. (2000). Butyrate inhibits inflammatory responses through NFkappaB inhibition: implications for Crohn's disease. Gut 47 (3), 397–403. doi:10.1136/gut.47.3.397
Shen, Y., Ding, Z., Ma, S., Ding, Z., Zhang, Y., Zou, Y., et al. (2019). SETD7 mediates spinal microgliosis and neuropathic pain in a rat model of peripheral nerve injury. Brain Behav. Immun. 82, 382–395. doi:10.1016/j.bbi.2019.09.007
Simon, G. E., VonKorff, M., Piccinelli, M., Fullerton, C., and Ormel, J. (1999). An international study of the relation between somatic symptoms and depression. N. Engl. J. Med. 341 (18), 1329–1335. doi:10.1056/NEJM199910283411801
Song, B. C., Joo, N. S., Aldini, G., and Yeum, K. J. (2014). Biological functions of histidine-dipeptides and metabolic syndrome. Nutr. Res. Pract. 8 (1), 3–10. doi:10.4162/nrp.2014.8.1.3
Stover, J. F., Lowitzsch, K., and Kempski, O. S. (1997). Cerebrospinal fluid hypoxanthine, xanthine and uric acid levels may reflect glutamate-mediated excitotoxicity in different neurological diseases. Neurosci. Lett. 238 (1-2), 25–28. doi:10.1016/s0304-3940(97)00840-9
Tang, J., Ko, S., Ding, H. K., Qiu, C. S., Calejesan, A. A., and Zhuo, M. (2005). Pavlovian fear memory induced by activation in the anterior cingulate cortex. Mol. pain 1, 6. doi:10.1186/1744-8069-1-6
Ueland, P. M., McCann, A., Midttun, Ø., and Ulvik, A. (2017). Inflammation, vitamin B6 and related pathways. Mol. aspects Med. 53, 10–27. doi:10.1016/j.mam.2016.08.001
Vinolo, M. A., Rodrigues, H. G., Festuccia, W. T., Crisma, A. R., Alves, V. S., Martins, A. R., et al. (2012). Tributyrin attenuates obesity-associated inflammation and insulin resistance in high-fat-fed mice. Am. J. physiology. Endocrinol. metabolism 303 (2), E272–E282. doi:10.1152/ajpendo.00053.2012
Vogt, B. A. (2005). Pain and emotion interactions in subregions of the cingulate gyrus. Nat. Rev. Neurosci. 6 (7), 533–544. doi:10.1038/nrn1704
Wang, D., An, S. C., and Zhang, X. (2008). Prevention of chronic stress-induced depression-like behavior by inducible nitric oxide inhibitor. Neurosci. Lett. 433 (1), 59–64. doi:10.1016/j.neulet.2007.12.041
Wang, X., Li, Z., Li, X., Liu, X., Ying, M., Cao, F., et al. (2023). Integrated metabolomics and transcriptomics reveal the neuroprotective effect of nervonic acid on LPS-induced AD model mice. Biochem. Pharmacol. 209, 115411. doi:10.1016/j.bcp.2023.115411
Watanabe, K., Watanabe, T., and Nakayama, M. (2014). Cerebro-renal interactions: impact of uremic toxins on cognitive function. Neurotoxicology 44, 184–193. doi:10.1016/j.neuro.2014.06.014
Xin, Z., Hui, A. Q., Xuebao, Y., and Mai, J. (2018). Sān dīng suān gānyóu zhǐ duì dòngwù shēngzhǎng hé cháng dào píngzhàng gōngnéng de yǐngxiǎng jí qí zuòyòng jīzhì. Chin. J. Animal Nutr. 30 (5), 8. doi:10.3969/j.issn.1006-267x.2018.05.009
Zhang, Y., Jiang, S., Liao, F., Huang, Z., Yang, X., Zou, Y., et al. (2022). A transcriptomic analysis of neuropathic pain in the anterior cingulate cortex after nerve injury. Bioengineered 13 (2), 2058–2075. doi:10.1080/21655979.2021.2021710
Zhou, X., Liu, L., Lan, X., Cohen, D., Zhang, Y., Ravindran, A. V., et al. (2019). Polyunsaturated fatty acids metabolism, purine metabolism and inosine as potential independent diagnostic biomarkers for major depressive disorder in children and adolescents. Mol. psychiatry 24 (10), 1478–1488. doi:10.1038/s41380-018-0047-z
Zhu, S., Ye, L., Bennett, S., Xu, H., He, D., and Xu, J. (2021). Molecular structure, gene expression and functional role of WFDC1 in angiogenesis and cancer. Cell Biochem. Funct. 39 (5), 588–595. doi:10.1002/cbf.3624
Zhuo, M. (2007). A synaptic model for pain: long-term potentiation in the anterior cingulate cortex. Mol. cells 23 (3), 259–271.
Zhuo, M. (2008). Cortical excitation and chronic pain. Trends Neurosci. 31 (4), 199–207. doi:10.1016/j.tins.2008.01.003
Zhuo, M. (2014). Long-term potentiation in the anterior cingulate cortex and chronic pain. Philosophical Trans. R. Soc. Lond. Ser. B, Biol. Sci. 369 (1633), 20130146. doi:10.1098/rstb.2013.0146
Zimmer, B., Angioni, C., Osthues, T., Toewe, A., Thomas, D., Pierre, S. C., et al. (2018). The oxidized linoleic acid metabolite 12,13-DiHOME mediates thermal hyperalgesia during inflammatory pain. Biochimica biophysica acta. Mol. Cell Biol. lipids 1863 (7), 669–678. doi:10.1016/j.bbalip.2018.03.012
Keywords: neuropathic pain, depression, metabolomics, transcriptomics, anterior cingulate cortex
Citation: Xi C, He L, Huang Z, Zhang J, Zou K, Guo Q and Huang C (2023) Combined metabolomics and transcriptomics analysis of rats under neuropathic pain and pain-related depression. Front. Pharmacol. 14:1320419. doi: 10.3389/fphar.2023.1320419
Received: 12 October 2023; Accepted: 29 November 2023;
Published: 08 December 2023.
Edited by:
Marta Llansola, Principe Felipe Research Center (CIPF), SpainReviewed by:
Huanghui Wu, Shanghai Fourth People’s Hospital, ChinaNi Fan, Guangzhou Medical University, China
Copyright © 2023 Xi, He, Huang, Zhang, Zou, Guo and Huang. This is an open-access article distributed under the terms of the Creative Commons Attribution License (CC BY). The use, distribution or reproduction in other forums is permitted, provided the original author(s) and the copyright owner(s) are credited and that the original publication in this journal is cited, in accordance with accepted academic practice. No use, distribution or reproduction is permitted which does not comply with these terms.
*Correspondence: Changsheng Huang, Y2hhbmdzaGVuZy5odWFuZ0Bjc3UuZWR1LmNu
 Caiyun Xi
 Liqiong He
 Zhifeng Huang1
 Qulian Guo
 Changsheng Huang