
94% of researchers rate our articles as excellent or good
Learn more about the work of our research integrity team to safeguard the quality of each article we publish.
Find out more
ORIGINAL RESEARCH article
Front. Pharmacol. , 22 November 2023
Sec. Cardiovascular and Smooth Muscle Pharmacology
Volume 14 - 2023 | https://doi.org/10.3389/fphar.2023.1266870
 Long Yang1†
 Xia Shen2†
 Zulihuma Seyiti1
 Jing Tang1,3,4
 Abudushalamu Kasimujiang1Tuohutasheng Dejite1Ling Zhao4,5Xue-Feng Shan1,4,5,6*
 Xiao-Ming Gao1,4,5*
Backgrounds: Hypertension stands as the predominant global cause of mortality. A notable deficiency exists in terms of predictive models for mortality among individuals with hypertension. We aim to devise an effective nomogram model that possesses the capability to forecast all-cause mortality within hypertensive populations.
Methods: The data for this study were drawn from nine successive cycles of the National Health and Nutrition Examination Survey (NHANES) spanning the years from 1999 to 2016. The dataset was partitioned into training and validation sets at a 7:3 ratio. We opted for clinical practice-relevant indicators, applied the least absolute shrinkage and selection operator (LASSO) regression to identify the most pertinent variables, and subsequently built a nomogram model. We also employed concordance index, receiver operating characteristic (ROC) curves, calibration curves and decision curve analysis (DCA) to assess the model’s validity.
Results: A total of 17,125 hypertensive participants were included in this study with a division into a training set (11,993 individuals) and a validation set (5,132 individuals). LASSO regression was applied for the training set to obtain nine variables including age, monocytes, neutrophils, serum albumin, serum potassium, cardiovascular disease, diabetes, serum creatinine and glycated hemoglobin (HbA1C), and constructed a nomogram prediction model. To validate this model, data from the training and validation sets were used for validation separately. The concordance index of the nomogram model was 0.800 (95% CI, 0.792–0.808, p < 0.001) based on the training set and 0.793 (95% CI, 0.781–0.805, p < 0.001) based on the validation set. The ROC curves, calibration curves, and DCA curves all showed good predictive performance.
Conclusion: We have developed a nomogram that effectively forecasts the risk of all-cause mortality among American adults in hypertensive populations. Clinicians may use this nomogram to assess patient’s prognosis and choose a proper intervention in a timely manner.
Hypertension stands as the most prevalent chronic ailment globally, which afflicts nearly 40% of adults across the world, and its prevalence continues to rise each year according to World Health Organization report (Pradhan et al., 2020). Prolonged elevation in blood pressure initiates a cascade of physiological changes, including vascular endothelial damage, abnormal proliferation, migration, invasion and phenotypic transformation of vascular smooth muscle cells (VSMCs). These processes eventually cause endothelial dysfunction, blood vessel constriction and stiffness, ultimately, insufficient blood supply to crucial organs like the heart, kidney and brain (Fang et al., 2019; Dikalova et al., 2020; Huang et al., 2020). Consequently, hypertension becomes a significant risk factor for the development of cardio- and cerebro-vascular diseases. In the United States alone, cardiovascular disease claims over 600,000 lives annually, with hypertension either directly responsible for or contributing significantly to more than 400,000 of these fatalities (Saltzgiver et al., 2019). Understanding the pathogenesis and predicting prognosis is essential to making informed decisions about the management of hypertension (Agongo et al., 2020). Early identification of high-risk patients with hypertension can improve their life expectancy and reduce the prevalence of life-threatening complications (Ma et al., 2020).
Machine learning represents a branch of artificial intelligence that possesses the capability to autonomously discern patterns within sample data and thereby enhance the accuracy of predictions (Chen et al., 2020). Noteworthy machine learning techniques encompass random forests, neural network, and the least absolute shrinkage and selection operator (LASSO) regression (Bayer et al., 2020). In recent years, various machine learning methods have been widely used for prognosis prediction of clinical patients, including cancer, cardiovascular diseases, and after surgical interventions. (Chang et al., 2013; Wu X. et al., 2022; Wang et al., 2022). Researchers have substantiated that machine learning techniques can provide more accurate diagnoses or prognoses compared to conventional statistical approaches (Wang et al., 2021).
Currently, many studies from large populations have observed that several metrics are associated with long-term prognosis in people with hypertension. For example, body mass index (BMI), white blood cells, uric acid (UA), and anti-hypertensive drugs (Zhu J. et al., 2022; Buonacera et al., 2022; Lu et al., 2022; Yan et al., 2022). Nevertheless, most of these studies have primarily focused on evaluating the prognostic impact of individual risk factors. There remains a notable scarcity of predictive models that incorporate multiple variables (comprising several risk factors) to ascertain the risk of mortality within hypertensive populations. In many cases, nomograms have proven to be a valuable tool for precisely estimating the risk of disease or complications (Wang et al., 2013). In the current study, we have harnessed data sourced from the National Health and Nutrition Examination Survey (NHANES) to undertake the development and validation of a straightforward, practical, and accurate predictive tool. This tool aims to effectively identify the risk of all-cause mortality among individuals with hypertension.
The data were extracted from nine consecutive cycles of the National Health and Nutrition Examination Survey (NHANES), spanning from 1999 to 2016. The NHANES database uses a complex sampling design and is mobilized by the National Center for Health Statistics of the United States Centers for Disease Control and Prevention (Zipf et al., 2013). Mobile Examination Centers (MECs) were utilized to administer physical examinations and collect blood samples from study participants, with these tasks being performed by extensively trained personnel (Ruan et al., 2022). The data were analyzed from February 2023 to March 2023. This study strictly followed Transparent Reporting of a multivariable prediction model for Individual Prognosis or Diagnosis (TRIPOD) (Collins et al., 2015). Furthermore, ethical approval for this study was granted by the National Center for Health Statistics (NCHS) Ethics Review Board, under the protocols #98–12, continuation of #2005–06, #2011–17, and continuation of #2011–17. Detailed information regarding these ethical approvals can be accessed via the following website: https://www.cdc.gov/nchs/nhanes/irba98.htm. All data used in this study are publicly available on the following website: https://www.cdc.gov/nchs/nhanes. Additionally, each participant provided written informed consent prior to their inclusion in the study.
Hypertension was defined as meeting one or more of the following criteria (Chobanian et al., 2003; Wu LD. et al., 2022): 1. Self-reported history of hypertension. 2. Use of antihypertensive medication. 3. Systolic blood pressure (SBP) ≥140 mmHg. 4. Diastolic blood pressure (DBP) ≥90 mmHg. BP were measured by a trained physician, employing a mercury sphygmomanometer equipped with an appropriately sized cuff. To ensure accuracy, three separate blood pressure measurements were taken for each participant, and the average of these three readings was used for analysis.
The selection of predictive variables for this analysis was based on a combination of clinical expertise and prior findings in the existing literature (Oparil et al., 2018). First, essential demographic data such as age, gender, race, marital status, education level, height, weight, and BP were gathered. Second, A wide array of biological markers and measurements were included in the dataset. These encompassed counts of white blood cells, red blood cells, lymphocytes, neutrophils, monocytes, and platelets, as well as measurements of hemoglobin, serum uric acid, serum creatinine, high density lipoprotein cholesterol (HDL-C), low density lipoprotein cholesterol (LDL-C), triglycerides, albumin, sodium, potassium, and glycated hemoglobin (HbA1C). Information regarding specific medical conditions and medication use was collected through structured questionnaires. This included data related to cardiovascular disease (CVD), diabetes mellitus, and the use of antihypertensive medications. Race was categorized as non-Hispanic white, non-Hispanic black, Mexican American, or others. Antihypertensive drugs were classified into categories such as angiotensin-converting enzyme inhibitors/angiotensin receptor blockers (ACEI/ARB), calcium channel blockers, beta-blockers, and diuretics. Statins were defined as drugs used to manage hyperlipidemia. CVD data were gathered from self-reported information obtained during personal interviews. Participants were asked whether they had ever been diagnosed by a healthcare professional with conditions such as congestive heart failure (CHF), coronary heart disease (CHD), angina, heart attack, or stroke. If any of these questions were answered affirmatively, the presence of CVD was considered. Diabetes mellitus (DM) was identified through multiple criteria, including self-report of a doctor’s diagnosis, glycohemoglobin (HbA1c) levels exceeding 6.5%, fasting glucose levels equal to or greater than 7.0 mmol/L, random blood glucose levels equal to or greater than 11.1 mmol/L, 2-h oral glucose tolerance test (OGTT) blood glucose levels equal to or greater than 11.1 mmol/L, or the use of diabetes medications or insulin.
The assessment of the mortality status of the study population was conducted using the NHANES Public-Use Linked Mortality Files, with data up to the termination date of 31 December 2019. This linkage was established through a probability matching algorithm, connecting the National Center for Health Statistics (NCHS) database with the National Death Index (NDI) (Zhou et al., 2021). In this context, all-cause mortality was defined as death resulting from any cause.
In accordance with NHANES analysis guidelines, we meticulously considered the intricate sampling designs and sample sizes during the data analysis process. Data were weighted to achieve a representative sample size for each sample. (Johnson et al., 2014). The weighting formula is as follows: 9 cycles of mobile examination center (MEC) weights = 4 years of MEC weights (1999–2002) × 2/9 + 2 years of MEC weights (2003–2016) × 1/9. All data analyses were conducted using the statistical software package R (http://www.r-project.org, version 4.2.3). First, the participants were divided into a training set and a validation set in the ratio of 7:3 (using the ‘caret’ package version 6.0–93, “createDataPartition” function). Continuous variables were presented as weighted means ± standard deviations. To compare differences between groups, Student’s t-test was employed. Meanwhile, categorical variables were expressed as frequencies and percentages and compared using Rao-Scott’s χ2 test. In addition, correlation analysis was performed using person correlation for continuous variables. Furthermore, variables in the training set underwent a filtering process through the LASSO regression. Variables that had non-zero coefficients in the LASSO regression model were chosen for building the nomogram prediction model. To confirm the statistical significance of the variables included in the nomogram model, Cox proportional hazard regression was employed. The accuracy of the risk prediction model was assessed through several metrics, including time-dependent receiver operating characteristic (ROC) curves, the concordance index (C-Index), calibration plots, and decision curve analysis (DCA) curves. These evaluations were conducted separately for the training and validation sets. The ROC curve area under the curve (AUC) has a value between 0.5 and 1. An AUC value close to 1 indicates the good performance of the prediction model (Harrell et al., 1982). The C-index is the proportion of the total number of pairs in which the predicted outcome agrees with the actual outcome in a two-by-two pairing of all samples. C-index >0.7 is considered to have good discriminatory power (Longato et al., 2020). The calibration plot is a scatter plot of the actual and predicted incidence, and if the curves are on the diagonal of the coordinates respectively indicates that the predictive power of the model is more accurate (Barda et al., 2020). The DCA curve avoids the problems of choosing the critical value of the ROC curve, sensitivity, and specificity, and directly calculates the net benefit in the clinical setting (Vickers et al., 2008). DCA curves that are above the two extreme values indicate that the model has good clinical applicability. In all the above analyses, a two-sided p-value less than 0.05 was considered statistically significant.
In this study, we initially included a total of 50,695 participants with valid follow-up data. Subsequently, after excluding individuals without hypertension (61% of the initial sample) and those with incomplete data, a final study population of 17,125 participants was established (Figure 1). The average age of the study participants was 56.5 years, with 8,480 (49.5%) being male and 8,645 (50.5%) being female. Over a median follow-up period of 109 months, 4,656 deaths occurred among the hypertensive population. For cross-validation purposes, the total number of cases was divided into a training set (11,993 participants) and a validation set (5,132 participants) in a 7:3 ratio. It is important to note that we applied weighting and adjustments to all results due to the complex sampling design utilized by NHANES. Within the training set, the mean age of participants was 56.5 years, consisting of 5,969 (49.4%) men and 6,024 (50.6%) women. During a median follow-up period of 108 months, 3,274 patients passed away. In contrast, the median age of participants in the validation set was 56.3 years, comprising 2,511 (49.0%) men and 2,621 (51.0%) women. Within this group, 1,382 patients experienced mortality during a median follow-up period of 110 months. When comparing the two groups, significant statistical differences were observed in terms of weight, BMI, monocyte counts, HbA1C levels, and the prevalence of Diatetes. There were no statistically significant variations in other general variables or laboratory test data. (Table 1).
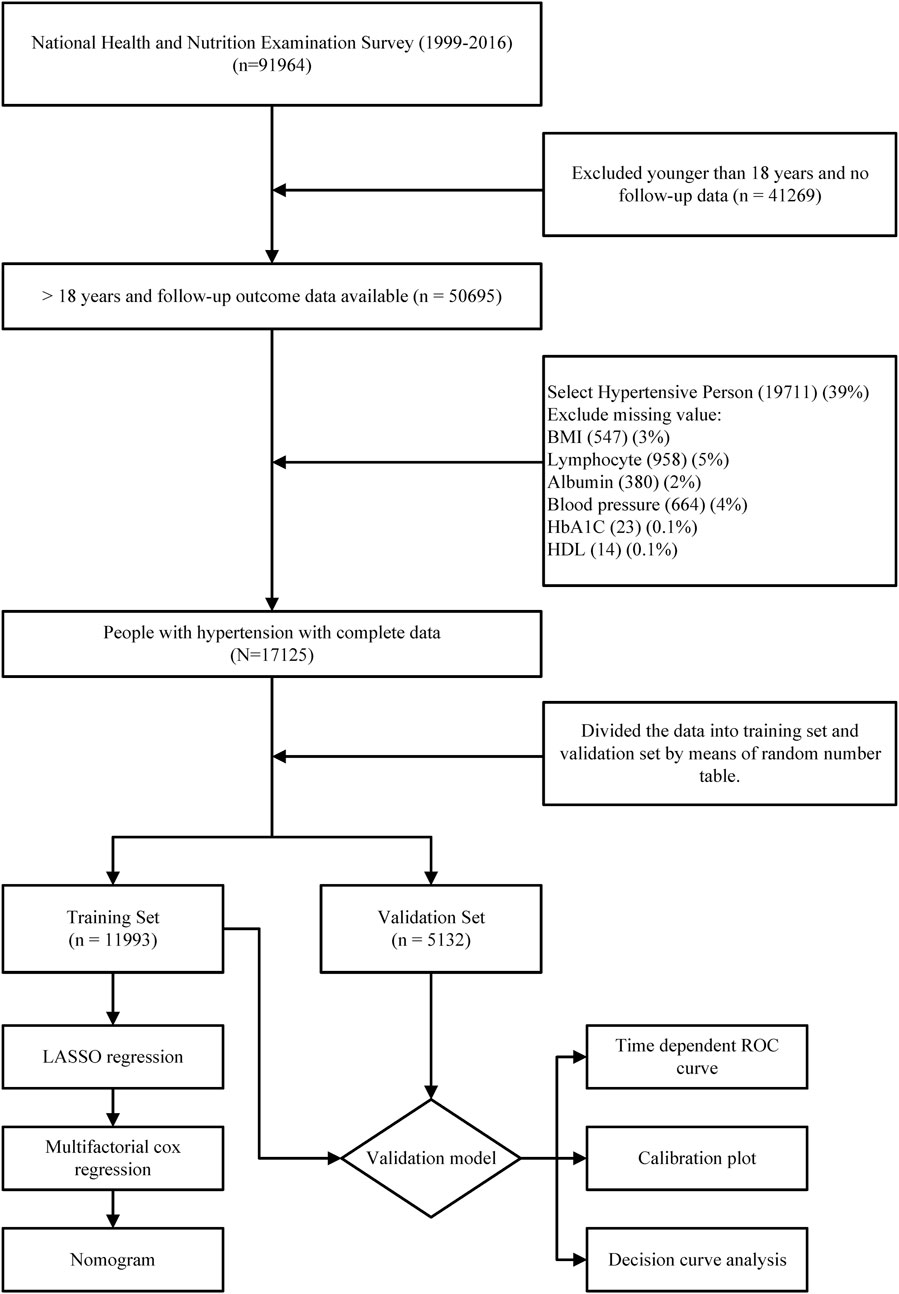
FIGURE 1. Flow chart of the entire process of inclusion criteria and statistical analysis of the hypertensive population in this study.
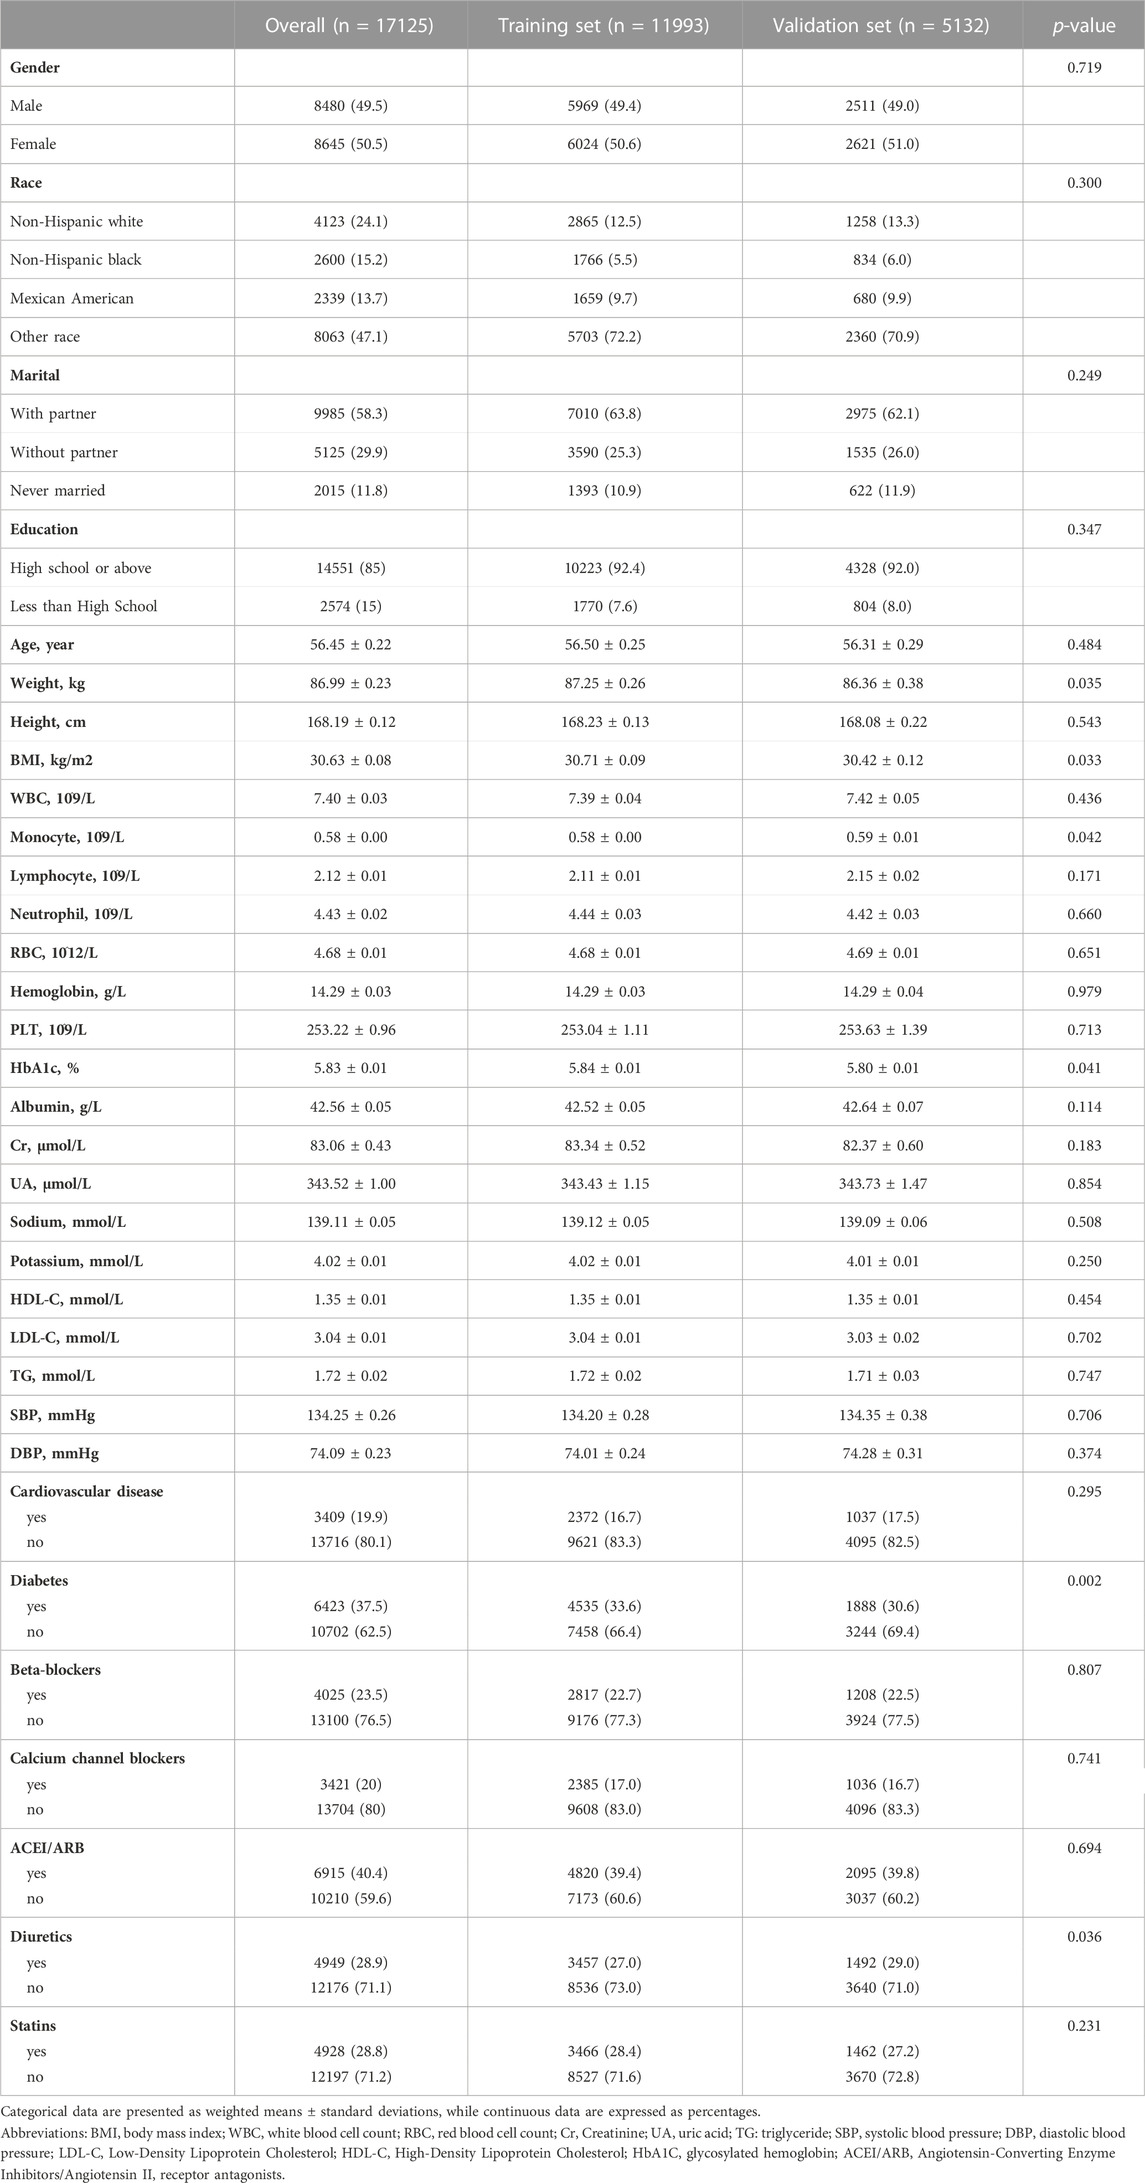
TABLE 1. Baseline characteristics of training and validation sets.
To develop clinical prediction models, we employed LASSO regression to screen variables from an initial pool of 32 risk factors within the training set data (Figure 2A). Utilizing the regularization technique, we identified the optimal lambda value, which was situated within one standard deviation of the minimum mean square error of the minimum lambda (Figure 2B). This process resulted in the reduction of the potential predictor variables from 32 down to 9. The final variables of age, monocytes, neutrophils, serum albumin, serum potassium, history of CVD, history of diabetes, serum creatinine, and HbA1C were selected to participate in the construction of the nomogram (Figure 3). A multifactorial COX proportional hazard regression analyze was also applied to assess the validity of these variables (Table 2). To verify the representativeness of these characteristics, person correlation coefficients indicated that the above nine variables were correlated with other variables that were not included in the Nomogram (Supplementary Figure S1).
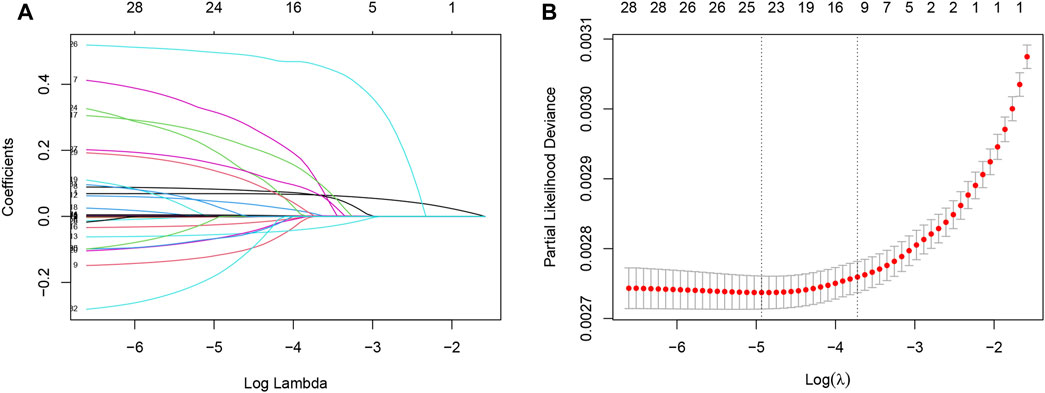
FIGURE 2. Least absolute shrinkage and selection operator (LASSO) regression models were used to select risk factors contributing to all-cause mortality in the American hypertensive population over a mean of 9 years. (A) LASSO coefficient curves for 32 Variables. X-axis is log (lambda) and Y-axis is partial regression coefficients. As log (lambda) increases, the compression parameter increases, and the absolute value of the biased regression coefficient decreases, possibly to zero, and is thus excluded. (B) The optimal parameter (lambda) in the LASSO model was selected using a five-fold cross-validation based on the minimum criterion. Partial likelihood deviation (binomial deviation) curves were plotted against log (lambda). Dashed vertical lines were drawn at the optimal values by using the minimum mean squared error and one standard deviation of the minimum mean squared error (1-SE criterion). The 9 hazard Variables corresponding to log (lambda)-1SE were used.
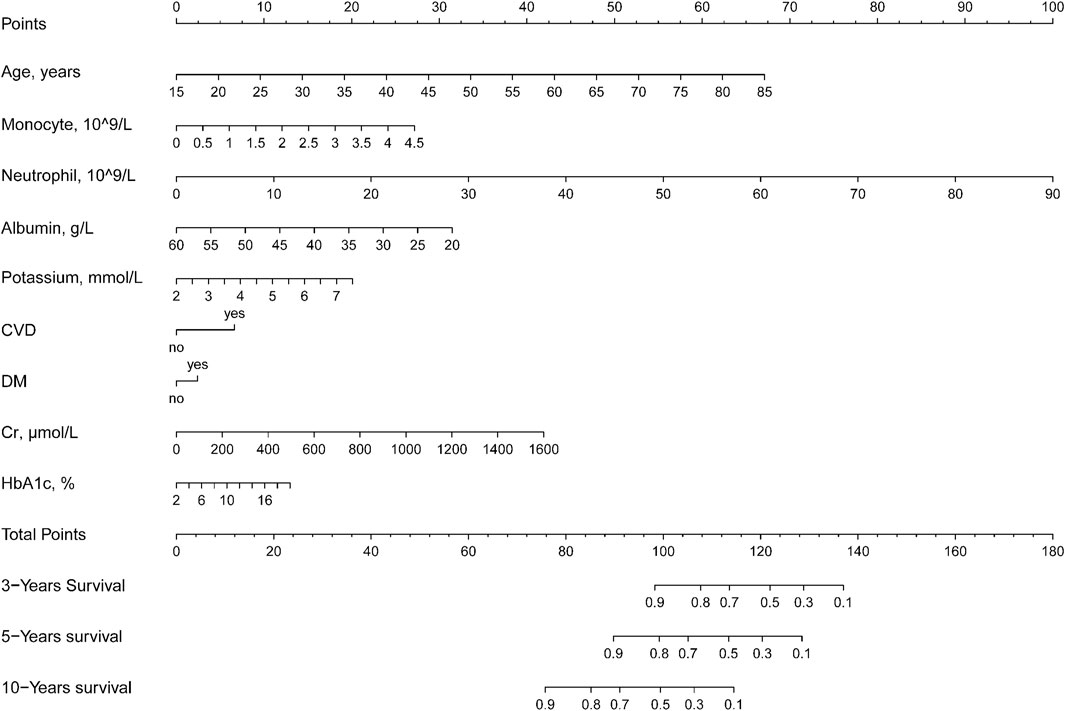
FIGURE 3. Nomogram to assess the risk of all-cause mortality in a hypertensive population over 3, 5, and 10 years.

TABLE 2. Validation of each variable using multifactorial Cox regression based on coefficients and lambda.1se values from LASSO regression on the training set.
The essence of nomogram is to visualize complex model formulations (Xie et al., 2021). In the present study, the formula for the Nomogram was as follows.
Therefore, to simplify the equation, we constructed the nomogram and showed how to use the method (Supplementary Figure S2). For example, if an adult with hypertension is 55 years old, has a monocyte count of 0.5 × 10^9/L, a lymphocyte count of 10 × 10^9/L, albumin of 40 g/L, a serum potassium concentration of 4 mmol/L, cardiovascular disease, no diabetes mellitus, a creatinine of 400 μmol/L, and an HbA1C of 5%. Then his total score was 95, with a survival rate of >90% at 3 years, about 85% at 5 years, and about 60% at 10 years.
To assess the reliability of the established clinical prediction model, we conducted testing on both the training and validation datasets. First, we calculated the overall C-index of the model. In the training set, the C-index for the nomogram model was 0.800 (95% CI, 0.792–0.808; p < 0.001), while in the validation set, it was 0.793 (95% CI, 0.781–0.805; p < 0.001). Second, we employed a time-dependent receiver operating curve (ROC) analysis to evaluate the accuracy of the nomogram model in predicting the risk of all-cause mortality at 3, 5, and 10 years (Figure 4). The AUC values were 0.807, 0.819 and 0.833 for 3, 5 and 10 years in the training group, respectively. The AUC values were 0.812, 0.797 and 0.824 for 3, 5 and 10 years in the validation set, respectively. Finally, calibration curve validation (Figure 5) and DCA analysis (Figure 6) were performed on the data from the training and validation sets, respectively. The calibration curve demonstrates that the actual mortality (Y-axis) and the all-cause mortality (X-axis) fitted in the nomogram model are distributed around a straight line with a slope of 45° across the origin. The decision curve is in the horizontal coordinate range of 0.1–0.7 and lies above the two extreme lines of None and All, indicating that the model has good predictive power in this range.

FIGURE 4. Time-dependent receiver operating curve (ROC) analysis and time-dependent AUC curves for the Nomogram model for predicting all-cause mortality in hypertensive patients. The ROC curve in red indicates a forecast cutoff of 3 years, blue indicates 5 years, and yellow indicates 10 years. (A) ROC curve for the training set. (B) AUC curve for the training set. (C) ROC curve for the validation set. (D) AUC curve for the validation set.
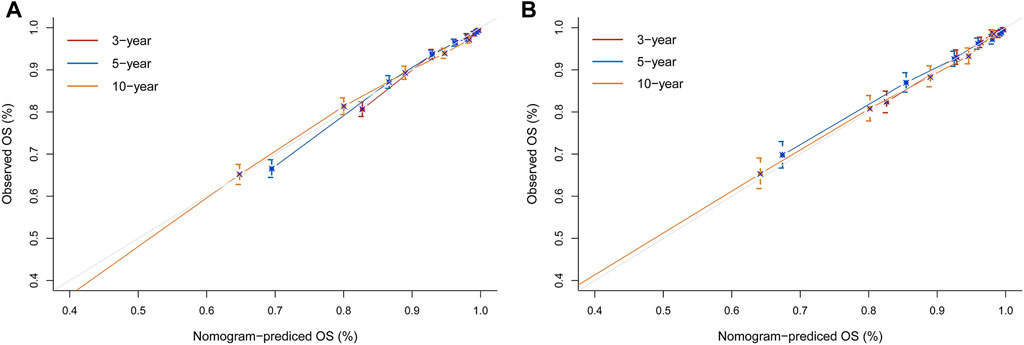
FIGURE 5. Nomogram calibration curves for predicting all-cause mortality risk in a hypertensive population at 3, 5, and 10 years. (A) Training set. (B) Validation set. X-axis represents the predicted risk of mortality. Y-axis represents the actual mortality. The red curve indicates a forecast time cutoff of 3 years, blue indicates 5 years, and yellow indicates 10 years. The dashed line on the diagonal represents the perfect prediction of the ideal model. The solid line represents the performance of the nomogram. A better fit to the dashed diagonal line represents a better prediction.
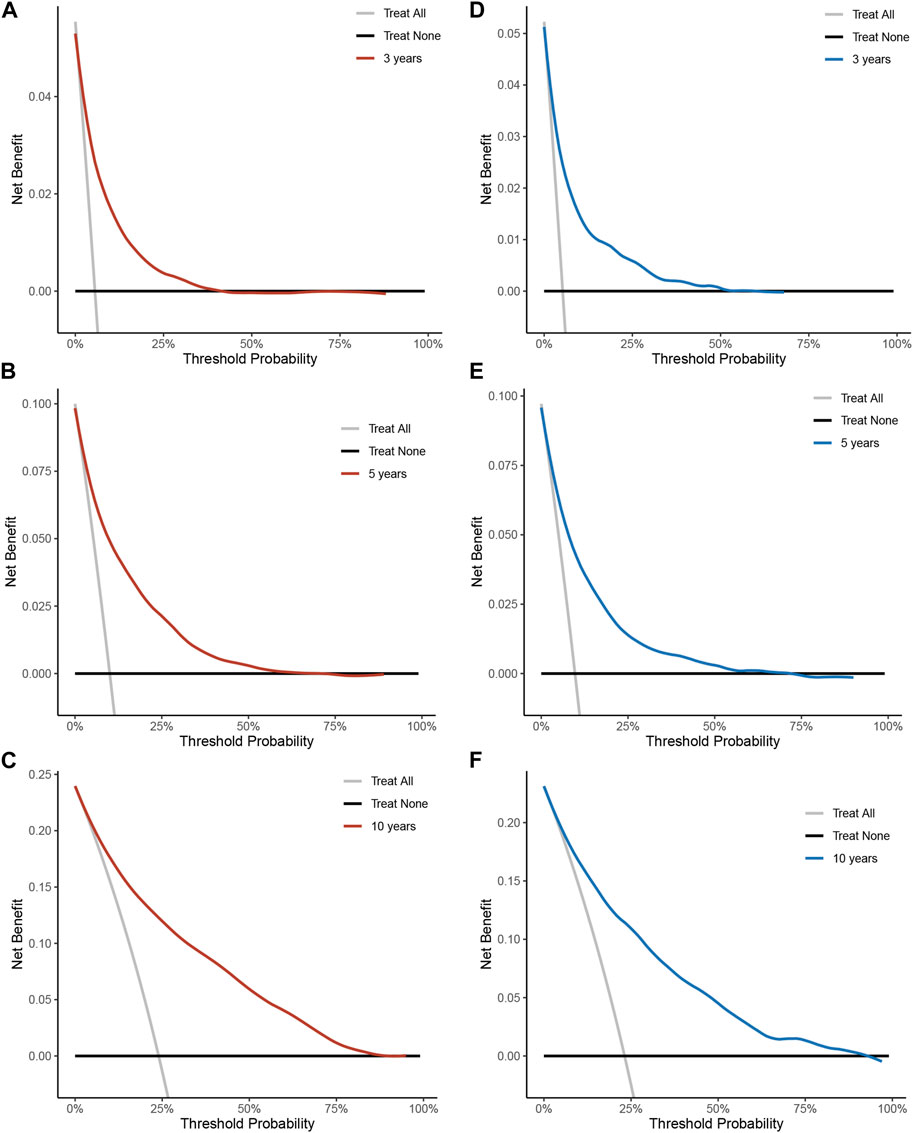
FIGURE 6. Decision curve analysis of all-cause mortality risk nomograms over 3, 5, 10 years in a hypertensive population. (A) Training set for 3 years. (B) Training set for 5 years. (C) Training set for 10 years. (D) Validation set for 3 years. (E) Validation set 5 years. (F) Validation set for 10 years. Y-axis represents net benefit. The dashed line represents the nomogram. The thick solid line represents the hypothesis of all mortality. The thin solid line represents the hypothesis of no disease mortality.
In this research, we have devised and verified a straightforward clinical prediction model with a substantial and nationally representative dataset from NHANES. We employed machine learning techniques along with LASSO regression to accomplish this. We considered currently clinically accepted risk indicators for hypertension while selecting the most representative variables from a wide range of variables. Our ultimate findings reveal a significant association between the risk of all-cause mortality in hypertensive populations and the following variables: age, monocyte count, neutrophil count, serum albumin levels, serum potassium levels, cardiovascular history, history of diabetes, serum creatinine levels, and HbA1C levels. We developed a nomogram model with the above 9 variables. Through rigorous cross-validation, the nomogram model exhibited a reasonably strong ability to predict the risk of all-cause mortality within the hypertensive population.
Hypertension is positively associated with a range of serious life-threatening CVD such as angina pectoris, ischemic heart disease, heart failure, and myocardial infarction (Aune et al., 2021; Wu et al., 2023). Therefore, the prediction of mortality in hypertensive patients should receive more attention. To date, many models have been employed for predicting morbidity or mortality among individuals with hypertension. However, existing population-specific disease prediction models are not applicable to different regional populations due to various factors such as region, ethnicity, socioeconomic conditions, and disease prevention strategies. Pocock et al., 2001 developed a risk score system to prognosticate the risk of mortality in hypertensive patients using an equation. Martínez-Díaz et al., 2019 devised a scoring system to forecast 1-year all-cause mortality in hospitalized hypertensive individuals. Zhang et al., 2022 crafted a nomogram using NHANES data, but it targeted individuals aged over 65. To our knowledge, no predictive models currently exist to gauge the mortality risk specifically in the American adult hypertensive population. Hence, we have developed a nomogram capable of predicting all-cause mortality risk over 3, 5, and 10 years. This tool aims to enhance risk stratification among the adult hypertensive population in the United States.
In this prediction model, age is the most significant independent predictor. With aging, vascular endothelial cell function decreases, vascular elasticity vitality is gradually lost, and BP variability increases (Zixuan et al., 2020; Zhu M. et al., 2022). Especially in the hypertensive population, aging results in reversible loss of vascular function (Kruyer et al., 2015). In addition, comorbidities including diabetes mellitus, and CVD all exacerbate the risk in hypertensive patients. In alignment with prior research, the prevalence of diabetes at the time of hypertension diagnosis is linked to an elevated mortality risk. This association is largely attributable to the exacerbation of vascular endothelial injury due to oxidative stress induced by elevated glucose levels (Lip et al., 2016; Hubbard et al., 2019). When hypertension coexists with CVD, it further accelerates the progression of cardiovascular conditions. Consequently, this escalation leads to the development of a spectrum of severe complications, including arrhythmias, myocardial infarction and heart failure (Surendran et al., 2016).
In addition to the above traditional risk factors, monocytes, neutrophils, serum albumin, serum potassium, serum creatinine and HbA1C were also identified as the significant risk factors for all-cause mortality of hypertensive individuals. The inflammatory response plays a pivotal role in the onset and progression of hypertension, culminating in organ damage over time (Madhur et al., 2021). Circulating monocytes in hypertensive patients may further differentiate into macrophages. They then express tumor necrosis factor-α (TNF-α) and interleukin-1β (IL-1β) to promote immune response (Justin Rucker and Crowley, 2017). Moreover, neutrophils have been documented to involve in cardiovascular and renal damage in hypertension (McCarthy et al., 2021). During high BP, the autonomic nervous system can activate neutrophils, provoking vascular system damage, the release of reactive oxidants (ROS), and the promotion of endothelial dysfunction. Several clinical trials have demonstrated that monocytes and lymphocytes have an independent predictive effect on the prognosis of hypertensive patients (Tatsukawa et al., 2008; Liu et al., 2015; Ganjali et al., 2018). Serum albumin stands as a crucial marker reflecting the body’s nutritional status, with various functions including the maintenance of colloid osmotic pressure, preservation of microvascular integrity, antioxidant properties, and antithrombotic effects (Li et al., 2020). Several prior investigations have demonstrated that serum albumin can serve as a predictive factor for the prognosis of individuals with hypertension (Sun et al., 2017; Yılmaz et al., 2022). Potassium is a highly abundant cation in intracellular fluids and is directly involved in intracellular metabolic activities (Bischof et al., 2017). Concerns regarding the risk of hyperkalemia have garnered significant attention, particularly among those with chronic ailments. Research indicates that both low and high potassium levels are linked to all-cause mortality in hypertensive patients (Byrne et al., 2021). Therefore, it is particularly critical to maintain normal potassium levels. Serum creatinine (sCr) is a marker of kidney function (Allegretti et al., 2019). High blood creatinine is often associated with decreased glomerular filtration, causing water and sodium retention, which increases cardiac burden and the prevalence of CVD. A study conducted in China found an association between sCr levels and a 10 years cardiovascular risk in hypertensive patients (Chen et al., 2023). Glycated hemoglobin (HbA1c) is the binding product of hemoglobin to blood glucose and provides an estimation of long-term glycemic control (Hulme et al., 2017). Prolonged elevations in HbA1c can activate the advanced glycosylation end products (AGEs-RAGE) axis, subsequently leading to impaired endothelial function, release of vascular inflammatory factors, remodeling of vital arteries and atherosclerosis (Creager et al., 2003). One study has revealed an association between HbA1c levels and both cardiovascular mortality and all-cause mortality among the American population with hypertension (Chonchol et al., 2010).
This study possesses several notable strengths. Firstly, we drew a large, representative sample from NHANES, which was weighted in the data analysis, allowing our results to be generalized to the entire American population and providing a solid foundation for the findings. Secondly, we included predictors that are common in clinical practice. Patient demographic information or serum markers are routinely tested in hospitals, enhancing the utility of assessing prognosis. Thirdly, the model’s Robust predictive accuracy of this model assessed through cross-validation signifies the development of a more precise tool for gauging the risk of all-cause mortality among hypertensive patients. Nonetheless, certain limitations should be acknowledged. Firstly, the retrospective nature of this study necessitates prospective research to validate our results and ensure their generalizability. Secondly, the study’s population was confined to adult hypertensive patients in the United States, potentially limiting the model’s applicability to other countries and regions.
In conclusion, our study reveals that age, monocytes, neutrophils, serum albumin, serum potassium, cardiovascular disease, diabetes mellitus, serum creatinine, and HbA1C are all significant factors tied to the risk of all-cause mortality in individuals with hypertension. Leveraging these risk factors, we have crafted a nomogram that can effectively predict the risk of all-cause mortality in American adults afflicted with hypertension. This nomogram represents a valuable tool for clinicians, enabling them to assess prognosis and implement timely interventions for improved patient care.
The datasets presented in this study can be found in online repositories. The names of the repository/repositories and accession number(s) can be found below: https://wwwn.cdc.gov/nchs/nhanes/search/default.aspx.
The studies involving humans were approved by the National Center for Health Statistics (NCHS) Ethics Review Board. The studies were conducted in accordance with the local legislation and institutional requirements. The participants provided their written informed consent to participate in this study.
LY: Writing–original draft, Writing–review and editing, Conceptualization, Data curation, Formal Analysis, Investigation, Methodology, Project administration, Software, Visualization. XS: Writing–original draft, Writing–review and editing, Conceptualization, Data curation, Formal Analysis, Investigation, Methodology, Project administration, Software, Visualization. ZS: Data curation, Formal Analysis, Writing–original draft. JT: Data curation, Formal Analysis, Writing–original draft. AK: Data curation, Writing–original draft. TD: Data curation, Writing–original draft. LZ: Data curation, Writing–original draft. X-FS: Supervision, Supervision, Writing–review and editing. X-MG: Supervision, Supervision, Writing–review and editing, Funding acquisition.
The author(s) declare financial support was received for the research, authorship, and/or publication of this article. This work was supported by the grants of the Natural Science Foundation of China (No. U1903212 and 82360051), the key project of the Natural Science Foundation of Xinjiang Uygur Autonomous Region, Special projects on Cardiovascular Disease from the State Key Laboratory of Pathogenesis, Prevention and Treatment of Central Asia High Incidence Diseases (SKL-HIDCA-2022-XXG1, SKL-HIDCA-2021-XXG1), an opening project of the Xinjiang Key Laboratory (2021D04020), and the Xinjiang Medical University Postgraduate Scientific Research innovatian Project (XJ2023G156).
The authors declare that the research was conducted in the absence of any commercial or financial relationships that could be construed as a potential conflict of interest.
All claims expressed in this article are solely those of the authors and do not necessarily represent those of their affiliated organizations, or those of the publisher, the editors and the reviewers. Any product that may be evaluated in this article, or claim that may be made by its manufacturer, is not guaranteed or endorsed by the publisher.
The Supplementary Material for this article can be found online at: https://www.frontiersin.org/articles/10.3389/fphar.2023.1266870/full#supplementary-material
Agongo, G., Nonterah, E. A., Amenga-Etego, L., Debpuur, C., Kaburise, M. B., Ali, S. A., et al. (2020). Blood pressure indices and associated risk factors in a rural west african adult population: insights from an AWI-gen substudy in Ghana. Int. J. Hypertens. 2020, 4549031. Epub 20200426. doi:10.1155/2020/4549031
Allegretti, A. S., Vela Parada, X., Ortiz, G. A., Long, J., Krinsky, S., Zhao, S., et al. (2019). Serum angiopoietin-2 predicts mortality and kidney outcomes in decompensated cirrhosis. Hepatology 69 (2), 729–741. Epub 20190104. doi:10.1002/hep.30230
Aune, D., Huang, W., Nie, J., and Wang, Y. (2021). Hypertension and the risk of all-cause and cause-specific mortality: an outcome-wide association study of 67 causes of death in the national health interview survey. Biomed. Res. Int. 2021, 9376134. Epub 20210712. doi:10.1155/2021/9376134
Barda, N., Riesel, D., Akriv, A., Levy, J., Finkel, U., Yona, G., et al. (2020). Developing a COVID-19 mortality risk prediction model when individual-level data are not available. Nat. Commun. 11 (1), 4439. Epub 20200907. doi:10.1038/s41467-020-18297-9
Bayer, B., von Stosch, M., Melcher, M., Duerkop, M., and Striedner, G. (2020). Soft sensor based on 2D-fluorescence and process data enabling real-time estimation of biomass in Escherichia coli cultivations. Eng. Life Sci. 20 (1-2), 26–35. Epub 20191111. doi:10.1002/elsc.201900076
Bischof, H., Rehberg, M., Stryeck, S., Artinger, K., Eroglu, E., Waldeck-Weiermair, M., et al. (2017). Novel genetically encoded fluorescent probes enable real-time detection of potassium in vitro and in vivo. Nat. Commun. 8 (1), 1422. Epub 20171110. doi:10.1038/s41467-017-01615-z
Buonacera, A., Stancanelli, B., Colaci, M., and Malatino, L. (2022). Neutrophil to lymphocyte ratio: an emerging marker of the relationships between the immune system and diseases. Int. J. Mol. Sci. 23 (7), 3636. Epub 20220326. doi:10.3390/ijms23073636
Byrne, C., Pareek, M., Vaduganathan, M., Biering-Sørensen, T., Krogager, M. L., Kragholm, K. H., et al. (2021). Serum potassium and mortality in high-risk patients: SPRINT. Hypertension 78 (5), 1586–1594. Epub 20211004. doi:10.1161/hypertensionaha.121.17736
Chang, S. W., Abdul-Kareem, S., Merican, A. F., and Zain, R. B. (2013). Oral cancer prognosis based on clinicopathologic and genomic markers using a hybrid of feature selection and machine learning methods. BMC Bioinforma. 14, 170. Epub 20130531. doi:10.1186/1471-2105-14-170
Chen, P., Yang, Y., Zhang, Y., Jiang, S., Li, X., and Wan, J. (2020). Identification of prognostic immune-related genes in the tumor microenvironment of endometrial cancer. Aging (Albany NY) 12 (4), 3371–3387. Epub 20200219. doi:10.18632/aging.102817
Chen, X., Jin, H., Wang, D., Liu, J., Qin, Y., Zhang, Y., et al. (2023). Serum creatinine levels, traditional cardiovascular risk factors and 10-year cardiovascular risk in Chinese patients with hypertension. Front. Endocrinol. (Lausanne) 14, 1140093. Epub 20230316. doi:10.3389/fendo.2023.1140093
Chobanian, A. V., Bakris, G. L., Black, H. R., Cushman, W. C., Green, L. A., Izzo, J. L., et al. (2003). The seventh report of the joint national committee on prevention, detection, evaluation, and treatment of high blood pressure: the JNC 7 report. Jama 289 (19), 2560–2572. Epub 20030514. doi:10.1001/jama.289.19.2560
Chonchol, M., Katz, R., Fried, L. F., Sarnak, M. J., Siscovick, D. S., Newman, A. B., et al. (2010). Glycosylated hemoglobin and the risk of death and cardiovascular mortality in the elderly. Nutr. Metab. Cardiovasc Dis. 20 (1), 15–21. Epub 20090411. doi:10.1016/j.numecd.2009.02.007
Collins, G. S., Reitsma, J. B., Altman, D. G., and Moons, K. G. (2015). Transparent reporting of a multivariable prediction model for individual prognosis or diagnosis (TRIPOD): the TRIPOD statement. Bmj 350, g7594. Epub 20150107. doi:10.1136/bmj.g7594
Creager, M. A., Lüscher, T. F., Cosentino, F., and Beckman, J. A. (2003). Diabetes and vascular disease: pathophysiology, clinical consequences, and medical therapy: Part I. Circulation 108 (12), 1527–1532. doi:10.1161/01.Cir.0000091257.27563.32
Dikalova, A. E., Pandey, A., Xiao, L., Arslanbaeva, L., Sidorova, T., Lopez, M. G., et al. (2020). Mitochondrial deacetylase Sirt3 reduces vascular dysfunction and hypertension while Sirt3 depletion in essential hypertension is linked to vascular inflammation and oxidative stress. Circ. Res. 126 (4), 439–452. Epub 20191219. doi:10.1161/circresaha.119.315767
Fang, G., Qi, J., Huang, L., and Zhao, X. (2019). LncRNA MRAK048635_P1 is critical for vascular smooth muscle cell function and phenotypic switching in essential hypertension. Biosci. Rep. 39 (3). Epub 20190319. doi:10.1042/bsr20182229
Ganjali, S., Gotto, A. M., Ruscica, M., Atkin, S. L., Butler, A. E., Banach, M., et al. (2018). Monocyte-to-HDL-cholesterol ratio as a prognostic marker in cardiovascular diseases. J. Cell Physiol. 233 (12), 9237–9246. Epub 20180804. doi:10.1002/jcp.27028
Harrell, F. E., Califf, R. M., Pryor, D. B., Lee, K. L., and Rosati, R. A. (1982). Evaluating the yield of medical tests. JAMA 247 (18), 2543–2546. doi:10.1001/jama.1982.03320430047030
Huang, X., Yang, J., Song, B., Wang, N., Ma, M., Wang, H., et al. (2020). Caduet enhances connexin 43 phosphorylation in left ventricular and thoracic aorta of SH model rats. Exp. Ther. Med. 20 (5), 80. Epub 20200911. doi:10.3892/etm.2020.9207
Hubbard, D., Colantonio, L. D., Tanner, R. M., Carson, A. P., Sakhuja, S., Jaeger, B. C., et al. (2019). Prediabetes and risk for cardiovascular disease by hypertension status in black adults: the jackson heart study. Diabetes Care 42 (12), 2322–2329. Epub 20191007. doi:10.2337/dc19-1074
Hulme, K. D., Gallo, L. A., and Short, K. R. (2017). Influenza virus and glycemic variability in diabetes: a killer combination? Front. Microbiol. 8, 861. Epub 20170522. doi:10.3389/fmicb.2017.00861
Johnson, C. L., Dohrmann, S. M., Burt, V. L., and Mohadjer, L. K. (2014). National health and nutrition examination survey: sample design, 2011-2014. Vital Health Stat. 2 (162), 1–33.
Justin Rucker, A., and Crowley, S. D. (2017). The role of macrophages in hypertension and its complications. Pflugers Arch. 469 (3-4), 419–430. Epub 20170301. doi:10.1007/s00424-017-1950-x
Kruyer, A., Soplop, N., Strickland, S., and Norris, E. H. (2015). Chronic hypertension leads to neurodegeneration in the TgSwDI mouse model of alzheimer's disease. Hypertension 66 (1), 175–182. Epub 20150504. doi:10.1161/hypertensionaha.115.05524
Li, H., Chen, C., Li, Z. M., Yang, Y., Xing, C. Q., Li, Y., et al. (2020). Specific interaction with human serum albumin reduces ginsenoside cytotoxicity in human umbilical vein endothelial cells. Front. Pharmacol. 11, 498. Epub 20200429. doi:10.3389/fphar.2020.00498
Lip, S., Jeemon, P., McCallum, L., Dominiczak, A. F., McInnes, G. T., and Padmanabhan, S. (2016). Contrasting mortality risks among subgroups of treated hypertensive patients developing new-onset diabetes. Eur. Heart J. 37 (12), 968–974. Epub 20151027. doi:10.1093/eurheartj/ehv557
Liu, X., Zhang, Q., Wu, H., Du, H., Liu, L., Shi, H., et al. (2015). Blood neutrophil to lymphocyte ratio as a predictor of hypertension. Am. J. Hypertens. 28 (11), 1339–1346. Epub 20150330. doi:10.1093/ajh/hpv034
Longato, E., Vettoretti, M., and Di Camillo, B. (2020). A practical perspective on the concordance index for the evaluation and selection of prognostic time-to-event models. J. Biomed. Inf. 108, 103496. Epub 20200709. doi:10.1016/j.jbi.2020.103496
Lu, Q., Zhang, Y., Geng, T., Yang, K., Guo, K., Min, X., et al. (2022). Association of lifestyle factors and antihypertensive medication use with risk of all-cause and cause-specific mortality among adults with hypertension in China. JAMA Netw. Open 5 (2), e2146118. Epub 20220201. doi:10.1001/jamanetworkopen.2021.46118
Ma, L., Zhao, H., Yu, M., Wen, Y., Zhao, T., Yan, M., et al. (2020). Association of epoxide hydrolase 2 gene Arg287Gln with the risk for primary hypertension in Chinese. Int. J. Hypertens. 2020, 2351547. Epub 20200228. doi:10.1155/2020/2351547
Madhur, M. S., Elijovich, F., Alexander, M. R., Pitzer, A., Ishimwe, J., Van Beusecum, J. P., et al. (2021). Hypertension: do inflammation and immunity hold the key to solving this epidemic? Circ. Res. 128 (7), 908–933. Epub 20210401. doi:10.1161/circresaha.121.318052
Martínez-Díaz, A. M., Palazón-Bru, A., Folgado-de la Rosa, D. M., Ramírez-Prado, D., Navarro-Juan, M., Pérez-Ramírez, N., et al. (2019). A one-year risk score to predict all-cause mortality in hypertensive inpatients. Eur. J. Intern Med. 59, 77–83. Epub 20180713. doi:10.1016/j.ejim.2018.07.010
McCarthy, C. G., Saha, P., Golonka, R. M., Wenceslau, C. F., Joe, B., and Vijay-Kumar, M. (2021). Innate immune cells and hypertension: neutrophils and neutrophil extracellular traps (NETs). Compr. Physiol. 11 (1), 1575–1589. Epub 20210212. doi:10.1002/cphy.c200020
Oparil, S., Acelajado, M. C., Bakris, G. L., Berlowitz, D. R., Cífková, R., Dominiczak, A. F., et al. (2018). Hypertension. Nat. Rev. Dis. Prim. 4, 18014. Epub 20180322. doi:10.1038/nrdp.2018.14
Pocock, S. J., McCormack, V., Gueyffier, F., Boutitie, F., Fagard, R. H., and Boissel, J. P. (2001). A score for predicting risk of death from cardiovascular disease in adults with raised blood pressure, based on individual patient data from randomised controlled trials. Bmj 323 (7304), 75–81. doi:10.1136/bmj.323.7304.75
Pradhan, A., Vishwakarma, P., Bhandari, M., Sethi, R., and Narain, V. S. (2020). Differential effects of combination of renin-angiotensin-aldosterone system inhibitors on central aortic blood pressure: a cross-sectional observational study in hypertensive outpatients. Cardiovasc Ther. 2020, 4349612. Epub 20200907. doi:10.1155/2020/4349612
Ruan, Z., Lu, T., Chen, Y., Yuan, M., Yu, H., Liu, R., et al. (2022). Association between psoriasis and nonalcoholic fatty liver disease among outpatient US adults. JAMA Dermatol 158 (7), 745–753. doi:10.1001/jamadermatol.2022.1609
Saltzgiver, S., Nielson, A., Costello, H., Baker, A., Chan, J., and Aguilar, D. (2019). Dietary determinants of metabolic syndrome parameters differ by gender in college students. Nutrients 11 (12), 2892. Epub 20191127. doi:10.3390/nu11122892
Sun, X., Luo, L., Zhao, X., and Ye, P. (2017). Controlling Nutritional Status (CONUT) score as a predictor of all-cause mortality in elderly hypertensive patients: a prospective follow-up study. BMJ Open 7 (9), e015649. Epub 20170918. doi:10.1136/bmjopen-2016-015649
Surendran, P., Drenos, F., Young, R., Warren, H., Cook, J. P., Manning, A. K., et al. (2016). Trans-ancestry meta-analyses identify rare and common variants associated with blood pressure and hypertension. Nat. Genet. 48 (10), 1151–1161. Epub 20160912. doi:10.1038/ng.3654
Tatsukawa, Y., Hsu, W. L., Yamada, M., Cologne, J. B., Suzuki, G., Yamamoto, H., et al. (2008). White blood cell count, especially neutrophil count, as a predictor of hypertension in a Japanese population. Hypertens. Res. 31 (7), 1391–1397. doi:10.1291/hypres.31.1391
Vickers, A. J., Cronin, A. M., Elkin, E. B., and Gonen, M. (2008). Extensions to decision curve analysis, a novel method for evaluating diagnostic tests, prediction models and molecular markers. BMC Med. Inf. Decis. Mak. 8, 53. Epub 20081126. doi:10.1186/1472-6947-8-53
Wang, D., Le, S., Wu, J., Xie, F., Li, X., Wang, H., et al. (2022). Nomogram for postoperative headache in adult patients undergoing elective cardiac surgery. J. Am. Heart Assoc. 11 (8), e023837. Epub 20220412. doi:10.1161/jaha.121.023837
Wang, H., Ou, Y., Fan, T., Zhao, J., Kang, M., Dong, R., et al. (2021). Development and internal validation of a nomogram to predict mortality during the ICU stay of thoracic fracture patients without neurological compromise: an analysis of the MIMIC-III clinical database. Front. Public Health 9, 818439. Epub 20211222. doi:10.3389/fpubh.2021.818439
Wang, Y., Li, J., Xia, Y., Gong, R., Wang, K., Yan, Z., et al. (2013). Prognostic nomogram for intrahepatic cholangiocarcinoma after partial hepatectomy. J. Clin. Oncol. 31 (9), 1188–1195. Epub 20130128. doi:10.1200/jco.2012.41.5984
Wu, L. D., Chu, P., Kong, C. H., Shi, Y., Zhu, M. H., Xia, Y. Y., et al. (2023). Estimated pulse wave velocity is associated with all-cause mortality and cardiovascular mortality among adults with diabetes. Front. Cardiovasc Med. 10, 1157163. Epub 20230417. doi:10.3389/fcvm.2023.1157163
Wu, L. D., Kong, C. H., Shi, Y., Zhang, J. X., and Chen, S. L. (2022b). Associations between novel anthropometric measures and the prevalence of hypertension among 45,853 adults: a cross-sectional study. Front. Cardiovasc Med. 9, 1050654. Epub 20221103. doi:10.3389/fcvm.2022.1050654
Wu, X., Zhang, J., Hu, M., Gu, L., Li, K., and Yang, X. (2022a). A nomogram for predicting in-hospital major adverse cardio- and cerebro-vascular events in patients undergoing major noncardiac surgery: a large-scale nested case-control study. Ther. Clin. Risk Manag. 18, 457–465. Epub 20220422. doi:10.2147/tcrm.S359950
Xie, G., Qi, C., Yang, W., Wang, R., Yang, L., Shang, L., et al. (2021). Competing risk nomogram predicting cancer-specific mortality for endometrial cancer patients treated with hysterectomy. Cancer Med. 10 (10), 3205–3213. Epub 20210501. doi:10.1002/cam4.3887
Yan, L., Huang, Z., Zhao, Z., Zhao, Q., Tang, Y., Zhang, Y., et al. (2022). The prognostic impact of serum uric acid on disease severity and 5-year mortality in patients with idiopathic pulmonary artery hypertension. Front. Med. (Lausanne). 9, 805415. Epub 20220126. doi:10.3389/fmed.2022.805415
Yılmaz, F., Keleş, M., and Bora, F. (2022). Relationship between the prognostic nutritional index and resistant hypertension in patients with essential hypertension. Clin. Exp. Hypertens. 44, 326–333. Epub 20220218. doi:10.1080/10641963.2022.2036995
Zhang, H., Tian, W., and Sun, Y. (2022). Development, validation, and visualization of a web-based nomogram to predict 5-year mortality risk in older adults with hypertension. BMC Geriatr. 22 (1), 392. Epub 20220504. doi:10.1186/s12877-022-03087-3
Zhou, D., Liu, X. C., Kenneth, L., Huang, Y. Q., and Feng, Y. Q. (2021). A non-linear association of triglyceride glycemic index with cardiovascular and all-cause mortality among patients with hypertension. Front. Cardiovasc Med. 8, 778038. Epub 20220127. doi:10.3389/fcvm.2021.778038
Zhu, J., Liu, X., Zhang, J., Li, J., Chen, L., Huang, C., et al. (2022a). Time-varying association between body mass index and all-cause mortality in patients with hypertension. Int. J. Obes. (Lond). 46 (2), 316–324. Epub 20211025. doi:10.1038/s41366-021-00994-0
Zhu, M., Lee, T. X. Y., Hsieh, Y. W., Lai, L. F., Condello, G., Donnelly, C. J., et al. (2022b). Vascular function in the aging human brain during muscle exertion. Aging (Albany NY) 14 (9), 3910–3920. Epub 20220502. doi:10.18632/aging.204052
Zipf, G., Chiappa, M., Porter, K. S., Ostchega, Y., Lewis, B. G., and Dostal, J. (2013). National health and nutrition examination survey: plan and operations, 1999-2010. Vital Health Stat. 1 (56), 1–37.
Keywords: nomogram, hypertension, NHANES, LASSO, mortality, machine learning
Citation: Yang L, Shen X, Seyiti Z, Tang J, Kasimujiang A, Dejite T, Zhao L, Shan X-F and Gao X-M (2023) Development and validation of a nomogram for predicting all-cause mortality in American adult hypertensive populations. Front. Pharmacol. 14:1266870. doi: 10.3389/fphar.2023.1266870
Received: 26 July 2023; Accepted: 09 November 2023;
Published: 22 November 2023.
Edited by:
Hai-Jian Sun, National University of Singapore, SingaporeReviewed by:
Xianfeng Wu, Shanghai Jiao Tong University, ChinaCopyright © 2023 Yang, Shen, Seyiti, Tang, Kasimujiang, Dejite, Zhao, Shan and Gao. This is an open-access article distributed under the terms of the Creative Commons Attribution License (CC BY). The use, distribution or reproduction in other forums is permitted, provided the original author(s) and the copyright owner(s) are credited and that the original publication in this journal is cited, in accordance with accepted academic practice. No use, distribution or reproduction is permitted which does not comply with these terms.
*Correspondence: Xue-Feng Shan, eHVlZmVuZ3NoYW5AeGptdS5lZHUuY24=; Xiao-Ming Gao, eGlhb21pbmdnYW8yMDE3QDE2My5jb20=
†These authors have contributed equally to this work
Disclaimer: All claims expressed in this article are solely those of the authors and do not necessarily represent those of their affiliated organizations, or those of the publisher, the editors and the reviewers. Any product that may be evaluated in this article or claim that may be made by its manufacturer is not guaranteed or endorsed by the publisher.
Research integrity at Frontiers
Learn more about the work of our research integrity team to safeguard the quality of each article we publish.