- 1Department of Computer Science, School of Engineering, Shantou University, Shantou, China
- 2School of Computer Science and Technology, Heilongjiang University, Harbin, China
- 3Department of Computer Science and Information Technology, La Trobe University, Melbourne, VI, Australia
- 4Center for Frontier Medical Engineering, Chiba University, Chiba, Japan
- 5School of Mathematical Science, Heilongjiang University, Harbin, China
Background: Inferring drug-related side effects is beneficial for reducing drug development cost and time. Current computational prediction methods have concentrated on graph reasoning over heterogeneous graphs comprising the drug and side effect nodes. However, the various topologies and node attributes within multiple drug–side effect heterogeneous graphs have not been completely exploited.
Methods: We proposed a new drug-side effect association prediction method, GGSC, to deeply integrate the diverse topologies and attributes from multiple heterogeneous graphs and the self-calibration attributes of each drug-side effect node pair. First, we created two heterogeneous graphs comprising the drug and side effect nodes and their related similarity and association connections. Since each heterogeneous graph has its specific topology and node attributes, a node feature learning strategy was designed and the learning for each graph was enhanced from a graph generative and adversarial perspective. We constructed a generator based on a graph convolutional autoencoder to encode the topological structure and node attributes from the whole heterogeneous graph and then generate the node features embedding the graph topology. A discriminator based on multilayer perceptron was designed to distinguish the generated topological features from the original ones. We also designed representation-level attention to discriminate the contributions of topological representations from multiple heterogeneous graphs and adaptively fused them. Finally, we constructed a self-calibration module based on convolutional neural networks to guide pairwise attribute learning through the features of the small latent space.
Results: The comparison experiment results showed that GGSC had higher prediction performance than several state-of-the-art prediction methods. The ablation experiments demonstrated the effectiveness of topological enhancement learning, representation-level attention, and self-calibrated pairwise attribute learning. In addition, case studies over five drugs demonstrated GGSC’s ability in discovering the potential drug-related side effect candidates.
Conclusion: We proposed a drug-side effect association prediction method, and the method is beneficial for screening the reliable association candidates for the biologists to discover the actual associations.
1 Introduction
Drug-related side effects are harmful outcomes that go beyond the therapeutic expectations of a drug’s application, which can result in its failure during clinical studies (Ding et al., 2018; Cakir et al., 2021; Zhang et al., 2021). Therefore, recognizing drugs’ adverse effects might help to minimize drug development cost and time (Jiang et al., 2018; Sachdev and Gupta, 2020). Computational prediction methods have proven helpful in selecting suitable drug-related side effect candidates for biological testing.
Existing studies can be grouped into three main categories. The first category uses drug-related biological data to forecast potential side effects. Francesco et al. and Wishart et al. exploited the similarity of gene expression profiles of multiple drug-treated cell lines to predict unexpected adverse drug reactions (Iorio et al., 2010; Li et al., 2016). However, these two methods are limited by unknown molecular differences (Wishart et al., 2008). Therefore, applying such methods on a large scale to predict reliable drug-related side effect candidates is difficult (Ma et al., 2003; Pauwels et al., 2011; Sawada et al., 2015).
The second category uses machine learning-based models to predict associations between drug use and adverse effects. Pauwels et al. used four machine learning methods to build prediction models: support vector machine, k-nearest neighbor (KNN), ordinary canonical correlation analysis, and sparse canonical correlation analysis (Bresso et al., 2013). A feature-derived graph regularization matrix decomposition method was proposed to predict side effects not found based on accessible drug attributes and known drug–side effect connections in medications at present (Dimitri and Lió, 2017). Decision trees and inductive logic methods were introduced by Bresso et al. (Uner et al., 2019). Zhang et al. inferred potential side effect associations for drugs using a feature selection-based multi-label KNN method (Xu et al., 2022). In addition, Cakir et al. and Dimitri et al. used random forest and Bayesian algorithms to predict drugs’ potential side effects, respectively (Seo et al., 2020; Joshi et al., 2022). However, these methods are shallow predictive models that cannot effectively learn deeper correlations between nodes.
The category uses deep learning to combine more detailed information between nodes and enhance model forecast performance. Uner et al. developed four prediction models using a multilayer perceptron (MLP), multi-modal neural networks, multi-task neural networks, and simplified molecular input line entry system convolutional neural networks, respectively (Lee et al., 2017; Zheng et al., 2019). Some studies have combined similarity data between drugs and their side effects and estimated the frequency of pharmacological side effects using deep neural (Yang et al., 2009) and graph attention neural (Luo et al., 2011; Liu et al., 2012; Mizutani et al., 2012) networks. However, these methods disregard the value of heterogeneous graphs comprising several associations between drugs and side effects when attempting to anticipate potentially important pharmacological side effects (Zhang et al., 2015; Ding et al., 2019). They proposed a graph convolutional neural network combining graph and node embedding to improve model prediction performance. In addition, adverse drug reactions have also been predicted using deep neural networks based on knowledge graph embedding (Zhang et al., 2018; Zhao et al., 2018; Hu et al., 2019). However, this approach ignores the extraction of enhanced topological representations through adversarial learning and the learning of attributes of node pairs after self-calibration.
In this study, we present a new drug-related side effect prediction method, GGSC, which learns the topological features of drug and side effect nodes enhanced by the generative and adversarial strategy and integrates the self-calibration attributes of each drug–side effect node pair. The contributions of our prediction method are listed as follows.
First, for each heterogeneous graph, a generative adversarial-based strategy is designed to learn the topological representations of the drug and side effect nodes. In this way, these representations are learned and enhanced from the whole graph perspective.
Second, the generator comprises a graph convolutional encoder and decoder to generate a false topological embedding of all the drug and side effect nodes. The encoder based on graph convolutional neural network encodes the topological structure and node attributes of each heterogeneous graph.
Third, the decoder generates the false topological embedding according to the encoded feature map. The discriminator contains multilayer perceptron to determine whether the topological embedding is the original feature one or the generated false one. The encoded topological features and node attributes of the drug and side effect nodes are enhanced by the generative and adversarial strategy.
Finally, a self-calibrating convolutional neural network (SCC)-based module is constructed to learn the attributes of each drug–side effect node pair from multiple heterogeneous graphs. More global information is obtained through greater receptive field in a small latent feature space, and it is utilized to guide the pairwise feature learning in an original feature space.
2 Materials and methods
Our primary goal is to predict a drug’s probable relevant side effects. We built a GGSC model comprising an SCC and a generative adversarial network (GAN) with a representational-level attention mechanism based on information from many sources about drugs and their adverse effects. The model comprises two branches. To thoroughly understand the topological representation of nodes, we first built two distinct bilayer heterogeneous networks based on two drug similarities, side effect similarities, and drug–side effect associations (Figure 1A). In the first branch, we learn the topological representation of network-level enhancements in the two heterogeneous graphs based on GANs. The learned topological representation is then integrated using a novel attention method, and drug–side effect node pairs are extracted to obtain association prediction scores via convolution and fully connected layers. We used an SCC to encode the specifics and characteristics of the other branch’s self-calibrated drug–side effect node pairs (Figure 2). The prediction scores of the last two branches were combined by weighting to obtain the final association score, which reflects the likelihood of the drug having the corresponding side effects.
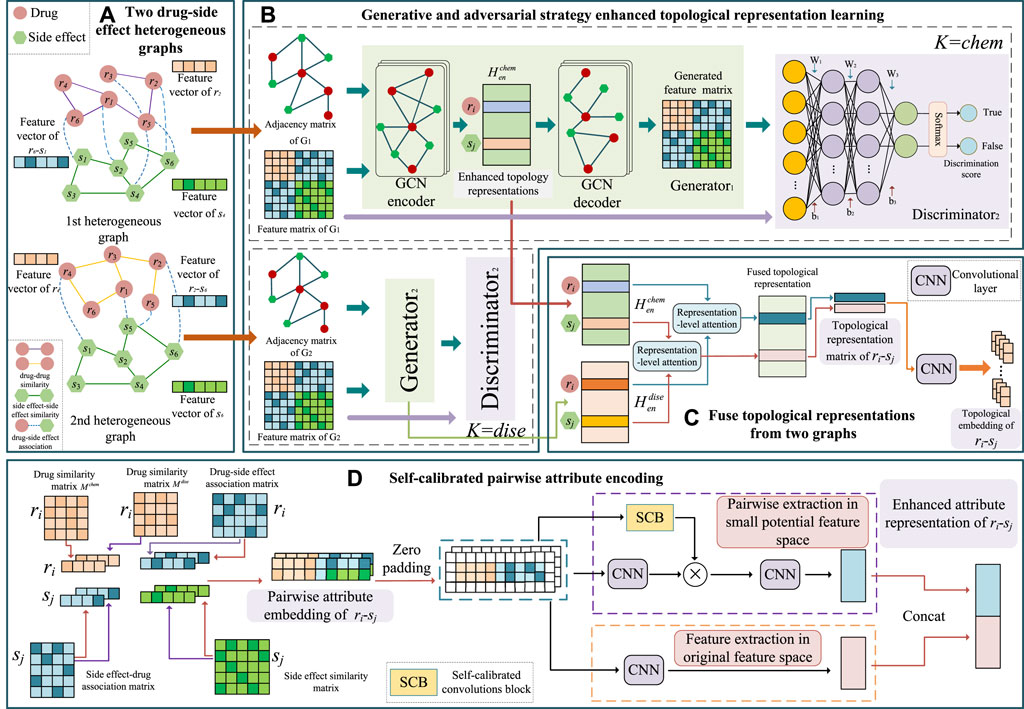
FIGURE 1. Framework of the proposed GGSC model. (A) Two drug–side effect heterogeneous graphs constructed based on two kinds of drug similarities. (B) Enhanced topological representation learning via generative and adversarial networks based on graph convolutional autoencoders. (C) Topological fusion based on representation-level attention. (D) Pairwise attribute representation learning by self-calibrated convolutional neural networks.
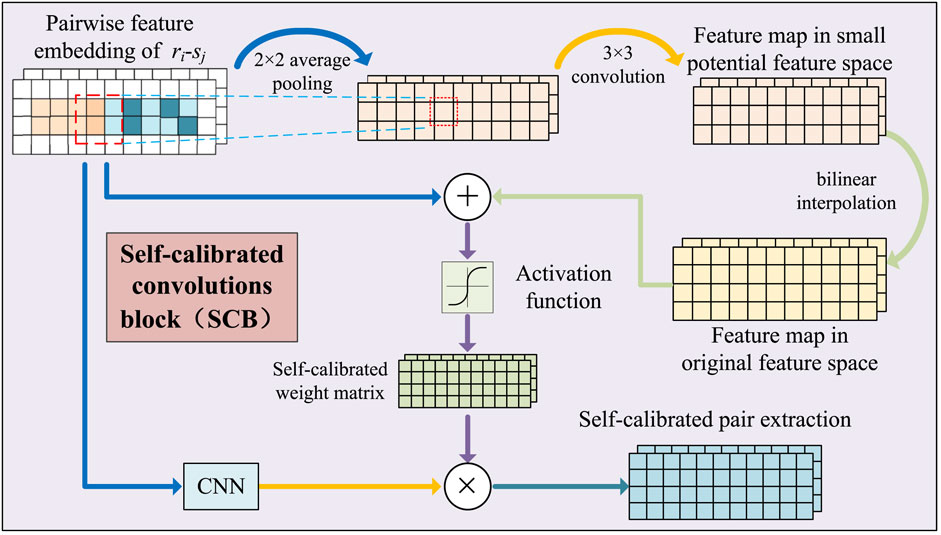
FIGURE 2. Illustration of pairwise attribute learning based on self-calibrated convolutional neural networks.
2.1 Dataset
Datasets were obtained from the work of Galeano et al. (2020), Guo et al. (2020), and Zhao et al. (2021), originally collected from the side effect resource (SIDER) and comparative toxicogenomics databases. They include drug similarities, drug–side effect associations, and drug–disease relationships. We examined 4,192 side effects from 708 drugs, representing 80,164 known pairs of associations in the SIDER database. We extracted 199,214 drug–disease pairs from the comparative toxicogenomics database, representing 708 drugs and 5,603 diseases. Drug similarity was based on chemical substructure calculations.
2.2 Matrix expressions of multi-source data about the drugs and side effects
2.2.1 Drug–side effect heterogeneous graph
Two separate drug–side effect heterogeneous graphs were created for two drugs with similar chemical properties based on chemical substructures and drug-related disorders. The two graphs are denoted as Gchem = (Vchem, Echem) and Gdise = (Vdise, Edise), where the set of nodes V = {Vm ∪ Vs} comprises the set of drug nodes Vm and the set of side effect nodes Vs. The edge set E comprises the edges between nodes, with the edges between nodes vi and vj denoted by eij ∈ E. The heterogeneous graphs Gchem and Gdise contain three edge types: drug–drug similarity linkage edges, side effect–side effect similarity linkage edges, and drug–side effect association edges.
2.2.2 Expressions of the similarities and associations among the drugs and side effects
Drug similarity matrix
Based on the drug’s chemical makeup and associated disorders, we obtained two drug similarity matrices, defined as follows,
where Nr is the number of drugs and Mk(k = chem, dise) is the degree of similarity determined based on the drug’s chemical makeup and the disease it treats.
When two drugs ri and rj have more common chemical substructures, their functions are usually more similar. Based on this biological premise, the previous methods (Liang et al., 2017; Zhao et al., 2022) calculated the drug similarities by the cosine similarity measure on their chemical substructures. When calculating Mdise, two drugs share more associated diseases and have a higher similarity. Using Wang et al.’s method, taking drugs ri and rj as an example, we first obtain the disease set
The matrix S depicts the side effect similarities.
where Ns represents the number of nodes with side effects. Side effects si and sj are more likely to be similar when they share more associated drugs. Therefore, using the technique of Wang et al., first of all, we obtained the drug sets Msi and Msj associated with side effects si and sj. Then, we calculated the similarity between the drug sets Msi and Msj, and the outcome served as a measure of how closely side effects si and sj are related. The side effect similarity matrix was then obtained. (S)ij indicates the degree of similarity between si and sj, varying from 0 to 1; the higher the value, the higher the corresponding similarity.
The matrix O represents the known relationship between a drug and a side effect.
where Nr drugs have been associated with Ns side effects based on observed drug–side effect correlations. Each row is a drug, and each column is a side effect. (O)ij is set to 1 if the drug ri is associated with the side effect sj and 0 otherwise.
To integrate the multiple associations between drug side effects, we constructed two heterogeneous graphs and denoted their adjacency matrices as Achem and Adise. We built edges based on instances of known drug–side effect correlations, connecting Nr drugs and Ns side effect nodes based on the cases of known drug–side effect relationships. When (O)ij = 1, we connect ri to sj.
where Nv denotes the total number of nodes for drugs and side effects Nv = Nr + Ns. The transposed matrix of O is defined as OT. The similarities and associations associated with a drug or side effect node can be considered its attributes. Therefore, it can be considered an attribute matrix, denoted Hk.
2.3 Network-level enhanced topological representation learning
We built a drug–side effect association prediction model with an SCC and GAN with a representation-level attention (RLA) method. Modules based on GAN and SCC are used to learn the topological representation of network-level enhancements in drug–side effect heterogeneous graphs and the self-calibrated node–pair attribute representation, respectively.
2.3.1 Enhanced topological representation learning based on GAN
Given two drug–side effects heterogeneous graphs, each network has its own unique characteristics, and we suggest an independent graph convolutional generation adversarial learning technique to individually encode the topological information of each heterogeneous graph. The module comprises the generator G and the discriminator D (Figure 1B). Adversarial learning between generators and discriminators forms a topological representation. Since the learning strategies are similar for drug–side effect heterogeneous graphs Gchem and Gdise, we describe Gchem as an example.
Generators based on graph convolutional selfencoders
We consider the attribute matrix
Encoder
First, Achem is an adjacency matrix with node self-connections.
where
where L ∈ [2, Len], where Len represents the overall number of coding layers, and φ represents the rectified linear unit (ReLU), the activation function. The weight matrices for the first and L-th layer graph convolution encoders are denoted
Decoder
Decoder is a graph convolutional neural network-based framework for reconstructing the original matrix of drug side effect nodes. We mapped the topology representation back to the original space using a decoder. We then calculated the loss between the reconstructed matrix
where
Discriminator based on MLP
The original matrix Hchem and the reconstructed matrix
where LD is the total number of hidden layers in the discriminator,
Optimization
The optimization goal of learning topological representation based on GANs is that the generator generates a reconstruction matrix as close to the original matrix as possible, the discriminator more accurately distinguishes the original matrix from the reconstruction matrix, and both form an adversarial relationship. Their optimization functions are as follows:
where E represents the expectation and Pdata represents the probability distribution of nodes in the original and reconstructed matrices. By maximizing the loss from the discriminator and minimizing the loss from the generator, they can achieve adversity with shared loss. The first expectation
2.3.2 Attention mechanism at the representation level
Given the topological representation matrices
where
Similarly, each feature of the vector
where βij is the normalized attention weight of
Therefore, the feature vector vi obtained by augmenting the node with the attention mechanism can be expressed as hi.
where “⊗” represents the element-by-element product operator. We perform an attention fusion operation on the feature vectors of each node in
We obtain the topological representation Ztopo of ri-sj by convolving Xtopo fed into the two convolution-pooling layers.
2.4 Pairwise attribute learning based on self-calibrated convolutional neural networks
2.4.1 Embedding construction of a pair of drug and side effect nodes
Given the similarity of the two drugs, we propose a strategy to form an embedding of the nodes’ attributes. The embedding process is depicted in Figure 1D using the example of ri and sj. Given the matrices Mchem, S, and O, we first splice the i-th row
where
Then, the j-th row
where
Similarly, given a drug similarity matrix Mdise, a side effect similarity matrix S, and a drug–side effect association matrix O, a second ri-sj pairwise attribute embedding matrix
2.4.2 Self-calibrated pairwise attribute learning
For a pair of drug and side effect nodes, such as the drug ri and the side effect sj, each feature of the node pair has the context relationship with the features around it. To capture the context relationship, a self-calibrated convolution-based attribute learning module was constructed. The module obtained the attribute embedding in a small latent space by utilizing convolution with larger receptive fields, and then, the embedding was used to guide the pairwise attribute learning in the original features space.
Xatt undergoes average pooling to form a low-dimensional embedding of node pairs L.
The feature transformation of L uses convolution operations.
where B[⋅] is a bilinear interpolation operation that maps the convolved feature map from the latent space back to the original space, “*” represents the convolution process, and φ represents the activation function ReLU. WL and bL represent the weight matrix and deviation vector, respectively. The feature graph
where σ is the activation function. ⊕ and ⊗ represent the element-by-element addition and multiplication operations, respectively. Ycal passes through a convolution-pooling layer to deeply fuse the calibrated features to form Yatt.
The original feature embedding Xatt is convolved to form the original feature graph, comprising the original feature information. Xatt is not padded to preserve and learn its edge information, and Yori is obtained after two convolutional layers. Finally, Yatt and Yori are joined to form the calibrated ri − sj attribute embedding matrix Zatt.
2.5 Final fusion and loss function
The learned topological representation Ztopo is first flattened into a vector ztopo and fed into the fully connected layer and soft max layer to obtain the association probability distribution of the drug ri and the side effect sj.
where Wtopo and btopo are the weight matrix and deviation vector, respectively, and soft max is the activation function. In
where T is a collection of training samples and ylabel is the actual association between the nodes. ylabel equals 1 if ri is known to be associated with sj and 0 otherwise.
The self-calibrating pairwise property representation Zatt is flattened into a vector zatt and fed into the fully connected and soft max layers. This module’s prediction score scoreatt and the loss function lossatt are defined as follows:
where
where hyperparameter λ(λ ∈ [0, 1]) is used to moderate the extent to which scoretopo and scoreatt contribute to the final score.
3 Experimental evaluations and discussion
3.1 Evaluation metrics and parameter settings
The prediction performance of our model and other comparator models was assessed through five-fold cross validation. If a drug was observed to associate with a side effect by the biological experiments, the drug–side effect node pair may be regarded as a positive sample. On the other hand, all the unobserved drug–side effect node pairs are the negative samples. The number of positive samples and that of negative samples are 80,164 and 2,887,772, respectively, and their ratio is about 1:36. Thus, there is serious class imbalance for the positive samples and the negative ones. Five subsets of positive samples—four used for training and one for testing—were created by randomly equalizing all positive example samples. The same number of negative samples as the positive samples was selected for training, with the remainder used for testing.
The measures used in the evaluation process included the area under the receiver operating characteristic (ROC) curve (AUC), the area under the precision-recall curve (AUPR), and the recall rate for the top k candidates. The AUC is widely used to assess the performance of prediction models. Since there are much fewer negative than positive samples and the distribution is imbalanced, AUPR is more informative than AUC and helps assess the model’s performance. We separately calculated the AUC and AUPR of each fold during cross validation, and the final findings were calculated using the five-fold cross validation’s average AUC and AUPR. Typically, biologists choose the best candidates for additional validation. Therefore, we calculated the recall of the top k candidates (k ∈ [30, 60, … , 240]); the higher the recall, the more positive samples the prediction model correctly identifies.
The filter size within all the convolutional operations and the window size are 2 × 2. The GCN encoder has two encoding layers, and their feature dimensions are 2,500 and 1,500, respectively. The feature dimensions of the two decoding layers in the GCN decoder are set to 2,500 and 4,900, respectively. The dimensions of two hidden layers in the discriminator are 2,500 and 1,200. The topology representation fusion module contains two convolutional layers which have 16 and 32 filters. In the self-calibrated convolutional module, for the small feature space, the two convolutional layers have 1 and 32 filters, respectively. In terms of original feature space, the numbers of filters are 16 and 32, respectively. GGSC was developed on the PyTorch framework, and the server has a Nvidia GeForce GTX 2080Ti graphic card with 11 GB graphic memory.
3.2 Comparison with other methods
Six cutting-edge approaches for predicting pharmacological side effects were compared with GGSC, graph convolutional network-based risk stratification (GCRS), SDPred, Galeaon’s method, random walk on a signed heterogeneous information network (RW-SHIN), Ding’s method, and feature-derived graph regularized matrix factorization (FGRMF). In the cross-validation process, GGSC uses the same training and test sets as all comparison methods to compare the results more convincingly.
The average ROC and precision–recall (PR) curves for all methods using 708 drugs are shown in Figure 3. The average AUC of 0.969 of our GGSC model was 1.2% higher than that of the suboptimal GCRS, 2.3% higher than that of SDPred, 5.7% higher than Galeon’s method, 7.7% higher than RW-SHIN, 2.4% higher than Ding’s method, and 5.0% higher than FGRMF, respectively. Using 708 drugs, GGSC had the highest mean AUPR of 0.340, 6.8%, 11.4%, 20.9%, 24.1%, 14.9%, and 16.1% higher than GCRS, SDPred, and other methods, respectively.
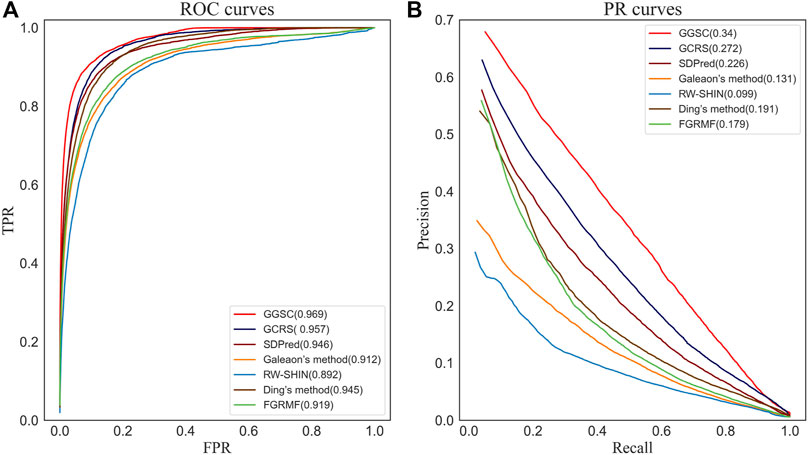
FIGURE 3. ROC curves and PR curves of our method and the compared methods for drug-side effect association prediction. (A) ROC curves (B) PR curves.
After five-fold cross validation, we could obtain the average AUC and AUPR for each of the 708 drugs. We performed a Wilcoxon test on the 708 AUCs and AUPRs to determine whether performance differed significantly among methods (Table 1). These results showed that our method GGSC significantly outperformed the other prediction methods, when the p-value is always less than 0.05.

TABLE 1. Results of the paired Wilcoxon test on the AUCs and AUPRs over all the 708 drugs by comparing GGSC and other methods.
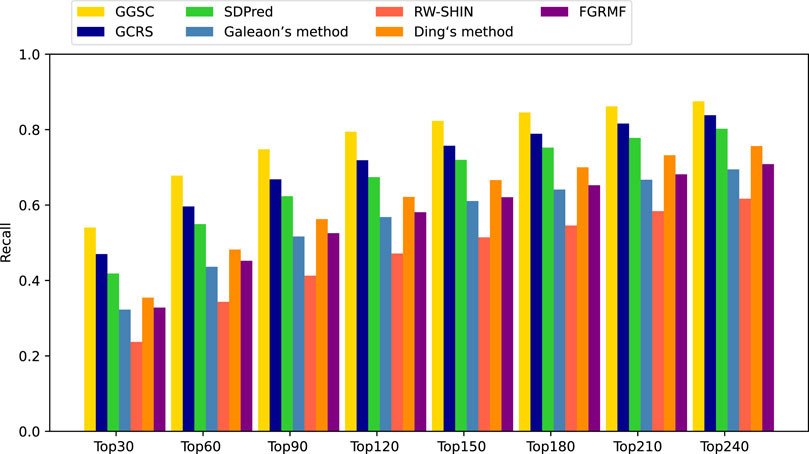
Among the compared methods, our GGSC method performed best, followed by GCRS. SDPred and Ding’s method integrate multiple drug similarities but ignore the heterogeneous graph’s topological information, so they do not perform as well as our GGSC method. FGRMF and Galeaon’s method are shallow prediction models that use matrix decomposition to predict drug-related side effects, which cannot effectively learn the deep associations between drug and side effect nodes, resulting in slightly worse performance. These findings show that RW-SHIN performs worse than other methods because it learns the topological information of medication nodes but not of side effect nodes. GGSC method’s better performance is mainly attributed to adversarial learning to obtain topological information and self-calibration learning to obtain node–pair properties. A higher recall of the top k candidate drug–side effect associations indicates that more true associations are correctly identified. Figure 4 shows that the GGSC method had consistently higher recall than the other methods for different values of k. When considering k = 30, GGSC had the highest recall (52.5%) and GCRS the second highest (47.0%).
Other methods had recall rates of 41.8%, 32.2%, 23.7%, 35.4%, and 32.8%, respectively. GGSC still performed best at values of k of 60, 90, and 120, with recall rates of 64.6%, 70.9%, and 75.2%, respectively. The second best performing method was GCRS, with recall rates of 59.6%, 66.8%, and 71.8%, respectively. The third best performing method was SDPred, with recall rates of 54.9%, 62.3%, and 67.4%, respectively. Ding’s method (48.1%, 56.2%, and 62.1%, respectively) and FGRMF (45.2%, 52.5%, and 58.1%, respectively) consistently outperformed Galeaon’s method (43.6%, 51.6%, and 56.8%, respectively). RW-SHIN consistently performed the worst, with recall rates of 34.3%, 41.2%, and 47.1%, respectively.
3.3 Ablation studies
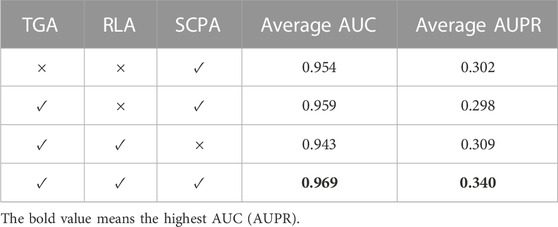
We performed ablation experiments to confirm the contributions of the main innovations, including topological representation learning based on generative adversarial (TGA), RLA, and self-calibrated pairwise attribute (SCPA) learning (Table 2). The complete model, GGSC with TGA, RLA, and SCPA, performed best, with an AUC of 0.969 and AUPR of 0.340. For the model without TGA, the AUC and AUPR decreased by 1.5% and 3.8%, respectively, compared to the full model. These results show that topological representation learning helps to improve the model’s prediction performance. For the model without RLA, the AUC and AUPR fell by 1.0% and 4.2%, respectively, compared to the full model. The possible reason is that RLA assigns more weight to topological representations that are more informative, which helps the model capture more important features. For the model without SCPA, the AUC and AUPR declined by 2.6% and 3.1%, respectively, compared to the full prediction model. The main reason was that self-calibration enables learning more comprehensive information about the nodes’ neighboring nodes. This analysis demonstrates the respective contributions of TGA, RLA, and SCPA. The ablation experiment results show that SCPA learning provided the greatest enhancement to the drug–side effect association prediction model.
3.4 Case studies on five drugs and prediction of novel drug-related side effects
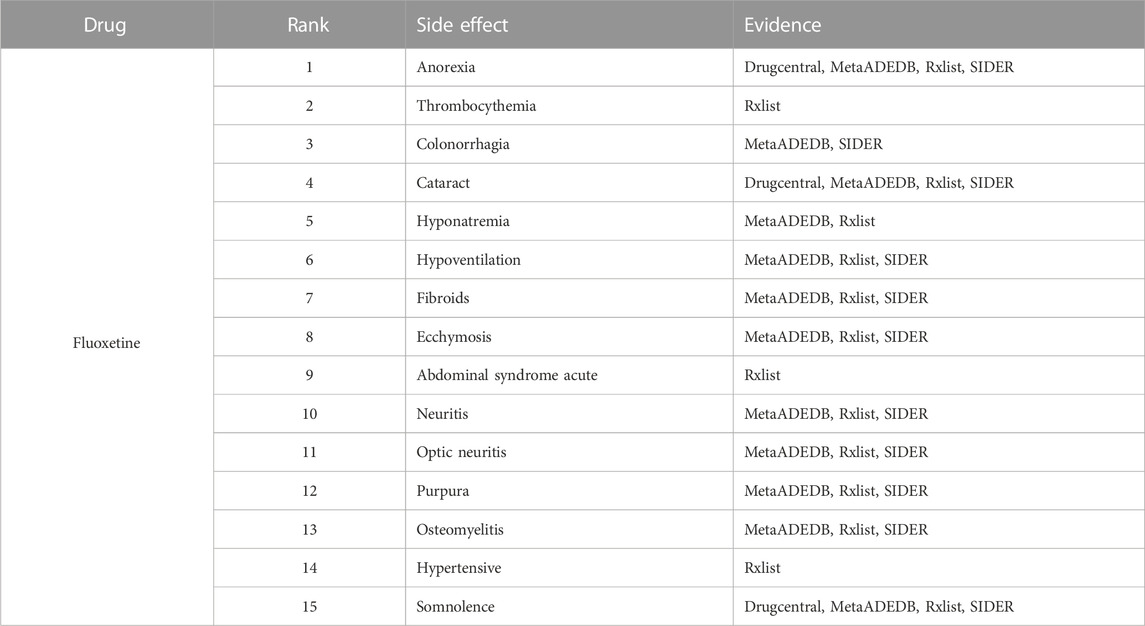
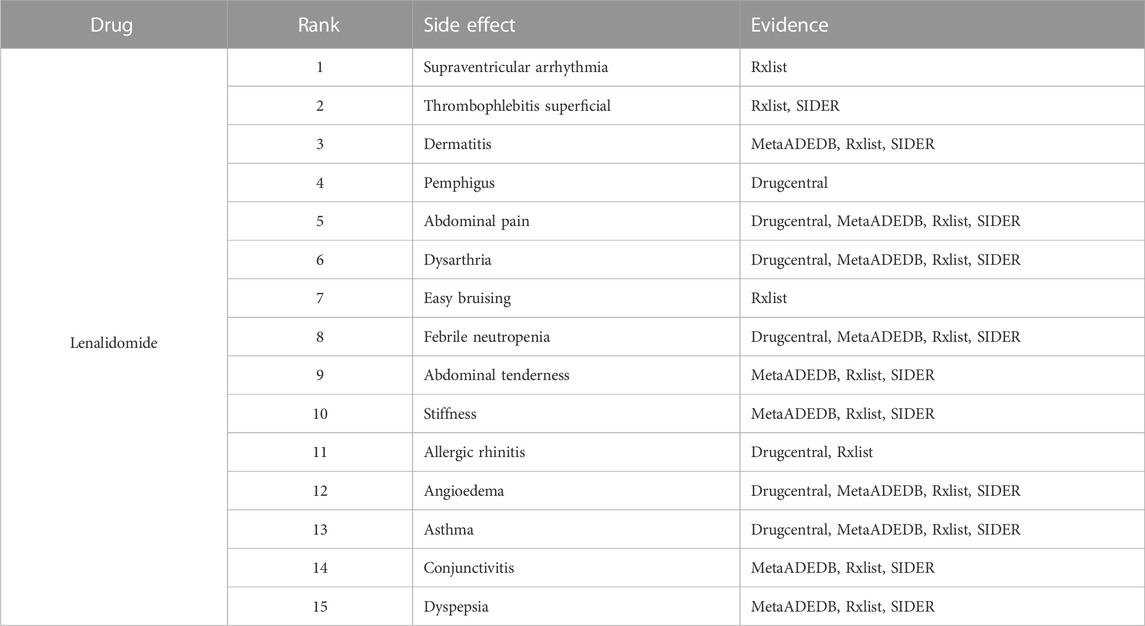
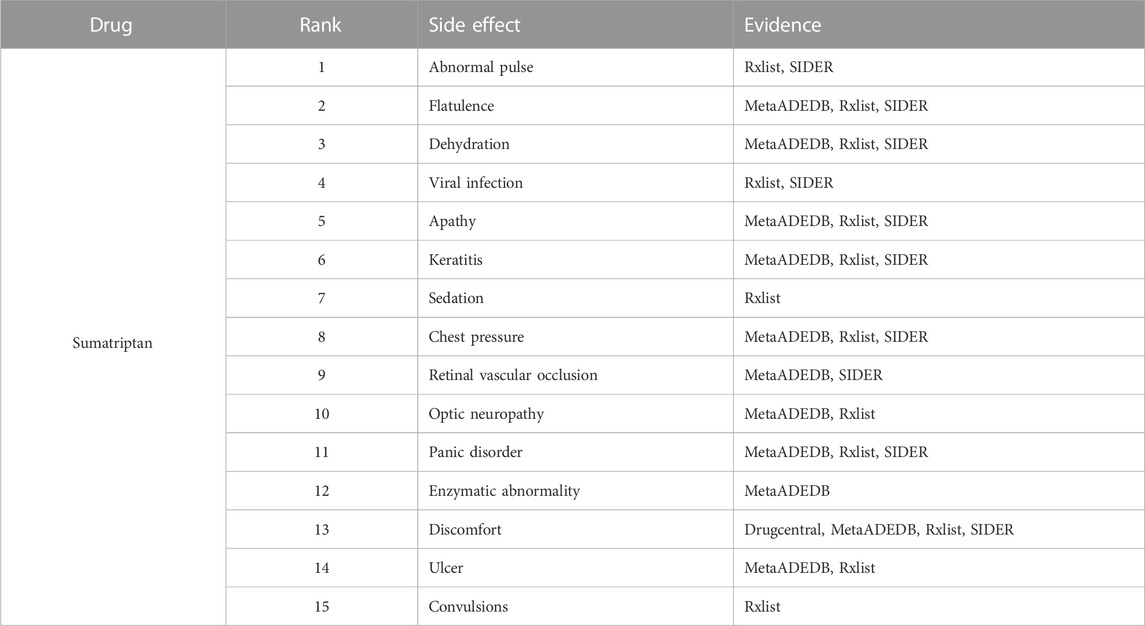
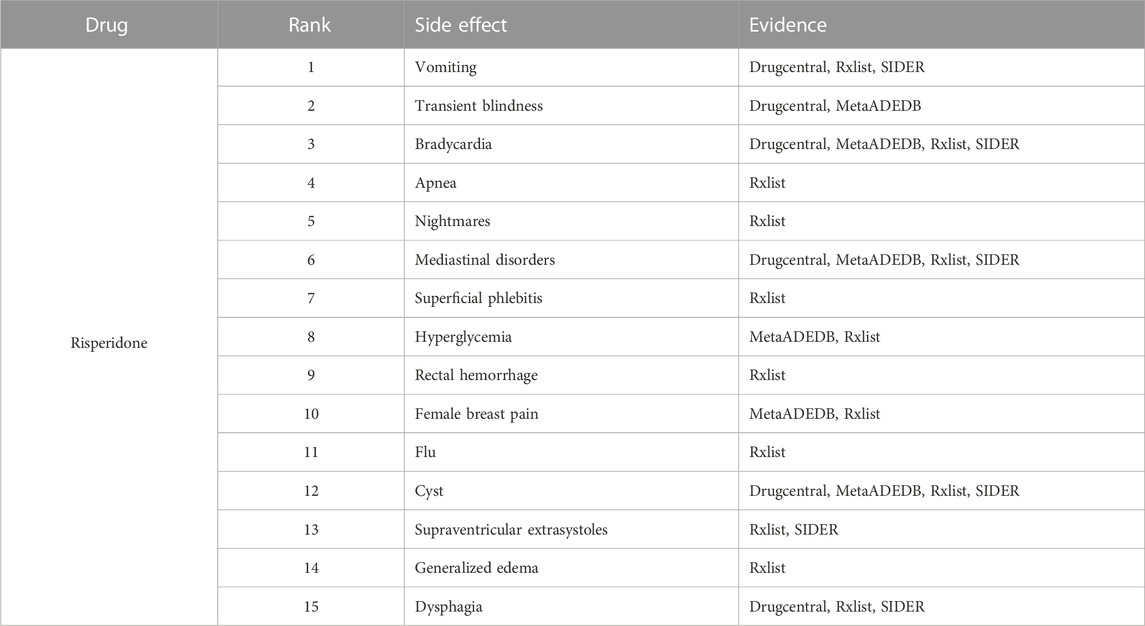
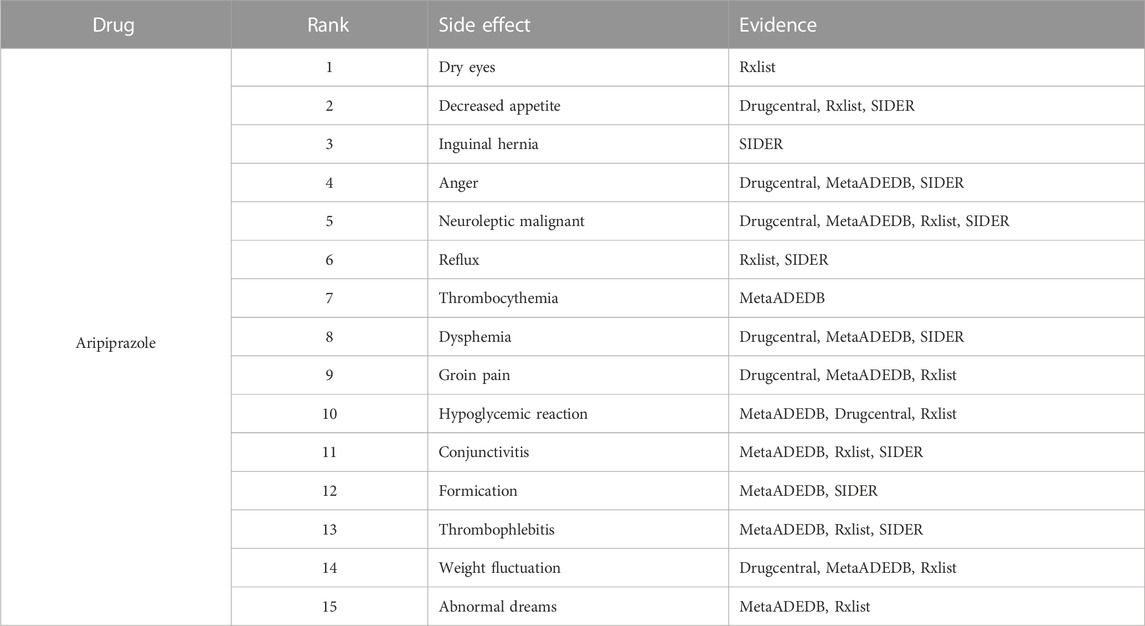
To further demonstrate our GGSC model’s ability to detect potentially relevant pharmacological adverse effects, we conducted case studies on five drugs: fluoxetine, lenalidomide, sumatriptan, risperidone, and aripiprazole. We obtained the drug’s associated candidate side effects and corresponding association scores, and all candidates were sorted in descending order. Tables 3–7 list the top 15 probable side effects for each of these five drugs.
Online database MetaADEDB containing comprehensive information on adverse drug events (ADEs), covering 744,709 associations between 8,498 drugs and 13,193 ADEs confirmed by clinical trials (Kuhn et al., 2016; Luo et al., 2017; Xuan et al., 2022). DrugCentral contains 4,927 drugs approved by regulatory authorities such as the European Medicines Agency, providing a resource for information on ADEs, indications, and more (Nair and Hinton, 2010; Wang et al., 2010; Davis et al., 2021). RxList contains information on drug descriptions and side effects in physicians’ articles and authoritative websites and supports
Following a thorough evaluation of the GGSC model’s performance, we used the training model to forecast 708 potential drug-associated side effects. Supplementary Table ST1 lists the top 30 potential side effects for each drug predicted by our model to aid biologists in their ongoing efforts to identify new side effects for drugs through biological testing.
4 Conclusion
We proposed a method to encode and fuse multiple types of similarities and associations from multiple heterogeneous graphs to predict drug-related candidate side effects. The constructed two drug–side effect heterogeneous graphs facilitate the formation of their specific topological embeddings based on the generative and adversarial strategy. The generator and the discriminator were constructed based on graph convolutional autoencoder and MLP, and then, the enhanced topological representations of the drug and side effect nodes were learned. The representation level attention was designed to assign higher weights to those more important topological representations. In the constructed self-calibrated convolutional neural network module, the pairwise features extracted from the small latent feature space are able to guide the feature learning in the original feature space. The cross-validation experimental results indicated that GGSC outperformed the compared prediction models in terms of both AUC and AUPR. Additionally, GGSC retrieved more realistic drug–side effect associations in the top-ranked candidate list, which makes it be more attractive to the biologists. GGSC’s ability in discovering the potential drug–side effect association candidates was further shown through case studies on five drug-related candidates.
Data availability statement
The original contributions presented in the study are included in the article/Supplementary Material; further inquiries can be directed to the corresponding author.
Author contributions
PX: writing–original draft and methodology. KX: writing–original draft and software. HC: writing–review and editing. TN: writing–review and editing, supervision, and validation. TZ: writing–review and editing, methodology, and supervision.
Funding
The authors declare that financial support was received for the research, authorship, and/or publication of this article. This work was supported by the Natural Science Foundation of China (61972135 and 62172143), STU Scientific Research Initiation Grant (NTF22032), and the Natural Science Foundation of Heilongjiang Province (LH2023F044).
Conflict of interest
The authors declare that the research was conducted in the absence of any commercial or financial relationships that could be construed as a potential conflict of interest.
Publisher’s note
All claims expressed in this article are solely those of the authors and do not necessarily represent those of their affiliated organizations, or those of the publisher, the editors, and the reviewers. Any product that may be evaluated in this article, or claim that may be made by its manufacturer, is not guaranteed or endorsed by the publisher.
Supplementary material
The Supplementary Material for this article can be found online at: https://www.frontiersin.org/articles/10.3389/fphar.2023.1257842/full#supplementary-material
References
Avram, S., Bologa, C. G., Holmes, J., Bocci, G., Wilson, T. B., Nguyen, D.-T., et al. (2021). Drugcentral 2021 supports drug discovery and repositioning. Nucleic acids Res. 49, D1160–D1169. doi:10.1093/nar/gkaa997
Bresso, E., Grisoni, R., Marchetti, G., Karaboga, A. S., Souchet, M., Devignes, M.-D., et al. (2013). Integrative relational machine-learning for understanding drug side-effect profiles. BMC Bioinforma. 14, 207–211. doi:10.1186/1471-2105-14-207
Cakir, A., Tuncer, M., Taymaz-Nikerel, H., and Ulucan, O. (2021). Side effect prediction based on drug-induced gene expression profiles and random forest with iterative feature selection. Pharmacogenomics J. 21, 673–681. doi:10.1038/s41397-021-00246-4
Davis, A. P., Grondin, C. J., Johnson, R. J., Sciaky, D., Wiegers, J., Wiegers, T. C., et al. (2021). Comparative toxicogenomics database (ctd): update 2021. Nucleic Acids Res. 49, D1138–D1143. doi:10.1093/nar/gkaa891
Dimitri, G. M., and Lió, P. (2017). Drugclust: a machine learning approach for drugs side effects prediction. Comput. Biol. Chem. 68, 204–210. doi:10.1016/j.compbiolchem.2017.03.008
Ding, Y., Tang, J., and Guo, F. (2019). Identification of drug-side effect association via multiple information integration with centered kernel alignment. Neurocomputing 325, 211–224. doi:10.1016/j.neucom.2018.10.028
Ding, Y., Tang, J., and Guo, F. (2018). Identification of drug-side effect association via semisupervised model and multiple kernel learning. IEEE J. Biomed. Health Inf. 23, 2619–2632. doi:10.1109/JBHI.2018.2883834
Galeano, D., Li, S., Gerstein, M., and Paccanaro, A. (2020). Predicting the frequencies of drug side effects. Nat. Commun. 11, 4575. doi:10.1038/s41467-020-18305-y
Guo, X., Zhou, W., Yu, Y., Ding, Y., Tang, J., and Guo, F. (2020). A novel triple matrix factorization method for detecting drug-side effect association based on kernel target alignment. BioMed Res. Int. 2020, 4675395. doi:10.1155/2020/4675395
Hajian-Tilaki, K. (2013). Receiver operating characteristic (roc) curve analysis for medical diagnostic test evaluation. Casp. J. Intern. Med. 4, 627–635.
Hu, B., Wang, H., and Yu, Z. (2019). Drug side-effect prediction via random walk on the signed heterogeneous drug network. Molecules 24, 3668. doi:10.3390/molecules24203668
Iorio, F., Bosotti, R., Scacheri, E., Belcastro, V., Mithbaokar, P., Ferriero, R., et al. (2010). Discovery of drug mode of action and drug repositioning from transcriptional responses. Proc. Natl. Acad. Sci. 107, 14621–14626. doi:10.1073/pnas.1000138107
Jiang, H., Qiu, Y., Hou, W., Cheng, X., Yim, M. Y., and Ching, W.-K. (2018). Drug side-effect profiles prediction: from empirical to structural risk minimization. IEEE/ACM Trans. Comput. Biol. Bioinforma. 17, 402–410. doi:10.1109/TCBB.2018.2850884
Joshi, P., Masilamani, V., and Mukherjee, A. (2022). A knowledge graph embedding based approach to predict the adverse drug reactions using a deep neural network. J. Biomed. Inf. 132, 104122. doi:10.1016/j.jbi.2022.104122
Kuhn, M., Letunic, I., Jensen, L. J., and Bork, P. (2016). The sider database of drugs and side effects. Nucleic Acids Res. 44, D1075–D1079. doi:10.1093/nar/gkv1075
Lee, W.-P., Huang, J.-Y., Chang, H.-H., Lee, K.-T., and Lai, C.-T. (2017). Predicting drug side effects using data analytics and the integration of multiple data sources. IEEE Access 5, 20449–20462. doi:10.1109/access.2017.2755045
Li, J., Zheng, S., Chen, B., Butte, A. J., Swamidass, S. J., and Lu, Z. (2016). A survey of current trends in computational drug repositioning. Briefings Bioinforma. 17, 2–12. doi:10.1093/bib/bbv020
Liang, X., Zhang, P., Yan, L., Fu, Y., Peng, F., Qu, L., et al. (2017). Lrssl: predict and interpret drug–disease associations based on data integration using sparse subspace learning. Bioinformatics 33, 1187–1196. doi:10.1093/bioinformatics/btw770
Liu, M., Wu, Y., Chen, Y., Sun, J., Zhao, Z., Chen, X.-w., et al. (2012). Large-scale prediction of adverse drug reactions using chemical, biological, and phenotypic properties of drugs. J. Am. Med. Inf. Assoc. 19, e28–e35. doi:10.1136/amiajnl-2011-000699
Luo, H., Chen, J., Shi, L., Mikailov, M., Zhu, H., Wang, K., et al. (2011). Drar-cpi: a server for identifying drug repositioning potential and adverse drug reactions via the chemical–protein interactome. Nucleic Acids Res. 39, W492–W498. doi:10.1093/nar/gkr299
Luo, Y., Zhao, X., Zhou, J., Yang, J., Zhang, Y., Kuang, W., et al. (2017). A network integration approach for drug-target interaction prediction and computational drug repositioning from heterogeneous information. Nat. Commun. 8, 573. doi:10.1038/s41467-017-00680-8
Ma, X.-J., Salunga, R., Tuggle, J. T., Gaudet, J., Enright, E., McQuary, P., et al. (2003). Gene expression profiles of human breast cancer progression. Proc. Natl. Acad. Sci. 100, 5974–5979. doi:10.1073/pnas.0931261100
Mizutani, S., Pauwels, E., Stoven, V., Goto, S., and Yamanishi, Y. (2012). Relating drug–protein interaction network with drug side effects. Bioinformatics 28, i522–i528. doi:10.1093/bioinformatics/bts383
Nair, V., and Hinton, G. E. (2010). “Rectified linear units improve restricted boltzmann machines,” in Proceedings of the 27th international conference on machine learning (ICML-10), 807–814.
Pauwels, E., Stoven, V., and Yamanishi, Y. (2011). Predicting drug side-effect profiles: a chemical fragment-based approach. BMC Bioinforma. 12, 169–213. doi:10.1186/1471-2105-12-169
Sachdev, K., and Gupta, M. K. (2020). A comprehensive review of computational techniques for the prediction of drug side effects. Drug Dev. Res. 81, 650–670. doi:10.1002/ddr.21669
Saito, T., and Rehmsmeier, M. (2015). The precision-recall plot is more informative than the roc plot when evaluating binary classifiers on imbalanced datasets. PloS one 10, e0118432. doi:10.1371/journal.pone.0118432
Sawada, R., Iwata, H., Mizutani, S., and Yamanishi, Y. (2015). Target-based drug repositioning using large-scale chemical–protein interactome data. J. Chem. Inf. Model. 55, 2717–2730. doi:10.1021/acs.jcim.5b00330
Seo, S., Lee, T., Kim, M.-h., and Yoon, Y. (2020). Prediction of side effects using comprehensive similarity measures. BioMed Res. Int. 2020, 1357630. doi:10.1155/2020/1357630
Steigerwalt, K. (2015). Online drug information resources. Choice (Chicago, Ill.) 52, 1601–1611. doi:10.5860/choice.52.10.1601
Uner, O. C., Gokberk Cinbis, R., Tastan, O., and Cicek, A. E. (2019). Deepside: a deep learning framework for drug side effect prediction. Biorxiv, 843029. doi:10.1109/TCBB.2022.3141103
Wang, D., Wang, J., Lu, M., Song, F., and Cui, Q. (2010). Inferring the human microrna functional similarity and functional network based on microrna-associated diseases. Bioinformatics 26, 1644–1650. doi:10.1093/bioinformatics/btq241
Wishart, D. S., Knox, C., Guo, A. C., Cheng, D., Shrivastava, S., Tzur, D., et al. (2008). Drugbank: a knowledgebase for drugs, drug actions and drug targets. Nucleic acids Res. 36, D901–D906. doi:10.1093/nar/gkm958
Xu, X., Yue, L., Li, B., Liu, Y., Wang, Y., Zhang, W., et al. (2022). Dsgat: predicting frequencies of drug side effects by graph attention networks. Briefings Bioinforma. 23, bbab586. doi:10.1093/bib/bbab586
Xuan, P., Wang, M., Liu, Y., Wang, D., Zhang, T., and Nakaguchi, T. (2022). Integrating specific and common topologies of heterogeneous graphs and pairwise attributes for drug-related side effect prediction. Briefings Bioinforma. 23, bbac126. doi:10.1093/bib/bbac126
Yang, L., Chen, J., and He, L. (2009). Harvesting candidate genes responsible for serious adverse drug reactions from a chemical-protein interactome. PLoS Comput. Biol. 5, e1000441. doi:10.1371/journal.pcbi.1000441
Yu, Z., Wu, Z., Li, W., Liu, G., and Tang, Y. (2021). Metaadedb 2.0: a comprehensive database on adverse drug events. Bioinformatics 37, 2221–2222. doi:10.1093/bioinformatics/btaa973
Zhang, F., Sun, B., Diao, X., Zhao, W., and Shu, T. (2021). Prediction of adverse drug reactions based on knowledge graph embedding. BMC Med. Inf. Decis. Mak. 21, 38–11. doi:10.1186/s12911-021-01402-3
Zhang, W., Liu, F., Luo, L., and Zhang, J. (2015). Predicting drug side effects by multi-label learning and ensemble learning. BMC Bioinforma. 16, 1–11. doi:10.1186/s12859-015-0774-y
Zhang, W., Liu, X., Chen, Y., Wu, W., Wang, W., and Li, X. (2018). Feature-derived graph regularized matrix factorization for predicting drug side effects. Neurocomputing 287, 154–162. doi:10.1016/j.neucom.2018.01.085
Zhao, H., Wang, S., Zheng, K., Zhao, Q., Zhu, F., and Wang, J. (2022). A similarity-based deep learning approach for determining the frequencies of drug side effects. Briefings Bioinforma. 23, bbab449. doi:10.1093/bib/bbab449
Zhao, H., Zheng, K., Li, Y., and Wang, J. (2021). A novel graph attention model for predicting frequencies of drug–side effects from multi-view data. Briefings Bioinforma. 22, bbab239. doi:10.1093/bib/bbab239
Zhao, X., Chen, L., and Lu, J. (2018). A similarity-based method for prediction of drug side effects with heterogeneous information. Math. Biosci. 306, 136–144. doi:10.1016/j.mbs.2018.09.010
Keywords: graph generative and adversarial strategy, topologies and attributes from heterogeneous graphs, graph convolutional autoencoder, self-calibrated pairwise attributes, representation-level attention
Citation: Xuan P, Xu K, Cui H, Nakaguchi T and Zhang T (2023) Graph generative and adversarial strategy-enhanced node feature learning and self-calibrated pairwise attribute encoding for prediction of drug-related side effects. Front. Pharmacol. 14:1257842. doi: 10.3389/fphar.2023.1257842
Received: 13 July 2023; Accepted: 17 August 2023;
Published: 04 September 2023.
Edited by:
Thomas Hartung, Johns Hopkins University, United StatesReviewed by:
Wen Zhang, Huazhong Agricultural University, ChinaLi Peng, Shanxi Agricultural University, China
Copyright © 2023 Xuan, Xu, Cui, Nakaguchi and Zhang. This is an open-access article distributed under the terms of the Creative Commons Attribution License (CC BY). The use, distribution or reproduction in other forums is permitted, provided the original author(s) and the copyright owner(s) are credited and that the original publication in this journal is cited, in accordance with accepted academic practice. No use, distribution or reproduction is permitted which does not comply with these terms.
*Correspondence: Tiangang Zhang, emhhbmdAaGxqdS5lZHUuY24=
 Ping Xuan
 Kai Xu2
 Hui Cui