 Bole Li
 Shan Liu2
 Chunnuan Wu
94% of researchers rate our articles as excellent or good
Learn more about the work of our research integrity team to safeguard the quality of each article we publish.
Find out more
ORIGINAL RESEARCH article
Front. Pharmacol., 22 November 2023
Sec. Drug Metabolism and Transport
Volume 14 - 2023 | https://doi.org/10.3389/fphar.2023.1234262
Backgrounds: Brain metastases occur in approximately 30% of patients with non-small-cell lung cancer (NSCLC). Therefore, the free drug concentration in cerebrospinal fluid (CSF) is strongly associated with the clinical efficacy.
Purpose: The present study aimed to develop physiologically based pharmacokinetic (PBPK) models that can predict the steady-state trough concentration (Ctrough) in plasma and CSF, as well as anaplastic lymphoma kinase (ALK) occupancy (AO), for three inhibitors: crizotinib (CRI), alectinib (ALE), and lorlatinib (LOR).
Methods: To achieve this, population PBPK models were successfully developed and validated using multiple clinical pharmacokinetics (PK) and drug–drug interaction (DDI) studies, both in healthy subjects and patients.
Results: The prediction-to-observation ratios for plasma AUC, Cmax, and Ctrough in heathy subjects and patients ranged between 0.5 and 2.0. In addition, PK profiles of CRI, ALE, and LOR in CSF aligned well with observed data. Moreover, the AUC and Cmax ratios of the three inhibitors when co-administered with CYP3A4 inhibitors/inducers also matched with clinically observed values. Utilizing PK thresholds for effective plasma Ctrough and AO values on wild-type and four ALK mutations in plasma and CSF, PBPK models were then combined with the mean and 95% confidence interval to predict optimal dosing regimens.
Conclusions: Overall, these PBPK models provide valuable insights into determining appropriate dosing regimens for the three ALK inhibitors, understanding their effectiveness in brain metastasis therapy, and analyzing the underlying mechanisms of on-target resistance.
Lung cancer is the leading cause of global cancer-related deaths, accounting for approximately 18.4% of all cancer mortality worldwide in 2018 (Thandra et al., 2021). Non-small-cell lung cancer (NSCLC) constitutes more than 80% of all lung cancer cases (Fujimoto et al., 2019). The anaplastic lymphoma kinase (ALK) gene was first identified as a lung oncogene in 2007 (Lei et al., 2022). The reported incidence of ALK-positive NSCLC ranges from 3% to 7% (Gower et al., 2020). A clinical study has demonstrated that cancer cells carrying an ALK rearrangement (ALK-positive) are sensitive to ALK inhibition (Shaw et al., 2011). In addition, brain metastases have been reported to occur in approximately 30%–40% of ALK-positive NSCLC patients (Zou et al., 2022).
Crizotinib (CRI) is a first-generation ALK inhibitor that received the FDA approval in 2011 for the treatment of ALK-positive NSCLC (OBryant et al., 2013). The recommended dosage for patients is 250 mg orally twice daily (BID) (Food and Drug Administration FDA, 2011a). CRI is predominantly metabolized by cytochrome P450 (CYP3A4), accounting for 99.4% based on findings from a recombinant expressed CYP isoform experiment (Food and Drug Administration FDA, 2011a). PF-06260182 is the only identified metabolite accounting for more than 10% in vivo (Food and Drug Administration FDA, 2011a). However, in contrast to CRI, PF-06260182 exhibits approximately 3- to 8-fold less potency against ALK (Food and Drug Administration FDA, 2011a). Furthermore, CRI binds to human plasma albumin to a degree of 91% (Food and Drug Administration FDA, 2011a). Studies have shown a low penetration rate of CRI into the cerebrospinal fluid (CSF) in humans (Metro et al., 2016). Alectinib (ALE) is a second-generation ALK inhibitor and the first one approved in 2017 for the therapy of ALK-positive NSCLC with brain metastases (Herden and Waller, 2018). The recommended dosage is 600 mg orally twice daily (BID) (Herden and Waller, 2018). ALE is primarily metabolized by CYP3A4 to its active metabolite M4, which accounts for approximately 40% of ALE metabolism (Food and Drug Administration FDA, 2011b). M4 exhibits potent activity against human recombinant ALK, with an IC50 value comparable to ALE (Food and Drug Administration FDA, 2011b). Both ALE and M4 are bound to human plasma albumin by more than 99%, regardless of their concentrations (Food and Drug Administration FDA, 2011b). Although ALE has a good ability to cross the blood–brain barriers, as evidenced by an unbound CSF to unbound plasma ratio of 20%–50% (Food and Drug Administration FDA, 2011b), studies have shown that it has low penetration into the CSF. The unbound CSF concentrations of ALE range from 0.2% to 0.5% of the total ALE concentration in the plasma. Lorlatinib (LOR) is the third-generation ALK inhibitor and was approved in 2018 for the treatment of patients with ALK-positive metastatic NSCLS (Syed, 2019). The in vitro experiment showed that LOR is mainly metabolized by CYP3A4 and UGT1A4, with minor contributions from CYP3A5, CYP2C8, CYP2C19, and UGT1A3 (Food and Drug Administration FDA, 2011c). Metabolite M8 accounts for 21% of human plasma radioactivity (Food and Drug Administration FDA, 2011c). However, M8 is pharmacologically inactive (Food and Drug Administration FDA, 2011c). LOR exhibits moderate binding to serum albumin and α1–acid glycoprotein, with a plasma protein binding of 66% (Food and Drug Administration FDA, 2011c). LOR demonstrated high penetration into CSF, with concentrations as high as approximately 75% of those in plasma (Singh and Chen, 2020).
To date, multiple types of ALK mutations have been identified. Of these ALK mutations, ALKL1196M, ALKG1269A, and ALKG1202R are the most common mutations in patients, and ALKG1202R confers high-level resistance to almost all of the ALK inhibitors (Shaw et al., 2017). The brain was the most common single site of disease progression after CRI treatment (Shaw et al., 2017). For an ALK inhibitor to be effective, it must cross the blood–brain barrier to reach target cell with sufficient free concentration. Therefore, the efficacy of ALK inhibitors in addressing brain metastasis development in NSCLC patients is influenced by two potential significant factors: activity against ALK mutations and a high penetration rate into CSF.
For continuous dosing of medications to be effective, maintaining a sufficient plasma trough concentration (Ctrough) at the steady state is crucial for optimal clinical efficacy. Clinical studies have established Ctrough thresholds for certain drugs: ≥1,000 ng/mL for imatinib (Picard et al., 2007) and ≥32 μg/mL for pazopanib (Wu et al., 2022). These thresholds are associated with favorable clinical outcomes. In addition, the level of kinase occupancy has been shown to strongly correlate with the overall response rate (ORR). For example, a clinical study demonstrated that achieving >90% Bruton’s tyrosine kinase (BTK) occupancy by acalabrutinib resulted in an ORR exceeding 80% (Food and Drug Administration FDA, 2011d). Similarly, another study found that achieving at least >75% ALK occupancy by CRI is necessary for clinically effective treatment. Therefore, the plasma Ctrough level and ALK occupancy play important roles in determining the clinical efficacy. Furthermore, high Ctrough levels in CSF and significant intracranial ALK occupancy can suggest greater effectiveness in the clinical therapy of brain metastases in NSCLC patients.
Physiologically based pharmacokinetic (PBPK) modeling is a promising tool to predict the Ctrough at the steady state in human plasma and CSF. This approach has been extensively used to predict human plasma and tissue concentrations (Yamamoto et al., 2017; Adiwidjaja et al., 2022) as well as the target occupancy (Xu et al., 2022). However, the current PBPK models lack the ability to directly simulate the concentration in CSF. As an alternative, the free concentration in the interstitial fluid of brain tissue is simulated to approximate the concentration in CSF. The main objectives of the present work are as follows:
(i) To develop PBPK models for CRI, ALE, and LOR in both healthy individuals and cancer patients.
(ii) To develop ALK occupancy models in plasma and CSF for CRI, ALE, and LOR.
(iii) To simulate Ctrough and ALK occupancy at the steady state in plasma and CSF and predict drug–disease interaction outcomes for brain metastasis patients.
Whole-body PBPK models were developed using PK-Sim® (version 11.1, Bayer Technology Services, Leverkusen, Germany) for three ALK inhibitors (CRI, ALE, and LOR) in healthy subjects. The developed PBPK models were utilized to retrospectively analyze the PK data of CRI, ALE, and LOR in healthy individuals.
The PBPK model is constructed by connecting tissue compartments using the blood flow rate. It includes essential components such as the gastrointestine, arterial supply, and venous return of blood. Tissues with elimination functions, like the liver and kidney, are included, whereas non-eliminating tissues like the lung are also considered. To account for the transfer of drugs between compartments, the model incorporates permeability-limited perfusion, which assumes that the distribution of a drug within each tissue is primarily governed by its permeability across the tissue barriers. The Weibull times of ALE and LOR were optimized using in vitro dissolution profiles from the study (Food and Drug Administration FDA, 2011c; Kato et al., 2020). The Weibull time of CRI was optimized using the PK-Sim method based on its plasma concentration–time profiles. Human tissue distribution was described using Rodgers and Rowland’s methods, whereas cellular permeability was determined using the standard PK-Sim method. The KIA scale (intracellular space-to-plasma partition) was optimized to values of 5.0, 2.0, and 3.0 for the three inhibitors to better describe their distribution based on their respective PK profiles and distribution volumes. The PK-Sim model divided the brain tissue compartment into four sub-compartments: plasma, blood cells, interstitial, and intracellular space. The distribution across the capillary membrane is assumed to incorporate permeability-limited perfusion. In a previous PBPK study (Diestelhorst et al., 2013), the concentration in the interstitial sub-compartment was assumed to represent that in the CSF. In this study, to predict the free concentration of three inhibitors in the CSF, the unbound concentration in interstitial fluid is also assumed to be equal to the free concentration in the CSF. In addition, the KIR scale (interstitial space-to-plasma partition) was optimized to be a value of 2.0 for ALE, whereas CRI and LOR were assigned a value of 1.0 for this parameter.
The clearance of ALK inhibitors primarily occurs through hepatic metabolism, and most intrinsic clearance (CLint) parameters were obtained from references (see Table 1). In the case of CRI, its efflux transport is described by its intrinsic transport velocity (CLint). The CLint P-gp (P-glycoprotein) value for CRI was estimated to be 1.9 μL/min/million cells-1 based on the Peff (effective permeability) data from transfected MDCKII with huABCB1 (Tang et al., 2014). The total hepatic clearance (CL) of ALE was estimated to be 34.5 L/h (Morcos et al., 2017a). In addition, the additional plasma clearance (CLa) was calculated to be 0.28 L/h/kg using the formula derived by Simulations-Plus (2019). For LOR, CLint is scaled using Eq. 1:
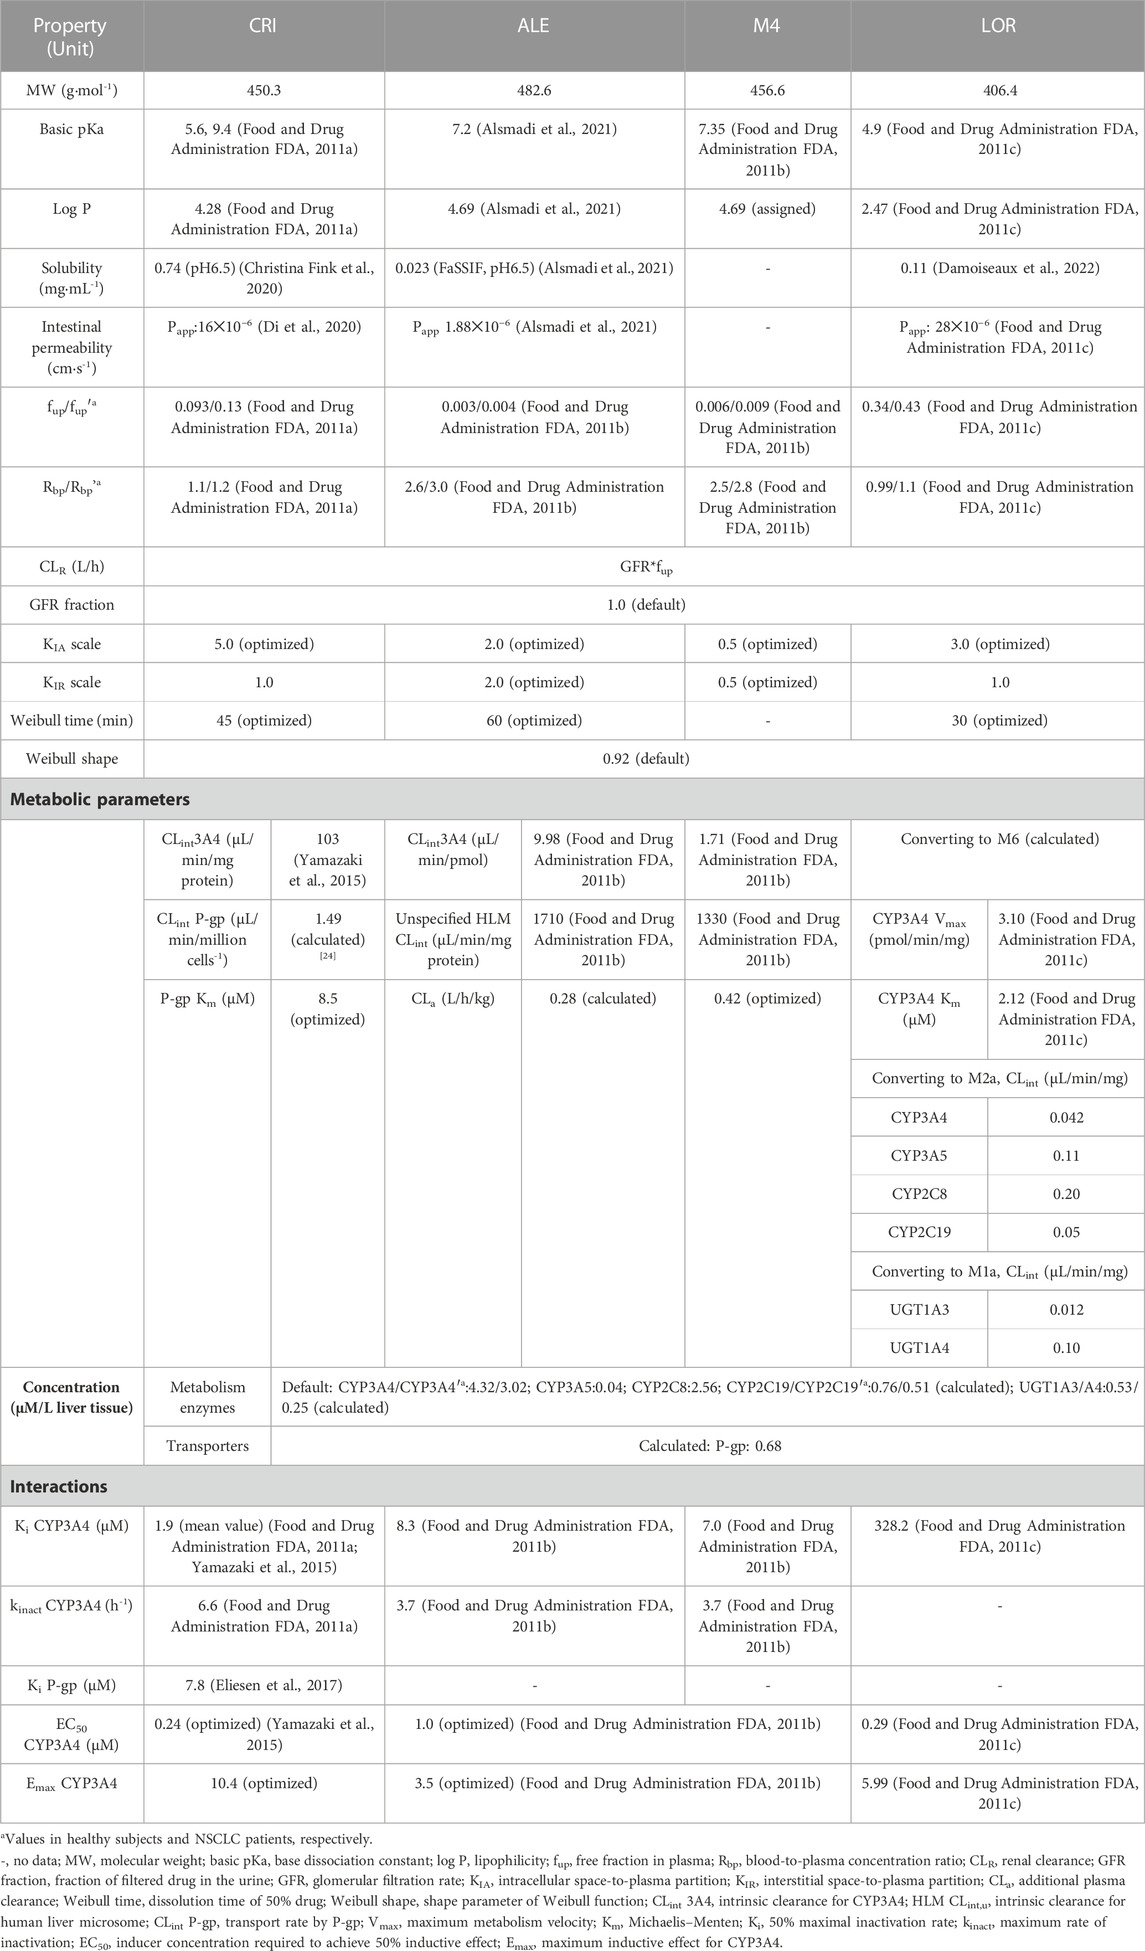
TABLE 1. Physiologically based pharmacokinetic input parameters of crizotinib, alectinib, and lorlatinib used in the simulations using PK-Sim.
where MV is the original metabolic velocity (pmol/min/pmol enzyme), ISEF represents intersystem extrapolation factor, and ISEF values were used at 0.21 for CYP3A4, 0.12 for CYP3A5, 1.41 for CYP2C8, 0.25 for CYP2C19, and 0.077 for UGT1A3 and UGT1A4 according to the literature works (Food and Drug Administration FDA, 2011c; Conner et al., 2019).
In three PBPK models, six metabolizing enzymes (see Table 1) and one transporter (P-gp) were included. The reference concentrations of UGT1A3/1A4 and P-gp have not been integrated into the PK-Sim expression database. In PK-Sim, the reference concentration of CYP enzymes or transporters is represented as the concentration per unit volume in the liver (μM/L). Therefore, the reference concentration of UGT1A3/1A4 in the liver was calculated by Eq. 2:
where UGT1A3/4 abundance (pmol/mg protein) values were assigned to be 15.3 and 44.3 from the study by Reddy et al. (2021) and protein abundance (mg protein/g liver) was set at 45.0 according to the study by Qian et al. (2019). The default values of liver weight and volume in PK-Sim were used.
The expression level of P-gp in brain tissue was determined based on the relative expression percentage. Reference concentration of P-gp in the liver is calculated by Eq. 3:
In the current paper (Couto et al., 2020), the abundance of P-gp was experimentally determined only in the human intestine, where it was found to be 1.60 pmol/mg tissue. Consequently, the weight of the intestinal tract was used as an approximation for the reference concentration of P-gp in the liver. The ratio is 0.56 (relative expression ratio of liver-to-intestine). By considering the reference concentration and relative expression in the brain, the expression of P-gp in brain tissue is then converted accordingly. Moreover, based on the literature works, CYP abundances in PK-Sim were set at 137, 103, 24, 14, 15, and 44 pmol/mg protein for CYP3A4, 3A5, 2C8, 2C19 (Food and Drug Administration FDA, 2011c), UGT1A3, and UGT1A4 (Reddy et al., 2021), respectively.
In the diseased PBPK model, the overall structure remains the same as the healthy PBPK model described earlier. However, certain modeling parameters were adjusted based on relevant published articles for populations with cancer. The specific changes are as follows: ➀downregulation of hepatic CYP3A4 and CYP2C19 expression levels: in cancer patients, the expression level of hepatic CYP3A4 is reduced by 45% compared to the healthy population. Similarly, the expression level of hepatic CYP2C19 is reduced by 30%. The corresponding values for these downregulated expression levels are reported as 3.02 μM/L liver tissue for CYP3A4 and 0.51 μM/L liver tissue for CYP2C19 (Schwenger et al., 2018) (see Table 1). ➁Reduced patients’ plasma albumin level (g/dl): hematocrit: cancer patients exhibit decreased levels of plasma albumin (from 4.5 g/dl in healthy individuals to 3.1 g/dl) and hematocrit (from 0.43 to 0.33) (Dixon et al., 2003). ➂Overexpression of P-gp: in patients with resistance to CRI, an overexpression of P-gp has been observed in patient-derived cells (Li et al., 2018). To simulate this effect, the concentration of P-gp at the blood–brain barrier in the brain in CRI simulations was set two-fold higher than that in the healthy PBPK model. However, in the PBPK model, it is not possible to directly set the concentration of P-gp at the blood–brain barrier. Instead, as an alternative approach, data from the brain were utilized to assign the concentration of P-gp for CRI simulations. Furthermore, the scaling of fup and Rbp in cancer patients was performed using the following Eqs 4–6 (Trevor et al., 2010; Simulations-Plus, 2019):
where fup’ and fup are free plasma fractions in patients and healthy subjects, respectively, and [P]′ and [P] are the plasma albumin protein concentrations in patients and healthy subjects, respectively.
where Rbp’ is the blood-to-plasma concentration ratio in patients, Hct is the hematocrit value, and KpuBC is the affinity of blood cells to the drug. KpuBC was calculated as follows:
The remaining modeling parameters for the three inhibitors were assumed to be identical to healthy conditions. The complete set of parameters for the model is summarized in Table 1 (Food and Drug Administration FDA, 2011a; Food and Drug Administration FDA, 2011b; Food and Drug Administration FDA, 2011c; Tang et al., 2014; Yamazaki et al., 2015; Eliesen et al., 2017; Christina Fink et al., 2020; Di et al., 2020; Alsmadi et al., 2021; Damoiseaux et al., 2022). The schematic representation of the PBPK models can be observed in Figure 1.
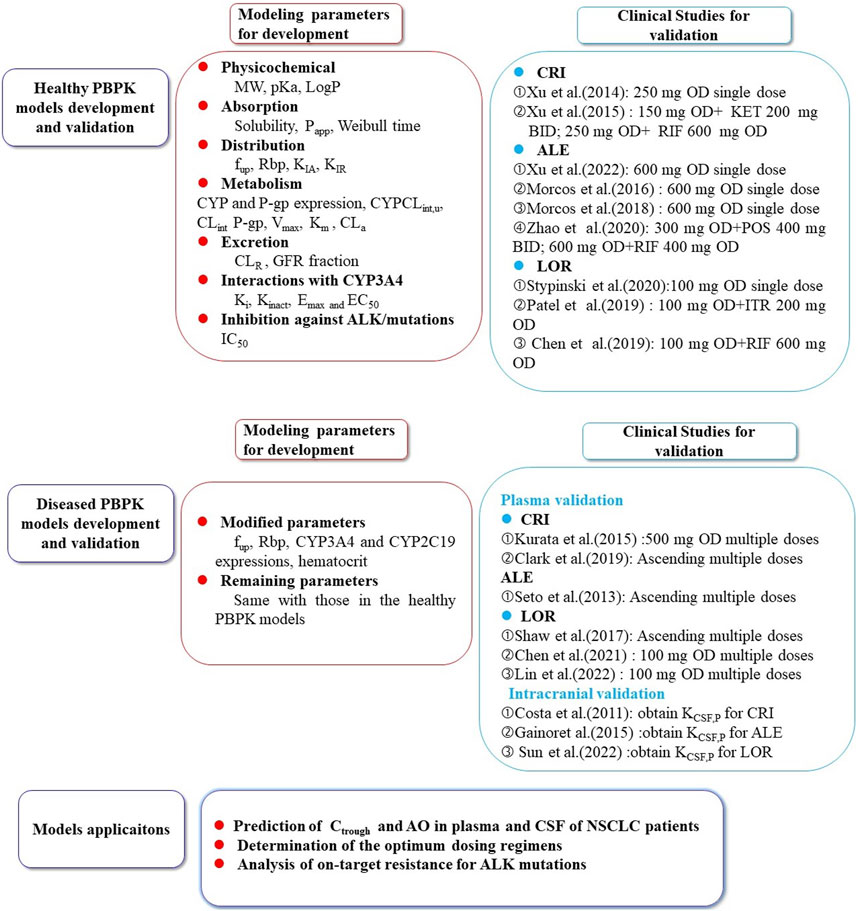
FIGURE 1. The schematic representation of the PBPK models for crizotinib, alectinib, and lorlatinib. The population PBPK models of the three ALK inhibitors were built based on the physicochemical parameters, absorption, distribution, metabolism, excretion, and interaction processes involved in CYP3A4/5, 2C8, 2C19, UGT1A3/4 metabolizing enzymes and P-gp transporter. The models were validated using multiple PK data in healthy subjects and NSCLC patients (Seto et al., 2013; Gadgeel et al., 2014; Xu et al., 2015a; Kurata et al., 2015; Morcos et al., 2017a; Morcos et al., 2017b; Morcos et al., 2017c; Shaw et al., 2017; Clark et al., 2019; Stypinski et al., 2020; Chen et al., 2021; Hibma et al., 2022; Huiping et al., 2022; Lin et al., 2022). CRI: crizotinib; ALE:alectinib; LOR: lorlatinib; KET: ketoconazole; RIF: rifampin POS: posaconazole; ITR: itraconazole; CSF: cerebrospinal fluid; KCSF,P: CFS-to-plasma ratio; Ctrough: trough concentration; AO: ALK occupancy; NSCLC: non-small cell lung cancer.
To validate the predictive performance of the PBPK model, multiple clinical PK profiles for the three inhibitors were used. These profiles included data from both healthy subjects and patients. The validation process involved comparing the coincidence of predicted PK profiles with the observed ones. In addition, the models were verified by comparing the ratios between the predicted and observed AUC, Cmax, and Ctrough (Seto et al., 2013; Gadgeel et al., 2014; Xu et al., 2015a; Kurata et al., 2015; Morcos et al., 2017a; Morcos et al., 2017b; Morcos et al., 2017c; Shaw et al., 2017; Clark et al., 2019; Stypinski et al., 2020; Chen et al., 2021; Hibma et al., 2022; Huiping et al., 2022; Lin et al., 2022) following single dose and repeated doses. Furthermore, the models were further validated by comparing predicted and calculated PK profiles in the CSF. Drug concentration (CCSF(t)) was calculated by the following equation:
where Cp(t)is the plasma concentration in the vein at different time points and KCSF,P is the CSF-to-plasma ratio. For the three ALK inhibitors, KCSF,p values were obtained from the studies by Costa et al. (2011), Gainor et al. (2016), and Sun et al. (2022). The assigned values for the three ALK inhibitors were calculated to be 0.0026, 0.79 (mean value), and 0.77, respectively.
In order to ensure the contribution of CYP3A4 to total clearance and the accuracy of inhibition and induction parameters of CYP3A4, multiple drug–drug interaction (DDI) simulations were conducted. First, the PK effects of CRI and LOR on midazolam (CYP3A4 substrate) were simulated. Next, PK of the three inhibitors was simulated when co-administered with strong CYP3A4 inhibitors, namely, ketoconazole, posaconazole, and itraconazole, as well as strong CYP3A4 inducer rifampicin. The final modeling parameters for midazolam and the four CYP3A4 modulators are provided in Supplementary Table S1, and the inhibition and induction parameters of the four modulators are listed in Supplementary Table S2. For the DDI simulations, the dosage regimens of the three ALK inhibitors, CYP3A4 inhibitors, and CYP3A4 inducer were designed based on the literature′s data (Xu et al., 2015b; Chen et al., 2020; Patel et al., 2020; Zhao et al., 2020) (see Table 4).
To assess the accuracy of predictions, the fold errors for AUC, Cmax, and Ctrough were calculated by comparing the predicted values from the PBPK model with the corresponding observed values. Generally, a fold error ranging from 0.5 to 2.0 is considered indicative of accurate model predictions. If the fold error falls within this range, it suggests that the PBPK model provides reasonably accurate estimates.
The sensitivity analysis was performed to assess how selected model parameters influence the AUC, Cmax, and Ctrough. Patient received standard dose regimens of 250 mg BID for CRI, 600 mg BID for ALE, and 100 mg OD for LOR. The modeling parameters for the sensitivity analysis were chosen based on the following criteria: 1) optimized and 2) could have significant influence on the AUC, Cmax, and Ctrough. The selected parameters were 1) LogP, 2) fup’, 3)Rbp’, 4) CLint CYP3A4, 3A5, 2C8, 2C19, UGT1A3/1A4, 5) CYP3A4 Vmax and CYP3A4 Km, 6) CLint P-gp, 7) Ki CYP3A4, 8) EC50 and Emax for CYP3A4, and (9) expression (CYP3A4, CYP3A5, CYP2C8, CYP2C19, UGT1A3, UGT1A4, and P-gp).
The impacts of the selected parameters on the AUC, Cmax, and Ctrough were evaluated by altering the value of each parameter by ± 20% (Saeheng et al., 2020). The sensitivity coefficient (SC) is computed as follows (Saeheng et al., 2020):
where ∆Y is the alteration of predicted AUC, Cmax, or Ctrough; Y is the initial value of predicted AUC, Cmax, or Ctrough; ∆P is the alteration of model parameters; and P is the initial value of assessed parameters. If a certain SC absolute value is above 1.0 (i.e., it means that a 20% change of the assessed parameters results in a 20% alteration in AUC, Cmax, or Ctrough), it means this model parameter has a significant influence on predicted AUC, Cmax, or Ctrough.
The ALK occupancy (AO) time profiles were calculated using the following Eq. 9 (Georgi et al., 2018):
where Ifree (μM) represents the free drug concertation in the plasma or CSF. Ki(μM) is the equilibrium dissociation constant. AO represents the percent level of ALK occupancy. In this work, AO in plasma and CSF by the three inhibitors on the wild-type and three most common mutations ALK were simulated. Ki values for the three inhibitors against ALK were approximated with reported IC50 values (Cui et al., 2011; Friboulet et al., 2014; Kodama et al., 2014; Song et al., 2015; Sabari et al., 2017; Chuang et al., 2019) at the Km-level of substrate ATP using the Cheng–Prusoff correction.
The demographic characteristics used in every simulation were that of the corresponding clinical study. The information of virtual population in PK-Sim includes age range, body weight, height, and proportion of female individuals. If the demographic characteristics, such as age range and gender proportions, are available from clinical studies, the actual data obtained from those studies would be used in the simulations. This approach ensures that the simulation aligns closely with the real-world characteristics of the subjects involved in clinical studies. If certain data were unavailable, PK-Sim uses common default values as surrogates. For example, age is set to a range of 30–70 years and the proportion of females is assumed to be 50%. In cases where the number of subjects in clinical studies is less than 10, 10 virtual subjects are created for the simulations to ensure a sufficient sample size. Table 2 provides information on the demographic characteristics of the virtual population, including age range and gender proportions. In addition, it lists the dosing regimens used in the simulations.
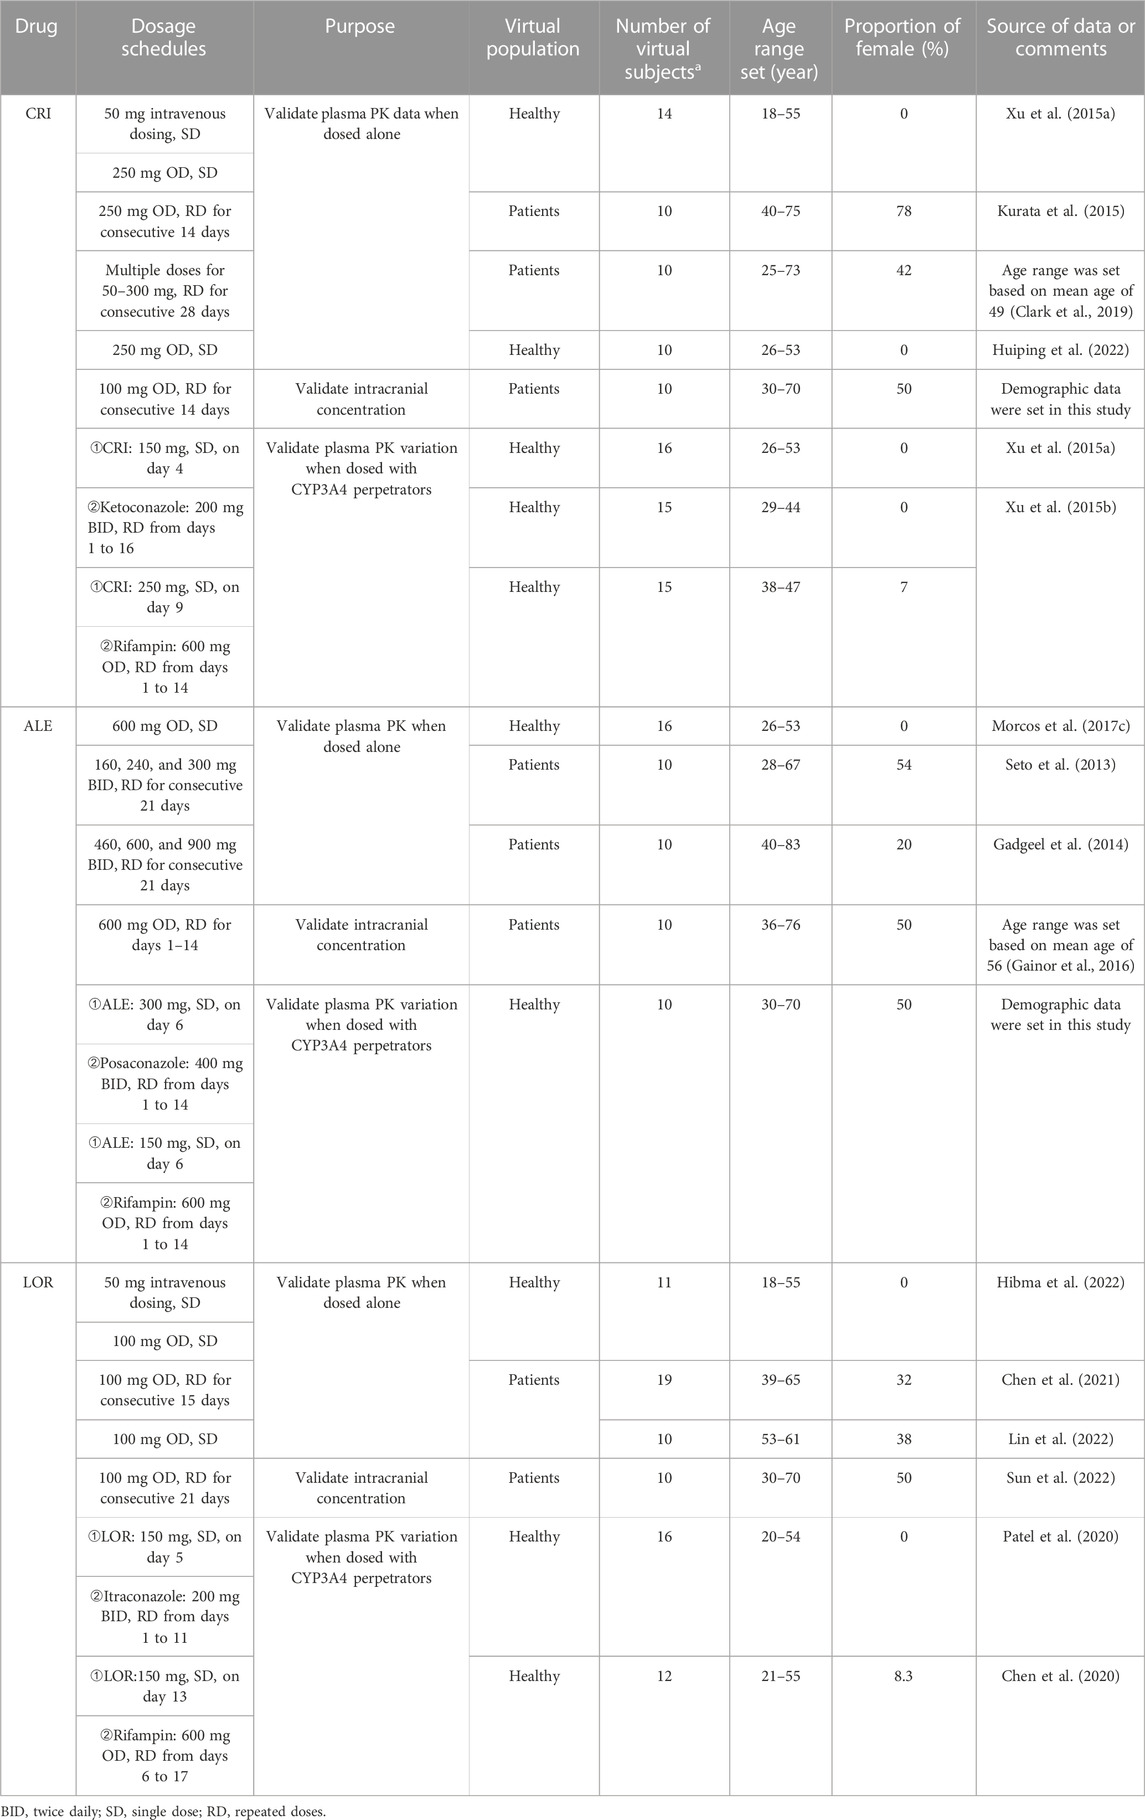
TABLE 2. Dosing regimens and demographic characteristics in the simulations of PBPK model development and validation.
Figure 2 shows the predicted and observed plasma concentration–time profiles for CRI following intravenous and oral administration in healthy subjects (Figures 2A,B), ALE following oral administration in healthy subjects and NSCLC patients (Figures 2C,D), and LOR following intravenous and oral administration in healthy subjects and NSCLC patients (Figures 2E–G). The simulations demonstrated that the PBPK models for both healthy and diseased states were able to replicate the observed PK profiles (Gadgeel et al., 2014; Xu et al., 2015a; Morcos et al., 2017a; Morcos et al., 2017b; Morcos et al., 2017c; Clark et al., 2019; Stypinski et al., 2020; Chen et al., 2021; Hibma et al., 2022; Huiping et al., 2022; Lin et al., 2022). In Table 3, it can be observed that all ratios of AUC, Cmax, and Ctrough fell within the range of 0.5–2.0.
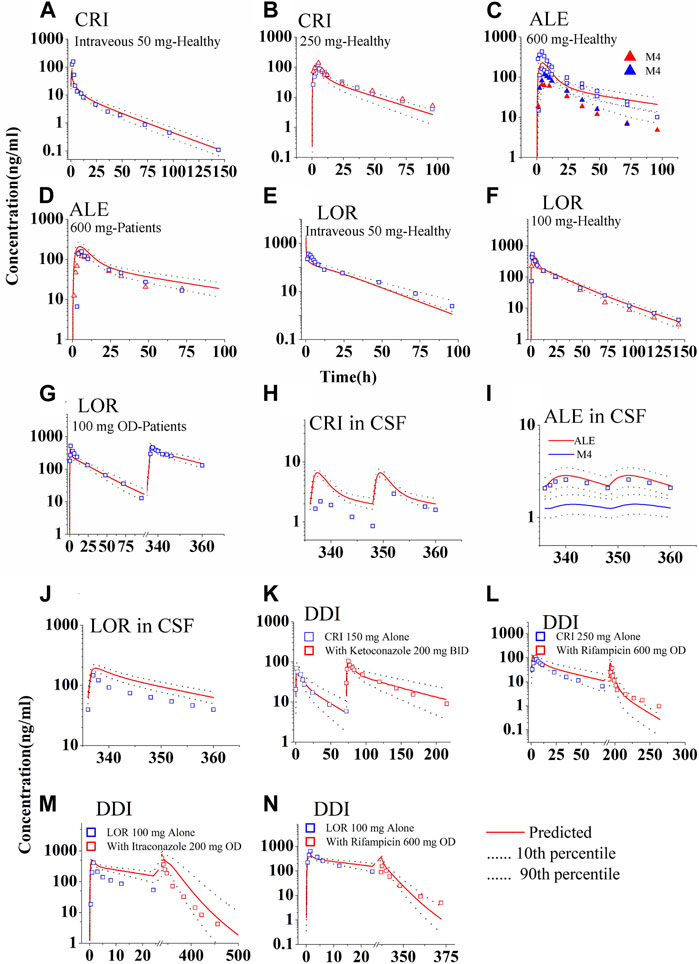
FIGURE 2. Simulations of the pharmacokinetics of the three ALK inhibitors after administration of single dose or repeated doses. The blue and red squares (parent drug) and solid up-triangles (metabolite M4) are the clinically observed data. The observed data in the CSF were derived by multiplying the plasma PK data with the observed KCSF,P values. Panel (A, B) for CRI; Panel (C, D) for ALE; Panel (E–G) for LOR; Panel (H–J) for concentration in CSF of the three ALK inhibitors, respectively; Panel (K, L) for DDIs of CRI with ketoconazole and rifampicin; Panel (M, N) for DDIs of LOR with Itraconazole and rifampicin.
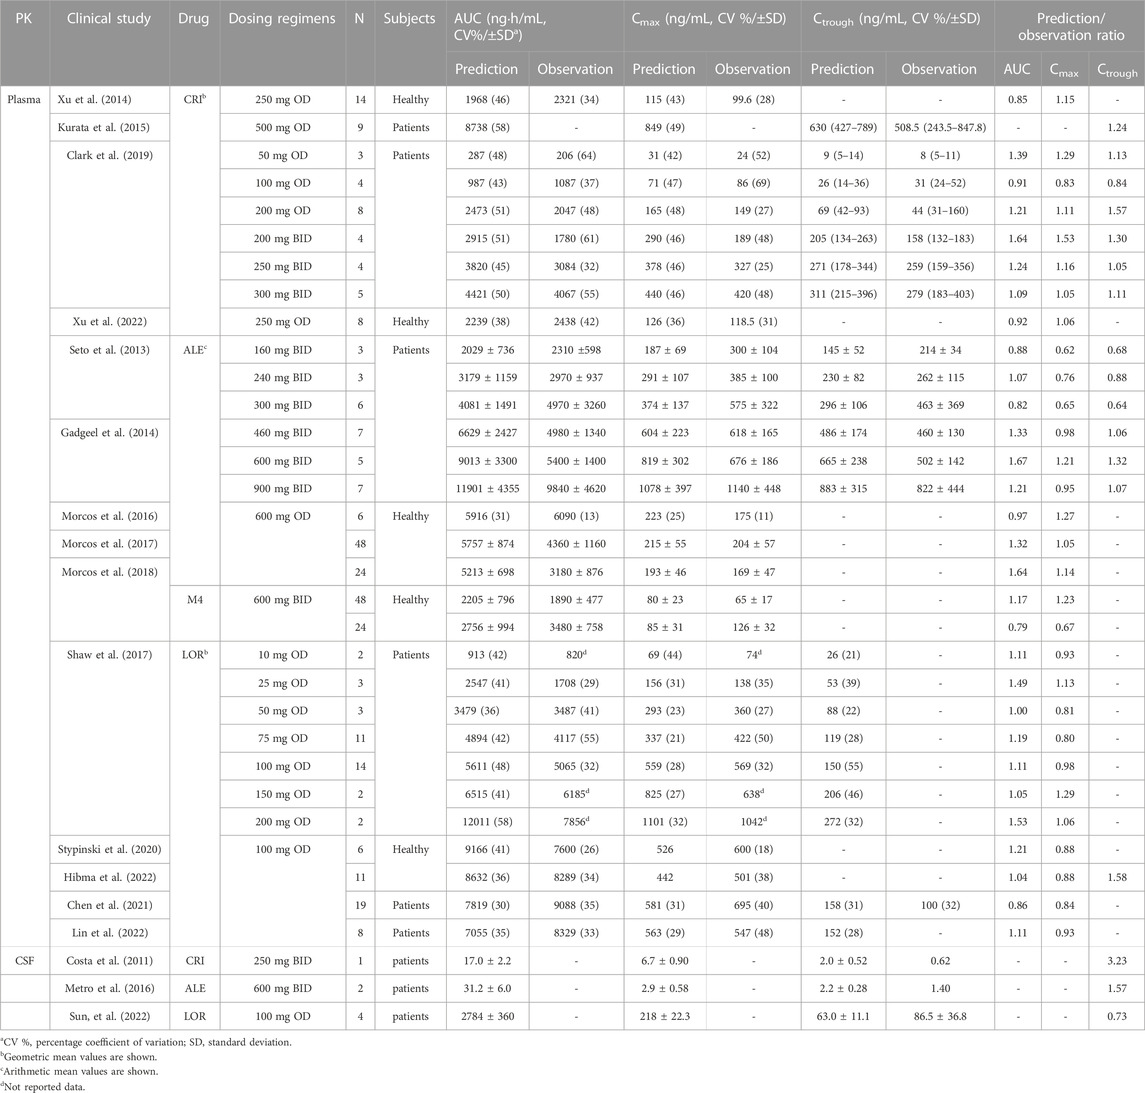
TABLE 3. Comparisons of the geometric mean plasma and intracranial PK parameters between predicted and observed data in healthy and ALK-positive NSCLC patients.
The predicted and calculated free concentration–time profiles in CSF are shown in Figures 2H–J. The simulations indicated a slight overestimation of CSF concentrations for CRI and LOR (Figures 2H,J), whereas the 90% prediction interval (CI) of the population PBPK model could cover variations observed for ALE (Figure 2I). Notably, the plasma exposure and Cmax of LOR were considerably higher than those of CRI and ALE, as shown in Figures 2H–J. Furthermore, the CSF concentration of ALE closely resembled that of CRI. Analyzing the data presented in Table 3, it is evident that the Ctrough ratio in CSF for CRI exceeds 2.0, whereas the Ctrough ratios of ALE and LOR in CSF fall within the range of 0.5–2.0. Overall, these simulation results align with the clinical observations, specifically for CRI (predicted 2.0 vs. observed 0.62 ng/mL (Costa et al., 2011)), ALE (predicted 2.2 vs. observed 1.4 ng/mL (Metro et al., 2016)), and LOR (predicted 63.0 vs. mean observed 86.5 ng/mL (Sun et al., 2022))。
Supplementary Figure S1 and Supplementary Table S3, respectively, present the predicted and clinically observed PK profiles and data for midazolam and four CYP3A4 modulators. The DDI simulations of CRI and LOR are shown in Figures 2K–N. With the exception of the PK of LOR co-administered with itraconazole, which exhibited greater variability, other simulations demonstrated that the observed data fell within the 90% CI of the population PBPK model-predicted levels. The ratios predicted by the PBPK models are summarized in Table 4. Except for the Cmax ratio (0.54 vs. 0.24) of LOR co-administered with rifampin, the other predicted AUC0-inf and Cmax ratios are in good agreement with the clinically observed ratios (Xu et al., 2015b; Chen et al., 2020; Patel et al., 2020; Zhao et al., 2020). These DDI simulations further confirmed that the CYP3A4 metabolic parameters of the three inhibitors are appropriately incorporated into the PBPK model. Moreover, Supplementary Table S4 provides the predicted AUC and Cmax ratios of midazolam when co-administered with CRI and LOR, respectively. The good consistency observed between the predicted and observed ratios indicates that the inhibition and induction parameters of CRI and LOR on CYP3A4 are appropriate in the PBPK model.

TABLE 4. PK changes (geometric mean, CV%) of crizotinib, alectinib, and lorlatinib under DDIs.
In summary, the DDI simulations demonstrated that the population PBPK models are able to accurately predict the AUC, Cmax, and plasma/intracranial Ctrough in healthy and diseased population.
As shown in Figure 3, log P exhibited the highest sensitivity as a parameter for predicting Cmax of the ALK inhibitors. For CRI, the most sensitive parameter affecting AUC was fup. However, no specific sensitive parameters were identified for AUC of ALE and LOR. In terms of Ctrough of CRI in NSCLC patients, fup and CYP3A4 expression were the most sensitive parameter. Log P was found to have the greatest impact on Ctrough of ALE. As for Ctrough of LOR, the most sensitive parameters were fup, Vmax CYP3A4, CYP3A4 expression, and Km CYP3A4. The sensitivity analysis conducted on both the healthy and diseased PBPK models indicated similar results, with the exception of CYP3A4 expression which did not exhibit sensitivity to the Ctrough of CRI in healthy subjects (information not provided in this study).
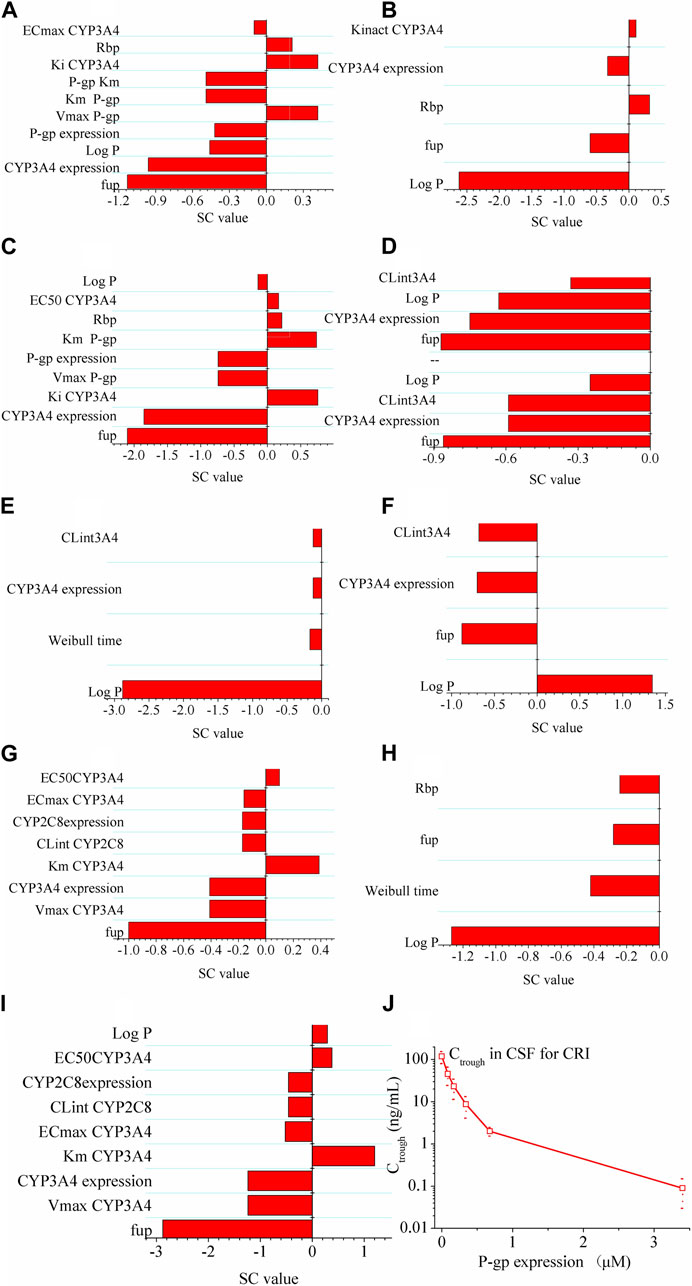
FIGURE 3. Sensitivity analysis of the diseased PBPK models. Panel (A–C) show effect of modeling parameters of CRI on AUC, Cmax and Ctrough of CRI; Panel (D–F) show effect of modeling parameters of ALE on AUC, Cmax and Ctrough of ALE; Panel (G–I) show effect of modeling parameters of LOR on AUC, Cmax and Ctrough of LOR. If the absolute value of the SC is greater than 1.0, it indicates that the corresponding model parameter has a significant influence on the AUC, Cmax, or Ctrough. Panel (J) illustrates the effect of P-gp on the intracranial Ctrough (minimum concentration) of CRI (the drug). It indicates that as P-gp expression increases, the Ctrough of CRI in cerebrospinal fluid (CSF) decreases.
Next, the simulations conducted to assess the influence of P-gp expression on the intracranial Ctrough of CRI revealed notable findings. Figure 3J illustrates the influence of P-gp expression within the range of 0–3.4 μM on the Ctrough in CSF. The results clearly demonstrate that the P-gp expression at the blood–brain barrier significantly affects the intracranial Ctrough of CRI. As the P-gp expression increases, the intracranial Ctrough gradually decreases. This effect is evident with a substantial 60-fold increase when P-gp efflux is absent at the blood–brain barrier.
According to the study by Yamazaki (2013), >75% ALK inhibition was required in NSCLC patients for CRI to produce clinically higher ORR. As a result, >75% AO was defined as an effective threshold for the three ALK inhibitors in this work. Figure 4 shows the AO time course in both plasma and CSF following 14 consecutive days of dosing with the inhibitors. For CRI, only plasma AO is greater than 75% in patients with wild-type ALK (Figures 4A,B). The ALK engagement by CRI in plasma was markedly higher than ALK engagement by CRI in CSF. In contrast, the ALK engagements by ALE and LOR were independent of plasma and CSF, likely due to their high penetration into CSF. Notably, ALE achieved more than 75% ALK occupancy in both plasma and CSF for wild-type ALK and mutation ALKL1196M. This simulation is consistent with the clinical trial in which ALE demonstrated efficacy in NSCLC patients with brain metastases (Jessica et al., 2019). The simulation suggests that ALKG1202R was most likely to confer resistance to ALE, as the maximal AO was less than 20% (Figures 4C,D). On the other hand, LOR showed more than 75% occupancy of wild-type ALK and three mutations (Figures 4E,F). The study indicates that LOR can overcome resistance to the first- and second-generation ALK inhibitors, even in cases mediated by ALKG1202R, and may have significant activity on brain metastasis. The AO simulations of LOR were also in agreement with the clinical study (Food and Drug Administration FDA, 2011c).
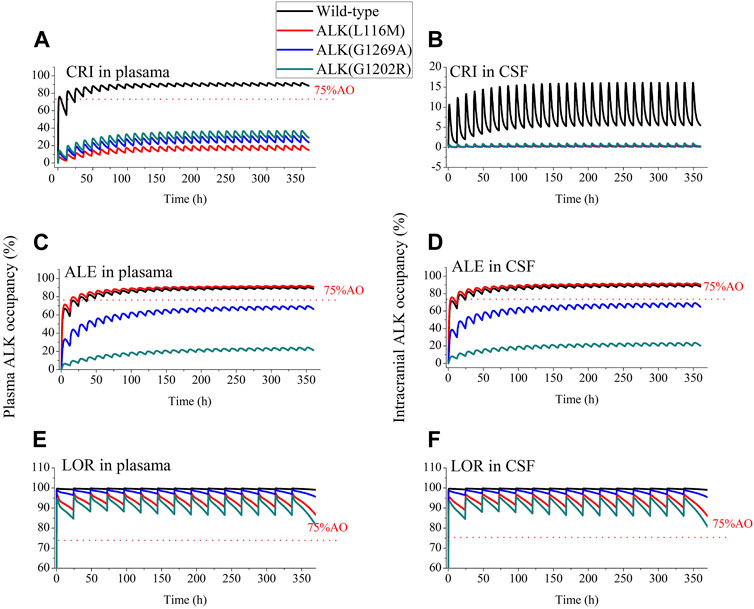
FIGURE 4. Simulations of wild-type and three mutations ALK occupancy in plasma and CSF by crizotinib, alectinib and lorlatinib. The plasma and intracranial ALK occupancy of CRI [Panel (A, B), 250 mg BID], ALE [Panel (C, D), 600 mg BID], and LOR [Panel (E, F), 100 mg OD].
The exposure–response relationships for efficacy in patients have suggested that the clinical efficacy of three inhibitors is strongly correlated with their steady-state Ctrough. Minimum Ctrough of ≥235 ng/mL was obtained for CRI (Groenland et al., 2021), ≥435 ng/mL for ALE (Groenland et al., 2021), and 7.6 (wild-type)/62 (ALKL1196M)/150 (ALKG1202R) ng/mL for LOR (Shaw et al., 2017) as a PK threshold for optimal clinical efficacy. Figure 5 and Table 5 illustrate Ctrough and AO in both plasma and CSF based on the clinically proposed dosing regimens for the three inhibitors. For CRI, the simulations suggested that a dose of 250 mg BID is appropriate for inhibiting wild-type ALK. However, higher doses of CRI could also not achieve clinical efficacy against the three ALK mutations. Similarly, the simulations support the appropriateness of the proposed dose of 250 mg BID for ALE. In the case of ALKG1269A mutation, increasing the dose may be a more effective option for clinical therapy. Furthermore, the simulations demonstrated that the proposed dosing regimens of 100 mg OD are appropriate for NSCLC patients with wild-type ALK and three ALK mutations, even in the presence of brain metastasis. These findings provide additional evidence supporting the clinical efficacy of the recommended dosing regimens for the three inhibitors in various patient populations.
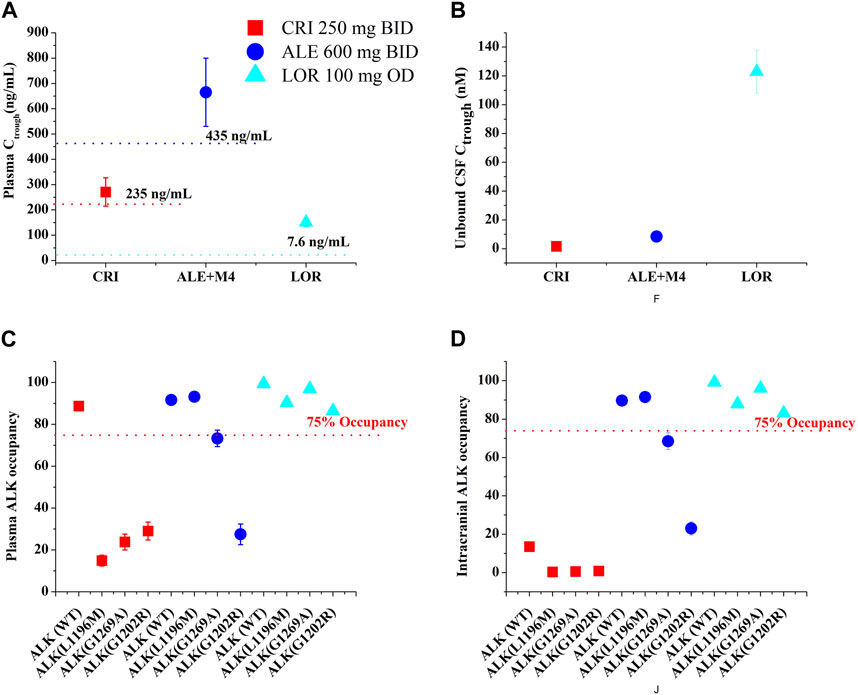
FIGURE 5. The PBPK simulations of predicted Ctrough [plasma, (A); CSF, (B)] and ALK occupancy [plasma, (C); intracranial, (D)] in NSCLC patients. Data were shown as geometric mean values and 95% CI.
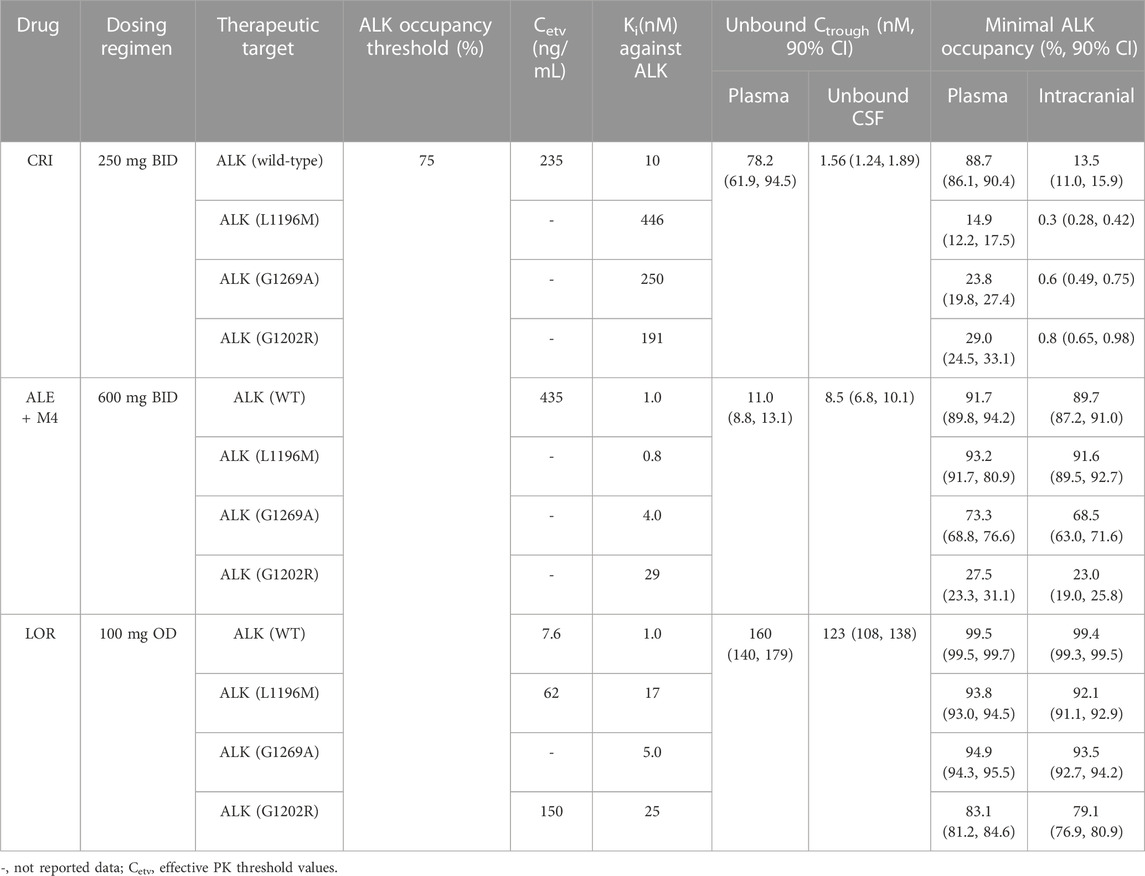
TABLE 5. Mean trough concentration unbound and ALK occupancy at steady state in plasma and CSF in ALK-positive NSCLC patients.
In this study, the effective thresholds of plasma Ctrough (CRI: 235 ng/mL, ALE: 435 ng/mL, and LOR: 7.6, 622, 150 ng/mL in wild-type, ALKL1196M, and ALK G1202R mutations, respectively) and AO (>75%) in both plasma and CSF were defined. The developed PBPK models were able to accurately predict the plasma and intracranial Ctrough for the three inhibitors in healthy individuals and in NSCLC patients. The simulations have been demonstrated by multiple clinical PK study data (see Figure 2; Table 3). To our knowledge, this is the first study to assess the PK and AO of the three ALK inhibitors in the plasma and CSF of NSCLC patients. In cancer patients, known physiological differences in CYP enzyme expression, plasma protein level, and hematocrit have been reported (Dixon et al., 2003; Schwenger et al., 2018). In addition, reductions in the plasma protein level and hematocrit in patients can result in increased fup and Rbp (see Table 1), which were modified in the mode for patients. Finally, the five modeling parameters (CYP3A4 and CYP2C19 expression, plasma protein level, hematocrit, fup, and Rbp) were incorporated into the diseased PBPK model, whereas the remaining parameters were assumed to be identical to the healthy condition.
The sensitivity analysis conducted in this study identified fup and CYP3A4 expression as sensitive parameters for the three ALK inhibitors in most cases. Therefore, it was necessary to modify the fup and CYP3A4 expression values in the diseased PBPK model to accurately represent the effects of these parameters in patients. In addition, the simulations demonstrated that P-gp expression at the blood–brain barrier plays a significant role in determining Ctrough of CRI in the CSF (Figure 3J). This finding suggests that low penetration of CRI into the brain is primarily attributed to the presence of P-gp, which limits its distribution across the blood–brain barrier. Overall, these results indicate the importance of considering factors such as fup, CYP3A4 expression, and P-gp expression when modeling the PK and distribution of the three ALK inhibitors, particularly regarding their penetration into the CSF.
It is noteworthy that CRI and ALE can inhibit their own metabolism through time-dependent inhibition of CYP3A4 as well as increase their own metabolism through induction of in vivo CYP3A4 expression (interaction parameters in Table 1). On the other hand, LOR can only enhance its own metabolism through auto-induction of CYP3A4 expression (interaction parameters in Table 1), with low auto-inhibition of CYP3A4. In this work, the PBPK models incorporated CYP3A4 auto-inhibition (Ki, kinact) and auto-induction parameters (Emax and EC50) to ensure the predictive performance of the model. However, this may not be robust in this case. Recent studies (Yamazaki et al., 2015; Hanke et al., 2018) have also applied this approach to predict the clinical PK for mixed CYP3A4 inhibitors and inducers, further supporting the need to incorporate these mixed inhibition and induction parameters into our developed PBPK models. The PBPK models predicted that mean oral clearance (CL) following a single oral 100 mg dose increased by 1.78-fold due to auto-induction compared with the CL at the steady state, which is in agreement with the clinical data (1.78-fold vs. 1.64-fold) (Food and Drug Administration FDA, 2011c). These results suggest that it is necessary to consider the complex interplay of auto-inhibition and auto-induction when developing PBPK models.
Approximately 30% of ALK-positive patients with NSCLC are likely to develop brain metastases (Zou et al., 2022). Unbound drug concentration in the CSF is often used as a surrogate for concentration at the target in clinical setting (De Lange and Danhof, 2002). The predictive power of concentration of the three inhibitors in the CSF has been demonstrated by our developed PBPK models. According to the PBPK model, the mean Ctrough (8.5 nM) for ALE and Ctrough (123 nM) for LOR in the CSF were higher than the concentration required for three (ALE) and four (LOR) ALK inhibition (see Table 5). In contrast, the PBPK model showed that the mean Ctrough for CRI in CSF (1.56 nM) was lower than the concentration required for wild-type and four mutations of ALK inhibition (see Table 5).
Multiple molecular mechanisms can lead to resistance to the first- and second-generation ALK inhibitors (Recondo et al., 2020). Among these, approximately 50% of resistance cases are attributed to on-target resistance, specifically ALK resistance mutations (Yoda et al., 2018). The two key factors conferring on-target resistance are Ki against the ALK mutation and unbound concentration on target cells. In this study, we calculated AO using Ki plus unbound concentration in CSF, which can help explain the mechanism of on-target resistance. A few studies have been conducted to define a common value of at least level target occupancy for minimal efficacy target engagement, such as at least 90% occupancy for soluble epoxide hydrolase (Lee et al., 2019), more than 90% occupancy for BTK (Food and Drug Administration FDA, 2011d), and >70% occupancy for α-glucosidase (Wang et al., 2019). In our study, we defined >75% AO for reaching the optimal therapeutic level for ALK inhibitors. The low AO against three mutations in plasma and four ALK mutations in CSF explains the resistance of CRI to ALK mutations and brain metastasis. In addition, the PBPK model of CRI demonstrated that P-gp efflux at the blood–brain barrier restricts its accumulation in the brain. This simulation agrees with the previous work (KCSF,P increased by 13.9-fold after P-gp was knocked out) (Tang et al., 2014). Furthermore, the model predicted ALE resistance to ALKG1202R (see Table 5; Figure 5), which is also in agreement with the study by Ou et al. (2014).
The appropriate dosing regimens for NSCLC populations were investigated for the three inhibitors based on the geometric mean and 95% CI of predicted Ctrough and AO (see Figure 5). This strategy for optimal dosing has been proposed by Adiwidjaja et al., 2022. Based on this strategy, it was suggested that CRI 250 mg BID, ALE 600 mg BID, and LOR 100 mg OD in NSCLC patients could represent the optimal dosing regimens (see Figure 5). In cases where patients have the ALKG1269A mutation, increasing the dose of ALE may lead to a better clinical ORR. Furthermore, when administered concurrently with CYP3A4 inhibitors and inducers, the PBPK models can also provide the appropriate dosage regimens for the three inhibitors.
There are still some limitations to the present model. First, the PBPK models used for diseased conditions do not consider the role of other physiological parameters, except for the five modeling parameters mentioned earlier. Second, the effect of ALK overexpression in patients on AO has not been evaluated yet. In mice, ALK expression has been shown to play an important role in ALK inhibition in the brain (Shaw et al., 2017), but its effect in human patients is uncertain. Third, there is uncertainty due to incomplete equivalence between the free concentration in interstitial fluid and that in CSF, which is important to be recognized when using the PBPK model for simulations.
In summary, we have successfully developed both healthy and diseased PBPK models for CRI, ALE, and LOR. These models adequately predicted the concentration and AO of the three ALK inhibitors in the plasma and CSF of NSCLC patients. In addition, PBPK models enable us to analyze the mechanisms of on-target resistance and determine appropriate dosing regimens for these inhibitors.
The original contributions presented in the study are included in the article/Supplementary Material; further inquiries can be directed to the corresponding authors.
JZ, GJ, and CW: conceptualization, formal analysis, and supervision; BL, SL, HF, CD, and LW: investigation, resources, software, data curation, methodology, validation, and visualization; BL and SL: writing. All authors contributed to the article and approved the submitted version.
This study was funded by the National Natural Science Foundation of China (No. 81703454) and Tianjin Key Medical Discipline (Specialty) Construction Project (TJYXZDXK-009A).
The authors declare that the research was conducted in the absence of any commercial or financial relationships that could be construed as a potential conflict of interest.
All claims expressed in this article are solely those of the authors and do not necessarily represent those of their affiliated organizations, or those of the publisher, the editors, and the reviewers. Any product that may be evaluated in this article, or claim that may be made by its manufacturer, is not guaranteed or endorsed by the publisher.
The Supplementary Material for this article can be found online at: https://www.frontiersin.org/articles/10.3389/fphar.2023.1234262/full#supplementary-material
Adiwidjaja, J., Gross, A. S., Boddy, A. V., and McLachlan, A. J. (2022). Physiologically-based pharmacokinetic model predictions of inter-ethnic differences in imatinib pharmacokinetics and dosing regimens. Br. J. Clin. Pharmacol. 88 (4), 1735–1750. doi:10.1111/bcp.15084
Alsmadi, M. M., Al-Daoud, N. M., Jaradat, M. M., Alzughoul, S. B., Abu Kwiak, A. D., Abu Laila, S. S., et al. (2021). Physiologically-based pharmacokinetic model for alectinib, ruxolitinib, and panobinostat in the presence of cancer, renal impairment, and hepatic impairment. Biopharm. Drug Dispos. 42 (6), 263–284. doi:10.1002/bdd.2282
Chen, J., O'Gorman, M. T., James, L. P., Klamerus, K. J., Mugundu, G., and Pithavala, Y. K. (2021). Pharmacokinetics of lorlatinib after single and multiple dosing in patients with anaplastic lymphoma kinase (ALK)-Positive non-small cell lung cancer: results from a global phase I/II study. Clin. Pharmacokinet. 60 (10), 1313–1324. doi:10.1007/s40262-021-01015-z
Chen, J., Xu, H., Pawlak, S., James, L. P., Peltz, G., Lee, K., et al. (2020). The effect of rifampin on the pharmacokinetics and safety of lorlatinib: results of a phase one, open-label, crossover study in healthy participants. Adv. Ther. 37 (2), 745–758. doi:10.1007/s12325-019-01198-9
Christina Fink, M. L., BadoloWagner, L. K., Karsten M¨ader, S.-A. P., Mäder, K., and Peters, S. A. (2020). Identification of solubility-limited absorption of oral anticancer drugs using PBPK modeling based on rat PK and its relevance to human. Eur. J. Pharm. Sci. 152, 105431. doi:10.1016/j.ejps.2020.105431
Chuang, Y. C., Huang, B. Y., Chang, H. W., and Yang, C. N. (2019). Molecular modeling of ALK L1198F and/or G1202R mutations to determine differential crizotinib sensitivity. Sci. Rep. 9 (1), 11390. doi:10.1038/s41598-019-46825-1
Clark, J. W., Camidge, D. R., Kwak, E. L., Maki, R. G., Shapiro, G. I., Chen, I., et al. (2019). Dose-escalation trial of the ALK, MET & ROS1 inhibitor, crizotinib, in patients with advanced cancer. Future Oncol. 16 (1), 4289–4301. doi:10.2217/fon-2019-0653
Conner, T. M., Reed, R. C., and Zhang, T. (2019). A physiologically based pharmacokinetic model for optimally profiling lamotrigine disposition and drug-drug interactions. Eur. J. Drug Metab. Pharmacokinet. 44 (3), 389–408. doi:10.1007/s13318-018-0532-4
Costa, D. B., Kobayashi, S., Pandya, S. S., Yeo, W.-L., Shen, Z., Tan, W., et al. (2011). CSF concentration of the anaplastic lymphoma kinase inhibitor crizotinib. J. Clin. Oncol. 29 (15), e443–e445. doi:10.1200/JCO.2010.34.1313
Couto, N., Al-Majdoub, Z. M., Gibson, S., Davies, P. J., Achour, B., Harwood, M. D., et al. (2020). Quantitative proteomics of clinically relevant drug-metabolizing enzymes and drug transporters and their intercorrelations in the human small intestine. Drug Metab. Dispos. 48 (4), 245–254. doi:10.1124/dmd.119.089656
Cui, J. J., Tran-Dubé, M., Shen, H., Nambu, M., Kung, P. P., Pairish, M., et al. (2011). Structure based drug design of crizotinib (PF-02341066), a potent and selective dual inhibitor of mesenchymal-epithelial transition factor (c-MET) kinase and anaplastic lymphoma kinase (ALK). J. Med. Chem. 54 (18), 6342–6363. doi:10.1021/jm2007613
Damoiseaux, D., Li, W., Martínez-Chávez, A., Beijnen, J. H., Schinkel, A. H., Huitema, A. D. R., et al. (2022). Predictiveness of the human-CYP3A4-transgenic mouse model (Cyp3aXAV) for human drug exposure of CYP3A4-metabolized drugs. Pharm. (Basel) 15 (7), 860. doi:10.3390/ph15070860
De Lange, E. C. M., and Danhof, M. (2002). Considerations in the use of cerebrospinal fluid pharmacokinetics to predict brain target concentrations in the clinical setting: implications of the barriers between blood and brain. Clin. Pharmacokinet. 41 (10), 691–703. doi:10.2165/00003088-200241100-00001
Di, L., Artursson, P., Avdeef, A., Benet, L. Z., Houston, J. B., Kansy, M., et al. (2020). The critical role of passive permeability in designing successful drugs. ChemMedChem 15 (20), 1862–1874. doi:10.1002/cmdc.202000419
Diestelhorst, C., Boos, J., McCune, J. S., Russell, J., Kangarloo, S. B., and Hempel, G. (2013). Physiologically based pharmacokinetic modelling of Busulfan: a new approach to describe and predict the pharmacokinetics in adults. Cancer Chemother. Pharmacol. 72, 991–1000. doi:10.1007/s00280-013-2275-x
Dixon, M. R., Haukoos, J. S., Udani, S. M., Naghi, J. J., Arnell, T. D., Kumar, R. R., et al. (2003). Carcinoembryonic antigen and albumin predict survival in patients with advanced colon and rectal cancer. Archives Surg. 138 (9), 962–966. doi:10.1001/archsurg.138.9.962
Eliesen, G. A. M., van den Heuvel, J. J., Albert Bilos, J. P., Drongelen, J. van, Russel, F. G. M., Greupink, R., et al. (2017). Editor's highlight: PlacentalDisposition and effects of crizotinib: an ex vivo study in the isolated dual-side perfused human cotyledon. Toxicol. Sci. 157(2), 500–509. doi:10.1093/toxsci/kfx063
Food and Drug Administration (FDA) (nd2011a). Center for drug evaluation and research. Available at: https://www.accessdata.fda.gov/drugsatfda_docs/nda/2011/202570Orig1s000ClinPharmR.pdf.
Food and Drug Administration (FDA) (nd2011b). Center for drug evaluation and research. Available at: https://www.accessdata.fda.gov/drugsatfda_docs/nda/2015/208434Orig1s000ClinPharmR.pdf.
Food and Drug Administration (FDA) (nd2011c). Center for drug evaluation and research. Available at: https://www.accessdata.fda.gov/drugsatfda_docs/nda/2018/210868Orig1s000MultidisciplineR.pdf.
Food and Drug Administration (FDA) (nd2011d). Center for drug evaluation and research. Available at: https://www.accessdata.fda.gov/drugsatfda_docs/nda/2017/210259Orig1s000MultidisciplineR.pdf.
Friboulet, L., Li, N., Katayama, R., Lee, C. C., Gainor, J. F., Crystal, A. S., et al. (2014). The ALK inhibitor ceritinib overcomes crizotinib resistance in non-small cell lung cancer. Cancer Discov. 4 (6), 662–673. doi:10.1158/2159-8290.CD-13-0846
Fujimoto, D., Yoshioka, H., Kataoka, Y., Morimoto, T., Hata, T., Kim, Y. H., et al. (2019). Pseudoprogression in previously treated patients with non-small cell lung cancer who received nivolumab monotherapy. J. Thorac. Oncol. 14 (3), 468–474. doi:10.1016/j.jtho.2018.10.167
Gadgeel, S. M., Gandhi, L., Riely, G. J., Chiappori, A. A., West, H. L., Azada, M. C., et al. (2014). Safety and activity of alectinib against systemic disease and brain metastases in patients with crizotinib-resistant ALK-rearranged non-small-cell lung cancer (AF-002JG): results from the dose-finding portion of a phase 1/2 study. Lancet Oncol. 15 (10), 1119–1128. doi:10.1016/S1470-2045(14)70362-6
Gainor, J. F., Chi, A. S., Logan, J., Hu, R., Oh, K. S., Brastianos, P. K., et al. (2016). Alectinib dose escalation reinduces central nervous system responses in patients with anaplastic lymphoma kinase-positive non-small cell lung cancer relapsing on standard dose alectinib. J. Thorac. Oncol. 11 (2), 256–260. doi:10.1016/j.jtho.2015.10.010
Georgi, V., Schiele, F., Berger, B. T., Steffen, A., Marin Zapata, P. A., Briem, H., et al. (2018). Binding kinetics survey of the drugged kinome. J. Am. Chem. Soc. 140 (46), 15774–15782. doi:10.1021/jacs.8b08048
Gower, A., Geolestany, B., Gong, J., Singhi, A. D., and Hendifar, A. E. (2020). Novel ALK fusion, PPFIBP1-ALK, in pancreatic ductal adenocarcinoma responsive to alectinib and lorlatinib. United States: JCO Precis Oncol.
Groenland, S. L., Geel, D. R., Janssen, J. M., de Vries, N., Rosing, H., Beijnen, J. H., et al. (2021). Exposure-response analyses of anaplastic lymphoma kinase inhibitors crizotinib and alectinib in non-small cell lung cancer patients. Clin. Pharmacol. Ther. 109 (2), 394–402. doi:10.1002/cpt.1989
Hanke, N., Frechen, S., Moj, D., Britz, H., Eissing, T., Wendl, T., et al. (2018). PBPK models for CYP3A4 and P-gp DDI prediction: a modeling network of rifampicin, itraconazole, clarithromycin, midazolam, alfentanil, and digoxin. CPT Pharmacometrics Syst. Pharmacol. 7 (10), 647–659. doi:10.1002/psp4.12343
Herden, M., and Waller, C. F. (2018). Alectinib. Recent Results Cancer Res. 211, 247–256. doi:10.1007/978-3-319-91442-8_17
Hibma, J. E., O'Gorman, M., Nepal, S., Pawlak, S., Ginman, K., and Pithavala, Y. K. (2022). Evaluation of the absolute oral bioavailability of the anaplastic lymphoma kinase/c-ROS oncogene 1 kinase inhibitor lorlatinib in healthy participants. Cancer Chemother. Pharmacol. 89 (1), 71–81. doi:10.1007/s00280-021-04368-1
Huiping, X., Gorman, M. O., Matschke, K., Boutros, T., Brega, N., Tan, W., et al. (2022). Evaluation of proton pump inhibitor esomeprazole on crizotinib pharmacokinetics in healthy participants. Clin. Pharmacol. Drug Dev. 11 (1), 34–42. doi:10.1002/cpdd.1032
Jessica, J., Lin, G. Y. J., Joshipura, N., Jennifer Ackil, S. R. D., Rincon, S. P., Yeap, B. Y., et al. (2019). Efficacy of alectinib in patients with ALK-positive NSCLC and symptomatic or large CNS metastases. J. Thorac. Oncol. 14 (4), 683–690. doi:10.1016/j.jtho.2018.12.002
Kato, T., Nakagawa, H., Mikkaichi, T., Miyano, T., Matsumoto, Y., and Ando, S. (2020). Establishment of a clinically relevant specification for dissolution testing using physiologically based pharmacokinetic (PBPK) modeling approaches. Eur. J. Pharm. Biopharm. 151, 45–52. doi:10.1016/j.ejpb.2020.03.012
Kodama, T., Tsukaguchi, T., Yoshida, M., Kondoh, O., and Sakamoto, H. (2014). Selective ALK inhibitor alectinib with potent antitumor activity in models of crizotinib resistance. Cancer Lett. 351 (2), 215–221. doi:10.1016/j.canlet.2014.05.020
Kurata, Y., Miyauchi, N., Suno, M., Ito, T., Sendo, T., and Kiura, K. (2015). Correlation of plasma crizotinib trough concentration with adverse events in patients with anaplastic lymphoma kinase positive non-small-cell lung cancer. J. Pharm. Health Care Sci. 1, 8. doi:10.1186/s40780-014-0008-x
Lee, K. S. S., Yang, J., Niu, J., Ng, C. J., Wagner, K. M., Dong, H., et al. (2019). Drug-target residence time affects in vivo target occupancy through multiple pathways. ACS Cent. Sci. 5 (9), 1614–1624. doi:10.1021/acscentsci.9b00770
Lei, Y., Shi, X., and Wang, J. (2022). EML4-ALK fusion gene in non-small cell lung cancer. Oncol. Lett. 24 (2), 277. doi:10.3892/ol.2022.13397
Li, W., Sparidans, R. W., Wang, Y., Lebre, M. C., Wagenaar, E., Beijnen, J. H., et al. (2018). P-glycoprotein (MDR1/ABCB1) restricts brain accumulation and cytochrome P450-3A (CYP3A) limits oral availability of the novel ALK/ROS1 inhibitor lorlatinib. Int. J. Cancer 143 (8), 2029–2038. doi:10.1002/ijc.31582
Lin, S., Gong, J., Canas, G. C., Winkle, P., Pelletier, K., LaBadie, R. R., et al. (2022). A phase I study to evaluate the pharmacokinetics and safety of lorlatinib in adults with mild, moderate, and severe renal impairment. Eur. J. Drug Metab. Pharmacokinet. 47 (2), 235–245. doi:10.1007/s13318-021-00747-4
Metro, G., Lunardi, G., Bennati, C., Chiarini, P., Sperduti, I., Ricciuti, B., et al. (2016). Alectinib's activity against CNS metastases from ALK-positive non-small cell lung cancer: a single institution case series. J. Neurooncol 129 (2), 355–361. doi:10.1007/s11060-016-2184-z
Morcos, P. N., Guerini, E., Parrott, N., Dall, G., Blotner, S., Bogman, K., et al. (2017c). Effect of food and esomeprazole on the pharmacokinetics of alectinib, a highly selective ALK inhibitor, in healthy subjects. Clin. Pharmacol. Drug Dev. 6 (4), 388–397. doi:10.1002/cpdd.296
Morcos, P. N., Parrott, N., Banken, L., Timpe, C., Lindenberg, M., Guerini, E., et al. (2017b). Effect of the wetting agent sodium lauryl sulfate on the pharmacokinetics of alectinib: results from a bioequivalence study in healthy subjects. Clin. Pharmacol. Drug Dev. 6 (3), 266–279. doi:10.1002/cpdd.299
Morcos, P. N., Yu, L., Bogman, K., Sato, M., Katsuki, H., Kawashima, K., et al. (2017a). Absorption, distribution, metabolism and excretion (ADME) of the ALK inhibitor alectinib: results from an absolute bioavailability and mass balance study in healthy subjects. Xenobiotica 47 (3), 217–229. doi:10.1080/00498254.2016.1179821
OBryant, C. L., Wenger, S. D., Kim, M., and Thompson, L. A. (2013). Crizotinib: a new treatment option for ALK-positive non-small cell lung cancer. Ann. Pharmacother. 47 (2), 189–197. doi:10.1345/aph.1R002
Ou, S.-H. I., Azada, M., Hsiang, D. J., Herman, J. M., Kain, T. S., Siwak-Tapp, C., et al. (2014). Next-generation sequencing reveals a novel NSCLC ALK F1174V mutation and confirms ALK G1202R mutation confers high-level resistance to alectinib (CH5424802/ro5424802) in ALK-rearranged NSCLC patients who progressed on crizotinib. J. Thorac. Oncol. 9 (4), 549–553. doi:10.1097/JTO.0000000000000094
Patel, M., Chen, J., McGrory, S., O'Gorman, M., Nepal, S., Ginman, K., et al. (2020). The effect of itraconazole on the pharmacokinetics of lorlatinib: results of a phase I, open-label, crossover study in healthy participants. Investig. New Drugs 38 (1), 131–139. doi:10.1007/s10637-019-00872-7
Picard, S., Titier, K., Etienne, G., Teilhet, E., Ducint, D., Bernard, M. A., et al. (2007). Trough imatinib plasma levels are associated with both cytogenetic and molecular responses to standard-dose imatinib in chronic myeloid leukemia. Blood 109 (8), 3496–3499. doi:10.1182/blood-2006-07-036012
Qian, C. Q., Zhao, K. J., Chen, Y., Liu, L., and Liu, X. D. (2019). Simultaneously predict pharmacokinetic interaction of rifampicin with oral versus intravenous substrates of cytochrome P450 3A/P-glycoprotein to healthy human using a semi-physiologically based pharmacokinetic model involving both enzyme and transporter turnover. Eur. J. Pharm. Sci. 134, 194–204. doi:10.1016/j.ejps.2019.04.026
Recondo, G., Mezquita, L., Facchinetti, F., Planchard, D., Gazzah, A., Bigot, L., et al. (2020). Diverse resistance mechanisms to the third-generation ALK inhibitor lorlatinib in ALK-rearranged lung cancer. Clin. Cancer Res. 26 (1), 242–255. doi:10.1158/1078-0432.CCR-19-1104
Reddy, M. B., Bolger, M. B., Fraczkiewicz, G., Del Frari, L., Luo, L., Lukacova, V., et al. (2021). PBPK modeling as a tool for predicting and understanding intestinal metabolism of uridine 5'-Diphospho-glucuronosyltransferase substrates. Pharmaceutics 13 (9), 1325. doi:10.3390/pharmaceutics13091325
Sabari, J. K., Santini, F. C., Schram, A. M., Bergagnini, I., Chen, R., Mrad, C., et al. (2017). The activity, safety, and evolving role of brigatinib in patients with ALK-rearranged non-small cell lung cancers. Onco Targets Ther. 10, 1983–1992. doi:10.2147/OTT.S109295
Saeheng, T., Na-Bangchang, K., Siccardi, M., Rajoli, R. K. R., and Karbwang, J. (2020). Physiologically-based pharmacokinetic modeling for optimal dosage prediction of quinine coadministered with ritonavir-boosted lopinavir. Clin. Pharmacol. Ther. 107 (5), 1209–1220. doi:10.1002/cpt.1721
Schwenger, E., Reddy, V. P., Moorthy, G., Sharma, P., Tomkinson, H., Masson, E., et al. (2018). Harnessing meta-analysis to refine an oncology patient population for physiology-based pharmacokinetic modeling of drugs. Clin. Pharmacol. Ther. 103 (2), 271–280. doi:10.1002/cpt.917
Seto, T., Kiura, K., Nishio, M., Nakagawa, K., Maemondo, M., Inoue, A., et al. (2013). CH5424802 (RO5424802) for patients with ALK-rearranged advanced non-small-cell lung cancer (AF-001JP study): a single-arm, open-label, phase 1-2 study. Lancet Oncol. 14 (7), 590–598. doi:10.1016/S1470-2045(13)70142-6
Shaw, A. T., Felip, E., Bauer, T. M., Besse, B., Navarro, A., Postel-Vinay, S., et al. (2017). Lorlatinib in non-small-cell lung cancer with ALK or ROS1 rearrangement: an international, multicentre, open-label, single-arm first-in-man phase 1 trial. Lancet Oncol. 18 (12), 1590–1599. doi:10.1016/S1470-2045(17)30680-0
Shaw, A. T., Yeap, B. Y., Solomon, B. J., Riely, G. J., Gainor, J., Engelman, J. A., et al. (2011). Effect of crizotinib on overall survival in patients with advanced non-small-cell lung cancer harbouring ALK gene rearrangement: a retrospective analysis. Lancet Oncol. 12 (11), 1004–1012. doi:10.1016/S1470-2045(11)70232-7
Singh, A., and Chen, H. (2020). Optimal care for patients with anaplastic lymphoma kinase (ALK)–Positive non–small cell lung cancer: a review on the role and utility of ALK inhibitors. Cancer Manag. Res. 12, 6615–6628. doi:10.2147/CMAR.S260274
Song, Z., Wang, M., and Zhang, A. (2015). Alectinib: a novel second generation anaplastic lymphoma kinase (ALK) inhibitor for overcoming clinically-acquired resistance. Acta Pharm. Sin. B 5 (1), 34–37. doi:10.1016/j.apsb.2014.12.007
Stypinski, D., Fostvedt, L., Lam, J. L., Vaz, A., Johnson, T. R., Boerma, J. S., et al. (2020). Metabolism, excretion, and pharmacokinetics of lorlatinib (PF-06463922) and evaluation of the impact of radiolabel position and other factors on comparability of data across 2 ADME studies. J. Clin. Pharmacol. 60 (9), 1254–1267. doi:10.1002/jcph.1621
Sun, S., Pithavala, Y. K., Martini, J. F., and Chen, J. (2022). Evaluation of lorlatinib cerebrospinal fluid concentrations in relation to target concentrations for anaplastic lymphoma kinase (ALK) inhibition. J. Clin. Pharmacol. 62 (9), 1170–1176. doi:10.1002/jcph.2056
Syed, Y. Y. (2019). Lorlatinib: first global approval. Drugs 79 (1), 93–98. doi:10.1007/s40265-018-1041-0
Tang, S. C., Nguyen, L. N., Sparidans, R. W., Wagenaar, E., Beijnen, J. H., and Schinkel, A. H. (2014). Increased oral availability and brain accumulation of the ALK inhibitor crizotinib by coadministration of the P-glycoprotein (ABCB1) and breast cancer resistance protein (ABCG2) inhibitor elacridar. Int. J. Cancer 134 (6), 1484–1494. doi:10.1002/ijc.28475
Thandra, K. C., Barsouk, A., Saginala, K., Aluru, J. S., and Barsouk, A. (2021). Epidemiology of lung cancer. Contemp. Oncol. Pozn. 25 (1), 45–52. doi:10.5114/wo.2021.103829
Trevor, N., Johnson, K. B., Rowland-Yeo, K., Tucker, G. T., and Rostami-Hodjegan, A. (2010). A semi-mechanistic model to predict the effects of liver cirrhosis on drug clearance. Clin. Pharmacokinet. 49 (3), 189–206. doi:10.2165/11318160-000000000-00000
Wang, G., Ji, Y., Li, X., Wang, Q., Gong, H., Wang, B., et al. (2019). Utilizing the combination of binding kinetics and micro-pharmacokinetics link in vitro α-glucosidase inhibition to in vivo target occupancy. Biomolecules 9 (9), 493. doi:10.3390/biom9090493
Wu, C., Li, B., Meng, S., Qie, L., Zhang, J., Wang, G., et al. (2022). Prediction for optimal dosage of pazopanib under various clinical situations using physiologically based pharmacokinetic modeling. Front. Pharmacol. 13, 963311. doi:10.3389/fphar.2022.963311
Xu, H., O'Gorman, M., Boutros, T., Brega, N., Kantaridis, C., Tan, W., et al. (2015a). Evaluation of crizotinib absolute bioavailability, the bioequivalence of three oral formulations, and the effect of food on crizotinib pharmacokinetics in healthy subjects. J. Clin. Pharmacol. 55 (1), 104–113. doi:10.1002/jcph.356
Xu, H., O'Gorman, M., Tan, W., Brega, N., and Bello, A. (2015b). The effects of ketoconazole and rifampin on the single-dose pharmacokinetics of crizotinib in healthy subjects. Eur. J. Clin. Pharmacol. 71 (12), 1441–1449. doi:10.1007/s00228-015-1945-5
Xu, L., Yu, S., Liu, H., Yi, B., Wang, G., and Liu, Y. (2022). Physiologically based pharmacokinetic combined BTK occupancy modeling for optimal dosing regimen prediction of acalabrutinib in patients alone, with different CYP3A4 variants, co-administered with CYP3A4 modulators and with hepatic impairment. Eur. J. Clin. Pharmacol. 78 (9), 1435–1446. doi:10.1007/s00228-022-03338-7
Yamamoto, Y., Välitalo, P. A., Huntjens, D. R., Proost, J. H., Vermeulen, A., Krauwinkel, W., et al. (2017). Predicting drug concentration-time profiles in multiple CNS compartments using a comprehensive physiologically-based pharmacokinetic model. CPT Pharmacometrics Syst. Pharmacol. 6 (11), 765–777. doi:10.1002/psp4.12250
Yamazaki, S. (2013). Translational pharmacokinetic-pharmacodynamic modeling from nonclinical to clinical development: a case study of anticancer drug, crizotinib. AAPS J. 15 (2), 354–366. doi:10.1208/s12248-012-9436-4
Yamazaki, S., Johnson, T. R., and Smith, B. J. (2015). Prediction of drug-drug interactions with crizotinib as the CYP3A substrate using a physiologically based pharmacokinetic model. Drug Metab. Dispos. 43 (10), 1417–1429. doi:10.1124/dmd.115.064618
Yoda, S., Lin, J. J., Lawrence, M. S., Burke, B. J., Friboulet, L., Langenbucher, A., et al. (2018). Sequential ALK inhibitors can select for lorlatinib-resistant compound ALK mutations in ALK-positive lung cancer. Cancer Discov. 8 (6), 714–729. doi:10.1158/2159-8290.CD-17-1256
Zhao, D., Chen, J., Chu, M., Long, X., and Wang, J. (2020). Pharmacokinetic-based drug-drug interactions with anaplastic lymphoma kinase inhibitors: a review. Drug Des. Devel Ther. 14, 1663–1681. doi:10.2147/DDDT.S249098
Keywords: ALK inhibitors, PBPK model, ALK occupancy, optimal dosing regimen, concentration prediction in cerebrospinal fluid
Citation: Li B, Liu S, Feng H, Du C, Wei L, Zhang J, Jia G and Wu C (2023) Prediction of trough concentration and ALK occupancy in plasma and cerebrospinal fluid using physiologically based pharmacokinetic modeling of crizotinib, alectinib, and lorlatinib. Front. Pharmacol. 14:1234262. doi: 10.3389/fphar.2023.1234262
Received: 04 June 2023; Accepted: 07 November 2023;
Published: 22 November 2023.
Edited by:
Jean-François Ghersi-Egea, Institut National de la Santé et de la Recherche Médicale (INSERM), FranceReviewed by:
Melanie Felmlee, The University of the Pacific, United StatesCopyright © 2023 Li, Liu, Feng, Du, Wei, Zhang, Jia and Wu. This is an open-access article distributed under the terms of the Creative Commons Attribution License (CC BY). The use, distribution or reproduction in other forums is permitted, provided the original author(s) and the copyright owner(s) are credited and that the original publication in this journal is cited, in accordance with accepted academic practice. No use, distribution or reproduction is permitted which does not comply with these terms.
*Correspondence: Jie Zhang, amllemhhbmcxMjI0QDE2My5jb20=; Guangwei Jia, bGNoamd3QDE2My5jb20=; Chunnuan Wu, Y2h1bm51YW4ud3VAdG11LmVkdS5jbg==
†These authors have contributed equally to this work
Disclaimer: All claims expressed in this article are solely those of the authors and do not necessarily represent those of their affiliated organizations, or those of the publisher, the editors and the reviewers. Any product that may be evaluated in this article or claim that may be made by its manufacturer is not guaranteed or endorsed by the publisher.
Research integrity at Frontiers
Learn more about the work of our research integrity team to safeguard the quality of each article we publish.