 Xiushen Wang
 Jing Pan2,3†
 Qiutong Guan
 Ninghui Ren
 Zhenhua Li
94% of researchers rate our articles as excellent or good
Learn more about the work of our research integrity team to safeguard the quality of each article we publish.
Find out more
ORIGINAL RESEARCH article
Front. Pharmacol., 13 September 2023
Sec. Pharmacology of Anti-Cancer Drugs
Volume 14 - 2023 | https://doi.org/10.3389/fphar.2023.1215296
This article is part of the Research TopicNoncoding RNA in Disease: Diagnosis, Etiology, Progression, Prognosis and Treatment.View all 12 articles
Background: Bladder cancer (BCA) has high recurrence and metastasis rates, and current treatment options show limited efficacy and significant adverse effects. It is crucial to find diagnostic markers and therapeutic targets with clinical value. This study aimed to identify lactate metabolism-related lncRNAs (LM_lncRNAs) to establish a model for evaluating bladder cancer prognosis.
Method: A risk model consisting of lactate metabolism-related lncRNAs was developed to forecast bladder cancer patient prognosis using The Cancer Genome Atlas (TCGA) database. Kaplan‒Meier survival analysis, receiver operating characteristic curve (ROC) analysis and decision curve analysis (DCA) were used to evaluate the reliability of risk grouping for predictive analysis of bladder cancer patients. The results were also validated in the validation set. Chemotherapeutic agents sensitive to lactate metabolism were assessed using the Genomics of Drug Sensitivity in Cancer (GDSC) database.
Results: As an independent prognostic factor for patients, lactate metabolism-related lncRNAs can be used as a nomogram chart that predicts overall survival time (OS). There were significant differences in survival rates between the high-risk and low-risk groups based on the Kaplan‒Meier survival curve. decision curve analysis and receiver operating characteristic curve analysis confirmed its good predictive capacity. As a result, 22 chemotherapeutic agents were predicted to positively affect the high-risk group.
Conclusion: An lactate metabolism-related lncRNA prediction model was proposed to predict the prognosis for patients with bladder cancer and chemotherapeutic drug sensitivity in high-risk groups, which provided a new idea for the prognostic evaluation of the clinical treatment of bladder cancer.
Globally, bladder cancer (BCA) is the most common urological malignancy and requires lifelong monitoring after diagnosis (Dobruch and Oszczudłowski, 2021). Twenty to thirty percent of BCA patients have progressed to muscle-invasive BCA (MIBCA) when diagnosed (Fletcher et al., 2011). Nearly 50% of MIBCA patients develop tumor metastasis after radical cystectomy (RC). BCA is estimated to cause 356,000 new cases and 145,000 deaths yearly (Antoni et al., 2017). Consequently, the guidelines recommend treating MIBC with neoadjuvant chemotherapy (NAC) and RC (Milowsky et al., 2016). Approximately 50% of MIBCA patients cannot tolerate suppressive adverse events resulting from chemotherapy, leading to treatment delays in nonresponders (Hanna et al., 2018). To improve cancer patients’ clinical efficacy and prognosis, clarifying BCA pathogenesis and determining targets for diagnosis and treatment are imperative.
Urothelial BCA (UBCA) is one of the earliest cancers considered to have immunogenicity. With the FDA’s approval of immune checkpoint inhibitors (ICIs) and pan-FGFR inhibitors, PD-1/PD-L1 therapy has shown an impressive lasting response in UBCA patients. However, the response rate has been low (Eckstein et al., 2019). To maintain uncontrolled growth and proliferation, BCA may use aerobic glycolysis-dependent metabolism (the Warburg effect) as the primary energy source (Yang et al., 2011). High lactic acid levels and subsequent acidification caused by glycolytic metabolic transformation may promote carcinogenesis and contribute to invasion, immune escape, metastasis, and chemoradiotherapy resistance (Wang et al., 2020). In addition, the Warburg effect is a feature of MIBCA and nonmuscle invasive BCA (NMIBC) (Burns et al., 2021). A significant portion of the glucose storage is converted into lactic acid by lactate dehydrogenase-A (LDH-A), resulting in glucose being used to promote growth, regardless of oxygen levels (Kim et al., 2006). In vitro, overexpression of LDH-A promoted BCA proliferation, invasion, and migration by stimulating epithelial-mesenchymal transformation (EMT) (Jiang et al., 2016). The metabolic state of tumor cells influences their interactions with the tumor microenvironment (TME), which is crucial for antitumor immunity (Bader et al., 2020). As lactic acid levels increase in the TME, tumor-associated macrophages differentiate into M2 subtypes, while activated macrophages promote tumor invasion through the CCL17/CCR-4/Mtorc1 signaling axis (Zhang et al., 2021). Lactic acid derived from tumor cells induces GPR81 expression in dendritic cells through a paracrine mechanism, inhibiting immune cell antigen presentation (Brown et al., 2020). These reports suggest that an in-depth understanding of lactate metabolism in BCA will provide new opportunities to predict the disease life cycle and find targets for tumor immunotherapy.
A long noncoding RNA (lncRNA) is an RNA transcribed over 200 nucleotides without the capability to code for proteins. Various cancers, including BCA, can be initiated and progress at different levels, including epigenetic, transcriptional, and posttranscriptional regulation (Iyer et al., 2015). In BCA patients, overexpression of Aly/REF export factor (ALYREF) promotes cell proliferation through PKM2-mediated glycolysis and high expression of pyruvate kinase M2 (PKM2), and ALYREF predicts poor survival (Wang et al., 2021). The low expression of AlkB homolog 5 (ALKBH5) results in poor prognosis in BCA patients, inhibits progression in a m6A-dependent manner, and sensitizes BCA cells to cisplatin through the casein kinase 2 (CK2)α-mediated glycolytic pathway (Yu et al., 2020). Due to their regulatory influences on BCA metabolism, lncRNAs are considered potential targets for drug screening and are a promising area of research.
In recent years, using high-throughput sequencing and data analysis in biomedical research has become increasingly important in identifying biomarkers, predicting prognosis, and monitoring recurrence and stratification (Zhang et al., 2019). Many studies have used a variety of biomarkers to establish clinical patient diagnosis or prognosis prediction models (Liu et al., 2021). Many studies have focused on hypoxia modulating tumor immune responses, while lactate has mainly been ignored in BCA metabolism.
Herein, LM_lncRNAs were analyzed using bioinformatics, a prognostic model for BCA was established, chemotherapy-targeted drugs were explored based on lactate metabolism groups, and a prediction model was developed for the prognosis of BCA. This study may benefit the innovation of customized precision diagnosis and treatment strategies for BCA.
TCGA data are freely available to the public, and this study strictly follows access policies and publication guidelines. BCA RNA expression data were downloaded from TCGA GDC’s official website (https://portal.gdc.cancer.gov/). A total of 408 BCA patients were evaluated for gene expression. This study included variables such as the age and sex of the participants, American Joint Committee on Cancer (AJCC) stage, histological grade, and survival rate. We excluded 11 samples of BCA patients with OS< 30 days and one sample without OS recorded. All remaining patients were included in our study. In this study, we included 397 patient samples and 19 paracancerous samples (Table 1). To select mRNAs with a p-value less than 0.05, fragments per kilobase million (FPKM) were converted into transcripts per million (TPM). The Molecular Signatures Database (MSigDB) contains a gene set related to lactate (Hallmark-lactate) (Liberzon et al., 2015).
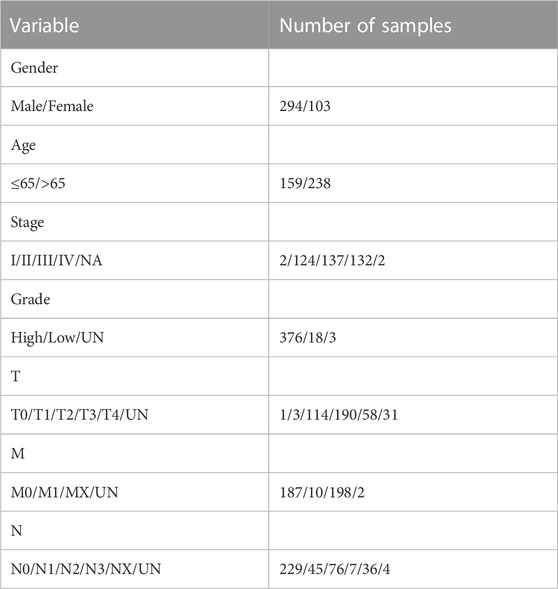
TABLE 1. The clinical characteristics of patients in the TCGA dataset
Our screening procedure used a |log2FC| > 1 and a false discovery rate (FDR) < 0.05. The limma package was also used to identify all differentially expressed lncRNAs (Ritchie et al., 2015). It was determined whether there was a relationship between the LM_mRNAs in the sample and all lncRNAs differentially expressed data calculated by Pearson correlation. A correlation was demonstrated if |R2| > 0.3 and p < 0.001.
Based on univariate Cox analysis, lncRNAs predict overall survival (OS) in BCA patients. Afterward, we selected lncRNAs with independent prognostic characteristics using multivariate Cox regression. In this study, we selected lncRNAs that are independent prognostic factors for patient survival using the survminer software package. The regression coefficient of the multivariate Cox regression model was multiplied by the linear combination of expression levels to generate a prognostic risk score based on LM_lncRNAs.
This model can be expressed as follows:
In this formula, Expi is the expression level of each prognostic lncRNA, and the coefficient is βi. Furthermore, patients were divided into high-risk and low-risk groups based on the median lactate-related risk scores calculated by the formula above. Kaplan‒Meier survival curves, receiver operating characteristic curves (ROCs), and C-indices were used to predict patient outcomes and decision curve analysis (DCA).
The TCGA dataset (dataset 1) contains 393 patients divided into two subgroups based on random selection. There were 197 patients in validation set 1 and 196 in validation set 2 (dataset 2). TCGA datasets were analyzed, prognostic features were identified, and the model’s performance was validated in 2 datasets, validation sets 1 and 2. Having validated the prognostic value of lncRNA models based on the LM_lncRNA signature, we validated its impact on survival outcomes in BCA patients. The OS effects of prognostic factors were compared between high-risk and low-risk patients using log-rank tests and Kaplan‒Meier survival curves. To evaluate the accuracy of the immune profile derived from the survival ROC software package, we calculated the area under the curve (AUC) using time-dependent ROC curves.
Using Cytoscape, we constructed a correlation network between mRNAs and lncRNAs. With the help of the R software package ggalluvial, we analyzed the relationship between lncRNAs and risk.
Separate gene expression analyses were conducted for high- and low-risk groups related to lactate metabolism (Subramanian et al., 2005). With an FDR q-value <0.25, the difference was considered statistically significant. To estimate the OS of patients at 1, 3, and 5 years, we constructed a Norman diagram and calibrated the statistics using the RMS package. After a calibration curve was developed, statistically significant values (p < 0.05) were calculated and compared with patient predictions at the 3- and 5-year marks.
Infiltration of immune cells in tumors in the high-risk and low-risk groups was estimated using the ESTIMATE algorithm (Yoshihara et al., 2013). Identifying immune checkpoints and m6A modification enabled quantification of immune function in high- and low-risk populations.
Every patient with BCA can be predicted to respond to chemotherapy using the Genomics of Cancer Drug Sensitivity database (GDSC) (Yang et al., 2013). The GDSC database predicts chemosensitivity in patients with two types of BCA. A half-maximum inhibitory concentration (IC50) was predicted using ridge regression in the “pRRophetic” package (Geeleher et al., 2014). Ten cross-validations are conducted to calculate accuracy.
R software was used for all data analysis and visualization (version 4.1.2). If the distribution of the groups was not expected or the variance was unknown, Wilcoxon rank-sum tests or Kruskal‒Wallis tests were used to compare them. Cox regression analysis was conducted on both the univariate and multivariate data. Survival differences were assessed using log-rank tests. We assessed the sensitivity and specificity of BCA prognosis and other clinicopathological features by calculating ROC curves and C-indices. The statistics were considered significant if p < 0.05.
In Figure 1, a flow chart describes this study in more detail.
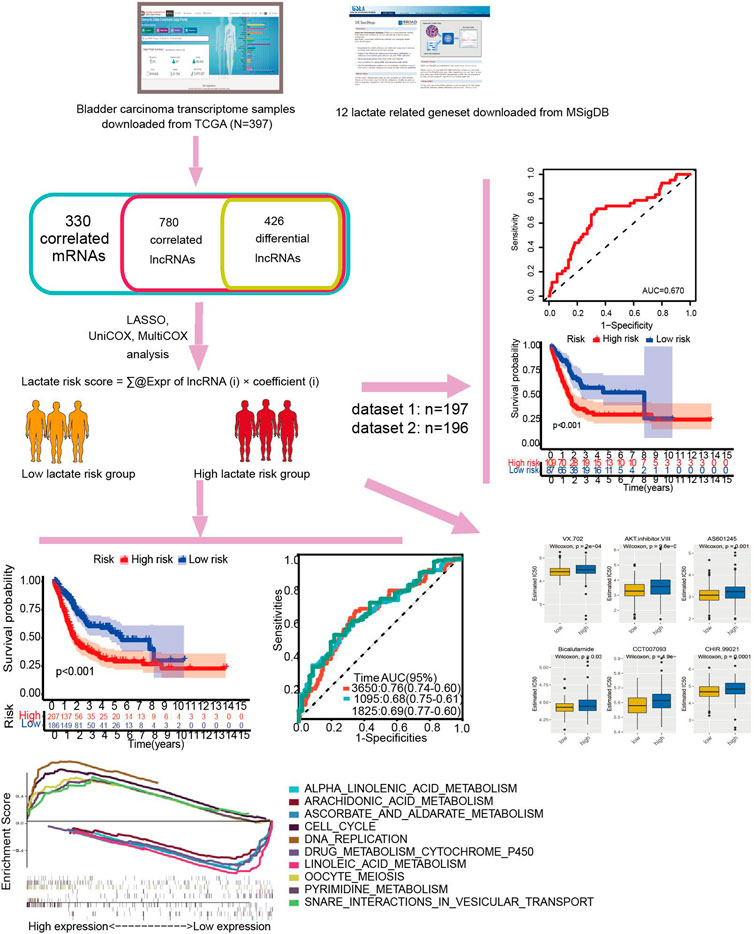
FIGURE 1. Study flowchart. Three hundred thirty lactate-related mRNAs and 780 related lncRNAs (LRLs) were obtained from the TCGA and MSigDB databases. Then, 426 lactate-related differentially expressed lncRNAs (LDELs) were identified according to their differential expression in the tumor and adjacent tumor. Next, univariate Cox, Lasso, and multivariate Cox analyses were applied to screen for prognostic LDELs. Based on this analysis, a 5-LDEL signature was constructed. Subsequently, GSEA analyses, immune-related analyses, m6A-related analyses, and drug sensitivity assays were applied to identify the potential function of this signature. Finally, 2 internal validations were conducted to explore the expression and function of these LDELs.
Twelve GSEA gene sets were related to lactate metabolism in the MSigDB database, and all of the lncRNAs were extracted, totaling 330. A total of 306 lncRNAs were enriched for lactate metabolism-related pathways after intersection processing with the entire gene set of the sample. Based on the Pearson correlation between mRNAs and lncRNAs in BCA, we screened lncRNAs significantly associated with lactate metabolism. We obtained 780 candidate gene expression data of lncRNAs with the criteria of |R2| > 0.3 and p < 0.001 (Supplementary Table S2, S3). Among them, 548 lncRNAs were overexpressed, and 232 lncRNAs were downregulated. A total of 426 differential lncRNAs were identified with p < 0.05 and |log2 FC| > 1 criteria. The heatmap and volcano map of the different analyses are shown in Figures 2A,B.
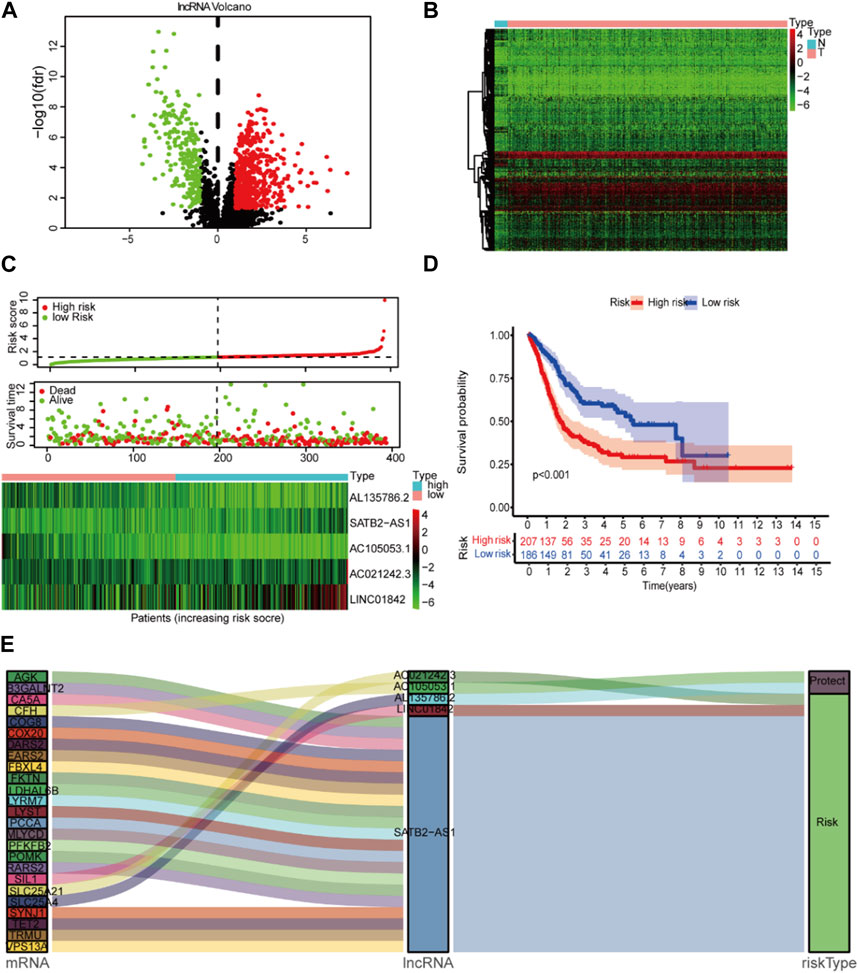
FIGURE 2. Lactate signature construction. (A) Volcano map for differentially expressed lncRNAs. (B) Heatmap for differentially expressed lncRNAs. (C) Risk score distribution and survival status of the two risk groups. (D) Kaplan‒Meier curve analysis (K-M curve analysis) for the cohort. (E) The Sankey diagram presents the detailed connection between lactate-related lncRNAs and lactate-related genes.
This study included 397 BCA patients and 306 LM_lncRNAs in the TCGA cohort to determine prognostic risk models. The association between survival and LM_lncRNAs was determined by univariate Cox regression analysis. As a result, when the p < 0.05, we found seven lncRNAs significantly associated with OS in BCA patients. Figure 2C shows the prediction model constructed from five lncRNAs as the result of multivariate stepwise Cox regression analysis. A prognostic model based on LM_lncRNA was developed by dividing patients into two categories based on median risk scores. Compared to the low-risk group, the high-risk group had a shorter mortality and survival time (Figure 2D).
A prognostic risk score formula composed of these five lncRNAs is as follows:
In Cox regression analysis, three of these LM_lncRNAs, SATB2-AS1, AC021242.3, and LINC01842, showed positive coefficients, suggesting that their high expression is associated with poorer OS. While the coefficients of AC105053.1 and AL135786.2 were negative, the Sankey diagram indicated that this lncRNA was protective (Figure 2E).
An analysis of clinicopathological manifestations and LM_lncRNA prognostic features was conducted using a heatmap. Meanwhile, the 1-year AUC of this signature lncRNA was 0.681, and the 5-year AUC was 0.691, which was superior to standard clinicopathological features in predicting BCA prognosis (Figures 3A,B). Over the 3-, 5-, and 10-year periods, the survival ROCs were 0.67, 0.68, and 0.69, indicating that the predictive ability of the model was still good after 10 years (Figure 3C). As shown by DCA, the model had good profitability based on its C-index of 0.648 (Figure 3D).
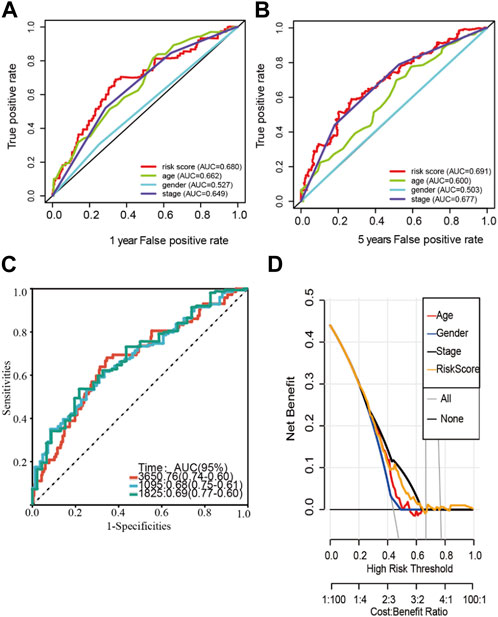
FIGURE 3. Stability verification of the lactate-related lncRNA signature model in the training cohort. (A-B) The 1-year AUC of this signature lncRNA was 0.681, and the 5-year AUC was 0.691. (C) The predicted 3-, 5-, and 10-year survival receiver operating characteristic (ROC) curves of the new lncRNA features were 0.67, 0.68, and 0.69, respectively. (D) The model’s decision curve analysis (DCA) also shows that the model has good profitability.
To validate the LM_lncRNA signature, its prognostic accuracy was further evaluated in an independent cohort. These two validation datasets were also downloaded from the TCGA database. Moreover, the data of “Dataset 2” and “Dataset 3” were randomly selected from the 397 patients obtained in the initial part of the present study. Two validation sets were randomly selected: validation set 1 (dataset 2: 197) and validation set 2 (dataset 3: 196). Low-risk patients had significantly longer survival, as evaluated by the ROC curve, with areas of 0.670 and 0.702 (Figures 4A,B) and the validation cohorts (Figures 4C,D), respectively.
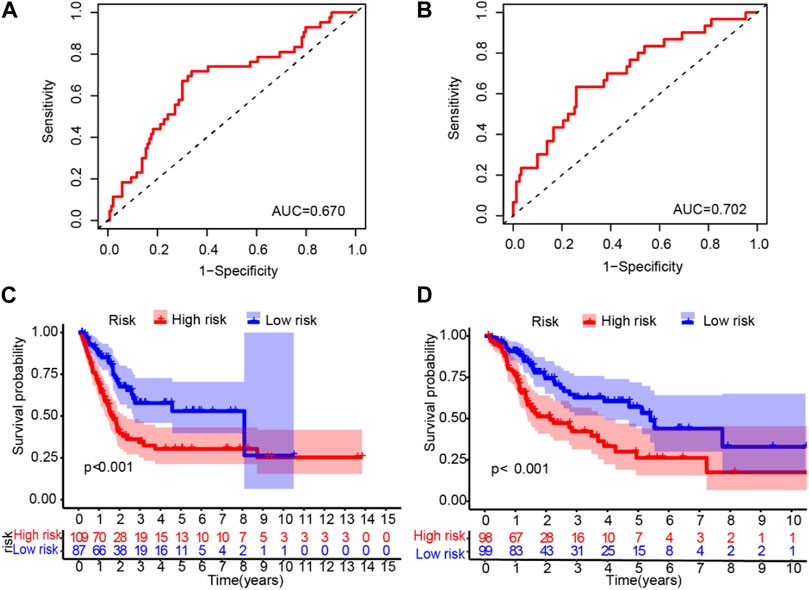
FIGURE 4. ROC validation and Kaplan‒Meier curve analysis for the lactate-related lncRNA signature. (A-B) The ROC areas were 0.670 and 0.702 in validation sets 1 (dataset 2: n = 197) and 2 (dataset 3: 196), respectively. (C–D) Prolonged OS in low-risk versus high-risk patients in both validation cohorts (log-rank test, p < 0.001).
According to univariate and multivariate regression analyses, BCA was an independent prognostic factor (Figures 5A,B). Figure 4C shows the nomogram derived from the five LM_lncRNAs. The mixed nomogram (Figure 5D) combining clinicopathological features and prognostic factors of LM_lncRNAs coupled with the 5-year calibration curve could be applied stably and accurately to treat BCA patients (Figure 5E).
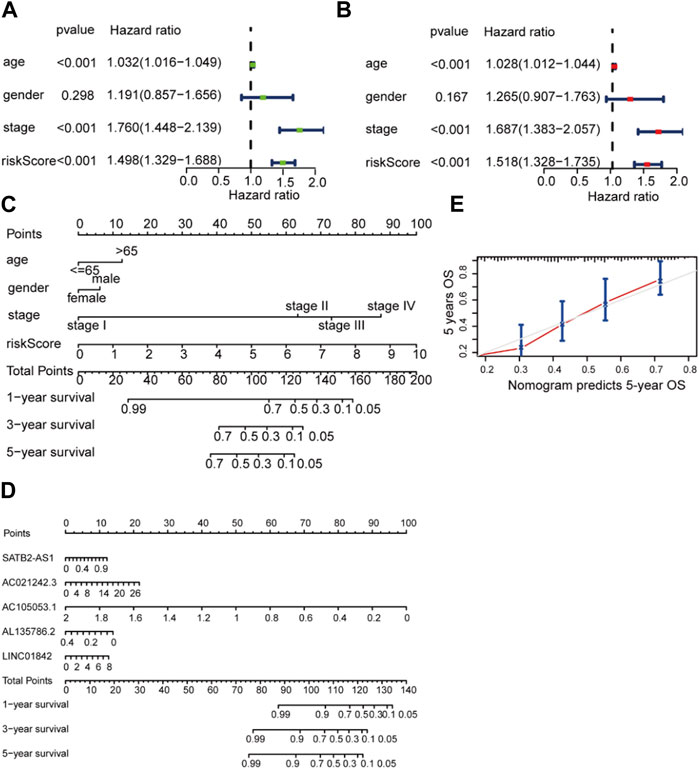
FIGURE 5. Independent prognostic value of the LDEL risk model. (A, B) Univariate (A) and multivariate Cox (B) analyses in the training cohort. (C) A nomogram for the lactate lncRNA signature. (D) A nomogram for both prognostic lactate lncRNAs and pathological factors. (E) C-index analysis of the nomogram.
In low- and high-risk individuals, GSEA identified pathways enriched with differentially expressed lncRNAs. According to these findings, LM_lncRNAs play a central role in cell cycle regulation, oocyte meiosis, pyrimidine metabolism, and DNA replication. Low-risk individuals showed higher steroid hormone biosynthesis, retinol metabolism, and linoleic acid oxidation (Figure 6A).
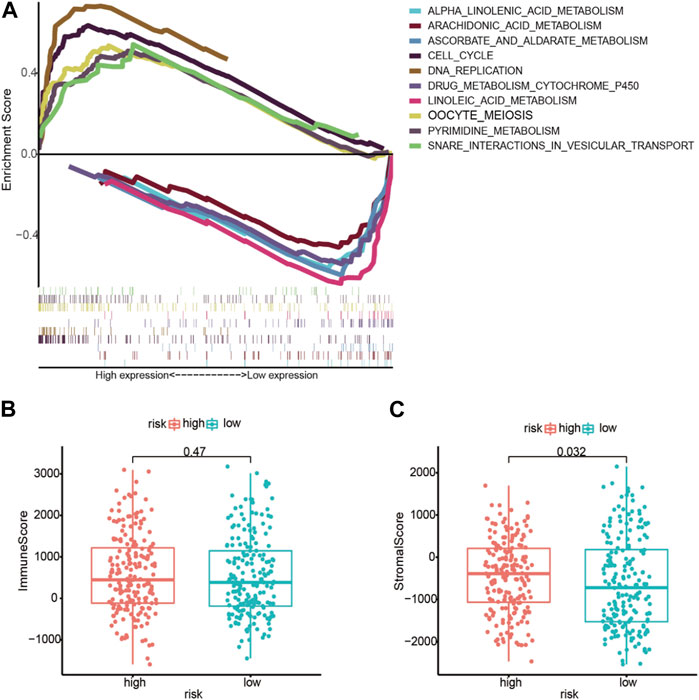
FIGURE 6. (A) Enrichment of genes in the representative pathways by GSEA function analysis. (B) Immune scores for the high-risk and low-risk groups. (C) The stromal score for the high-risk and low-risk groups.
Based on immune scores, no significant differences were found between the high- and low-risk groups. In the high-risk group, stromal scores were significantly different from those in the low-risk group; moreover, as shown in Figures 6B,C, immune infiltration of the matrix was significantly different in the high-risk group. As immune checkpoint inhibitors are a critical component of immunotherapy, we explored differences between groups in immune checkpoint expression. HNRNPA2B1, HNRNPC, IGF2BP2, IGF3, ALKBH5, and YTHDF2 were significantly different between the high-risk and low-risk groups in terms of m6A modification (Figure 7A). The two patient groups expressed significantly different levels of lncRNAs, such as TNFRSF18, TNFRSF14, TNFRSF9, TNFRSF8, TNFSF4, HAVCR2, LAG3, LGALS9, SIGLEC15, SIGLEC9, SIGLEC7, and LAIR1 (Figure 7B). According to the results of the Pearson correlation calculation in the previous section, with |R2| > 0.3 and p < 0.001 as the correlation criteria, to identify independent prognostic factors for LM_mRNAs, a network diagram was drawn (Figure 7C).
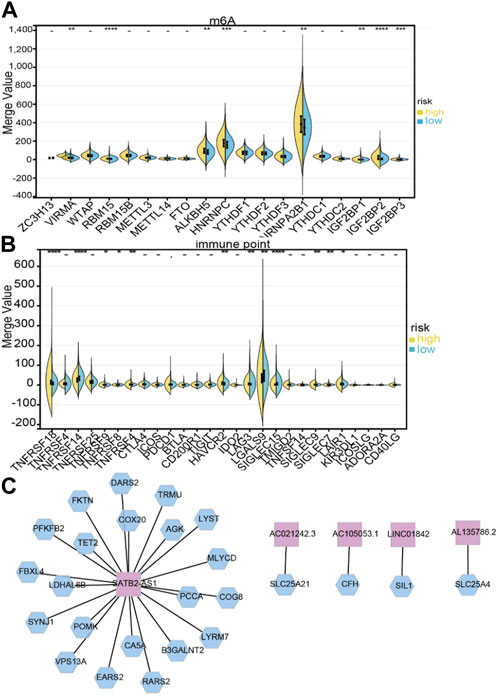
FIGURE 7. Correlation between LDELs and immunometabolic modification. (A) Expression of m6A genes between high- and low-risk subgroups (−p ≥ 0.1, ·p < 0.1, *p < 0.05, **p < 0.01, ***p < 0.001, ****p < 0.0001). (B) Distribution of immune checkpoints between the high- and low-risk subgroups. (C) Protein‒protein interaction (PPI) network of 5 LDELs and lactate metabolism genes.
We utilized the GDSC website to assess the outcome considering that chemotherapy resistance directly affects patient outcomes. Furthermore, we assessed the response of the two subgroups to chemotherapeutic agents using the GDSC cell line dataset (Figure 8). A total of 22 drugs were found to be more sensitive to high-risk subtypes, increasing a patient’s prognosis when chemotherapy drugs were used on patients with high-risk subtypes Table 1. The above results can help to screen for more suitable chemotherapy drugs for precise treatment. Several specific targeted therapeutic drugs with the smallest IC50, such as AKT inhibitor VIII, AS601245, axitinib, FH535, MG.132, MS.275, and PD.0332991, have more significant potential to be developed into a high-risk group for the treatment of BCA.
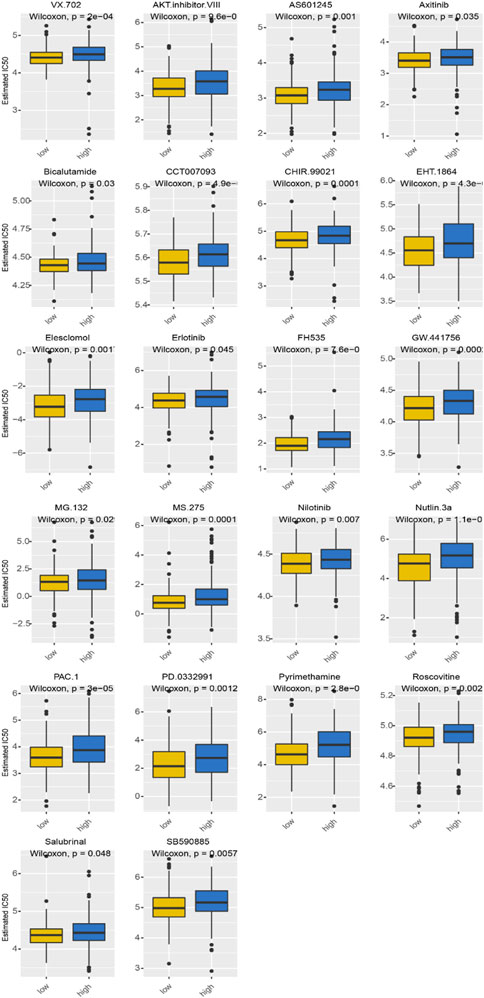
FIGURE 8. Comparative analysis of chemotherapy drugs with good efficacy in the high-risk group.
BCA has a poor prognosis partly because of the lack of an effective early diagnosis. The clinical diagnosis of BCA mainly relies on cystoscopy biopsy and urine cytology. Cystoscopic biopsy is invasive and expensive, and urine cytology is less sensitive for identifying early low-grade BCA (Lokeshwar et al., 2005). Moreover, due to the lack of sensitivity and specificity of diagnosis, a series of BCA-related biomarkers (such as nuclear matrix protein, bladder tumor antigen, and cytokeratin) have limited application value in the early detection of BCA (Chao et al., 2001). Therefore, developing new biomarkers with high sensitivity and specificity is critical for the early diagnosis and prognostic analysis of UBCA.
The study of this type of UBCA, its molecular mechanism, and the prognosis of MIBCA patients is essential for the prognosis of this type of UBCA. This study first used TCGA and MSigDB data to confirm the LM_mRNAs further screened by correlation analysis. Recent reports indicated that patient data in TCGA with follow-up times <30 days or OS < 30 days were excluded (Dai et al., 2021; Fang et al., 2021; Li et al., 2021). We performed the analysis in the present study according to such a modality.To identify differentially expressed lncRNAs, we conducted a differential analysis on the lncRNAs above. Univariate and multivariate analyses identified LM_lncRNAs that might be independent risk factors for UBCA. This study screened five differentially expressed lncRNAs: SATB2-AS1, AC021242.3, LINC01842, AC105053.1, and AL135786.2. SATB2-AS1, an inhibitor of microRNA155-3p, regulates the migration and proliferation of breast cancer cells (Liu et al., 2017). Studies of SATB2-AS1 in colon tumors demonstrated that it could regulate SATB2 to affect the colon tumor microenvironment (Xu et al., 2019). The lncRNA SATB2-AS1 regulates the proliferation of lung cancer cells by coordinating with other lncRNAs (Lu et al., 2021). In previous studies on lung cancer-related lncRNAs, LINC01842 was considered to regulate lung cancer cell proliferation in a ceRNA pattern with CASC8 and VPS9D1-AS1 (Dai et al., 2020). However, there are no reports on the expression and function of AC105053.1, AC021242.3, and AL135786.2 in tumors. Research on tumor and immune regulation and the TME has gradually become a hotspot in recent years. However, most of the research on the immune regulation-related mechanism of UBCA is limited to animal experiments and direct sequencing data. There needs to be in-depth research on the mechanism, especially the mechanism of lactic acid in UBCA (Conde et al., 2015). The expression levels of immune checkpoints are predictive biomarkers of immunotherapy response, showing broad potential for precision therapeutics. In metastatic UBCA, immunotherapy targeting suppressive immune checkpoints has often been used as a second-line therapy, but only 30% of patients respond to ICI immunotherapy (Lopez-Beltran et al., 2021). Earlier studies related to immunotherapy and pan-cancer research demonstrated that methylation played a critical role in immune cell infiltration (Guo et al., 2021). The process of m6A modification was proven to be the key to methylation (Ma et al., 2019). ALKBH5 regulates target gene splicing, leading to changes in lactate in the tumor microenvironment (Li et al., 2020). METTL3-mediated RNA m6A modification regulates lactate metabolism in the TME (Xiong. et al., 2022). We hypothesize that those with high lactate risk scores may benefit more from immunotherapy. In comparison to low-risk groups, high-risk groups exhibited significantly elevated levels of m6A modification, as well as TNFRSF18, HAVCR2, and LAG3, suggesting that these m6A modification suppressive agents may be considered for patients with a high lactate risk.
There were 22 drugs identified in the GDSC cell line dataset that were highly specific to the high-risk lactate group, which provides new targets for treating UBCA more precisely. By controlling aerobic glycolysis, overactivated PTEN/PI3K/Akt/mTOR promotes cancer metabolic conversion and tumor cell proliferation. AKT inhibitor VIII has been proven to protect gastric cancer cells, clear cell renal cell carcinoma, and breast cancer cells. AS601245, an anti-inflammatory JNK inhibitor, and clofibrate induce cell responses and alter gene expression profiles in Caco-2 colon cancer cells (Cerbone et al., 2012). In addition to inhibiting VEGFR1, VEGFR2, and VEGFR3, axitinib inhibits platelet-derived growth factor receptors and C-Kit. Treatment has been used for advanced renal cell carcinoma patients who have not responded to cytokines or tyrosine inhibitors.
Nevertheless, it is not used in the treatment of BCA. In vitro and in vivo, blocking the SDF-1/CXCR4/β-catenin axis inhibits the growth of BCA cells, but there are few related reports (Zhang et al., 2018). FH535, an inhibitor of the β-catenin pathway, inhibits the release of the proangiogenic cytokines vascular endothelial growth factor (VEGF), interleukin (IL)-6, IL-8, and TNF-α. It inhibits angiogenesis in vitro and in vivo (Liu et al., 2016). The proteasome inhibitor MG-132 inhibits mitochondrial-mediated intrinsic myocardial apoptosis and NF-κB-mediated inflammation, and less research has been done on cancer treatment. An investigation of MS-275, a potent cytotoxic HDACi selective for classes I/IV, in RMS xenograft models demonstrated modest antitumor activity alone and combined with standard chemotherapy (Cassandri et al., 2021). A selective CDK4/6 inhibitor, palbociclib, has shown outstanding results in phase II clinical trials in patients with estrogen receptor-positive HER2-negative breast cancer (Bollard et al., 2017).
Based on ROC analysis, DCA, and calibration curve analysis of the TCGA dataset, we identified a novel, efficient, and highly prognostic LM_lncRNA signature. LM_lncRNAs were found to act as independent predictors of OS in the TCGA database. Validation by random grouping within the dataset shows its effectiveness. In addition, 22 chemotherapeutic agents sensitive to the high-risk group were predicted, which could be used to treat tumors with tumor-related sensitive drugs. This study developed a new method for diagnosing and evaluating UBCA patients’ survival prognoses based on lactate metabolism.
The original contributions presented in the study are included in the article/Supplementary Material, further inquiries can be directed to the corresponding authors.
XW and JP conceived and designed the study and analyzed the data, QG, NR, and PW implemented the methodology, and drafted the manuscript. MW and ZL are involved in the conceptualization and constructive discussions, resources, writing review/editing, and funding support. All authors contributed to the article and approved the submitted version.
This work was supported by the grants from the High-level Talents Research Start-up Fund of the China Medical University (#1210619010) and the Double First-Class Scientific Research Fund of the China Medical University (#3110210603).
We are grateful for TCGA and GEO databases.
The authors declare that the research was conducted in the absence of any commercial or financial relationships that could be construed as a potential conflict of interest.
All claims expressed in this article are solely those of the authors and do not necessarily represent those of their affiliated organizations, or those of the publisher, the editors and the reviewers. Any product that may be evaluated in this article, or claim that may be made by its manufacturer, is not guaranteed or endorsed by the publisher.
The Supplementary Material for this article can be found online at: https://www.frontiersin.org/articles/10.3389/fphar.2023.1215296/full#supplementary-material
Antoni, S., Ferlay, J., Soerjomataram, I., Znaor, A., Jemal, A., and Bray, F. (2017). Bladder cancer incidence and mortality: A global overview and recent trends. Eur. Urol. 71 (1), 96–108. doi:10.1016/j.eururo.2016.06.010
Bader, J. E., Voss, K., and Rathmell, J. C. (2020). Targeting metabolism to improve the tumor microenvironment for cancer immunotherapy. Mol. Cell. 78 (6), 1019–1033. doi:10.1016/j.molcel.2020.05.034
Bollard, J., Miguela, V., Ruiz de Galarreta, M., Venkatesh, A., Bian, C. B., Roberto, M. P., et al. (2017). Palbociclib (PD-0332991), a selective CDK4/6 inhibitor, restricts tumour growth in preclinical models of hepatocellular carcinoma. Gut 66 (7), 1286–1296. doi:10.1136/gutjnl-2016-312268
Brown, T. P., Bhattacharjee, P., Ramachandran, S., Sivaprakasam, S., Ristic, B., Sikder, M. O. F., et al. (2020). The lactate receptor GPR81 promotes breast cancer growth via a paracrine mechanism involving antigen-presenting cells in the tumor microenvironment. Oncogene 39 (16), 3292–3304. doi:10.1038/s41388-020-1216-5
Burns, J. E., Hurst, C. D., Knowles, M. A., Phillips, R. M., and Allison, S. J. (2021). The Warburg effect as a therapeutic target for bladder cancers and intratumoral heterogeneity in associated molecular targets. Cancer Sci. 112 (9), 3822–3834. doi:10.1111/cas.15047
Cassandri, M., Pomella, S., Rossetti, A., Petragnano, F., Milazzo, L., Vulcano, F., et al. (2021). MS-275 (entinostat) promotes radio-sensitivity in PAX3-FOXO1 rhabdomyosarcoma cells. Int. J. Mol. Sci. 22 (19), 10671. doi:10.3390/ijms221910671
Cerbone, A., Toaldo, C., Pizzimenti, S., Pettazzoni, P., Dianzani, C., Minelli, R., et al. (2012). AS601245, an anti-inflammatory JNK inhibitor, and clofibrate have a synergistic effect in inducing cell responses and in affecting the gene expression profile in CaCo-2 colon cancer cells. PPAR Res. 2012, 269751. doi:10.1155/2012/269751
Chao, D., Freedland, S. J., Pantuck, A. J., Zisman, A., and Belldegrun, A. S. (2001). Bladder cancer 2000: Molecular markers for the diagnosis of transitional cell carcinoma. Rev. Urol. 3 (2), 85–93.
Conde, V. R., Oliveira, P. F., Nunes, A. R., Rocha, C. S., Ramalhosa, E., Pereira, J. A., et al. (2015). The progression from a lower to a higher invasive stage of bladder cancer is associated with severe alterations in glucose and pyruvate metabolism. Exp. Cell Res. 335 (1), 91–98. doi:10.1016/j.yexcr.2015.04.007
Dai, R., Zhou, Y., Chen, Z., Zou, Z., Liu, P., and Gao, X. (2020). The analysis of a ceRNA network and the correlation between lncRNA, miRNA, and mRNA in bladder cancer. Transl. Cancer Res. 9 (2), 869–881. doi:10.21037/tcr.2019.12.27
Dai, W., Xiao, Y., Tang, W., Li, J., Hong, L., Zhang, J., et al. (2021). Identification of an EMT-related gene signature for predicting overall survival in gastric cancer. Front. Genet. 12, 661306. doi:10.3389/fgene.2021.661306
Dobruch, J., and Oszczudłowski, M. (2021). Bladder cancer: Current challenges and future directions. Medicina 57 (8), 749. doi:10.3390/medicina57080749
Eckstein, M., Cimadamore, A., Hartmann, A., Lopez-Beltran, A., Cheng, L., Scarpelli, M., et al. (2019). PD-L1 assessment in urothelial carcinoma: a practical approach. Ann. Transl. Med. 7 (22), 690. doi:10.21037/atm.2019.10.24
Fang, J., Yang, Z., Xie, J., Li, Z., Hu, C., Yang, M., et al. (2021). Identification and validation of autophagy-related prognostic signature for head and neck squamous cell carcinoma. Transl. Oncol. 14 (7), 101094. doi:10.1016/j.tranon.2021.101094
Fletcher, A., Choudhury, A., and Alam, N. (2011). Metastatic bladder cancer: a review of current management. ISRN Urol. 2011, 545241. doi:10.5402/2011/545241
Geeleher, P., Cox, N., and Huang, R. S. (2014). pRRophetic: an R package for prediction of clinical chemotherapeutic response from tumor gene expression levels. PLoS One 9 (9), e107468. doi:10.1371/journal.pone.0107468
Guo, W., Tan, F., Huai, Q., Wang, Z., Shao, F., Zhang, G., et al. (2021). Comprehensive analysis of PD-L1 expression, immune infiltrates, and m6A RNA methylation regulators in esophageal squamous cell carcinoma. Front. Immunol. 12, 669750. doi:10.3389/fimmu.2021.669750
Hanna, N., Trinh, Q. D., Seisen, T., Vetterlein, M. W., Sammon, J., Preston, M. A., et al. (2018). Effectiveness of neoadjuvant chemotherapy for muscle-invasive bladder cancer in the current real world setting in the USA. Eur. Urol. Oncol. 1 (1), 83–90. doi:10.1016/j.euo.2018.03.001
Iyer, M. K., Niknafs, Y. S., Malik, R., Singhal, U., Sahu, A., Hosono, Y., et al. (2015). The landscape of long noncoding RNAs in the human transcriptome. Nat. Genet. 47 (3), 199–208. doi:10.1038/ng.3192
Jiang, F., Ma, S., Xue, Y., Hou, J., and Zhang, Y. (2016). LDH-A promotes malignant progression via activation of epithelial-to-mesenchymal transition and conferring stemness in muscle-invasive bladder cancer. Biochem. Biophys. Res. Commun. 469 (4), 985–992. doi:10.1016/j.bbrc.2015.12.078
Kim, J. W., Tchernyshyov, I., Semenza, G. L., and Dang, C. V. (2006). HIF-1-mediated expression of pyruvate dehydrogenase kinase: a metabolic switch required for cellular adaptation to hypoxia. Cell Metab. 3 (3), 177–185. doi:10.1016/j.cmet.2006.02.002
Li, J., Pu, K., Li, C., Wang, Y., and Zhou, Y. (2021). A novel six-gene-based prognostic model predicts survival and clinical risk score for gastric cancer. Front. Genet. 12, 615834. doi:10.3389/fgene.2021.615834
Li, N., Kang, Y., Wang, L., Huff, S., Tang, R., Hui, H., et al. (2020). ALKBH5 regulates anti-PD-1 therapy response by modulating lactate and suppressive immune cell accumulation in tumor microenvironment. Proc. Natl. Acad. Sci. U. S. A. 117 (33), 20159–20170. doi:10.1073/pnas.1918986117
Liberzon, A., Birger, C., Thorvaldsdóttir, H., Ghandi, M., Mesirov, J. P., and Tamayo, P. (2015). The Molecular Signatures Database (MSigDB) hallmark gene set collection. Cell Syst. 1 (6), 417–425. doi:10.1016/j.cels.2015.12.004
Liu, L., Zhi, Q., Shen, M., Gong, F. R., Zhou, B. P., Lian, L., et al. (2016). FH535, a β-catenin pathway inhibitor, represses pancreatic cancer xenograft growth and angiogenesis. Oncotarget 7 (30), 47145–47162. doi:10.18632/oncotarget.9975
Liu, Z., Sun, T., Zhang, Z., Bi, J., and Kong, C. (2021). An 18-gene signature based on glucose metabolism and DNA methylation improves prognostic prediction for urinary bladder cancer. Genomics 113 (1 2), 896–907. doi:10.1016/j.ygeno.2020.10.022
Lokeshwar, V. B., Habuchi, T., Grossman, H. B., Murphy, W. M., Hautmann, S. H., Hemstreet, G. P., et al. (2005). Bladder tumor markers beyond cytology: International Consensus Panel on bladder tumor markers. Urology 66 (6 1), 35–63. doi:10.1016/j.urology.2005.08.064
Lopez-Beltran, A., Cimadamore, A., Blanca, A., Massari, F., Vau, N., Scarpelli, M., et al. (2021). Immune checkpoint inhibitors for the treatment of bladder cancer. Cancers 13 (1), 131. doi:10.3390/cancers13010131
Lu, L., Liu, L. P., Zhao, Q. Q., Gui, R., and Zhao, Q. Y. (2021). Identification of a ferroptosis-related LncRNA signature as a novel prognosis model for lung adenocarcinoma. Front. Oncol. 11, 675545. doi:10.3389/fonc.2021.675545
Ma, S., Chen, C., Ji, X., Liu, J., Zhou, Q., Wang, G., et al. (2019). The interplay between m6A RNA methylation and noncoding RNA in cancer. J. Hemato. Oncol. 12 (1), 121. doi:10.1186/s13045-019-0805-7
Milowsky, M. I., Rumble, R. B., Booth, C. M., Gilligan, T., Eapen, L. J., Hauke, R. J., et al. (2016). Guideline on muscle-invasive and metastatic bladder cancer (European association of urology guideline): American society of clinical oncology clinical practice guideline endorsement. J. Clin. Oncol. 34 (16), 1945–1952. doi:10.1200/JCO.2015.65.9797
Ritchie, M. E., Phipson, B., Wu, D., Hu, Y., Law, C. W., Shi, W., et al. (2015). Limma powers differential expression analyses for RNA-sequencing and microarray studies. Nucleic Acids Res. 43 (7), e47. doi:10.1093/nar/gkv007
Subramanian, A., Tamayo, P., Mootha, V. K., Mukherjee, S., Ebert, B. L., Gillette, M. A., et al. (2005). Gene set enrichment analysis: a knowledge-based approach for interpreting genome-wide expression profiles. Proc. Natl. Acad. Sci. USA. 102 (43), 15545–15550. doi:10.1073/pnas.0506580102
Wang, J. X., Choi, S. Y. C., Niu, X., Kang, N., Xue, H., Killam, J., et al. (2020). Lactic acid and an acidic tumor microenvironment suppress anticancer immunity. Int. J. Mol. Sci. 21 (21), 8363. doi:10.3390/ijms21218363
Wang, J. Z., Zhu, W., Han, J., Yang, X., Zhou, R., Lu, H. C., et al. (2021). The role of the HIF-1α/ALYREF/PKM2 axis in glycolysis and tumorigenesis of bladder cancer. Cancer Commun. (Lond). 41 (7), 560–575. doi:10.1002/cac2.12158
Xiong, J., He, J., Zhu, J., Pan, J., Liao, W., Ye, H., et al. (2022). Lactylation-driven METTL3-mediated RNA m6A modification promotes immunosuppression of tumor-infiltrating myeloid cells. Mol. Cell 82 (9), 1660–1677.e10. doi:10.1016/j.molcel.2022.02.033
Yang, W., Soares, J., Greninger, P., Edelman, E. J., Lightfoot, H., Forbes, S., et al. (2013). Genomics of drug sensitivity in cancer (GDSC): a resource for therapeutic biomarker discovery in cancer cells. Nucleic Acids Res. 41, D955–D961. doi:10.1093/nar/gks1111
Yang, Y. F., Chuang, H. W., Kuo, W. T., Lin, B. S., and Chang, Y. C. (2011). Current development and application of anaerobic glycolytic enzymes in urothelial cancer. Int. J. Mol. Sci. 22 (19), 10612. doi:10.3390/ijms221910612
Yoshihara, K., Shahmoradgoli, M., Martínez, E., Vegesna, R., Kim, H., Torres-Garcia, W., et al. (2013). Inferring tumour purity and stromal and immune cell admixture from expression data. Nat. Commun. 4, 2612. doi:10.1038/ncomms3612
Yu, H., Yang, X., Tang, J., Si, S., Zhou, Z., Lu, J., et al. (2020). ALKBH5 inhibited cell proliferation and sensitized bladder cancer cells to cisplatin by m6A-ck2α-mediated glycolysis. Mol. Ther. Nucleic Acids 23, 27–41. doi:10.1016/j.omtn.2020.10.031
Zhang, A., Xu, Y., Xu, H., Ren, J., Meng, T., Ni, Y., et al. (2021). Lactate-induced M2 polarization of tumor-associated macrophages promotes the invasion of pituitary adenoma by secreting CCL17. Theranostics 11 (8), 3839–3852. doi:10.7150/thno.53749
Zhang, T., Yang, F., Li, W., Liu, B., Li, W., Chen, Z., et al. (2018). Suppression of the SDF-1/CXCR4/β-catenin axis contributes to bladder cancer cell growth inhibition in vitro and in vivo. Oncol. Rep. 40 (3), 1666–1674. doi:10.3892/or.2018.6546
Keywords: bladder cancer, lncRNAs, molecular subtype, prognostic model, lactate metabolism
Citation: Wang X, Pan J, Guan Q, Ren N, Wang P, Wei M and Li Z (2023) Identification of novel lactate metabolism-related lncRNAs with prognostic value for bladder cancer. Front. Pharmacol. 14:1215296. doi: 10.3389/fphar.2023.1215296
Received: 01 May 2023; Accepted: 31 August 2023;
Published: 13 September 2023.
Edited by:
Fernando De Andrés, University of Castilla La Mancha, SpainReviewed by:
Guoqing Liu, Inner Mongolia University of Science and Technology, ChinaCopyright © 2023 Wang, Pan, Guan, Ren, Wang, Wei and Li. This is an open-access article distributed under the terms of the Creative Commons Attribution License (CC BY). The use, distribution or reproduction in other forums is permitted, provided the original author(s) and the copyright owner(s) are credited and that the original publication in this journal is cited, in accordance with accepted academic practice. No use, distribution or reproduction is permitted which does not comply with these terms.
*Correspondence: Minjie Wei, bWp3ZWlAY211LmVkdS5jbg==; Zhenhua Li, bGl6aEBjbXUuZWR1LmNu
†These authors have contributed equally to this work
Disclaimer: All claims expressed in this article are solely those of the authors and do not necessarily represent those of their affiliated organizations, or those of the publisher, the editors and the reviewers. Any product that may be evaluated in this article or claim that may be made by its manufacturer is not guaranteed or endorsed by the publisher.
Research integrity at Frontiers
Learn more about the work of our research integrity team to safeguard the quality of each article we publish.