
95% of researchers rate our articles as excellent or good
Learn more about the work of our research integrity team to safeguard the quality of each article we publish.
Find out more
ORIGINAL RESEARCH article
Front. Pharmacol., 25 May 2023
Sec. Renal Pharmacology
Volume 14 - 2023 | https://doi.org/10.3389/fphar.2023.1181435
 Kuipeng Yu1,2,3
 Lin Ding1
 Xin An1Yanjiang Yang1Xiaoning Zhang4Luyao Li1Chunjie Wang1
 Fang Bai1
 Xiangdong Yang1,2*
Introduction: IgA nephropathy (IgAN) is the most common disease leading to end-stage renal disease, and tubular fibrosis represents an important risk factor for disease progression. However, research on early molecular diagnostic indicators of tubular fibrosis and the mechanisms underlying disease progression is still lacking.
Methods: The GSE93798 dataset was downloaded from the GEO database. DEGs were screened and analyzed for GO and KEGG enrichment in IgAN. The least absolute shrinkage and selection operator (LASSO) and support vector machine recursive feature elimination (SVM-RFE) algorithms were applied to screen for hub secretory genes. The expression and diagnostic efficacy of hub genes were confirmed by the GSE35487 dataset. ELISA was applied to detect the expression of APOC1 in serum. The expression and localization of hub genes in IgAN were verified by the expression of IHC and IF in human kidney tissues, and the correlation of expression with clinical data was verified in the Nephroseq database. Finally, cellular experiments clarified the role of hub genes in the signaling pathway.
Results: A total of 339 DEGs were identified in IgAN, of which 237 were upregulated and 102 downregulated. The KEGG signaling pathway is enriched in the ECM–receptor interaction and AGE-RAGE signaling pathway. APOC1, ALB, CCL8, CXCL2, SRPX2, and TGFBI identified six hub secretory genes using the LASSO and SVM-RFE algorithms. In vivo and in vitro experiments demonstrated that APOC1 expression was elevated in IgAN. The serum concentration of APOC1 was 1.232 ± 0.1812 μg/ml in IgAN patients, whereas it was 0.3956 ± 0.1233 μg/ml in healthy individuals. APOC1 exhibited high diagnostic efficacy for IgAN (AUC of 99.091%, specificity of 95.455%, and sensitivity of 99.141%) in the GSE93798 dataset. APOC1 expression negatively correlated with eGFR (R2 = 0.2285, p = 0.0385) and positively correlated with serum creatinine (R2 = 0.41, p = 0.000567) in IgAN. APOC1 exacerbated renal fibrosis, possibly in part by activating the NF-κB pathway in IgAN.
Conclusion: APOC1 was identified as the core secretory gene of IgAN, which was closely associated with blood creatinine and eGFR and had significant efficacy in the diagnosis of IgAN. Mechanistic studies revealed that the knockdown of APOC1 could improve IgAN renal fibrosis by inhibiting the NF pathway, which may be a potential therapeutic target for improving renal fibrosis in IgAN.
IgA nephropathy (IgAN) is the most common primary glomerulonephritis and is one of the main causes of end-stage renal disease (Jarrick et al., 2019). The pathogenesis of IgAN is complex; for example, the mucosal immune system (Gesualdo et al., 2021), activation of the complement system (Medjeral-Thomas et al., 2021), and immune inflammation (Kant et al., 2022) are closely related. However, the pathogenesis is still not sufficiently clear. The diagnosis of IgA nephropathy depends mainly on kidney tissue puncture biopsy, and there is no effective non-invasive diagnostic biomarker. In particular, bioinformatics has been extensively used for screening biomarkers and key target molecules in kidney diseases, such as diabetic nephropathy (Zhou et al., 2019; Gao et al., 2021), membranous nephropathy (Cai et al., 2022), and IgAN (Al Mehedi Hasan et al., 2022; Zhang et al., 2022a), which provided the potential for the identification of novel target molecules.
In recent years, machine learning algorithms, artificial intelligence, and other technologies have offered new approaches to a comprehensive understanding of the molecular mechanisms of IgAN (Bulow et al., 2021; Lin et al., 2022). Secretory genes are essential for the diagnosis and treatment of kidney diseases (Chebotareva et al., 2021). SVM-RFE is considered a supervised machine learning algorithm extensively applied to sorting characteristics and selecting genetic features (Li et al., 2022a). LASSO has been widely used for biomarker screening through regression analysis (Zhou et al., 2022). The common genes of LASSO and SVM-RFE are underlying hub genes for the diagnosis of IgAN and play an important role in the progression of the disease. This research synthetically used two machine learning algorithms to screen for secretory genes to identify IgA-specific serological diagnostic markers.
Transcriptome information for kidney tissues from control human (n = 22) and IgAN human (n = 20) kidneys was downloaded via the NCBI GEO database (GSE93798) (Liu et al., 2017). The transcriptome microarray platform information is GPL22945 (Affymetrix Human Genome U133 Plus 2.0). The methodology for screening DEGs and functional enrichment analysis of DEGs were described in a previous study (Yu et al., 2021).
Secreted protein data were downloaded from the HPA database (https://www.proteinatlas.org/), and the Venn diagram was performed using the Venny 2.1 online tool (https://bioinfogp.cnb.csic.es/tools/venny/index.html).
Support vector machine recursive feature elimination (SVM-RFE) and least absolute shrinkage and selection operator (LASSO) machine algorithms were used to identify candidate hub secretory diagnostic genes. “e1071” and “glmnet” packages were applied to SVM-RFE and LASSO algorithms for gene screening research in R software (Al Mehedi Hasan et al., 2022).
To validate the efficacy of the genes screened by the two machine algorithms for IgAN differentiation, we performed PCA of the hub genes and 3D spatial mapping using the “scatterplot3d” package.
We conducted a correlation analysis of core genes with clinical data (e.g., serum creatinine, estimated glomerular filtration rate, and urea nitrogen) using the Nephroseq database (https://www.nephroseq.org/resource/main.html).
We evaluated the diagnostic value of core genes for IgAN by performing hub gene ROC analysis with the software package “pROC.” AUC > 0.7 was considered diagnostically significant (Zhang et al., 2022a). Furthermore, GSE35487 was selected as an external dataset whose purpose was to validate the diagnostic efficacy of hub genes.
Human kidney puncture biopsy tissue was fixed with 4% paraformaldehyde and dehydrated followed by paraffin for kidney tissue fixation. Renal tissue was sectioned to 4 μm thickness using a tissue slicer (Leica, Germany). Hematoxylin–eosin (HE) stain kit (Solarbio, Beijing, China) was used for HE staining of kidney tissues, as described in the instructions. The study was approved by the Ethics Committee of Qilu Hospital, Shandong University (Approval No. KYLL-202111-230).
Human kidney tissue was subjected to Masson, IHC, and IF experiments, as described in a previous study (Yang et al., 2019; Li et al., 2022b). Antibodies and dilution concentrations are described as follows: APOC1 (Abcam, United States, 1:200 dilution), DyLight 488 (Abbkine, United States, 1:1,000, dilution), and DyLight 594 (Abbkine, United States, 1:1,000, dilution). Histochemical sections and Masson-stained kidney tissues were scanned in whole sections.
HK-2 cells were cultivated in RPMI-1640 (Gibco, Waltham, United States) containing 10% fetal bovine serum (FBS, Gibco) and 1% penicillin/streptomycin (Biotop, Beijing, China). HK-2 cells were stimulated using healthy and IgAN patient serum (500 μM). Small inference RNA was designed by Boshang Biotechnology Company to knock down APOC1. Additionally, plasmid-carrying APOC1 was designed by Boshang Biotechnology Company, which was transfected to overexpress APOC1. jetPRIME transfection reagent (Polyplus, France) was applied to conduct the transfection of HK-2 cells. Sequences of small inference RNA and plasmids are in the attached material.
The RNAfast200 kit (Fastagen, Shanghai, China) was applied to HK-2 cell mRNA extraction. SureScript™ First-Strand cDNA Synthesis Kit (GeneCopoeia, United States) was used for reversely transcribing into cDNAs. Real-time PCR experiments were performed using the SsoFast™ EvaGreen Supermix Kit (Bio-Rad, CA, United States) and Light-Cycler LC480 real-time PCR system (Roche, Basel, Switzerland). The RT-PCR reaction temperature was as previously described (Li et al., 2022b). The sequence is as follows: homo GAPDH: Forward 5′-GCACCGTCAAGGCTGAGAAC -3′, Reverse 5′-TGGTGAAGACGCCAGTGGA -3’; homo APOC1: forward 5′- CACACTGGAGGACAAGGCTC-3′, Reverse 5′- AAACCACTCCCGCATCTTGG-3’.
HK-2 cells were cultured in cellular six-well plates. Cellular proteins from different subgroups were extracted for WB electrophoresis as described in the previous research (Liu et al., 2022). The antibodies applied in this research are listed as follows: APOC1(Abcam, United States, 1:1,000 dilution), GAPDH (Proteintech Group, China, 1:4,000 dilution), a-SMA, vimentin, N-cadherin and E-cadherin (Proteintech Group, China, 1:1,000 dilution), NF-κB, and p-NF-κB (CST, USA, 1:1,000 dilution).
Sera from IgAN patients and healthy individuals were collected for the ELISA experiment. ELISA test kit was purchased from Abcam Company (United States, No. Ab108808). Experimental procedures are performed in the installation instructions.
Statistical analysis and graphics are based on R software (R 4.2.1). Student’s t-test was used to compare the two groups. p < 0.05 was defined as statistically significant, *p < 0.05, **p < 0.01, and ***p < 0.001.
A total of 22 healthy controls and 20 IgAN patients were enrolled in this research. We identified 339 DEGs, which contained 237 upregulated genes and 102 downregulated genes in IgAN (Table 1; Supplementary Tables S1, S2). The results are demonstrated by the volcano and heatmaps (Figures 1A, B). Furthermore, GO functional analysis of DEGs was conducted, and our research revealed significant correlations with the alpha-amino acid metabolic process, cellular amino acid metabolic process, and response to lipopolysaccharide (Figure 1C). The KEGG signaling pathway is enriched in the ECM–receptor interaction, AGE-RAGE signaling pathway in diabetic complications, and IL-17 signaling pathway (Figure 1D). The outcomes are summarized in Supplementary Tables S3, S4.
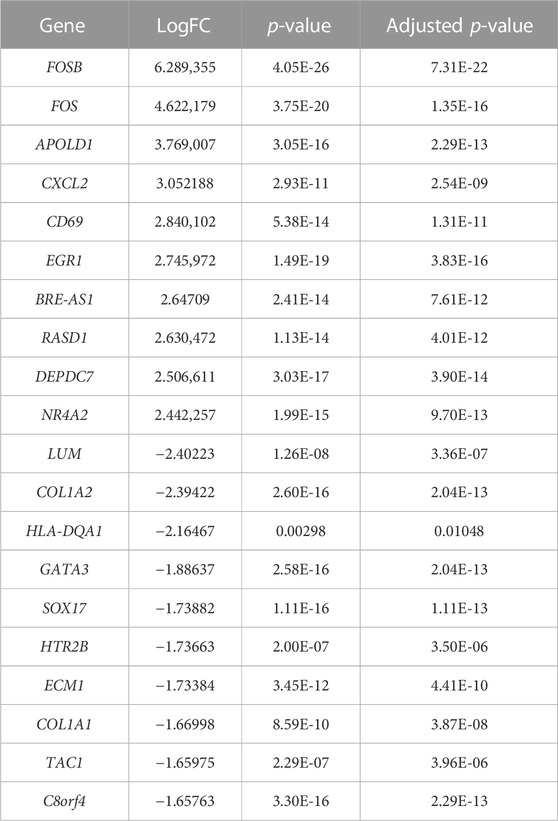
TABLE 1. Top 10 upregulated and downregulated genes identified in the gene expression microarray dataset (22 healthy controls vs. 20 IgAN patients).
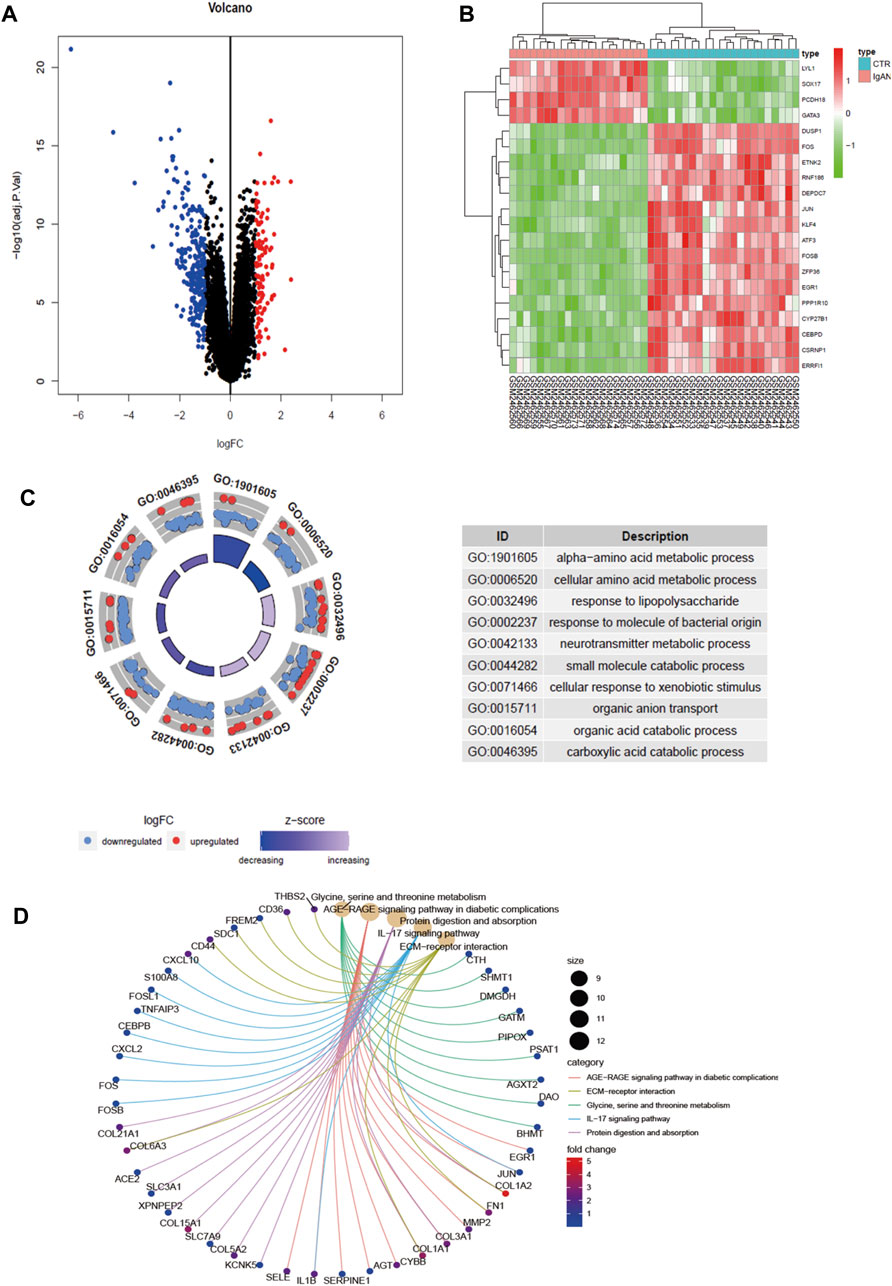
FIGURE 1. Differential gene screening and functional analysis in GSE93798. (A) Volcano exhibits between Ctrl and IgAN. (B) Heatmap demonstrating the top 20 DEGs. (C) GO enrichment analysis of DEGs. (D) KEGG enrichment analysis of DEGs. DEGs, differentially expressed genes; Ctrl (n = 22), control human kidney transcriptomic; IgAN (n = 20), IgAN human kidney transcriptomic.
The proteins secreted by human tissues are essential to understanding human biology and identifying potential targets for future diagnostics and therapy. Therefore, we detected 42 secreted genes among 339 DEGs (Figure 2A), and the 42 genes are illustrated in Figure 2B. SVM-RFE and LASSO algorithms have been applied to the screening of genes. In the SVM-RFE model, seven feature genes were identified: CXCL2, SRPX2, CCL8, APOC1, ALB, TGFBI, and HBEGF (Figures 2C, D). Within LASSO models, tenfold cross-validation was performed with 11 characteristic genes: ALB, APOC1, APOM, CCL8, CXCL2, ERAP2, ESM1, GDF15, SDC1, SRPX2, and TGFBI (Figures 2E, F). The results are summarized in Supplementary Tables S5–S7.
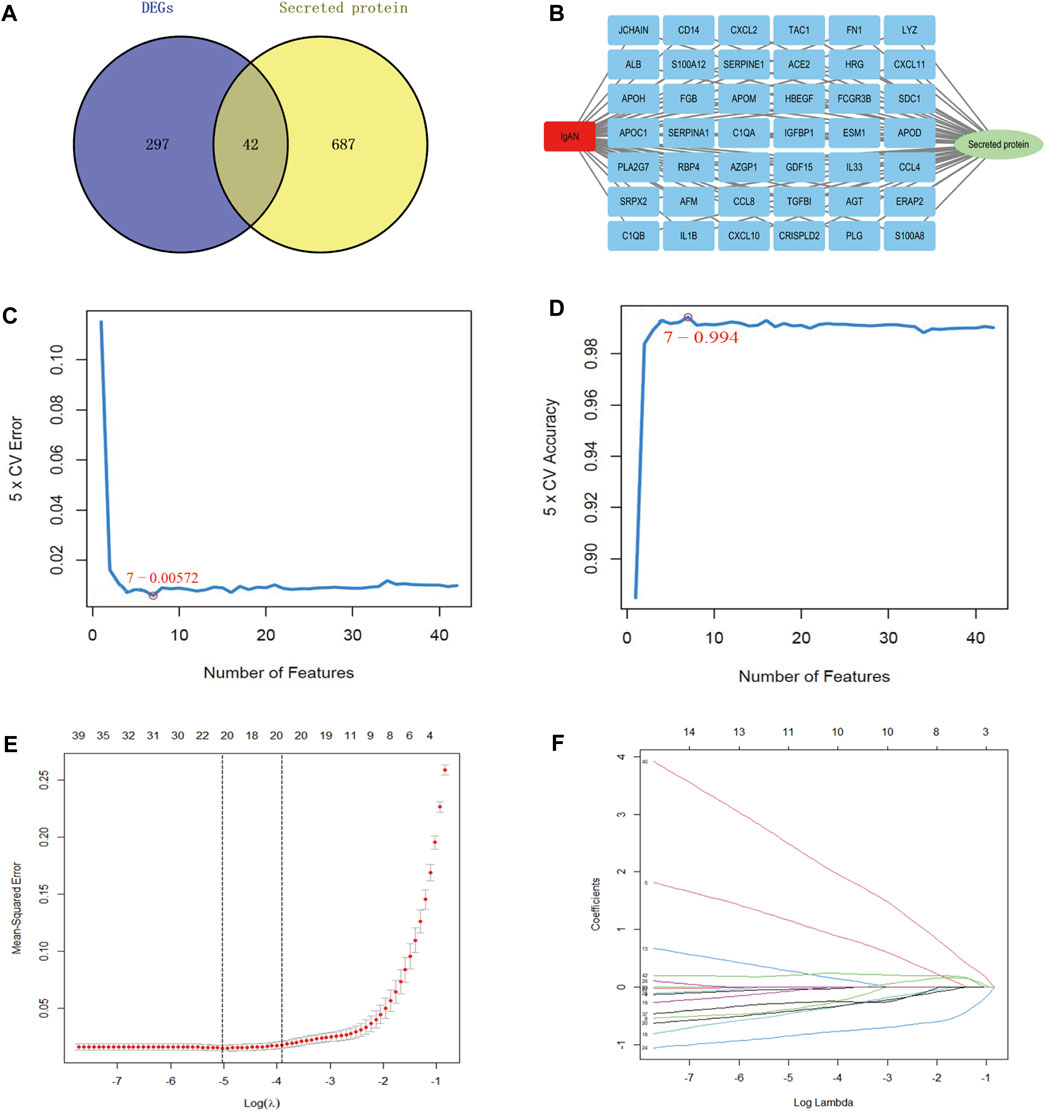
FIGURE 2. Screening of hub secretory genes using the SVM-RFE and LASSO algorithms. (A) Venn diagram demonstrating secreted genes in DEGs. (B) Exhibition of 42 hub secretory genes in IgAN. (C, D) LASSO analysis screens for IgAN diagnostic biomarkers in core secretory genes. (E, F) SVM-RFE machine learning screening for secretory IgAN diagnostic biomarkers.
Regarding the results of the two algorithms, after taking the intersection, we identified six hub secretory genes. APOC1, ALB, CCL8, CXCL2, SRPX2, and TGFBI are illustrated in the Venn diagram (Figure 3A). To verify the accuracy of the outcomes of the two algorithms, we demonstrated spatial differentiation between the IgAN and control groups using the PCA algorithm for the six genes that were screened. Six hub secretory genes were successfully distinguished between the IgAN and control groups (Figure 3B). Additionally, the expression of the six core secretory genes is illustrated by line, heatmap, and bar charts (Figures 3C–E).
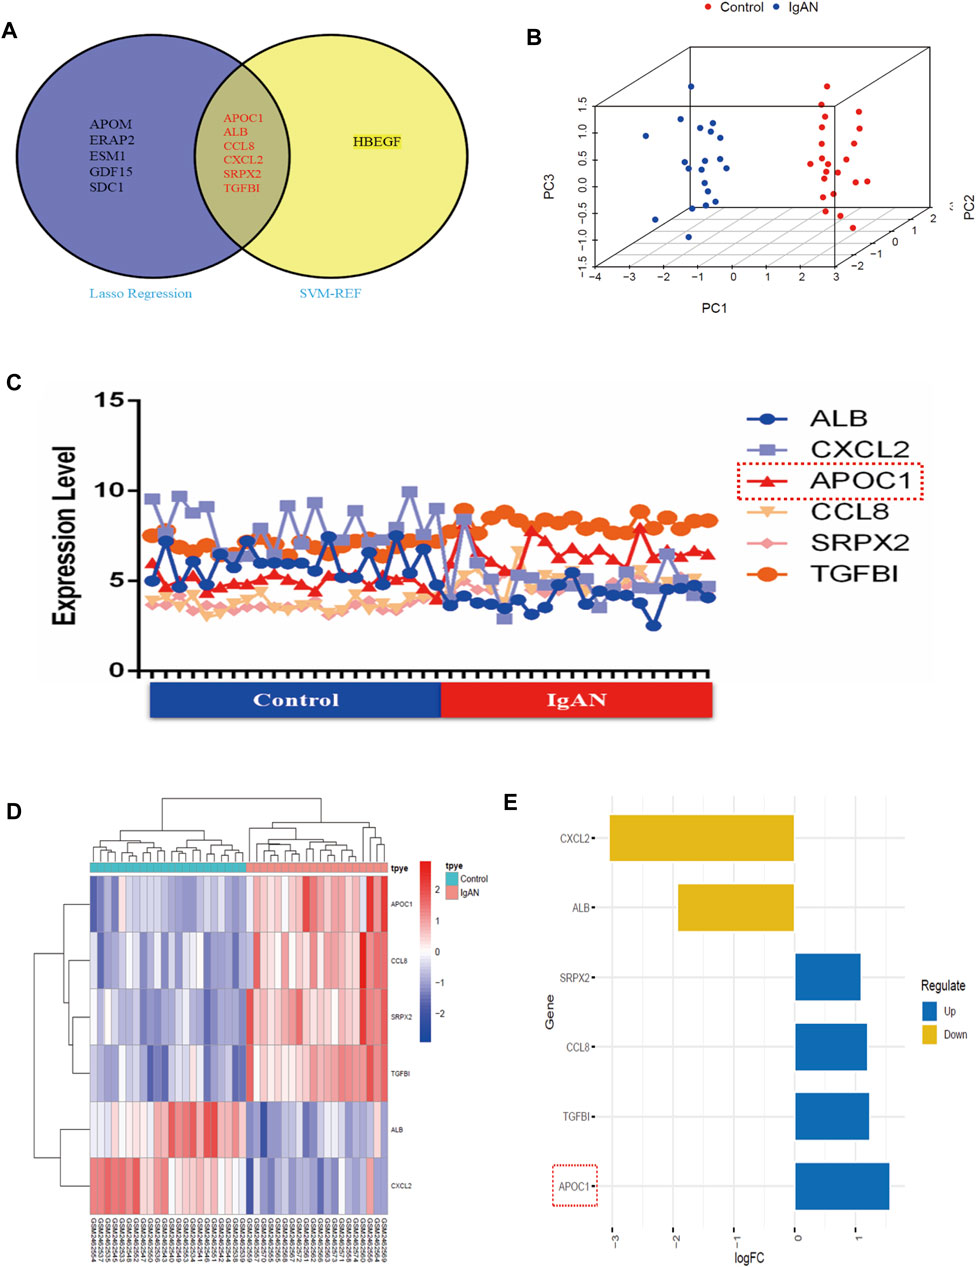
FIGURE 3. SVM-RFE and LASSO machine learning in screening IgAN diagnostic biomarkers in GSE93798. (A) Venn map of common genes between SVM-RFE and LASSO machine learning. (B) PCA’s 3D graphics demonstrates six secretory genes to differentiate between healthy and IgAN patients. (C–E) Collapsed line, heat, and bar charts indicating the expression of the six hub secretory genes in the dataset.
Figures 4A, B suggest that APOC1 expression is elevated in patients with IgAN (p < 0.001). To assess the diagnostic accuracy of APOC1 in predicting IgAN, receiver operating characteristics were evaluated. The research demonstrates that the AUC was 99.091% (95% CI: 97.131–99.921), specificity was 95.455%, and sensitivity was 99.141%. In addition, the results of the experiment were validated by the GSE35487 dataset. The outcome of the research is consistent with the aforementioned results, indicating that APOC1 expression was elevated in IgAN (Figure 4C), and the AUC was 82.716% (95% CI: 66.115-99.317), specificity was 99.515%, and sensitivity was 62.963% (Figure 4D).
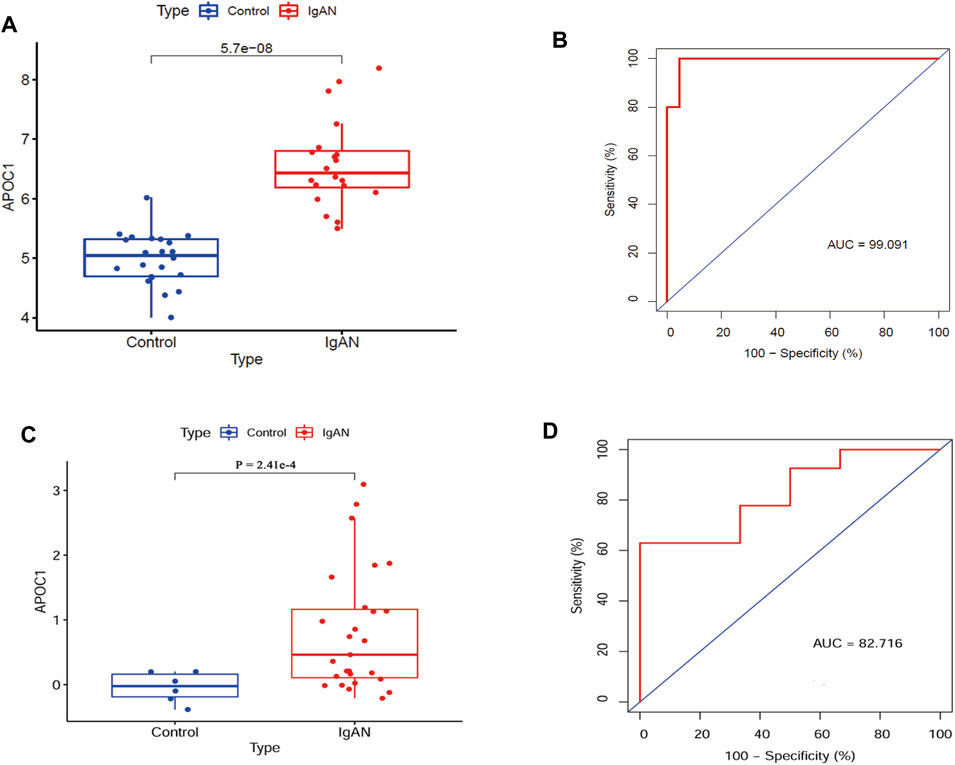
FIGURE 4. Expression of APOC1 is elevated in IgAN with diagnostic function. (A, B) APOC1 expression and ROC diagnostic efficacy in the GSE93798 dataset (Ctrl = 22, IgAN = 20, AUC = 99%, sensitivity = 99%, and specificity = 95%, p < 0.001). (C, D) APOC1 expression and ROC diagnostic efficacy in the GSE35487 dataset (Ctrl = 6, IgAN = 25, AUC = 82.7%, sensitivity = 63%, and specificity = 99%, p < 0.001). Ctrl:healthy, IgAN, IgAN patients. *p < 0.05, **p < 0.01, ***p < 0.001.
Figure 5A illustrates that APOC1 expression negatively correlates with eGFR in IgAN (n = 19, R2 = 0.2285, p = 0.0385). Furthermore, we have analyzed the correlation between APOC1 and clinical data through the Nephroseq database for IgAN. The conclusions of the research also revealed that the expression of APOC1 negatively correlated with eGFR (n = 24, R2 = 0.487, p = 0.00015) (Figure 5B). Nevertheless, the expression of APOC1 positively correlated with serum creatinine (n = 25, R2 = 0.41, p = 0.000567) (Figure 5C).
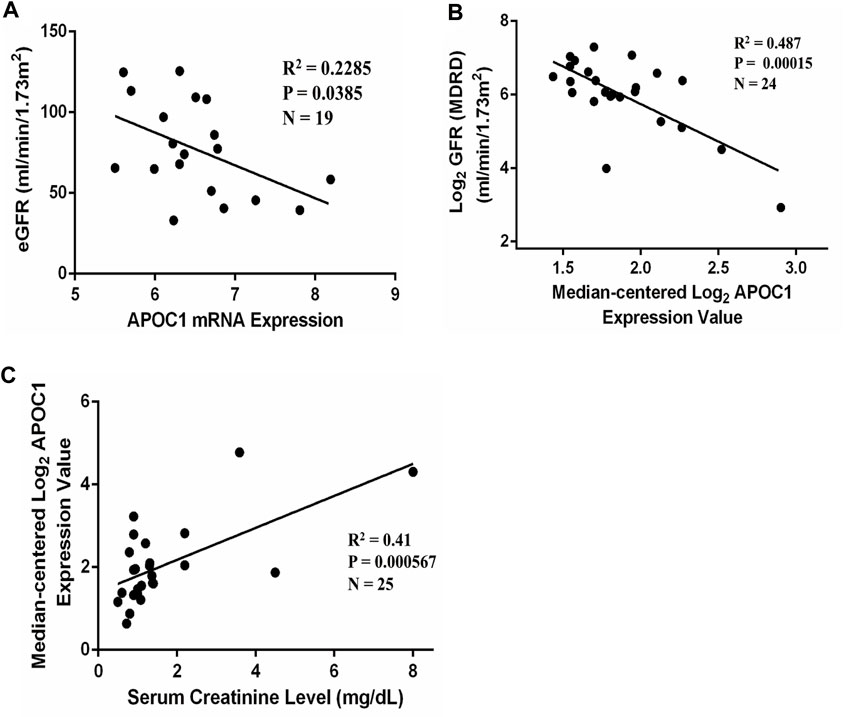
FIGURE 5. APOC1 expression is correlated with eGFR and serum creatinine in patients with IgAN. (A) APOC1 expression was negatively correlated with eGFR in GSE93798 (n = 19, R2 = 0.2285, p = 0.0385). (B) Negative correlation between APOC1 expression and GFR in the Nephroseq database (n = 24, R2 = 0.487, p < 0.001). (C) Positive correlation between APOC1 expression and creatinine (n = 25, R2 = 0.41, p < 0.001).
A total of 12 patients with IgAN nephropathy were enrolled in this research. The serum concentration of APOC1 in IgAN is 1.232 ± 0.1812 μg/ml, whereas it is 0.3956 ± 0.1233 μg/ml in healthy individuals (Figure 6A). The IHC research revealed elevated expression of APOC1 in IgAN kidney tissue using normal kidney tissue from cancer as a control group (Figure 6B). The results were consistent with the IHC results, and APOC1 was predominantly detected in renal tubular epithelial cells in IF (Figure 6C).
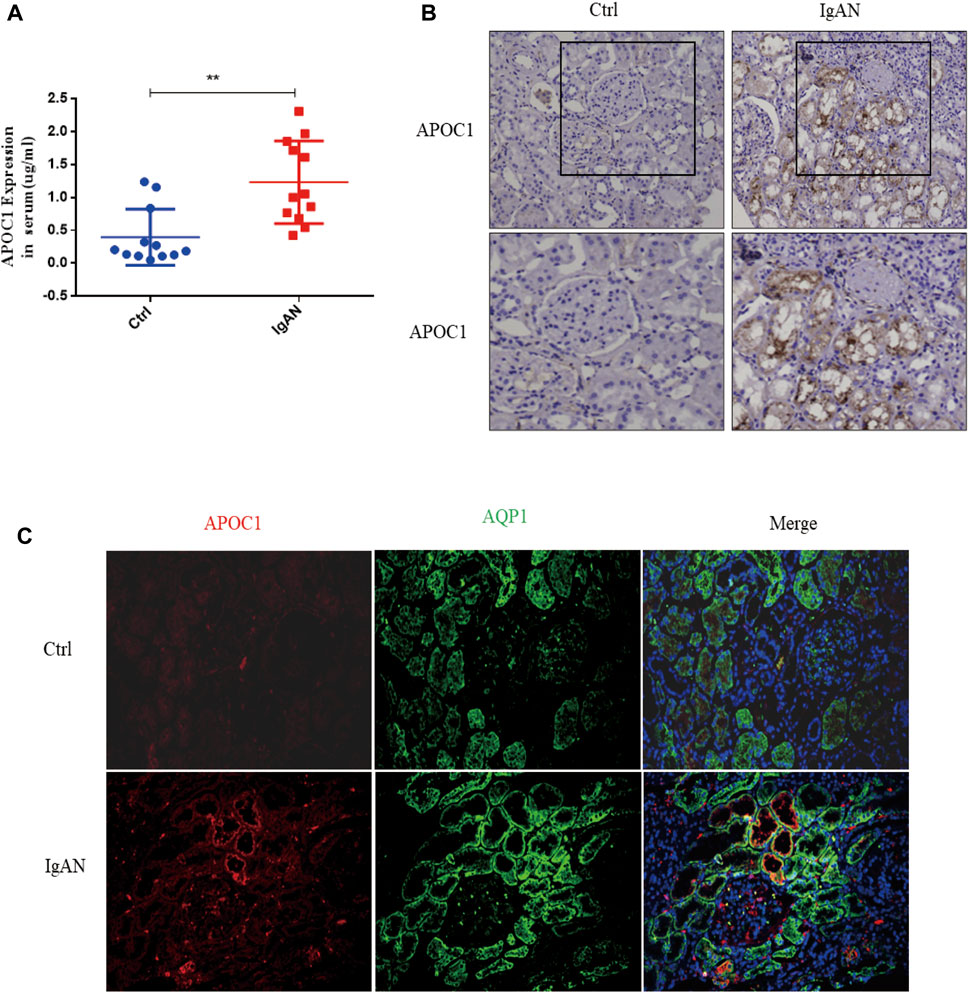
FIGURE 6. Elevated expression of APOC1 in IgAN patients. (A) Expression of APOC1 in serum. (B) Representative IHC illustrating elevated expression of APOC1 in IgAN. (C) Representative IF identifies elevated APOC1 expression in renal tubular epithelial cells of IgAN patients. IHC, immunohistochemical; IF, immunofluorescence; AQP1, aquaporin 1 (proximal renal tubular markers), **p < 0.01 vs. Ctrl.
Using serum from IgAN patients to stimulate HK-2 cells, we discovered that APOC1 expression was elevated by PCR and WB (p < 0.05, Figures 7A, B). Fibrosis-associated protein results revealed that interference with APOC1 expression could inhibit HK-2 cells’ epithelial–mesenchymal transition (Figure 7C). Interfering with APOC1 expression decreases P65 phosphorylation, whereas overexpressing APOC1 increases P65 phosphorylation (Figures 7D, E). More importantly, the results showed that APOC1 may partly activate NF-κB signaling in IgAN. We conducted experiments using EVP4593—an inhibitor of the NF-κB pathway. Our research results suggest that the inhibition of the NF-κB pathway partially prevented APOC1 causing fibrosis in kidney tissue (Figure 7F).
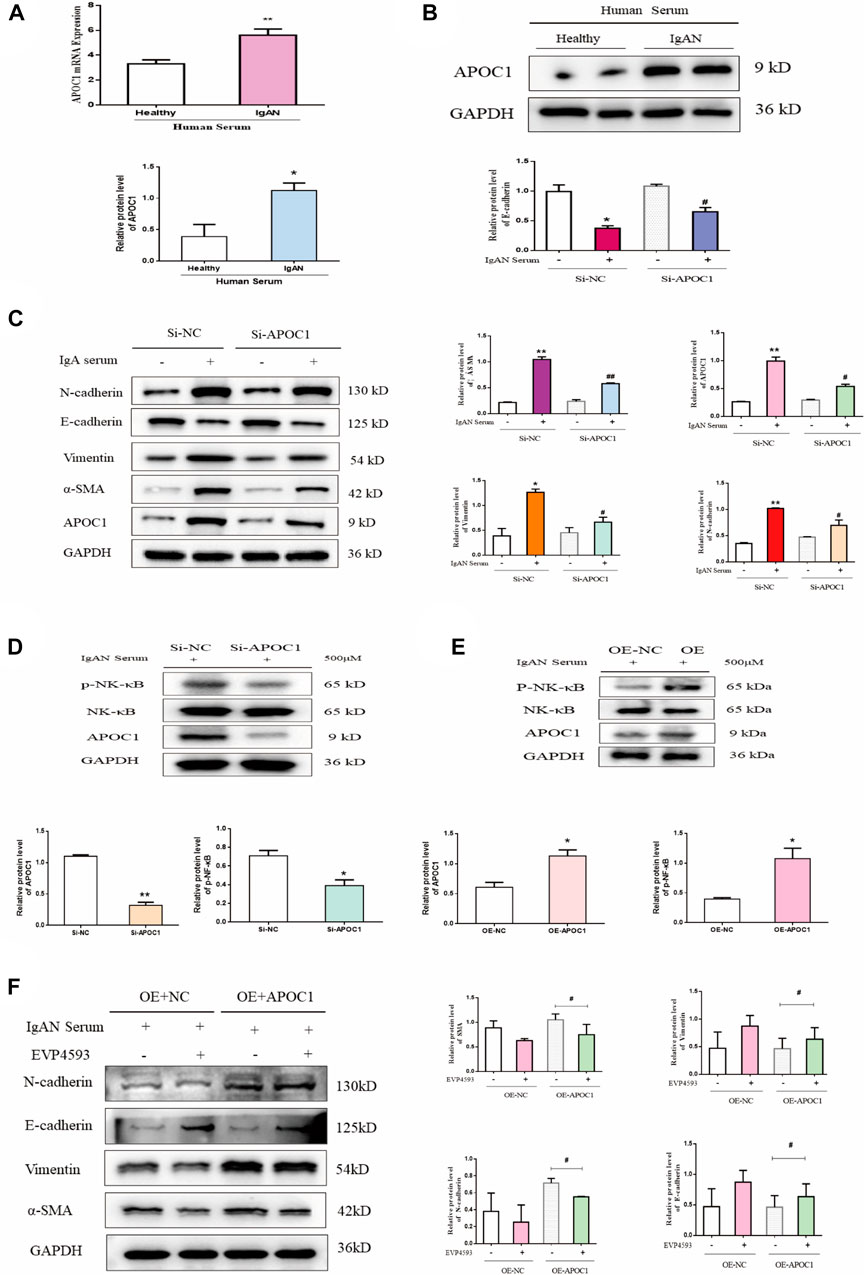
FIGURE 7. APOC1 exacerbates human renal tubular epithelial cell fibrosis through activation of the NF-κB signaling pathway. (A) Expression of APOC1 mRNA in HK-2 cells after serum stimulation. Healthy: healthy serum, IgAN: IgAN serum. (B) Representative WB demonstrates APOC1 expression. (C). Representative WB demonstrates APOC1 and fibrosis-related protein expression (E-cadherin, N-cadherin, vimentin, and α-SMA). (D) Si-APOC1 expression inhibition of the NF-κB pathway. (E) OE-APOC1 expression activation of the NF-κB signaling pathway. (F) Representative WB demonstrates fibrosis-related protein expression. Stimulation of HK-2 cells with the serum concentration of 500 μmol. Data are presented as mean ± SEM, *p < 0.05 vs. healthy (Si-NC, OE-NC), #p < 0.05 vs. Si-NC, ##p < 0.01 vs. Si-NC.
IgAN is one of the most common primary glomerular diseases in the world (Sim et al., 2016; Schena and Nistor, 2018). Research reveals that in 20%–30% of patients with IgAN, renal fibrosis progresses progressively to end-stage renal disease within 20 years (Jarrick et al., 2019; Storrar et al., 2022). IgAN is characterized by the deposition of IgA-based immunoglobulin molecules in the mesangial region of the kidney (Matsumoto et al., 2022), interstitial fibrosis, and tubular atrophy (Juan et al., 2022). However, the exact pathogenesis of IgAN remains unclear, and specific diagnostic markers and effective therapeutic targets are currently unavailable. Therefore, renal histopathology and immunopathological examination are indispensable to confirm the diagnosis of IgAN.
For this research, the GSE93798 dataset was downloaded from the GEO database to screen DEGs from IgAN patients. We determined 339 DEGs and conducted heat and volcano mapping of the DEGs. In addition, the KEGG enrichment of DEGs was analyzed in ECM–receptor interaction and IL-17 signaling pathway, which was consistent closely with previous studies (Figure 1). A total of 42 secretory genes were filtered from the DEGs and six key candidates were identified (APOC1, ALB, CCL8, CXCL2, SRPX2, and TGFBI) by the SVM and LASSO algorithms (Figures 2, 3). In the end, APOC1 was identified as a new hub gene for IgAN (Figure 4). What is extremely interesting is that we discovered that APOC1 may also be a hub secretory gene in IgAN. Therefore, we performed immunohistochemistry and immunofluorescence of APOC1 in patients with IgAN. APOC1 expression is elevated in the tubules of patients with IgAN, whereas glomerular expression of APOC1 is elevated in patients with DN (Yu et al., 2023). Expression of APOC1 in different kidney cells implicates that there might be different functions.
Apolipoprotein C1 (APOC1) is a member of the apolipoprotein family involved in lipid metabolism (Berbee et al., 2005; Bouillet et al., 2016) and immune inflammation. Research revealed that APOC1 plays a role in the pathogenesis of glomerulosclerosis (Bus et al., 2017). Additionally, APOC1 represents a novel diagnostic marker for clear cell renal cell carcinoma (Cui et al., 2020) and stimulates renal cell carcinoma through Wnt3a/STAT signaling (Li et al., 2020; Jiang et al., 2021). APOC1 is involved in breast cancer progression via the EMT and MAPK/JNK pathway (Zhang et al., 2022b). Furthermore, APOC1 is commonly associated with immune inflammation. Systematic pan-cancer analysis identifies APOC1 as an immunological biomarker that regulates macrophage polarization and promotes tumor metastasis (Ren et al., 2022). We revealed that APOC1 expression is elevated in IgAN serum, closely correlates with serum creatinine and eGFR, and is a novel diagnostic marker for IgAN (Figures 4–6).
More importantly, APOC1 was mainly expressed in renal tubular epithelial cells. We collected clinical data from 12 patients with IgAN nephropathy. Furthermore, we performed whole section scans of APOC1 immunohistochemistry and Masson staining results for these 12 kidney tissues. The original results of the whole section data scan are presented in the Supplementary Material. The results demonstrated that APOC1 was mainly expressed in IgA renal tubular epithelial cells. There may be some correlation between APOC1 expression and renal fibrosis.
Therefore, we selected HK-2 cells for in vitro cellular assays. Here, we demonstrated that the inhibition of APOC1 expression alleviates fibrosis in HK-2 cells. The NF-κB pathway activation can exacerbate renal fibrosis (Yang et al., 2019; Li et al., 2022c). Previous studies have demonstrated that the activation of the NF-κB signaling pathway can exacerbate renal fibrosis, whereas the inhibition of NF-κB signaling pathway activation can ameliorate renal injury (Moller-Hackbarth et al., 2021). In this research, we revealed that APOC1 can promote HK-2 cell fibrosis by activating the NF-κB signaling pathway (Figure 7). However, the exact mechanism of the APOC1 regulation of the NF-κB signaling pathway still requires more research to elucidate.
In conclusion, our research demonstrates that APOC1 may play an important role in the development of IgAN and as a novel potential molecular target for the diagnosis and treatment of IgAN. An early diagnosis of IgAN, leading to early prevention and treatment, may reduce the global burden of end-stage renal disease caused by IgAN. However, the role and mechanism of APOC1 in IgAN still require more basic and clinical studies to elucidate.
The datasets presented in this study can be found in online repositories. The names of the repository/repositories and accession number(s) can be found in the article/Supplementary Material.
The studies involving human participants were reviewed and approved by the Ethics Committee of Qilu Hospital, Shandong University (Approval No. KYLL-202111-230). The patients/participants provided their written informed consent to participate in this study. The animal study was reviewed and approved by the Ethics Committee of Qilu Hospital, Shandong University (Approval No. KYLL-202111-230). Written informed consent was obtained from the individual(s) for the publication of any potentially identifiable images or data included in this article.
KY and XA: designing experiments and writing manuscripts. YY, XZ, and LL: bioinformatics analysis. CW and FB: cellular and clinical trials. XY: reviewing the manuscript. All authors were involved in the conduct of the research. All authors contributed to the article and approved the submitted version.
The research was supported by the National Natural Science Foundation of China (No. 82070746) and funded by the ECCM Program of the Clinical Research Center of Shandong University (No. 2021SDUCRCB007).
The authors thank all those participating in the study.
The authors declare that the research was conducted in the absence of any commercial or financial relationships that could be construed as a potential conflict of interest.
All claims expressed in this article are solely those of the authors and do not necessarily represent those of their affiliated organizations, or those of the publisher, the editors, and the reviewers. Any product that may be evaluated in this article, or claim that may be made by its manufacturer, is not guaranteed or endorsed by the publisher.
The Supplementary Material for this article can be found online at: https://www.frontiersin.org/articles/10.3389/fphar.2023.1181435/full#supplementary-material
Al Mehedi Hasan, M., Maniruzzaman, M., and Shin, J. (2022). Identification of key candidate genes for IgA nephropathy using machine learning and statistics based bioinformatics models. Sci. Rep. 12, 13963. doi:10.1038/s41598-022-18273-x
Berbee, J. F., van der Hoogt, C. C., Sundararaman, D., Havekes, L. M., and Rensen, P. C. (2005). Severe hypertriglyceridemia in human APOC1 transgenic mice is caused by apoC-I-induced inhibition of LPL. J. Lipid Res. 46, 297–306. doi:10.1194/jlr.M400301-JLR200
Bouillet, B., Gautier, T., Aho, L. S., Duvillard, L., Petit, J. M., Lagrost, L., et al. (2016). Plasma apolipoprotein C1 concentration is associated with plasma triglyceride concentration, but not visceral fat, in patients with type 2 diabetes. Diabetes Metab. 42, 263–266. doi:10.1016/j.diabet.2016.01.003
Bulow, R. D., Dimitrov, D., Boor, P., and Saez-Rodriguez, J. (2021). How will artificial intelligence and bioinformatics change our understanding of IgA Nephropathy in the next decade? Semin. Immunopathol. 43, 739–752. doi:10.1007/s00281-021-00847-y
Bus, P., Pierneef, L., Bor, R., Wolterbeek, R., van Es, L. A., Rensen, P. C., et al. (2017). Apolipoprotein C-I plays a role in the pathogenesis of glomerulosclerosis. J. Pathol. 241, 589–599. doi:10.1002/path.4859
Cai, X. Y., Wang, Z. F., Ge, S. W., and Xu, G. (2022). Identification of hub genes and immune-related pathways for membranous nephropathy by bioinformatics analysis. Front. Physiol. 13, 914382. doi:10.3389/fphys.2022.914382
Chebotareva, N., Vinogradov, A., McDonnell, V., Zakharova, N. V., Indeykina, M. I., Moiseev, S., et al. (2021). Urinary protein and peptide markers in chronic kidney disease. Int. J. Mol. Sci. 22, 12123. doi:10.3390/ijms222212123
Cui, Y., Miao, C., Hou, C., Wang, Z., and Liu, B. (2020). Apolipoprotein C1 (APOC1): A novel diagnostic and prognostic biomarker for clear cell renal cell carcinoma. Front. Oncol. 10, 1436. doi:10.3389/fonc.2020.01436
Gao, Z., Aishwarya, S., Li, X. M., Li, X. L., and Sui, L. N. (2021). Identification of key candidate genes and chemical perturbagens in diabetic kidney disease using integrated bioinformatics analysis. Front. Endocrinol. (Lausanne). 12, 721202. doi:10.3389/fendo.2021.721202
Gesualdo, L., Di Leo, V., and Coppo, R. (2021). The mucosal immune system and IgA nephropathy. Semin. Immunopathol. 43, 657–668. doi:10.1007/s00281-021-00871-y
Jarrick, S., Lundberg, S., Welander, A., Carrero, J. J., Höijer, J., Bottai, M., et al. (2019). Mortality in IgA nephropathy: A nationwide population-based cohort study. J. Am. Soc. Nephrol. 30, 866–876. doi:10.1681/ASN.2018101017
Jiang, H., Tang, J. Y., Xue, D., Chen, Y. M., Wu, T. C., Zhuang, Q. F., et al. (2021). Apolipoprotein C1 stimulates the malignant process of renal cell carcinoma via the Wnt3a signaling. Cancer Cell Int. 21, 41. doi:10.1186/s12935-020-01713-x
Juan, Y. T., Chiang, W. C., Lin, W. C., Yang, C. W., Chou, S. F., Hung, R. W., et al. (2022). Associations between biomarkers of complement activation, galactose-deficient IgA1 antibody and the updated oxford pathology classification of IgA nephropathy. J. Clin. Med. 11, 4231. doi:10.3390/jcm11144231
Kant, S., Kronbichler, A., Sharma, P., and Geetha, D. (2022). Advances in understanding of pathogenesis and treatment of immune-mediated kidney disease: A review. Am. J. Kidney Dis. 79, 582–600. doi:10.1053/j.ajkd.2021.07.019
Li, D., Yu, K., Feng, F., Zhang, Y., Bai, F., Zhang, Y., et al. (2022). Hydroxychloroquine alleviates renal interstitial fibrosis by inhibiting the PI3K/Akt signaling pathway. Biochem. Biophysical Res. Commun. 610, 154–161. doi:10.1016/j.bbrc.2022.04.058
Li, H., Duann, P., Li, Z., Zhou, X., Ma, J., Rovin, B. H., et al. (2022). The cell membrane repair protein MG53 modulates transcription factor NF-κB signaling to control kidney fibrosis. Kidney Int. 101, 119–130. doi:10.1016/j.kint.2021.09.027
Li, Y., Du, Y., Zhang, Y., Chen, C., Zhang, J., Zhang, X., et al. (2022). Machine learning algorithm-based identification and verification of characteristic genes in acute kidney injury. Front. Med. (Lausanne). 9, 1016459. doi:10.3389/fmed.2022.1016459
Li, Y. L., Wu, L. W., Zeng, L. H., Zhang, Z. Y., Wang, W., Zhang, C., et al. (2020). ApoC1 promotes the metastasis of clear cell renal cell carcinoma via activation of STAT3. Oncogene 39, 6203–6217. doi:10.1038/s41388-020-01428-3
Lin, D. W., Chang, C. C., Hsu, Y. C., and Lin, C. L. (2022). New insights into the treatment of glomerular diseases: When mechanisms become vivid. Int. J. Mol. Sci. 23, 3525. doi:10.3390/ijms23073525
Liu, L., Bai, F., Song, H., Xiao, R., Wang, Y., Yang, H., et al. (2022). Upregulation of TIPE1 in tubular epithelial cell aggravates diabetic nephropathy by disrupting PHB2 mediated mitophagy. Redox Biol. 50, 102260. doi:10.1016/j.redox.2022.102260
Liu, P., Lassen, E., Nair, V., Berthier, C. C., Suguro, M., Sihlbom, C., et al. (2017). Transcriptomic and proteomic profiling provides insight into mesangial cell function in IgA nephropathy. J. Am. Soc. Nephrol. 28, 2961–2972. doi:10.1681/ASN.2016101103
Matsumoto, Y., Aryal, R. P., Heimburg-Molinaro, J., Park, S. S., Wever, W. J., Lehoux, S., et al. (2022). Identification and characterization of circulating immune complexes in IgA nephropathy. Sci. Adv. 8, eabm8783. doi:10.1126/sciadv.abm8783
Medjeral-Thomas, N. R., Cook, H. T., and Pickering, M. C. (2021). Complement activation in IgA nephropathy. Semin. Immunopathol. 43, 679–690. doi:10.1007/s00281-021-00882-9
Moller-Hackbarth, K., Dabaghie, D., Charrin, E., Zambrano, S., Genové, G., Li, X., et al. (2021). Retinoic acid receptor responder1 promotes development of glomerular diseases via the Nuclear Factor-κB signaling pathway. Kidney Int. 100, 809–823. doi:10.1016/j.kint.2021.05.036
Ren, L., Yi, J., Yang, Y., Li, W., Zheng, X., Liu, J., et al. (2022). Systematic pan-cancer analysis identifies APOC1 as an immunological biomarker which regulates macrophage polarization and promotes tumor metastasis. Pharmacol. Res. 183, 106376. doi:10.1016/j.phrs.2022.106376
Schena, F. P., and Nistor, I. (2018). Epidemiology of IgA nephropathy: A global perspective. Semin. Nephrol. 38, 435–442. doi:10.1016/j.semnephrol.2018.05.013
Sim, J. J., Batech, M., Hever, A., Harrison, T. N., Avelar, T., Kanter, M. H., et al. (2016). Distribution of biopsy-proven presumed primary glomerulonephropathies in 2000-2011 among a racially and ethnically diverse US population. Am. J. Kidney Dis. 68, 533–544. doi:10.1053/j.ajkd.2016.03.416
Storrar, J., Chinnadurai, R., Sinha, S., and Kalra, P. A. (2022). The epidemiology and evolution of IgA nephropathy over two decades: A single centre experience. Plos One 17, e0268421. doi:10.1371/journal.pone.0268421
Yang, H., Xie, T., Li, D., Du, X., Wang, T., Li, C., et al. (2019). Tim-3 aggravates podocyte injury in diabetic nephropathy by promoting macrophage activation via the NF-kappa B/TNF-alpha pathway. Mol. Metab. 23, 24–36. doi:10.1016/j.molmet.2019.02.007
Yu, K., Li, D., Xu, F., Guo, H., Feng, F., Ding, Y., et al. (2021). Ido1 as a new immune biomarker for diabetic nephropathy and its correlation with immune cell infiltration. Int. Immunopharmacol. 94, 107446. doi:10.1016/j.intimp.2021.107446
Yu, K., Li, S., Wang, C., Zhang, Y., Li, L., Fan, X., et al. (2023). APOC1 as a novel diagnostic biomarker for DN based on machine learning algorithms and experiment. Front. Endocrinol. 14, 1102634. doi:10.3389/fendo.2023.1102634
Zhang, H., Wang, Y., Liu, C., Li, W., Zhou, F., Wang, X., et al. (2022). The Apolipoprotein C1 is involved in breast cancer progression via EMT and MAPK/JNK pathway. Pathol. Res. Pract. 229, 153746. doi:10.1016/j.prp.2021.153746
Zhang, X., Chao, P., Jiang, H., Yang, S., Muhetaer, G., Zhang, J., et al. (2022). Integration of three machine learning algorithms identifies characteristic RNA binding proteins linked with diagnosis, immunity and pyroptosis of IgA nephropathy. Front. Genet. 13, 975521. doi:10.3389/fgene.2022.975521
Zhou, L.-T., Lv, L.-L., Qiu, S., Yin, Q., Li, Z. L., Tang, T. T., et al. (2019). Bioinformatics-based discovery of the urinary BBOX1 mRNA as a potential biomarker of diabetic kidney disease. J. Transl. Med. 17, 59. doi:10.1186/s12967-019-1818-2
Zhou, Y., Wu, Q., Ni, G., Hong, Y., Xiao, S., Liu, C., et al. (2022). Immune-associated pivotal biomarkers identification and competing endogenous RNA network construction in post-operative atrial fibrillation by comprehensive bioinformatics and machine learning strategies. Front. Immunol. 13, 974935. doi:10.3389/fimmu.2022.974935
Keywords: APOC1, IgAN, biomarker, NK-κB, machine learning algorithms
Citation: Yu K, Ding L, An X, Yang Y, Zhang X, Li L, Wang C, Bai F and Yang X (2023) APOC1 exacerbates renal fibrosis through the activation of the NF-κB signaling pathway in IgAN. Front. Pharmacol. 14:1181435. doi: 10.3389/fphar.2023.1181435
Received: 07 March 2023; Accepted: 02 May 2023;
Published: 25 May 2023.
Edited by:
Edgar Jaimes, Memorial Sloan Kettering Cancer Center, United StatesReviewed by:
Fang-Fang He, Huazhong University of Science and Technology, ChinaCopyright © 2023 Yu, Ding, An, Yang, Zhang, Li, Wang, Bai and Yang. This is an open-access article distributed under the terms of the Creative Commons Attribution License (CC BY). The use, distribution or reproduction in other forums is permitted, provided the original author(s) and the copyright owner(s) are credited and that the original publication in this journal is cited, in accordance with accepted academic practice. No use, distribution or reproduction is permitted which does not comply with these terms.
*Correspondence: Xiangdong Yang, eXhkQGVtYWlsLnNkdS5lZHUuY24=
Disclaimer: All claims expressed in this article are solely those of the authors and do not necessarily represent those of their affiliated organizations, or those of the publisher, the editors and the reviewers. Any product that may be evaluated in this article or claim that may be made by its manufacturer is not guaranteed or endorsed by the publisher.
Research integrity at Frontiers
Learn more about the work of our research integrity team to safeguard the quality of each article we publish.