
95% of researchers rate our articles as excellent or good
Learn more about the work of our research integrity team to safeguard the quality of each article we publish.
Find out more
ORIGINAL RESEARCH article
Front. Pharmacol. , 14 April 2023
Sec. Drug Metabolism and Transport
Volume 14 - 2023 | https://doi.org/10.3389/fphar.2023.1175896
This article is part of the Research Topic Pharmacokinetic-Pharmacodynamic Model of Drugs and Their Pharmacokinetic Differences between Normal and Disease States View all 15 articles
 Qun Wang1*†
 Tiantian Tang1†Zengguang Wu1Hong Yang1Yuan Gao1,2Shiyu Zhang1Xinli Song1,2Xiaolan Chen1,2
Objective: To investigate the dominant metabolic enzymes of six effective components (astragaloside IV, glycyrrhizic acid, calycosin-glucuronide, formononetin, ononin, calycosin-7-O-β-D- glucoside) of Huangqi Liuyi decoction extract (HQD).
Methods: Mouse liver microsomes were prepared. The effects of specific inhibitors of CYP450 enzymes on the metabolism of six effective components of HQD were studied using liver microsomal incubation in vitro.
Results: The chemical inhibitors of CYP2C37 inhibit the metabolism of glycyrrhizic acid and astragaloside IV. Formononetin and astragaloside IV metabolism is inhibited by the chemical inhibitors of CYP2C11. The chemical inhibitors of CYP2E1 and CYP1A2 inhibit the metabolism of calycosin-glucuronide. Chemical CYP3A11 inhibitors prevent formononetin and glycyrrhizic acid from being metabolized. However, no inhibitor significantly affected the metabolism of ononin and calycosin-7-O-β-D-glucoside.
Conclusion: CYP2C37 may be involved in the metabolism of astragaloside IV and glycyrrhizic acid, the metabolism of astragaloside IV and formononetin may be related to CYP2C11, the metabolism of calycosin-glucuronide may be related to CYP1A2 and CYP2E1, and CYP3A11 may be involved in the metabolism of glycyrrhizic acid and formononetin. This research provides an experimental basis for exploring the pharmacokinetic differences caused by metabolic enzymes.
Diabetic nephropathy (DN) is one of the most serious microvascular complications of diabetes mellitus (DM). The clinical manifestations are persistent proteinuria, edema, decreased renal function, hypertension. The majority of cases progress to end-stage renal failure. Early treatment of diabetic nephropathy is significant in improving the quality of life and survival rate (Liu et al., 2022; Liu et al., 2022). Huangqi Liuyi decoction, first published in the “Taiping Huimin and Pharmacy Bureau Fang,” is composed of 60 g of Astragali and 10 g of Glycyrrhizae, and has the effect of greatly tonifying lung qi, nourishing kidney water, and harmonizing the spleen and stomach. Huangqi Liuyi decoction has been shown to prevent islet damage, lower blood glucose and glycated hemoglobin in diabetic model mice. In addition, Astragali prevents the establishment of renal interstitial fibrosis and Glycyrrhizae can prevent diabetic nephropathy by lowering lipid, lowering glucose levels, and preventing anti-oxidative stress in the kidneys (Chen et al., 2014; Hou et al., 2017; Wen et al., 2018; Ma et al., 2019; Dai et al., 2022). Traditional Chinese medicine (TCM) involves a multi-component and multi-target approach. Therefore, the quality and preparation of TCM aren’t easy to control, which hinders the in-depth research of TCM and the development of new drugs. To improve the pharmacological properties, individual ingredients from a compounded prescription are isolated and formulated according with the compatibility theory of TCM. This allows for clear pharmacological effects, relatively stable nature, and can effectively compensate for the shortcomings of traditional prescriptions whose quality is not easily controlled (Wang and Liang, 2004; Hu et al., 2016; Chen et al., 2019). Previously, our team discovered that the combination of four components extracted from Huangqi Liuyi Decoction, namely, astragalus saponin, glycyrrhizic acid, astragalus flavone, and astragalus polysaccharide (AKA HQD), improved renal fibrosis and slowed the progression of diabetic nephropathy in db/db mice (Wang et al., 2022). The study also discovered no statistical difference between the efficacy of Huangqi Liuyi decoction and HQD in mice with diabetic nephropathy (Wang et al., 2022b). According to pharmacokinetic studies, mice with diabetic nephropathy exhibited greater absorption and delayed elimination of the six effective components (astragaloside IV, glycyrrhizic acid, calycosin-glucuronide, formononetin, ononin, calycosin-7-O-β-D-glucoside) following oral administration HQD (Wang et al., 2022c).
The pathological state of the patient considerably influences drug-related processes in vivo, which directly relates to the drug’s efficacy and side effects (Ma et al., 2021; Qian et al., 2022). The alterations in the pharmacokinetics of drug in DN may relate to the changes in the activity of a variety of CYP450 cytochrome (CYP) enzymes involved in drug absorption, metabolism, and excretion (Hu et al., 2014; Gong et al., 2015). In our preliminary research, DN induced the activity of CYP2C11 and CYP3A11. HQD inhibited the activity of CYP1A2, CYP2C37, and CYP3A11 and induced the activity of CYP2C11. Moreover, HQD induced the activity of CYP2E1 in the DN mouse and inhibited the activity of CYP2E1 in the control mouse. The activity of each CYP450 enzyme was consistent with changes in expression (Wang et al., 2022d). However, the specificity of individual CYP enzymes allows for only specific substrates to be metabolized by the enzyme. The enzyme primarily involved in the metabolism of a certain substrate is known as the dominant metabolizing enzyme. Analyzing the dominant metabolizing enzyme of a drug is essential for studying how variations in the activity and expression of the metabolizing enzyme effect the drug pharmacokinetics and to elucidate the pharmacokinetic differences in pathophysiological states. In the present research, an in vitro liver microsomal incubation method was adopted to study the influence of specific inhibitors of liver CYP450 enzymes on the metabolism of the six effective components (astragaloside IV, glycyrrhizic acid, calycosin-glucuronide, formononetin, ononin, calycosin-7-O-β-D- glucoside) of HQD so as to analyze the CYP enzymes that may be involved in the metabolism of each component. From the perspective of drug metabolism, we investigated the reasons for the pharmacokinetic differences of HQD during the pathological and physiological changes and the possible drug-drug interactions in clinical application. The information will help provide a theoretical basis for developing new drugs against diabetic nephropathy and the rationale for their clinical application.
The China Institute of Food and Drug Control provided the following reference standards: astragaloside IV, glycyrrhizic acid, calycosin-glucuronide, formononetin, ononin, calycosin-7-O-β-D- glucoside, puerarin, and digoxin (purity >98.0%). Ticlopidine (693228-63-6), α-naiflavone (604-59-1), quinidine (56-54-2), fluconazole (86386-73-4), ketoconazole (65277-42-1), and clomethiazole (533-45-9) were supplied by Shanghai yuanye Bio-Technology Co., Ltd. (Shanghai, China). Nicotinamide adenine dinucleotide phosphate (NADPH, 704S082) and bicinchoninic acid protein assay kit (BCA, 20191123) were provided by Beijing Solarbio Science and Technology Co., Ltd. (Beijing, China). Merck KGaA (Germany) provided methanol and acetonitrile (HPLC grade). All remaining chemicals were of analytical grade. HQD was self-produced by the research group (Wang et al., 2022). The content of each component in HQD is shown in Table 1.
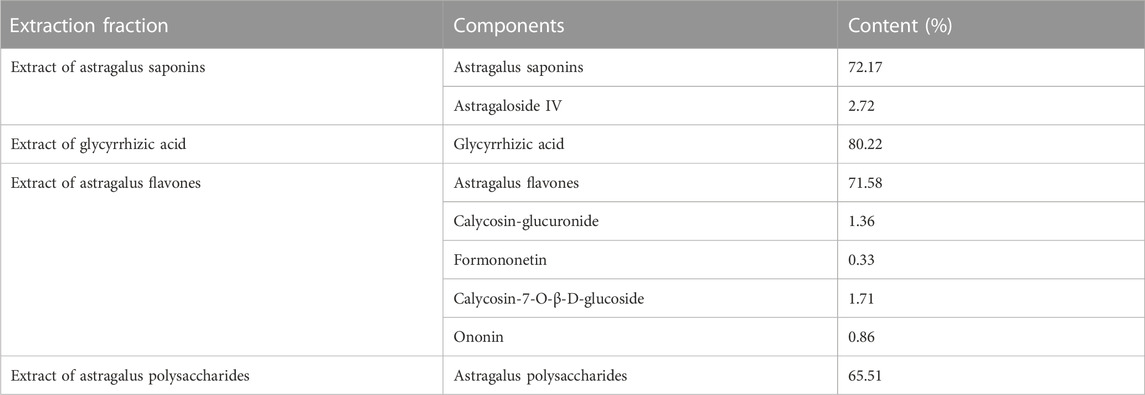
TABLE 1. Content of each component extracted from three batches of Astragalus and Glycyrrhizae.
Ten-week-old db/db male mice (45 ± 5 g) and db/m mice (20 ± 2 g) were purchased from the Model Animal Research Center of Nanjing University and MOE Key Laboratory of Model Animal for Disease Study (SCXK [Su]2021–0016) and housed in polypropylene cages at a relative humidity of 60% ± 5%, constant temperature (25°C ± 1°C) and under a 12 h light/12 h dark cycle, mice were given free access to water and food. Twelve-week-old db/db mice developed nephropathy (Ponchiardi et al., 2013; Wang et al., 2022b). The animal studies were approved by the Animal Ethical Committee of Guizhou University of Traditional Chinese Medicine (the approval number is NO1702060).
The following standard solutions were prepared in methanol. The concentrations of astragaloside IV, glycyrrhizic acid, calycosin-glucuronide, formononetin, calycosin-7-O-β-D-glucoside, and ononin were 0.524 mg/mL, 0.505 mg/mL, 0.509 mg/mL, 0.526 mg/mL, 0.512 mg/mL, and 0.508 mg/mL, respectively. The stock solution was diluted with phosphate-buffered saline (PBS) to prepare a series of standard solutions. All solutions were refrigerated at 4°C.
Specific inhibitor solutions with the following concentrations were prepared in methanol: 0.126 μg/mL α-naphthoflavone, 0.101 μg/mL ticlopidine, 0.104 μg/mL fluconazole, 0.106 μg/mL quinidine, 0.101 μg/mL clomethiazole, and 0.101 μg/mL ketoconazole. Before use, each inhibitor solution was diluted with PBS (1 mM, pH, 7.0) to prepare the required concentration and then stored at 4°C.
Before the experiment, the mice were fasted for 12 h, and were euthanized after blood was taken from the eye sockets. The liver was quickly removed and perfused with pre-cooled saline through the hepatic portal vein until the liver was earthy yellow, washed three times with 1.15% KCl solution, wiped dry with filter paper, and then weighed. The liver was then cut up, homogenized with three times the volume of ethylene diamine tetraacetic acid (EDTA) in an ice bath, and centrifuged at 4°C for 10 min at 3,000 g. The supernatant was filtered, and the filtrate was centrifuged at 4°C for 20 min at 12,000 g. The supernatant was then centrifuged at 4°C for 45 min at 100,000 g, and the precipitate was resuspended in a resuspension solution (EDTA homogenate containing 20% glycerol). The protein concentration of the microsomes was determined using the BCA protein concentration determination kit, and the microsomes were aliquoted and pre-stored at −20°C for 60 min and transferred to −80°C for storage.
The total volume of the reaction was kept at 200 μL. The in vitro incubation system comprised of 50 μL liver microsomes (1 mg/mL), 50 μL specific inhibitor solution, 20 μL nicotinamide adenine dinucleotide phosphate (NADPH, 1 mmol/L), and 80 μL standard solution (100 ng/mL). The solution containing liver microsomes, specific inhibitors, and the standard solution was pre-incubated for 5 min at 37°C. NADPH, pre-incubated for 5 min at 37°C, was added to commence the reaction, and the solution was incubated for 60 min at 37°C on a thermostatic oscillator. At the end of the reaction, 400 L of ice-cold methanol containing the IS (the final concentrations of digoxin and puerarin were 0.745 μg/mL and 1 μg/mL, respectively) was added to terminate the reaction. The samples were vortexed for 1 min and centrifuged for 10 min (15,000 r/min). The contents of six active components in the supernatant were determined by HPLC-MS-MS. All reactions were performed in triplicate.
The three concentrations of quality control samples were prepared by taking 50 μL of inactivated liver microsomes and adding 50 μL PBS solution, 80 μL mixed solution containing six components (astragaloside IV, glycyrrhizic acid, calycosin-glucuronide, formononetin, ononin, calycosin-7-O-β-D-glucoside) with low, medium, and high concentrations, 20 μL NADPH, 200 μL methanol, and 200 μL internal standard solution.
An Acquity HPLC system (Shimadzu Corp., Kyoto, Japan) equipped with a Q-Trap® 5,500 triple quadruple mass spectrometer (AB Sciex, Framingham, MA, United States) was utilized for HPLC-MS/MS. Multiple reaction monitoring (MRM) was employed to achieve mass spectrometric quantification. The parameters of the mass spectrometer were optimized as follows: source temperature at 600°C, nebulizer pressure at 55 psi, curtain gas at 30 psi, auxiliary gas at 55 psi, and ion spray voltage at −4.5 kV (−) or 5.5 kV (+). The mass spectrum parameters are shown in Table 2.
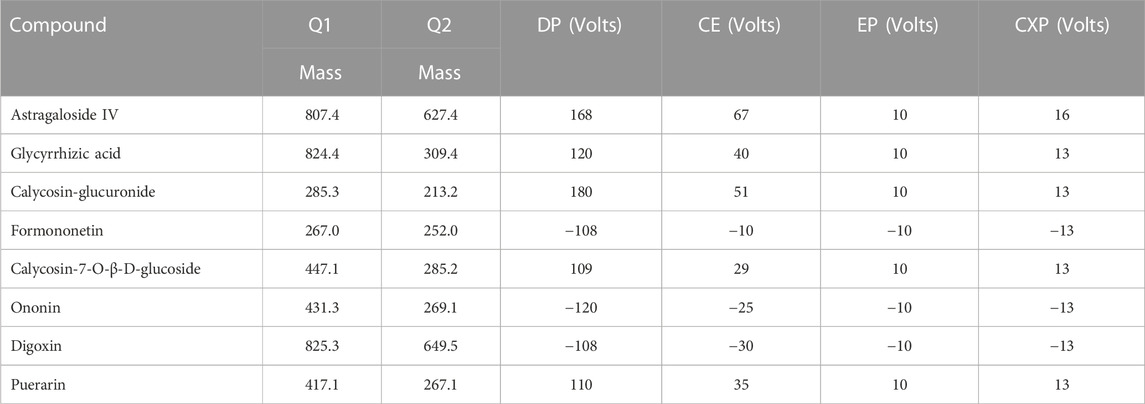
TABLE 2. Mass spectrum parameters of HPLC-MS/MS.
The liquid chromatography analyses of the six effective components were conducted using an ACEExcel2C18-AR column (100 × 2.1 mm, 2 μm, Advanced Chromatography Technologies Ltd., Aberdeen, United Kingdom) at 30°C. Analysis was completed with a gradient elution of 0.1% formic acid (A) and acetonitrile (B). The flow rate was 0.4 mL/min. The gradient elution procedure was as follows: 0–0.6 min at 10% B, 0.6–2 min at 10%–30% B, 2–6 min at 30%–65% B, 6–8 min at 65%–90% B, 8–9 min at 90%–90% B, 9–9.1 min at 90%–10% B, and 9.1–12 min at 10% B.
Briefly, 50 μL of inactivated liver microsomes were mixed with 50 μL of mix specific inhibitor, before adding 80 μL of PBS solution, 20 μL of NADPH, and 400 μL of methanol. Subsequently, the samples were vortexed for 1 min and sonicated for 3 min. After precipitating the protein, the samples were centrifuged at 15,000 r/min for 10 min, and the supernatant was collected to obtain sample A. Next, 50 μL of inactivated liver microsomes were mixed with 50 μL of mix specific inhibitor before we added 80 μL of the mixed solution of six components (astragaloside IV, glycyrrhizic acid, calycosin-glucuronide, formononetin, ononin, calycosin-7-O-β-D-glucoside) prepared in advance, 20 μL of NADPH, 200 μL of methanol, and 200 μL of internal standard solution. The remainder of the operations were the same as those outlined above for sample A, and the supernatant was collected to obtain sample B. Another sample containing six components was incubated according to the method described in section 2.6 to obtain sample C.
Briefly, 50 μL of inactivated liver microsomes were mixed with 50 μL of PBS solution, 20 μL of NADPH, 200 μL of methanol, 200 μL of internal standard solution, and then 80 μL of mixed standard solution of different concentrations was added to create a series of mixed working solutions. The samples were incubated according to the method described in section 2.6 and the supernatant was collected for determination using HPLC-MSMS. The calibration curves were drawn with the concentration (C) of each component as the horizontal coordinate X, and the ratio (A/Ai) between the peak area of each component and internal standard as the vertical coordinate Y. Linear regression analysis was conducted using the weighted least squares method to obtain the regression equation. The lowest concentration in the calibration curve was used as the lower limit of quantification (LLOQ).
The low-, medium-, and high-concentration quality control samples were incubated according to the method described in Section 2.6. Accuracy and precision were assessed by repeated determination of six components in three concentration quality control samples six times a day for three consecutive days. The precision of the assay was computed using the relative standard deviation (RSD,%). The accuracy of the method was evaluated by the ratio of the measured concentration to the spiked concentration (%).
To obtain sample A, the low-, medium-, and high-concentration quality control samples were incubated according to the method described in Section 2.6 and the supernatant was collected for determination by HPLC-MS/MS. Then, 50 μL of inactivated liver microsomes were treated according to the method described in Section 2.6, with the exception of adding the six components and internal standard. Subsequently, the corresponding low, medium, and high concentrations of the six components and internal standard mixed solution were added to the supernatant to obtain sample B. The low, medium, and high concentrations of the six-component standard solution (80 μL) were mixed with the internal standard (200 μL) and the initial mobile phase (320 μL) to obtain sample C. The ratio of the peak area of sample A to sample B was defined as the extraction recovery rate, while the ratio of the peak area of sample B to sample C was defined as the matrix effect.
Low-, medium-, and high-concentrations of quality control samples were incubated according to the method described in Section 2.6. Subsequently, the quality control samples were stored at 25°C for 4 h, refrigerated for 48 h at −20°C, and underwent triple freeze-thaw cycles. The stability was evaluated by investigating the content changes of six components under different storage conditions.
The six-component mixed standard solutions were incubated with the liver microsomal sample of different protein concentrations (0, 0.25, 0.5, 0.75, 1, 2 mg/mL) for 60 min, each with six replicates. Subsequently, samples were prepared according to the methods described in Section 2.6. The residual contents of the six effective components in each group were determined by HPLC-MS/MS to calculate the metabolic conversion rate.
The mixed standard solution containing the six components was incubated with mouse liver microsomes at 37°C for different time (0, 15, 30, 45, 60, 90 min), each with six replicates. Subsequently, samples were prepared according to the methods described in Section 2.6. The residual contents of the six effective components in each group were determined by HPLC-MS/MS to calculate the metabolic conversion rate.
The standard solution of astragaloside IV, glycyrrhizic acid, calycosin-glucuronide, formononetin, calycosin-7-O-β-D-glucoside, and ononin was added to phosphate-buffered saline (PBS, pH 7.0) as desired for dilution to produce a series of mixed solutions (50, 100, 250, 500, 1,000 ng/mL). Each mixed solution sample was incubated with 1.0 mg/mL liver microsomes for 60 min. The residual contents of the six effective components were determined by HPLC-MS/MS to calculate the metabolic conversion rate.
Α-naphthoflavone, quinidine, clomethiazole, ticlopidine, ketoconazole, and fluconazole were selected as specific inhibitors of CYP1A2, CYP2D22, CYP2E1, CYP2C37, CYP3A11, and CYP2C11, respectively (El-Sherbeni and El-Kadi, 2014; Xu et al., 2016). Forty-eight mice were randomly divided into eight groups of six mice each. The eight groups comprised six different specific inhibitor groups, a negative control group and a control group. For different specific inhibitor groups, mouse liver microsomes were incubated with related CYP450 enzyme specific inhibitors and mixed standard solutions. In the negative control group, mouse liver microsomes were incubated with mixed standard solution without specific inhibitors. In the control group, inactivated liver microsomes were combined with mixed standard solution without inhibitors and not incubated. After the samples were treated according to the methods described in Section 2.6, the residual level of the six effective components was determined for each group using HPLC-MS/MS. The residual contents of each component (%) = Vc/V0*100 (where Vc is the residual amount of each group and V0 is the content of the control group).
All data were expressed as mean ± standard deviation. SPSS 23 was used for statistical analysis between the two groups. p ≤ 0.05 and p ≤ 0.01 were statistically significant between the two groups.
The results demonstrated that the chromatographic peaks of the six components were well separated, with no interference between them. The retention times of astragaloside IV, glycyrrhizic acid, calycosin-glucuronide, formononetin, ononin, and calycosin-7-O-β-D-glucoside were 5.05 min, 5.25 min, 4.49 min, 5.54 min, 4.20 min, and 3.45 min, respectively (Figure 1).
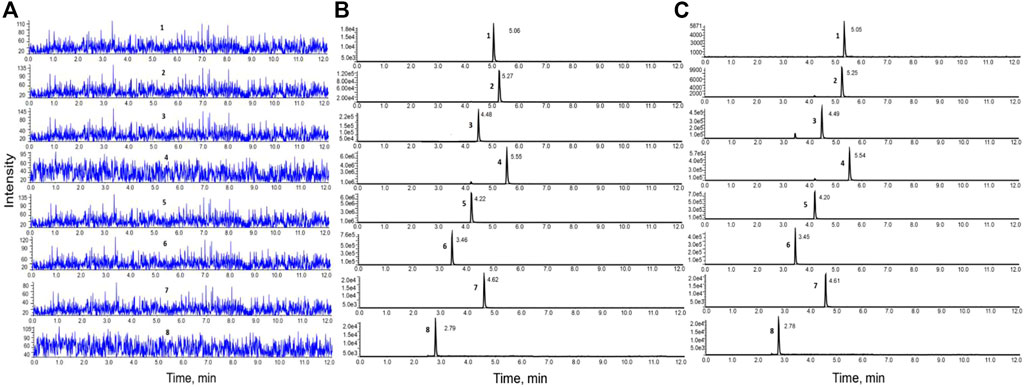
FIGURE 1. HPLC-MS/MS chromatograms of the six components. (A). Blank inactivated liver microsomal sample; (B). Blank inactivated liver microsomal sample mixed with the six components and internal standard; (C). Samples obtained after incubation with liver microsomes.
Using the concentration of the six components as the abscissa (X) and the ratio of the peak area between each component and internal standard as the ordinate (Y), the weighted least squares method was employed for linear regression calculation to obtain the regression equation. All calibration curves displayed great linearity and coefficients of correlation ranging from 0.9992 to 0.9998. The regression equation and linear range for six components in the liver microsomal samples are listed in Table 3.
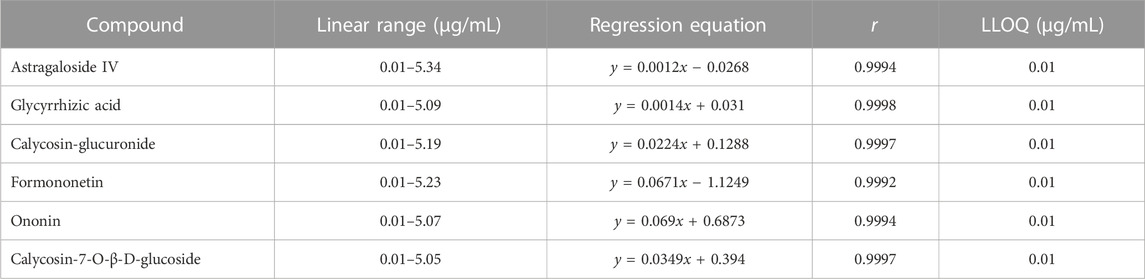
TABLE 3. Regression equation, linear range, and LLOQ for six components in liver microsomal samples.
The inter- and intra-day precision ranged from 2.3% to 15.66% and 0.37%–17.43%, respectively. The inter- and intra-day precision and accuracy of six components in liver microsomal samples are summarized in Table 4. These results demonstrate that the method is accurate and reliable.
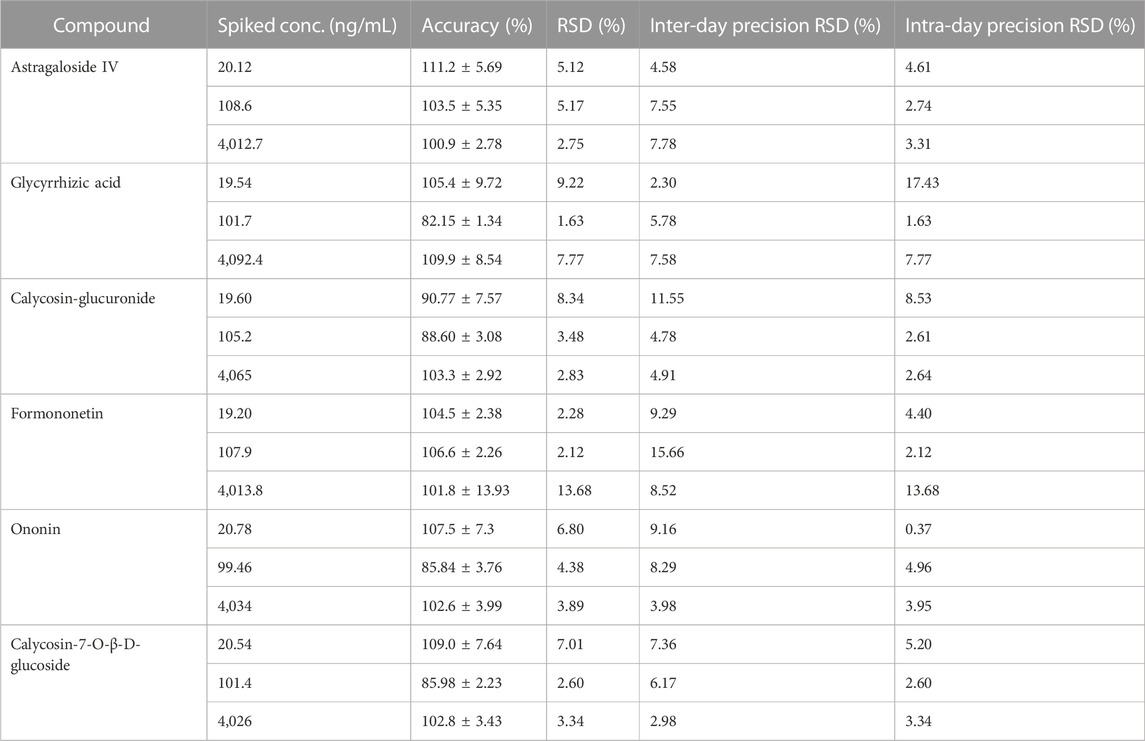
TABLE 4. Accuracy and precision of the six components in liver microsomal samples (x ± SD, n = 6).
The mean matrix effect of the six components ranged from 90.57% ± 5.59% to 103.9% ± 6.33% with RSD <15%, and extraction recovery of the six components ranged from 88.06 ± 1.10 to 105.9 ± 10.46 with RSD <20%, which suggested that the recoveries of the six components were reliable in microsomal samples. Furthermore, there was no matrix interference. The matrix effect and extraction recovery are displayed in Table 5.

TABLE 5. Matrix effects and extraction recovery of the six components in liver microsomal samples (x ± SD, n = 6).
The result is displayed in Table 6. Our results revealed that the components are stable when stored at room temperature (approximately 25°C) for 4 h, refrigerated (−20°C) for 48 h and three freeze-thaw cycles. Therefore, the stability of samples conformed to the standard of biological sample determination. Figure 2.
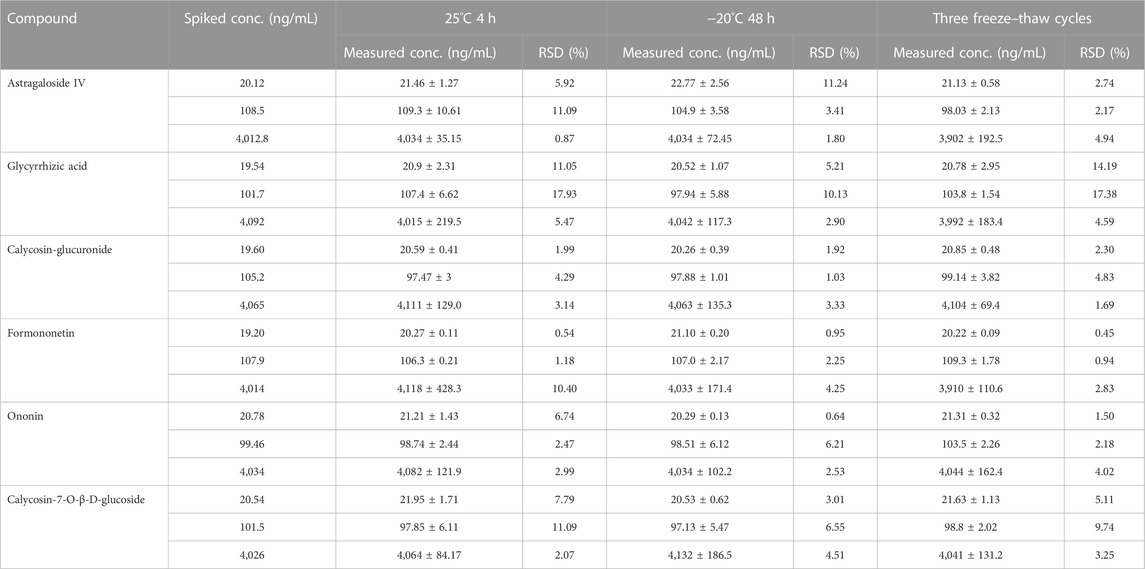
TABLE 6. Stability of the six components in liver microsomal samples. (x ± SD, n = 6).
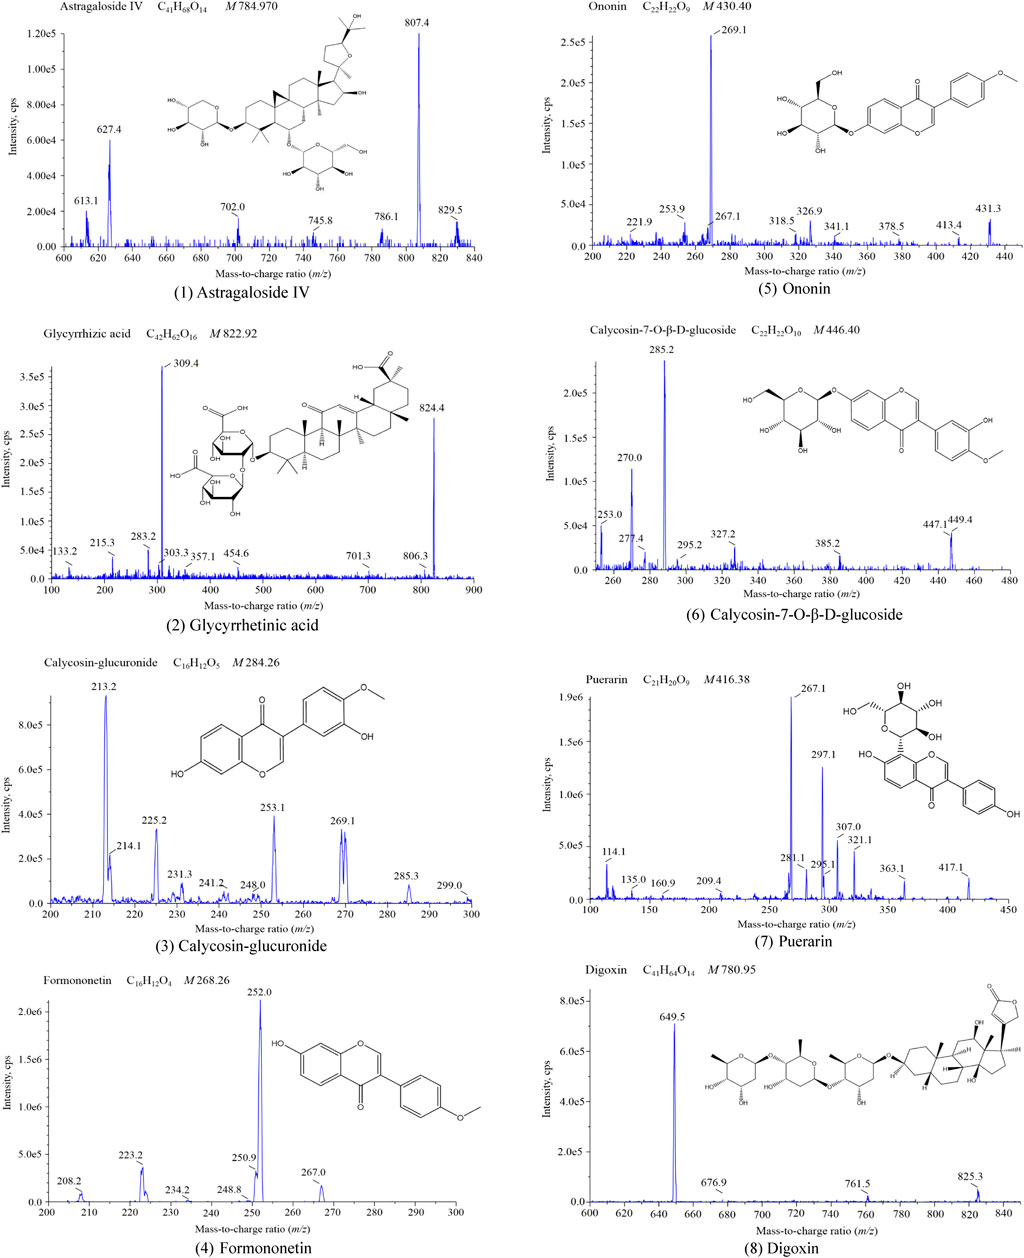
FIGURE 2. Mass spectrogram of the six components and internal standards (1) Astragaloside IV; (2) Glycyrrhetinic acid; (3) Calycosin-glucuronide; (4) Formononetin; (5) Ononin; (6) Calycosin-7-O-β-D-glucoside; (7) Puerarin; (8) Digoxin.
The results are shown in Figure 3. The metabolic conversion rate of astragaloside IV, glycyrrhizic acid, calycosin-glucuronide, formononetin, ononin, calycosin-7-O-β-D-glucoside initially increased with the increase in protein concentration. At higher concentration, the conversion rate for each analyte saturated. Therefore, for subsequent experiments, a 1 mg/mL concentration of liver microsomal protein was selected.
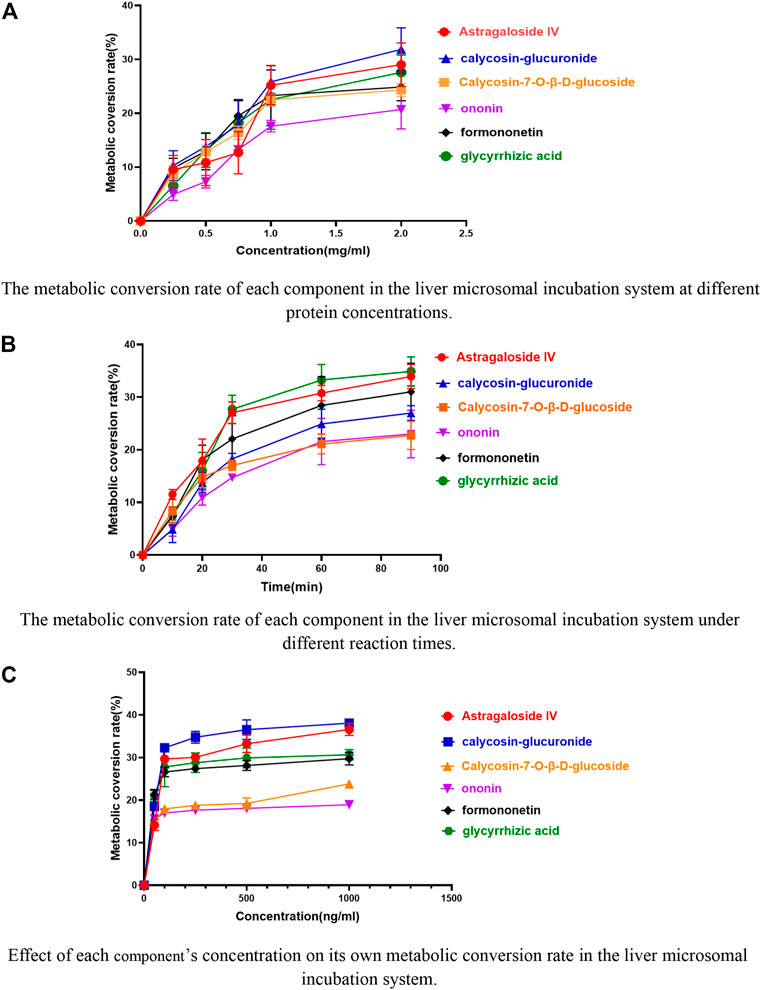
FIGURE 3. Effects of different conditions on the metabolic conversion rate of the six components in the liver microsomal incubation system. (A) The metabolic conversion rate of each component in the liver microsomal incubation system at different protein concentrations. (B) The metabolic conversion rate of each component in the liver microsomal incubation system under different reaction times. (C) Effect of each component’s concentration on its own metabolic conversion rate in the liver microsomal incubation system.
The metabolic conversion rate of astragaloside IV, glycyrrhizic acid, calycosin-glucuronide, formononetin, ononin, calycosin-7-O-β-D-glucoside increased with time, however, saturated after 60 min (Figure 3). Thus, 60 min was selected as the incubation reaction time.
The metabolic conversion rates of the six components increased with the increase of their respective concentrations and plateaued after increasing to 100 ng/mL (Figure 3). Therefore, 100 ng/mL was chosen as the concentration of the six components in the incubation system of liver microsomes.
The effect of specific CYP enzyme inhibitors on the metabolism of six components was investigated (Figure 4). Compared to the control group, all components in negative control group were metabolized obviously, indicating that the condition of liver microsomal incubation system was reasonable and feasible. The addition of specific CYP enzymes inhibitors reveals that ticlopidine, a specific inhibitor of CYP2C37, prevented the metabolism of astragaloside IV and glycyrrhizic acid. Fluconazole, a specific inhibitor of CYP2C11, prevented the metabolism of astragaloside IV and formononetin. α-naphthoflavone, a specific inhibitor of CYP1A2, prevented the metabolism of calycosin-glucuronide. Clomethiazole, a specific inhibitor of CYP2E1, prevented the metabolism of calycosin-glucuronide. Lastly, ketoconazole, a specific inhibitor of CYP3A11, prevented the metabolism of formononetin and glycyrrhizic acid. However, the metabolism of calycosin-7-O-β-D-glucoside and ononin was not affected by the addition of these CYP enzymes inhibitors. Taken together, CYP2C37 and CYP2C11 may be involved in the metabolism of astragaloside IV, while the metabolism of calycosin-glucuronide may be related to CYP1A2 and CYP2E1. Moreover, CYP3A11 and CYP2C11 may be involved in the metabolism of formononetin, and the metabolism of glycyrrhizic acid may be related to CYP3A11 and CYP2C37.
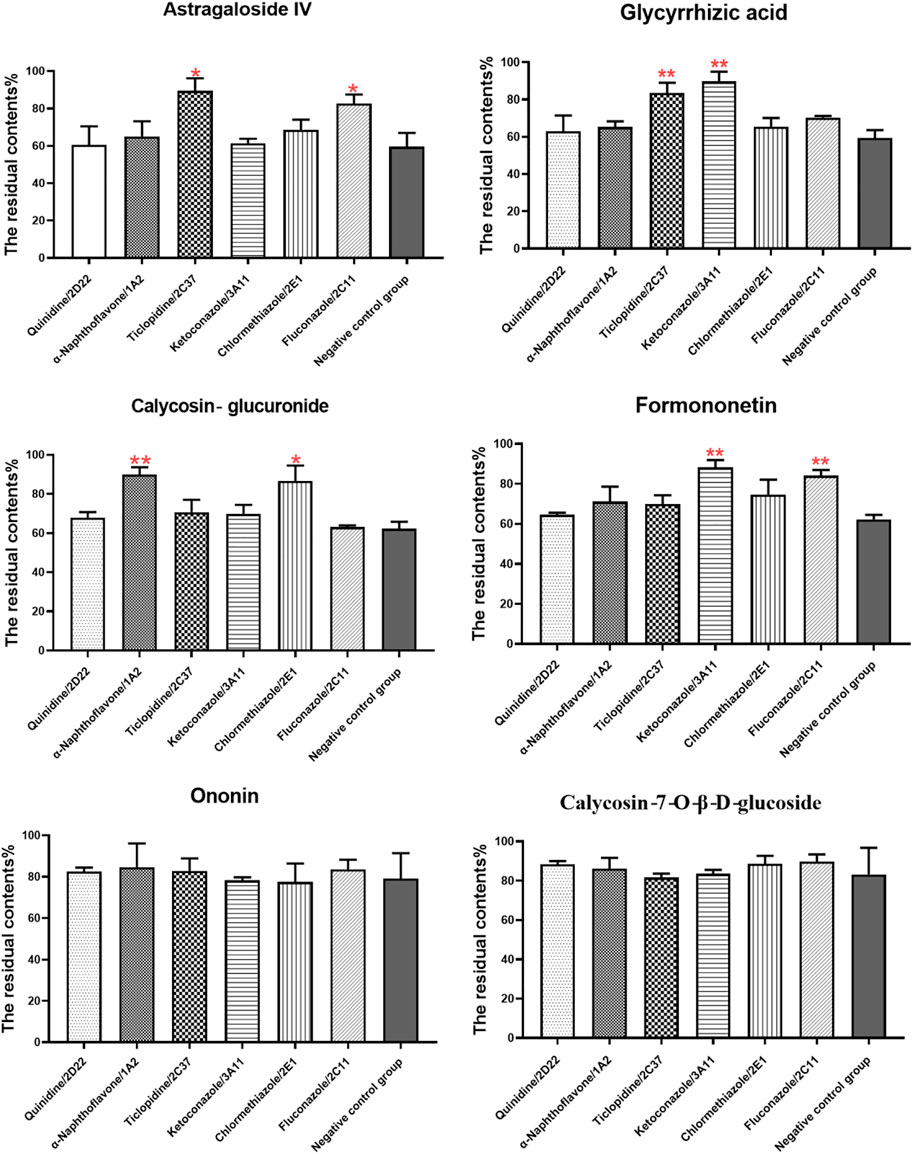
FIGURE 4. Effects of specific CYP enzyme inhibitors on the metabolism of the six components.
The db/db mouse model derived from the C57BL/6J mice has a defective leptin receptor gene with the characteristic of spontaneous diabetes mellitus 2 development. The pathogenesis of this model is very similar to that of human type 2 diabetes mellitus. After 4 weeks of age, this mouse strain gradually develops diabetic signs such as obesity, glycosuria, hyperglycemia, and hyperlipidemia, whereas complications of diabetic nephropathy occur at 8–12 weeks of age (Ponchiardi et al., 2013; Wang et al., 2022c). A previous study by our group found that blood glucose, triglycerides, cholesterol, blood creatinine, urea nitrogen, and 24-h urinary protein were significantly higher in 12-week-old db/db mice compared to control (p < 0.05). Simultaneously, our previous study found that many collagen fibers (blue) were visible in the glomerular basement membrane and tubular interstitium of 12-week-old db/db mice, and significantly more than that of the control, with obvious collagen fiber deposition and obvious glomerular and tubular lesions (Wang et al., 2022d). Therefore, 12-week-old db/db mice were used as the mouse model of diabetic nephropathy and db/m mice of the same age were used as the control. To avoid the effect of disease on drug metabolizing enzymes, the liver of the control mice was used to construct an in vitro liver microsome incubation system.
The CYP450 family of enzymes is the most important enzyme for the oxidative metabolism of drugs in the liver and an important object of preclinical drug metabolism studies. CYPs belong to phase I drug metabolizing enzymes, of which CYP2D6, CYP1A2, CYP2C19, CYP3A4, CYP2E1, and CYP2C9 are the six most dominant subtypes. These six subtypes account for approximately 80% of the liver’s total CYP450 enzymes, and 90% of drugs are metabolized by these six subtypes (Feng et al., 2019). Therefore, the six enzyme subtypes, CY2D6, CY1A2, CY2C19, CY3A4, CY2E1, and CY2C9, which have a large distribution and can metabolize numerous drugs, were selected for our investigation. Humans and mice are both mammals, and although many subtypes of CYP450 enzymes are unique to their species, they also have direct homology and similar functions. Therefore, it is possible to predict the physiological activity of different subtypes of CYP450 in humans by studying homologous subtypes in mice. Therefore, we chose to use mouse liver microsomes for metabolic studies (Martignoni et al., 2006; Li et al., 2017). Among them, mouse CYP1A2, CYP2D22, CYP3A11, CYP2E1, CYP2C11, and CYP2C37 are homologous to human CYP1A2, CYP2D6, CYP3A4, CYP2E1, CYP2C9, and CYP2C19, respectively. (Martignoni et al., 2006; Han et al., 2012; Yang et al., 2016; Weng et al., 2020). First, an in vitro incubation system for liver microsomes was established. According to the correspondence of CYP450 enzyme homologs between humans and mice, the related CYP450 enzyme-specific inhibitors quinidine (CYP2D22), α-naphthoflavone (CYP1A2), ticlopidine (CYP2C37), ketoconazole (CYP3A11), clomethiazole (CYP2E1) and fluconazole (CYP2C11) were added, and high-performance liquid chromatography-triple quadrupole tandem mass spectrometry (HPLC-MS/MS) was used to determine the metabolic residues of the six components (astragaloside IV, glycyrrhizic acid, calycosin-glucuronide, formononetin, ononin, calycosin-7-O-β-D-glucoside). However, the results also showed that CYP450 enzyme-specific inhibitors had no significant effect on calycosin-7-O-β-D-glucoside and ononin in vitro. Active ingredients bind, cleave, and metabolize intestinal flora after entering the intestine, which affects drug absorption and utilization, especially components containing glucosides such as calycosin-7-O-β-D-glucoside and ononin. Moreover, numerous drug transporters found on intestinal epithelial cells are targets for improving drug absorption and bioavailability, and calycosin-7-O- β-D-glucoside and ononin are likely metabolized by other metabolizing enzymes (Zhang et al., 2014; Wang et al., 2015).
An in vitro liver microsomal incubation method was adopted to study the effects of specific inhibitors of liver CYP450 enzymes on the metabolism of the six effective components so as to analyze the dominant CYP enzymes that may be involved in the metabolism of each component. Combined with the changes in enzyme activity in preliminary research, this study explored the possible reasons for the differences in pharmacokinetics of HQD under physiological and pathological states from the perspective of drug metabolism, as well as the possible drug-drug interactions caused by their clinical application. The results provide a theoretical basis for the clinical application and future development of traditional Chinese medicine.
The original contributions presented in the study are included in the article/supplementary material, further inquiries can be directed to the corresponding author.
The animal study was reviewed and approved by The animal studies were approved by the Animal Ethical Committee of Guizhou University of Traditional Chinese Medicine (the approval number is NO1702060).
QW conceived and designed the experiments; QW and TT performed all of the experiments; ZW, HY, YG, SZ, and XC contributed to the operation of mice/materials/reagents/analysis tools; QW and TT analyzed the data; and QW and TT wrote a draft of the paper.
This research was supported by the Project of Guizhou Provincial Department of Education (No. QJHKYZ[2022]257), the Provincial Program on Scientific Research Projects of the Science and Technology Department of Guizhou Province (QKHJC-ZK[2023]YB416), and the Guizhou University of Traditional Chinese Medicine Doctoral Starting Fund ([2020]79).
The authors declare that the research was conducted in the absence of any commercial or financial relationships that could be construed as a potential conflict of interest.
All claims expressed in this article are solely those of the authors and do not necessarily represent those of their affiliated organizations, or those of the publisher, the editors and the reviewers. Any product that may be evaluated in this article, or claim that may be made by its manufacturer, is not guaranteed or endorsed by the publisher.
Chen, C. C., Qin, X. M., Du, G. H., and Zhou, Y. Z. (2019). The "compatible art" of effective components from traditional Chinese medicine, research on the compatibility and proportion of effective components. Acta Pharm. Sin. 54 (5), 808–817. doi:10.16438/j.0513-4870.2018-1119
Chen, X. Y., Huang, X. J., Du, T. L., Zeng, X. H., Yao, L., and Huang, D. E. (2014). Randomized parallel group study on the effect of Huangqiliuyi Decoction on blood sugar, insulin, glycated hemoglobin, cell morphology of diabetic rats. J. Pract. Traditional Chin. Intern. Med. 28 (9), 113–117. doi:10.13729/j.issn.1671-7813.2014.09.54
Dai, Y. J., Guo, M. F., Jiang, L., and Gao, L. (2022). Network pharmacology-based identification of miRNA expression of Astragalus membranaceus in the treatment of diabetic nephropathy. Medicine 101 (5), e28747. doi:10.1097/MD.0000000000028747
El-Sherbeni, A. A., and El-Kadi, A. O. S. (2014). Characterization of arachidonic acid metabolism by rat cytochrome P450 enzymes: The involvement of CYP1As. Drug Metabolism Dispos. 42 (9), 1498–1507. doi:10.1124/dmd.114.057836
Feng, X. L., Liu, Y., Sun, X., Li, A., Jiang, X. Y., etal, , et al. (2019). Pharmacokinetics behaviors of l-menthol after inhalation and intravenous injection in rats and its inhibition effects on CYP450 enzymes in rat liver microsomes. Xenobiotica 49 (10), 1183–1191. doi:10.1080/00498254.2018.1537531
Gong, Z. P., Chen, Y., Zhang, R. J., Yang, Q., and Zhu, X. X. (2015). Advances on pharmacokinetics of traditional Chinese medicine under disease states. China J. Chin. Materia Medica 40 (2), 169–173. doi:10.4268/cjcmm20150202
Han, Y., Ren, B., Jing, G., Jing, G. P., Meng, X. L., Zhou, Z. Y., et al. (2012). Evaluation of impact of Herba Erigerontis injection, a Chinese herbal prescription, on rat hepatic cytochrome P450 enzymes by cocktail probe drugs. J. Ethnopharmacol. 139 (1), 104–109. doi:10.1016/j.jep.2011.10.019
Hou, S. Z., Zhang, T., Li, Y., Guo, F. Y., and Jin, X. (2017). Glycyrrhizic acid prevents diabetic nephropathy by activating AMPK/SIRT1/PGC-1α signaling in db/db Mice. J. Diabetes Res. 2017, 2865912. doi:10.1155/2017/2865912
Hu, M. Y., Liu, C., Zhang, M., Hu, L., and Liuetal, L. (2014). Alteration of cytochrome P450s activity under diabetic conditions and its impact on the development of diabetes mellitus. J. China Pharm. Univ. 45 (2), 153–160. doi:10.11665/j.issn.1000-5048.20140204
Hu, Y. J., Wang, Y. Q., Wang, Y. P., Wang, X. C., and Xiong, Y. (2016). Study on efficient components recognition, compatibility ideas, and quality control mode for Chinese materia medica. Chin. Traditional Herb. Drugs 47 (17), 2965–2971. doi:10.7501/j.issn.0253-2670.2016.17.001
Li, M. M., Zhou, T., and Xv, F. (2017). Comparisons of cytochrome P450 orthologous subtypes in human, rat and mouse. Pharm. Care Res. 17 (2), 81–86. doi:10.5428/pcar20170201
Liu, S. L., Li, A. D., Jiang, B., Mi, J., Nan, H. M., Bao, P., et al. (2022b). Comparison of efficacy and safety of traditional Chinese patent medicines for diabetic nephropathy, A protocol for Bayesian network meta-analysis. Medicine 101 (19), e29152. doi:10.1097/MD.0000000000029152
Liu, X. J., Hu, X. K., Yang, H., Gui, L. M., Cai, Z. X. R., Qi, M. S., et al. (2022a). A Review of traditional Chinese medicine on treatment of diabetic nephropathy and the involved mechanisms. Am. J. Chin. Med. 50, 1739–1779. doi:10.1142/S0192415X22500744
Ma, K. K., Ju, Y. H., Chen, Q. Q., Li, W. Z., Li, W. P., et al. (2019). Effect of astragaloside Ⅳ on regulation of PI3K/Akt/FoxO1 signal in kidney of type 2 diabetic nephropathy rats. Chin. J. Exp. Traditional Med. Formulae 25 (2), 74–81.
Ma, N. H., Zhang, Y., Sun, L. Y., Zhao, Y., and Ding, Y. (2021). Comparative Studies on Multi-Component pharmacokinetics of polygonum multiflorum thunb extract after oral administration in different rat models. Front. Pharmacol. 12, 655332. doi:10.3389/fphar.2021.655332
Martignoni, M., Groothuis, G. M. M., and Kanter, R. D. (2006). Species differences between mouse, rat, dog, monkey and human CYP-mediated drug metabolism, inhibition and induction. Expert Opin. drug metabolism Toxicol. 2 (6), 875–894. doi:10.1517/17425255.2.6.875
Ponchiardi, C., Mauer, M., Najafian, B., and etal, (2013). Temporal profile of diabetic nephropathy pathologic changes. Curr. Diabetes Rep. 4 (13), 592–599. doi:10.1007/s11892-013-0395-7
Qian, M. Y., Gao, X., Chen, X. L., Wang, J. W., Gao, H. F., etal, , et al. (2022). Metabolic characteristics and pharmacokinetic differences of Qiwei Tongbi oral liquid in rheumatoid arthritis rats. Biomed. Chromatogr. BMC 36 (7), e5375. doi:10.1002/bmc.5375
Wang, F. J., Fan, J. E., Pei, T. T., He, Z. E., Zhang, J. X., Ju, L., et al. (2022a). Effects of shenkang pills on early-stage diabetic nephropathy in db/db mice via inhibiting AURKB/RacGAP1/RhoA signaling pathway. Front. Pharmacol. 13, 781806. doi:10.3389/fphar.2022.781806
Wang, L. N., Lin, X., Shen, L., and Feng, Y. (2015). Effect of common clinical diseases on pharmacokinetics of traditional Chinese medicine. Chin. J. Exp. Traditional Med. Formulae 21 (18), 206–210. doi:10.13422/j.cnki.syfjx.2015180206
Wang, Q., Shi, Y., Liu, X. D., Liu, T., Li, Y. J., Song, X., et al. (2022d). Pharmacokinetic difference of six active constituents of Huangqi Liuyi decoction between control and diabetic nephropathy mouse models. Int. J. Anal. Chem. 2022, 1–13. doi:10.1155/2022/7602992
Wang, Q., Shi, Y., Wu, Z. G., Song, X. L., Luo, J. F., Yang, H., et al. (2022b). Effects of Huangqi Liuyi decoction in the treatment of diabetic nephropathy and tissue distribution difference of its six active constituents between normal and diabetic nephropathy mouse models. Front. Pharmacol. 13, 934720–20. doi:10.3389/fphar.2022.934720
Wang, Q., Wang, Y. L., Liu, W., Lu, D., Jin, Y., Tang, N., et al. (2022c). Mechanisms underlying the differences in the pharmacokinetics of six active constituents of Huangqi Liuyi Decoction between normal and diabetic nephropathy mouse models. Evidence-Based Complementary Altern. Med. 2022, 2481654. doi:10.1155/2022/2481654
Wang, R., and Liang, X. M. (2004). Complexity of herb formula and methodology for study as well. Res. Pract. Chin. Med. 18, 98–100. doi:10.3969/j.issn.1673-6427.2004.z1.030
Wen, L. M., Xu, Y. L., Zhen, L., Zhen, J. Y., and Guo, W. F. (2018). Study on the effects and mechanism of astragalus Liuyi Decoction on type 2 diabetes mellitus rats. J. Chin. Med. Mater. 41 (3), 699–702. doi:10.13863/j.issn1001-4454.2018.03.040
Weng, M. Z., Hu, J. B., and Lin, Y. P. (2020). The determination of metabolic pathways of reishi polysaccharide in human liver particles and the vitro inhibition of CYP450 enzymes in human livers. Acta Microsc. 21 (9), 378–386.
Xu, X. Q., Geng, T., Zhang, S. B., Kang, D. Y., Li, Y. J., Ding, G., et al. (2016). Inhibition of Re du ning injection on enzyme activities of rat liver microsomes using cocktail method. Chin. Herb. Med. 8 (3), 231–241. doi:10.1016/s1674-6384(16)60045-x
Yang, R., Ma, X. H., Guo, J. H., and Liu, W. Y. (2016). Characteristics of drug metabolic enzymes.Chin. J. New Drugs 25 (7), 751–759.
Keywords: Huangqi Liuyi decoction, six effective components, CYP450 enzymes, liver microsomal, liver microsomal incubation in vitro
Citation: Wang Q, Tang T, Wu Z, Yang H, Gao Y, Zhang S, Song X and Chen X (2023) Study on the liver Drug’s dominant metabolic enzymes for six effective components of the Huang qi Liuyi decoction. Front. Pharmacol. 14:1175896. doi: 10.3389/fphar.2023.1175896
Received: 28 February 2023; Accepted: 06 April 2023;
Published: 14 April 2023.
Edited by:
Ling Ye, Southern Medical University, ChinaReviewed by:
Qisong Zhang, Guangxi University, ChinaCopyright © 2023 Wang, Tang, Wu, Yang, Gao, Zhang, Song and Chen. This is an open-access article distributed under the terms of the Creative Commons Attribution License (CC BY). The use, distribution or reproduction in other forums is permitted, provided the original author(s) and the copyright owner(s) are credited and that the original publication in this journal is cited, in accordance with accepted academic practice. No use, distribution or reproduction is permitted which does not comply with these terms.
*Correspondence: Qun Wang, Z3l3cTE5ODg1NkAxNjMuY29t
†These authors have contributed equally to this work
Disclaimer: All claims expressed in this article are solely those of the authors and do not necessarily represent those of their affiliated organizations, or those of the publisher, the editors and the reviewers. Any product that may be evaluated in this article or claim that may be made by its manufacturer is not guaranteed or endorsed by the publisher.
Research integrity at Frontiers
Learn more about the work of our research integrity team to safeguard the quality of each article we publish.