 Xiaoqing Li
 Yunhai Bo1†
 Fen Yang
- 1Key laboratory of Carcinogenesis and Translational Research (Ministry of Education), National drug clinical trial center, Peking University Cancer Hospital & Institute, Beijing, China
- 2Chia Tai Tianqing Pharmaceutical Group Co Ltd, Nanjing, Jiangsu, China
Background: TQ-B3203 is a novel topoisomerase I inhibitor currently in development for the treatment of advanced solid tumors. Great differences in pharmacokinetic characteristics were found among individuals according to the phase I clinical trial following intravenous administration of TQ-B3203 liposome injection (TLI) in Chinese patients with advanced solid tumors. Thus, it is significant to establish a population pharmacokinetic model to find the key factors and recognize their effect on pharmacokinetic parameters in order to guide individualized administration.
Methods: Non-linear mixed effect models were developed using the plasma concentrations obtained from the phase I clinical trial by implementing the Phoenix NLME program. Covariates that may be related to pharmacokinetics were screened using stepwise methods. The final model was validated by goodness-of-fit plots, visual predictive check, non-parametric bootstrap and a test of normalized prediction distribution errors.
Results: A three-compartment model with first-order elimination was selected as the best structural model to describe TQ-B3203 disposition adequately. Direct bilirubin (DBIL) and body mass index (BMI) were the two most influential factors on clearance, while lean body weight (LBW) was considered to affect the apparent distribution volume of the central compartment. The population estimations of clearance and central volume were typical at 3.97 L/h and 4.81 L, respectively. Model-based simulations indicated that LBW had a great impact on Cmax, BMI exerted a considerable influence on AUC0-t, and the significance of DBIL on both AUC0-t and Cmax was similarly excellent.
Conclusion: The first robust population pharmacokinetic model of TQ-B3203 was successfully generated following intravenous administration of TLI in Chinese patients with advanced solid tumors. BMI, LBW and DBIL were significant covariates that affected the pharmacokinetics of TQ-B3203. This model could provide references for the dose regimen in the future study of TLI.
1 Introduction
Topoisomerase I, a critical intra-nuclear enzyme for DNA replication, has a higher activity and replication rate in most cancer cells. Camptothecin (CPT), extracted from traditional Chinese medicine prescriptions (Redinbo et al., 1998), is a topoisomerase I inhibitor that could combine topoisomerase I and DNA complex to form a stable ternary complex to prevent DNA reconnection, cause DNA damage, introduce G2/M phase arrest, and therefore lead to cancerous cell apoptosis (Hertzberg et al., 1989; Redinbo et al., 1998). CPT and its derivatives have played an essential role in the treatment of some solid tumors, including colorectal cancer, liver cancer, small-cell lung cancer and glioblastoma (Pommier, 2006; Selas et al., 2021).
Irinotecan, the most representative chemically modified CPT derivative, was created to avoid the poor water-solubility, low antineoplastic activity (Gottlieb and Luce, 1972) and many adverse reactions of CPT (Rozencweig et al., 1976). Although it has been clinically used in anticancer treatments for nearly 28 years after approval by the FDA, some obvious disadvantages still limit its application, such as short half-life and high toxicity (Herben et al., 1996; Chabot, 1997; Pommier, 2006). TQ-B3203 is a novel semisynthetic derivative of CPT with an aliphatic chain. It exhibited more vital pharmacodynamic activity than irinotecan in the tumor growth inhibition test of several cell types (Zhang et al., 2017) because it could accumulate more in cells to increase cytotoxicity due to its higher lipophilicity. Furthermore, TQ-B3203 liposome injection (TLI) was produced after TQ-B3203 was embedded in liposomes in order to acquire a significant reduction in toxicity and improvement of efficacy because liposomes, well-recognized drug delivery carriers, have the ability to prolong drug circulation time, passively accumulate in tumor tissues and increase drug exposure (Drummond et al., 1999; Yang et al., 2013). The formulation-related stability and the distribution in vivo were evaluated in the pre-clinical study (Supplementary Figure S1, S2 in Supplementary Material).
The narrow therapeutic window is a critical defect of cytotoxic anticancer drugs, thus their toxicity has a strong correlation with drug exposure, which depends on the pharmacokinetic characteristics. Therefore, it is necessary to find key factors leading to pharmacokinetic variability among patients (Ardizzoni et al., 1997). Population pharmacokinetic (PopPK) modeling is a standard method to identify the essential determinants of drug disposition by using the drug concentration and covariate information from subjects, such as demographics, clinical laboratory results and genetic characteristics. In previous PopPK studies of irinotecan, some covariates are considered to have significant effects on pharmacokinetic parameters, such as performance status and liver function on clearance (CL) and body weight on apparent distribution volume of the central compartment (V1) (Klein et al., 2002; Mathijssen et al., 2002; Xie et al., 2002). As an analog of irinotecan, TQ-B3203 also showed great differences in pharmacokinetic characteristics among individuals according to the phase I clinical trial, so it is significant to find the potential covariates on pharmacokinetic parameters in order to guide individualized administration.
In this study, we aimed to develop a PopPK model of TQ-B3203. The influence of selected internal and external factors on pharmacokinetics was recognized and quantified to characterize the pharmacokinetic difference among individuals. Additionally, the effects of significant covariates on TQ-B3203 exposure in patients were also explored. This study will provide critical information for the future development and clinical application of TQ-B3203.
2 Methods
2.1 Clinical trial
This multi-center, dose-escalation phase I clinical study (Register No. NCT03447145) was conducted to assess the pharmacokinetic characteristics and safety of TQ-B3203 after TLI intravenous administration. This study was designed in accordance with the ethical principles described in the Declaration of Helsinki and approved by the Ethics Committee of Peking University Cancer Hospital. All patients signed informed consent prior to their enrollment in this study. The process of this phase I clinical study did not involve randomization, blinding and power analysis, and the attrition was recorded.
Demographic characteristics were collected from electronic medical records. Patients aged 18–80 years with clearly diagnosed advanced solid tumors were enrolled in this study. Other key inclusion criteria were as follows: body mass index (BMI) of 18.5–26 kg/m2, Eastern Cooperative Oncology Group (ECOG) performance status of 0–1, life expectancy > 3 months, normal primary organ functions and >30 days recovery after receiving anti-tumor treatment or surgery.
Patients were not eligible if they have suffered from other malignant tumors within 5 years, have participated in other clinical trials within 4 weeks, have received other CPT analog therapy, and were in possession of neurological, circulatory and urinary diseases such as meningitis, pericardial effusion, coagulopathy or hypertension.
2.2 Drug administration and sampling
The novel anticancer drug TLI was provided by Nanjing Chia-tai Tianqing Pharmaceutical Group (Nanjing, China). Patients received TLI with dose levels ranging from 2 to 45 mg/m2 by intravenous infusion for 90 min on days 1 (cycle 1) and 22 (cycle 2). Blood samples were collected at pre-dose, 45 and 90 min after the infusion start, and were obtained at .5, 1, 2, 4, 8, 12, 24, 48, 72 and 96 h after the end of the infusion. The whole blood samples were immediately centrifuged at 3,000 rpm for 10 min at 4°C and obtained plasma samples were stored at −80°C pending analysis.
2.3 Analytical methods
The plasma concentration of TQ-B3203 in this study was determined using a fully validated liquid chromatography-tandem mass spectrometry (LC-MS/MS) method with bis (p-nitrophenyl) phosphate (2 mol/L) used as the esterase inhibitor and TQ-B3203-d8 used as the internal standard (the structures of TQ-B3203 and TQ-B3203-d8 are shown in Supplementary Figure S3 in Supplementary Material), which has been reported in the previous study (Yang et al., 2021). The plasma samples were protein precipitated by methanol and the processed samples were chromatographed on an AQUITY BEH C8 column (50 × 2.1 mm, id 1.7 μm) with acetonitrile and water (.1% formic acid) as the mobile phase. Mass spectrometric analysis was performed on Waters Xevo TQS tandem mass spectrometer (Waters Corp. Milford, MA, United States) equipped with an electrospray ionization source in positive mode (ESI+). The ESI source settings were as follows: Capillary voltage, 4.0 kV; Source temperature, 150°C; Desolvation temperature, 500°C; Cone gas flow, 150 L/h; Desolvation gas flow, 1000 L/h; Nebulizer gas pressure, 7 bar. Multiple reaction monitoring (MRM) transitions and related collision energy were m/z 949.5→393.1 (58 eV) for TQ-B3203 and m/z 957.4→398.0 (50 eV) for TQ-B3203-d8. The linear range of TQ-B3203 was .5–500 ng/mL. Accuracy and precision were within the acceptable range of FDA bioanalytical assay validation criteria (e.g., ± 15%).
2.4 Pharmacokinetic study and statistical analyses
The pharmacokinetic parameters such as CL, the apparent volume of distribution (Vz), elimination half-life (t1/2), the area under the plasma concentration-time curve from zero to the last time (AUC0-t) and from zero to infinity (AUC0-inf) were analyzed and calculated by the non-compartmental analysis (NCA) using the Phoenix (RRID:SCR_003163) WinNonlin (version 8.3, Pharsight Corporation, CA, United States), except that maximum observed plasma concentration (Cmax) and time to Cmax (Tmax) were obtained directly from the observed concentration. The pharmacokinetic parameters (CL, Vz, t1/2 and AUC0-t) between cycles 1 and 2 were compared using paired t-tests, with significance denoted by p < .05.
2.5 PopPK modeling
The PopPK analysis of TQ-B3203 was performed using non-linear, mixed-effect modeling of Phoenix (RRID:SCR_003163) NLME (Version 8.3, Pharsight Corporation, CA, United States). R program (Version 4.2.0, R Project for Statistical Computing, RRID:SCR_001905, http://www.r-project.org/) was used for statistical summaries and graphical analysis. The first-order conditional estimation-extended least-squares (FOCE-ELS) method built into the modeling program was applied for the estimation of pharmacokinetic parameters, covariate testing and model diagnostic.
2.5.1 Basic model
According to the semilogarithmic plots of individual TQ-B3203 plasma concentration-time, two- and three-compartment models with first-order elimination were tried to describe the dataset. Inter-individual variability (IIV, η, eta) was estimated by an exponential model, which was shown in Eq. 1:
where
Inter-occasion variability (IOV) on the CL and the V1 between Day 1 in cycles 1 (occasion 1) and 2 (occasion 2) was estimated in the basic model before the covariate selection. It was also included in the model as an exponential term (ηIOV) in Eq. 2 and Eq. 3 (Karlsson and Sheiner, 1993):
in which
The model superiority was determined by better visual inspection of the diagnostic plots and a smaller diagnostic index such as objective function (OFV), Akaike Information Criteria (AIC) and Bayesian information criteria (BIC). It was considered statistically significant that the OFV value (1 degree of freedom in χ2 distribution) was decreased by ≥ 3.84 points (p < .05).
2.5.2 Covariate analysis
Several covariates used for covariate analysis were directly obtained from the electronic medical records, such as age, height, weight, total bilirubin (TBIL), direct bilirubin (DBIL), indirect bilirubin (IBIL), baseline alanine aminotransferase (ALT), baseline aspartate transaminase (AST), sex, UGT1A1*28 mutation type and UGT1A1*6 mutation type. Other covariates were those from further calculated, including BMI, body surface area (BSA), lean body weight (LBW), body fat rate (BF%), endogenous creatinine clearance rate (CLcr), ideal body weight (IBW), adjusted weight and adjusted CLcr. BMI was calculated by the World Health Organization (WHO) admitted formula (Keys et al., 1972), and the BSA was obtained by applying Du Bios’ formula (Du Bois and Du Bois, 1916). The LBW and BF% were considered as other covariates and added to the PopPK model because of the high lipid solubility of the drugs (Park et al., 2018). The Cockcroft-Gault formula (Eq. 4) was used to figure out the CLcr (Cockcroft and Gault, 1976). Additional covariates such as IBW (Eq. 5) (McCarron et al., 1974; Robinson et al., 1983), adjusted weight (Eq. 6) and adjusted CLcr (calculated by adjusted weight for BMI >25 kg/m2) were introduced into the model (Winter et al., 2012).
For males:
For females:
The effect of continuous covariates was described by the power function after the normalization using the population median (Eq. 7), and the effect of categorical covariates was modeled using the exponential function (Eq. 8):
where
However, not all the covariates mentioned above were applied to construct the final covariate model in order to avoid the presence of covariate collinearity. In the univariate screening process, when both two covariates had a significant impact on the same pharmacokinetic parameter and they were highly correlated (r > .5), such as CLcr and adjusted CLcr, only one of them was reserved in the model. The covariates that remained were selected or excluded utilizing forward and backward stepwise on the basis of the change of OFV value. If the decrease of OFV exceeded 3.84 points (p < .05, df = 1), the covariates could join the basic model in the forward inclusion process. Subsequently, backward elimination was employed to confirm the covariate selection. If the increase of OFV was less than 6.64 points (p < .01, df = 1), the covariates should be retained in the final PopPK model. Moreover, the correlation between IIV of pharmacokinetic parameters should be clarified to construct a covariance model.
2.6 Model validation
Goodness-of-fit (GOF) plots, visual predictive check (VPC), non-parametric bootstrap and test of normalized distribution errors (NPDE) were adopted to confirm the validity of the final model. The GOF plots evaluated the reliability of the final model, including drug concentration observations (DV) versus population predictions (PRED) or individual predictions (IPRED) and conditional weighted residuals (CWRES) versus time or PRED. VPC was performed by simulating 1,000 virtual data per time in the final model based on Monte Carlo simulation and the model predictions and DV at the 5th, 50th and 95th percentiles were compared. The bootstrap analysis was implemented to judge the robustness of the last model. During this analysis, the initial dataset was randomly resampled 1,000 times with replacement, and then the obtained 95% confidence intervals of pharmacokinetic parameters were compared with the typical value of parameters in the final model. NPDE values, which were supposed to obey standard normal distribution if the final model was effective, were acquired after the 1,000 times simulation of each subject observation.
2.7 Model application
This final PopPK model was used to predict TQ-B3203 exposure (AUC0-t and Cmax), with the pharmacokinetic parameters counted by individual Bayes estimates. The sensitive plots were painted to clarify the effect of an identified covariate on the exposure parameters. Considering the occurrence of adverse effects, the single dose at 25 mg/m2 level was finally chosen as a simulated dosing regimen in a representative population (with the median values of continuous covariates considered as the typical value). When the impact of one identified covariate was evaluated, the value of this covariate was regarded as the 5th or 95th percentiles of the population, with other covariates fixed to the typical value. The general exposure under the influence of covariates was compared with the exposure of the typical population.
3 Results
3.1 Clinical data summary
A total of 316 TQ-B3203 concentrations from 15 subjects with 25 episodes were used in the PopPK modeling. The demographic and clinical characteristics of baseline continuous and categorical covariates gathered from subjects are summarized in Table 1.
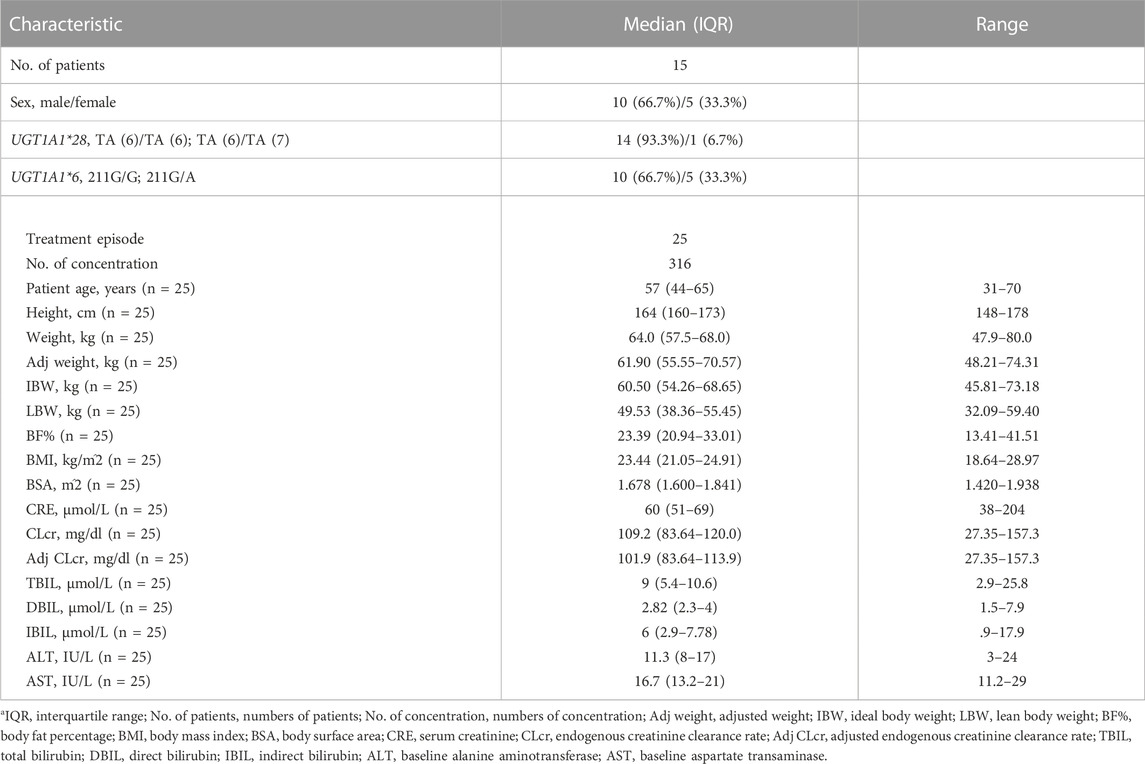
TABLE 1. Baseline demographic and clinical characteristicsa.
3.2 Pharmacokinetic analysis
The mean plasma TQ-B3203 concentration versus time semilogarithmic plot at different levels is displayed in Figure 1. The corresponding pharmacokinetic parameters are presented in Table 2. Cmax always appears at the end of intravenous injection (1.5 h), followed by an obvious rapid elimination phase and a slow elimination phase. The half-life of TQ-B3203 is about 10–41 h (n = 15, median = 19.62, mean = 20). There is no significant difference in pharmacokinetic parameters between cycles 1 and 2 shown in Figure 2. Furthermore, an obvious accumulation of TQ-B3203 was not found in these dose groups.
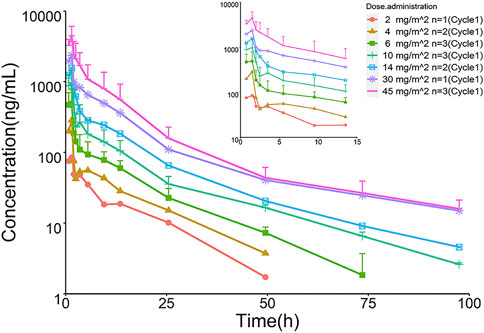
FIGURE 1. Semilogarithmic plots of mean concentration versus time of TQ-B3203.
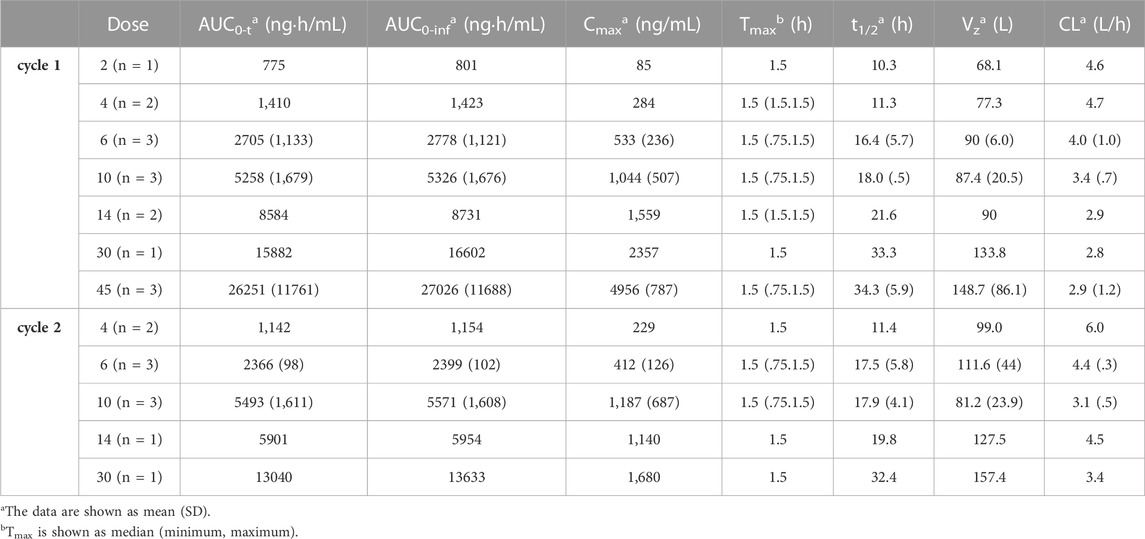
TABLE 2. Main pharmacokinetic parameters of TQ-B3203 calculated by NCA.
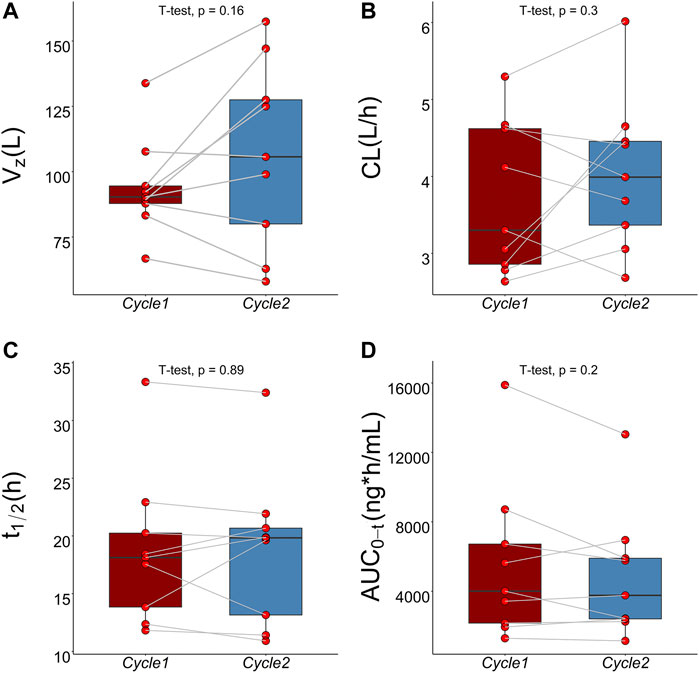
FIGURE 2. Comparison of pharmacokinetic parameters between cycle 1 and cycle 2 using paired t-test. (A) Comparison of Vz between cycle 1 and cycle 2, (B) Comparison of CL between cycle 1 and cycle 2, (C) Comparison of t1/2 between cycle 1 and cycle 2, (D) Comparison of AUC0-t between cycle 1 and cycle 2.
3.3 PopPK model development
A three-compartment model with first-order elimination, which was parameterized as the V1, the shallow peripheral volume of distribution (V2), the deep peripheral volume of distribution (V3), the CL and the inter-compartment clearance (CL2 and CL3), was selected as the best structural model to describe the pharmacokinetic profiles of TQ-B3203. The optimal model evaluation results were acquired in the selection of an exponential model to characterize the inter-individual variability and a log-additive model to describe intra-individual variability, so the pharmacokinetic parameters were estimated with the natural logarithm-transformed (log) plasma TQ-B3203 concentration data. IOV was not included in the model, because after the incorporation of IOV on CL and V1, the log-additive error changed little from 22.4% to 21.4% and the fitting degree of the subsequent model was always poor in models, although there was a statistically significant decrease in OFV. Actually, there was no significant difference in pharmacokinetic parameters between cycles 1 and 2, so it could be considered that the cycle did not significantly affect the pharmacokinetic behavior of the TQ-B3203 in vivo. The distribution and correlation of continuous covariates are shown in Figure 3. The categorical covariate sex and continuous covariates such as LBW and DBIL were considered to have significant influences on the same pharmacokinetic parameters simultaneously, and the correlation between them required to be examined (shown in Figure 4). Two covariates with a correlation coefficient greater than .5 were refrained from containing in the covariate screening process simultaneously in order to avoid the covariate collinearity. So only adjusted CLcr, BMI, UGT1A1*28 genotype, UGT1A1*6 genotype, DBIL, ALT and LBW, both uncorrelated to each other, were utilized for covariate screening after the collinearity check. The results of forward and backward stepwise procedures are presented in detail in Table 3. The OFV significant decreases of adding BMI, DBIL and LBW to covariate models indicated that both three covariates had significant impacts on the pharmacokinetic parameters of TQ-B3203. The computational formulas of pharmacokinetic parameters V1 and CL in the final model are shown as follows:
where 4.81 L and 3.97 L/h are typical values of V1 and CL, respectively. The median values of significant covariates LBW, BMI and DBIL are 49.53 kg, 23.44 kg/m2 and 2.82 μmol/L. The estimated correlation coefficients such as 1.18, .78 and −.24, represent the relationship between LBW and V1, BMI and CL, DBIL and CL, respectively. The final PopPK parameters estimations are summarized in Table 4, which were obtained with satisfactory precision (RSE%<38%) and within the 95% confidence interval of bootstrap results.
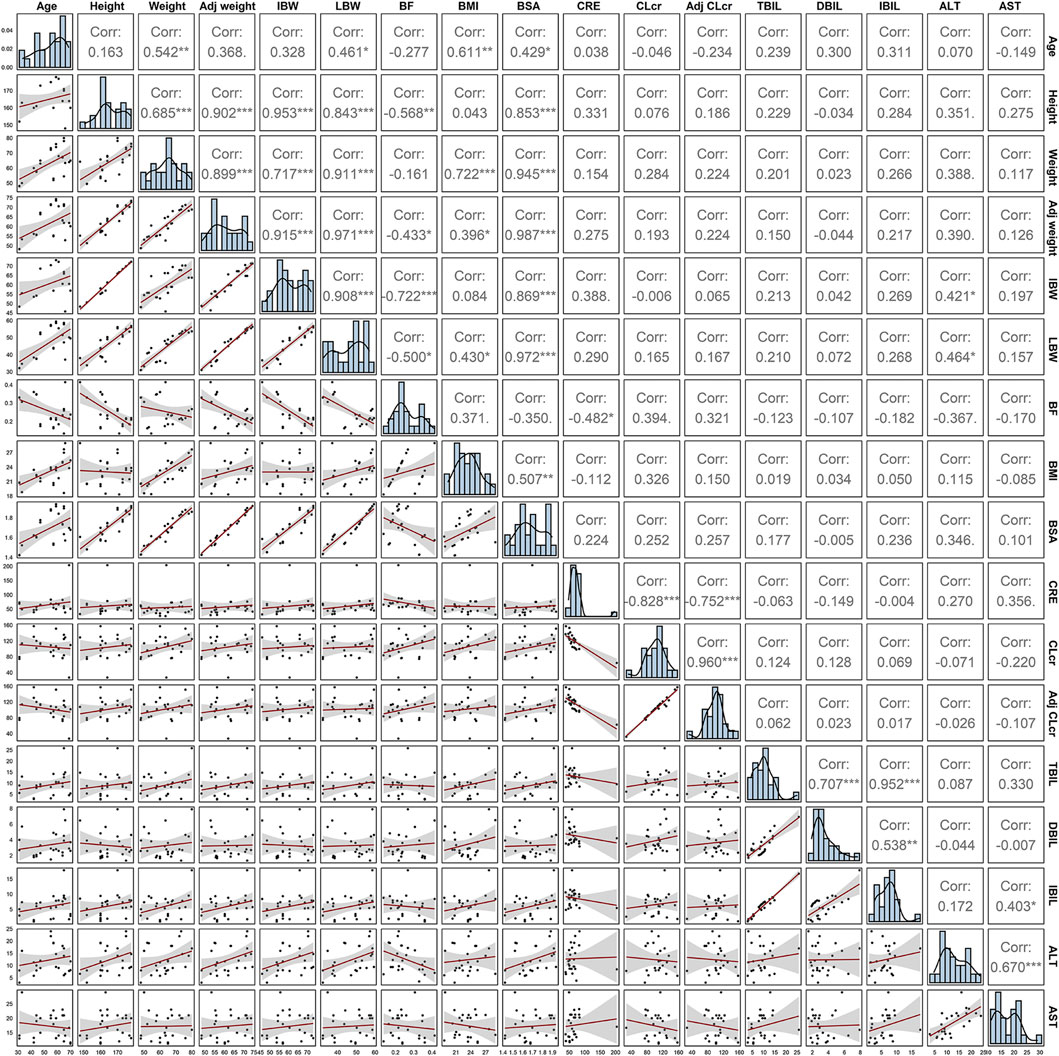
FIGURE 3. Spearman correlation analysis of continuous covariates.
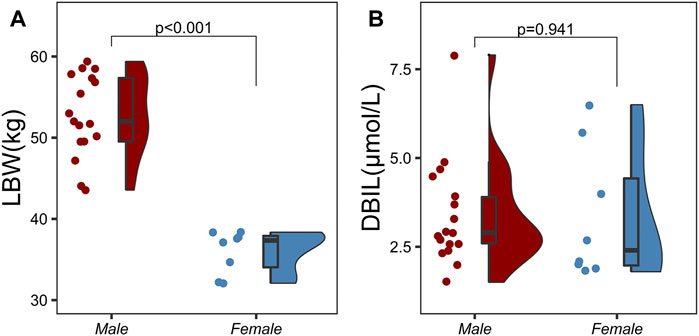
FIGURE 4. Correlation analysis between categorical variables and continuous variables using two independent samples t-test. (A) Correlation analysis between sex and lean body weight (LBW), (B) Correlation analysis between sex and direct bilirubin (DBIL).
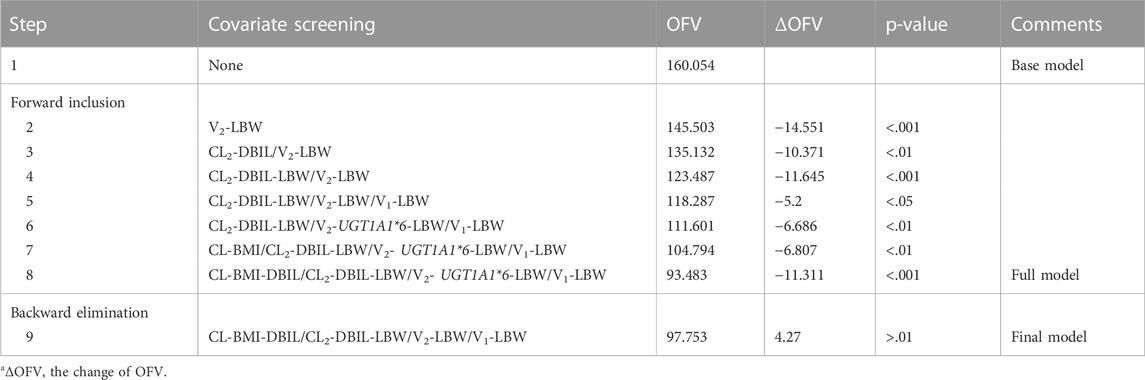
TABLE 3. Results of the forward and backward stepwise procedurea.
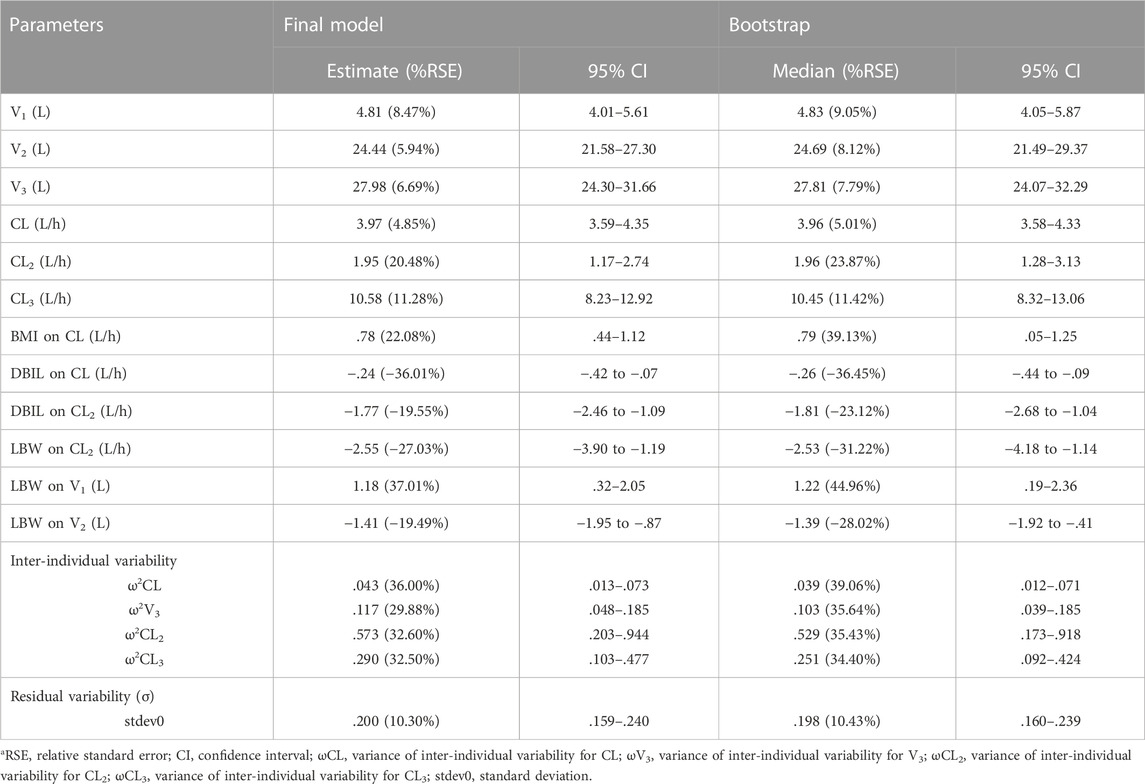
TABLE 4. Pharmacokinetics parameter estimate in the final model and bootstrap resultsa.
3.4 Model validation
Pharmacokinetic curves of treatment episodes were predicted using the final model. The result, shown in Figure 5, indicated that the log IPRED profiles could almost entirely describe the log DV. The final model was evaluated by diagnostic plots shown in Figure 6, which suggested that the model was of good fit. The log DV versus log PRED or log IPRED was close-to-symmetrically distributed by the reference y = x, and the majority of CWRES versus log PRED or time were randomly distributed between −2 and +2 with no obvious bias. The VPC plots in Figure 7 indicated that the final model had excellent prediction performance because the vast majority of log DV were contained within the model-based simulated confidence intervals. All pharmacokinetic parameters estimations of the final model were included in the 95% confidence interval computed from the non-parametric bootstrap, listed in Table 4. As Figure 8 showed, the NPDE was considered a normal distribution and variance homogeneity, and the NPDE versus time or prediction had no apparent tendency to deviate from specified intervals. Furthermore, a statistical summary of the NPDE value distribution demonstrated that the mean did not significantly differ from 0 (Student’s t-test, p = .591), variance had no remarkable difference from 1 (Fisher test, p = .265), and NPDE distribution was considered to be a standard normal distribution (Shapiro-Wilks test of normality, p = .539) so that the final model was appropriate to describe these observations. The results above indicated that the final model achieved the right qualifications for predicting and assessing pharmacokinetics in this group of patients.
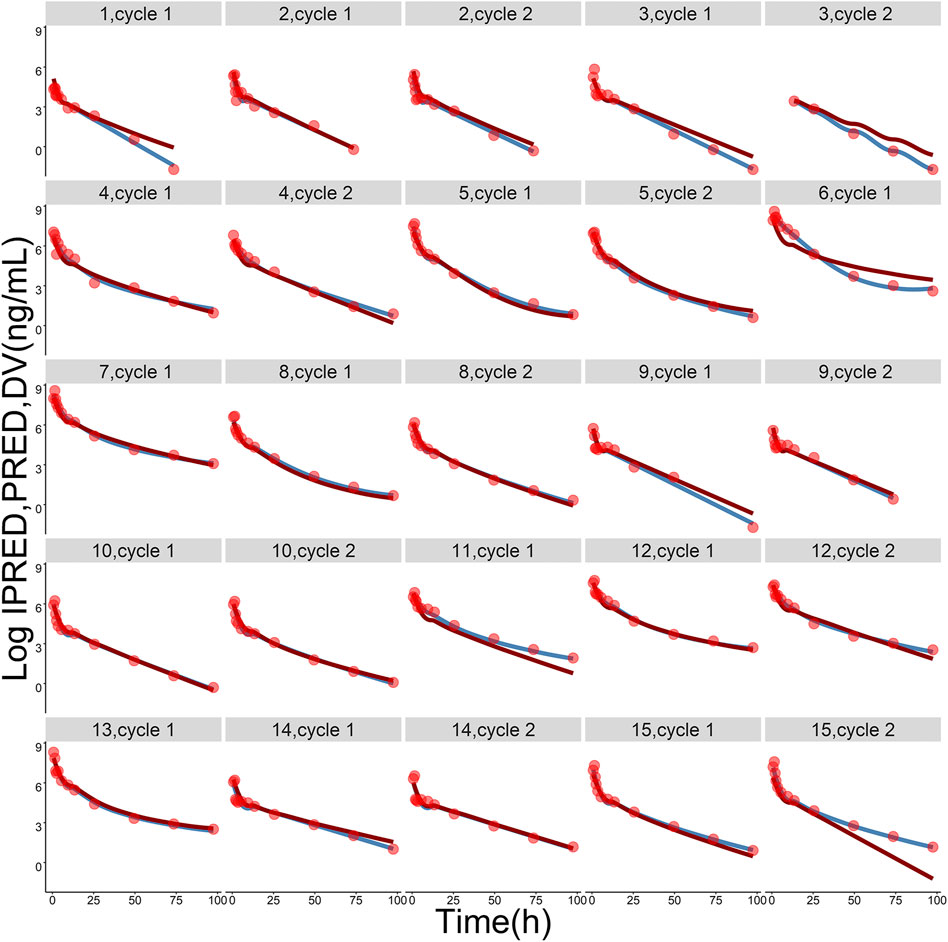
FIGURE 5. The logarithmic-transformed observations (log DV, red dots), logarithmic-transformed population predictions (log PRED, dark-red lines) and logarithmic-transformed individual predictions (log IPRED, steel-blue lines) from the final population pharmacokinetic model. The gray label on the top of each picture represents ID of each subject and treatment cycle.
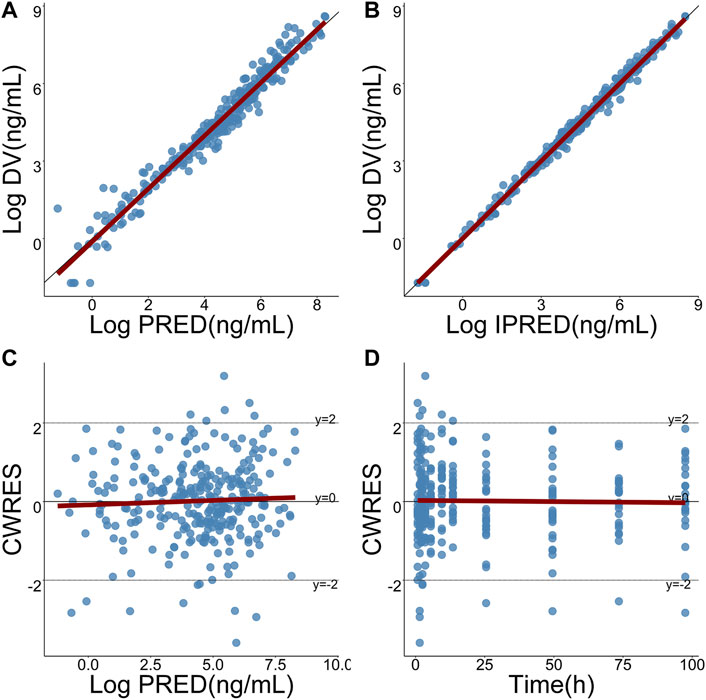
FIGURE 6. Goodness-of-fits plots for the final model. (A) Logarithmic-transformed observations (log DV) of TQ-B3203 versus logarithmic-transformed population predictions (log PRED), (B) Log DV versus logarithmic-transformed individual predictions (log IPRED), (C) Conditional weighted residual (CWRES) versus log PRED, (D) CWRES versus time. The dark-red lines represent linear regression.
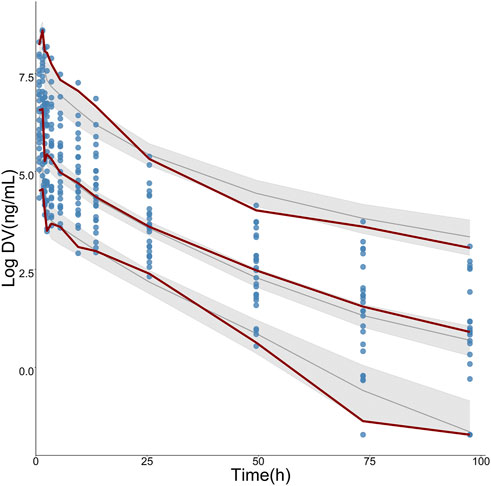
FIGURE 7. Visual predictive check (VPC) for logarithmic-transformed observations (log DV) of TQ-B3203. The steel-blue points represent log DV, while the dark-red dotted lines represent the 5th, 50th, and 95th percentiles of log DV. The solid black lines show the 5th, 50th, and 95th percentiles of simulated results, and the shaded regions represent the 95% confidence intervals for medians (solid black lines), respectively.
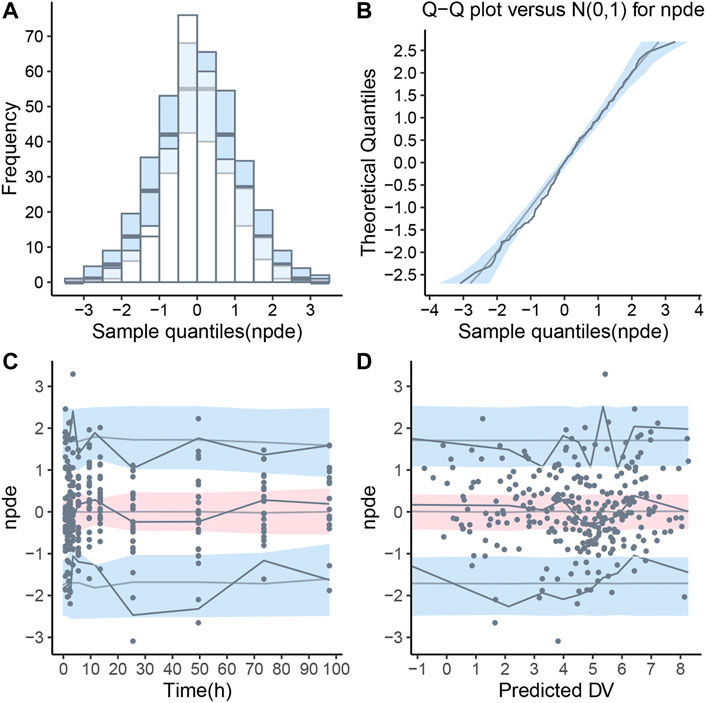
FIGURE 8. Normalized prediction distribution error (NPDE) for final population pharmacokinetic model. (A) Histogram of NPDE distribution with the density of the theoretical standard normal distribution (semi-transparent blue fields), (B) Quantile-quantile plot of NPDE against expected standard normal distribution (semi-transparent blue fields), (C) Scatterplot of NPDE versus time, (D) Scatterplot of NPDE versus population predictions (PRED). These two scatterplots showed the observations as blue dots, the median observations as solid red lines, the 5th and 95th percentiles of observations as solid blue lines, and 95% confidence intervals of relevant forecast percentiles as the red or blue fields.
3.5 Model application
The influence of significant covariates on TQ-B3203 predicted exposure (AUC0-t and Cmax) is presented in Figure 9. The percentage of AUC0-t and Cmax change was calculated compared with a simulated typical subject whose AUC0-t and Cmax were 9909.74 ng*h/mL and 1824.91 ng/mL, respectively. These 2 bar charts indicated that LBW had a great impact (14.44%) on Cmax but little (2.19%) on AUC0-t. On the contrary, BMI exerted a considerable influence (34.67%) on AUC0-t but a small (7.28%) on Cmax. The significance of DBIL on both AUC0-t (36.76%) and Cmax (31.54%) was similarly excellent.
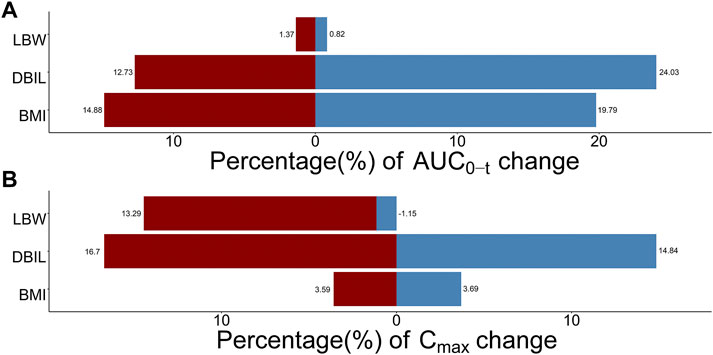
FIGURE 9. Sensitive analysis plots comparing the influence of covariates on TQ-B3203 exposure (AUC0-t and Cmax). (A) The effect of covariates on AUC0-t, (B) The effect of covariates on Cmax. The percentage of change is calculated compared with a simulated typical population whose AUC0-t is 9909.74 ng*h/mL and Cmax is 1824.91 ng/mL.
4 Discussion
This research aimed to establish a PopPK model to find the potential covariates of inter-individual variation because highly variable pharmacokinetic characteristics of TQ-B3203 were observed in the phase I clinical trial. According to the results, a three-compartment model with first-order elimination was considered as the optimal structural model to characterize concentration data, in which the typical CL and V1 were estimated as 3.97 L/h and 4.81 L, respectively. DBIL and BMI were the two most influential factors on CL, and LBW was considered to affect V1 following the stepwise covariate modeling process. Furthermore, LBW was found to be related to V2 as well as CL2, and CL2 was also influenced by DBIL.
In the previous PopPK analysis of irinotecan, the SN38 (a metabolite of irinotecan) concentration was also included to build a combined model, because irinotecan is a prodrug and SN38 showed a 300–1,000 times higher activity than irinotecan (Berg et al., 2015; Adiwijaya et al., 2017; Oyaga-Iriarte et al., 2019; Brendel et al., 2021; Liu et al., 2022). In this study, although TQ-B3203 also could be metabolized to produce SN38, the conversion ratio was very low (<5%), and TQ-B3203 mainly existed in the form of the prototype in vivo. It is reasonable that only the TQ-B3203 concentration was used in the modeling procedure.
BMI is the most extensively used indicator of judging whether an individual is thin, overweight or obese. Generally, the bigger the BMI value is, the fatter the person is, and the increasing BMI value or obesity will cause slow distribution, prolonged half-life and relatively decreased CL of lipophilic drugs due to its high tendency to distribute in adipose tissue (Powis et al., 1987). However, obesity could also boost phase I and phase II metabolism procedures, thus resulting in increased drug CL (Abernethy et al., 1983; Morgan and Bray, 1994; Marik and Varon, 1998; Brill et al., 2012). In this study, BMI was positively correlated with CL, which was consistent with other fat-soluble drugs, such as tigecycline and dilmapimod (Xie et al., 2017; Yang and Dumitrescu, 2017).
LBW could quantify the variation of renal and hepatic CL for individuals and provide the basis for the conceptual transformation of the relationship between body components and CL (Han et al., 2007). Although the relationship between LBW and CL was theoretically strong, it was not found in this study, which may be due to insufficient samples (Morgan and Bray, 1994). In the present model, LBW was the only significant covariate for V1 and larger LBW was associated with greater V1.
In the preclinical study, TQ-B3203 was found to be excreted into feces through bile in the form of the prototype. The impaired bile excretion function will lead to the increase of DBIL level and the decrease of TQ-B3203 CL, so DBIL was negatively correlated with TQ-B3203 CL, which could be identified in this study. In addition, other liver function-related indicators such as TBIL, IBIL, ALT and AST were all considered to be included in this covariate analysis at first. After the univariate screening process, only DBIL and ALT were retained in the final covariate selection to avoid covariate collinearity, but we did not find evidence of ALT as a significant covariate on CL.
As a study to establish a PopPK model of a novel antitumor agent using the data obtained from early clinical trials, there is a defect that is not neglected. Due to the limited number of subjects in the dose-escalating stage of the phase I clinical trial, the range of covariates provided by the population was narrow, so the extrapolation of research results was restricted. However, the intensive sampling points of every subject could offer detailed preliminary data on the pharmacokinetics of advanced solid tumor patients. This could make up for the defect of a small number of subjects to some extent and improve the significance of our model. This study is the first PopPK analysis of TQ-B3203, more extensive research is needed to take place to identify clinically relevant covariates of TQ-B3203 pharmacokinetics. The significant covariates obtained in this study, such as LBW, BMI and DBIL, suggested that weight and liver function related covariates may be the important factors affecting the pharmacokinetics of TQ-B3203, which could provide references for subsequent studies.
5 Conclusion
The first robust PopPK model of TQ-B3203 was successfully generated following intravenous administration of TLI in Chinese patients with advanced solid tumors. BMI, LBW, and DBIL were significant covariates that affected the pharmacokinetics of TQ-B3203. The final model was applied to predict the influence of significant covariates on drug exposure. In a word, this PopPK model could provide the references for the dose regimen in the future study of TLI.
Data availability statement
The original contributions presented in the study are included in the article/Supplementary Materials, further inquiries can be directed to the corresponding author.
Ethics statement
The studies involving human participants were reviewed and approved by Ethics Committee of Peking University Cancer Hospital. The patients/participants provided their written informed consent to participate in this study.
Author contributions
XQL and YB: Acquisition, analysis, or interpretation of data, drafting of the manuscript, review of the manuscript. HY, XHL, and XUL: Acquisition, analysis, or interpretation of data, review of the manuscript. FY: Study design, analysis, or interpretation of data, drafting of the manuscript, review of the manuscript, funding acquisition.
Funding
This work was supported by National Natural Science Foundation of China (Nos. 82073817 and 81602655) and Science Foundation of Peking University Cancer Hospital (No.2021-3).
Conflict of interest
Author XL is employed by Chia Tai Tianqing Pharmaceutical Group CO., Ltd.
The remaining authors declare that the research was conducted in the absence of any commercial or financial relationships that could be construed as a potential conflict of interest.
Publisher’s note
All claims expressed in this article are solely those of the authors and do not necessarily represent those of their affiliated organizations, or those of the publisher, the editors and the reviewers. Any product that may be evaluated in this article, or claim that may be made by its manufacturer, is not guaranteed or endorsed by the publisher.
Supplementary Material
The Supplementary Material for this article can be found online at: https://www.frontiersin.org/articles/10.3389/fphar.2023.1102244/full#supplementary-material
References
Abernethy, D. R., Greenblatt, D. J., Divoll, M., and Shader, R. I. (1983). Enhanced glucuronide conjugation of drugs in obesity: Studies of lorazepam, oxazepam, and acetaminophen. J. Laboratory Clin. Med. 101 (6), 873–880.
Adiwijaya, B. S., Kim, J., Lang, I., Csoszi, T., Cubillo, A., Chen, J. S., et al. (2017). Population pharmacokinetics of liposomal irinotecan in patients with cancer. Clin. Pharmacol. Ther. 102 (6), 997–1005. doi:10.1002/cpt.720
Ardizzoni, A., Hansen, H., Dombernowsky, P., Gamucci, T., Kaplan, S., Postmus, P., et al. (1997). Topotecan, a new active drug in the second-line treatment of small-cell lung cancer: A phase II study in patients with refractory and sensitive disease. The European organization for research and treatment of cancer early clinical studies group and new drug development office, and the lung cancer cooperative group. J. Clin. Oncol. 15 (5), 2090–2096. doi:10.1200/JCO.1997.15.5.2090
Berg, A. K., Buckner, J. C., Galanis, E., Jaeckle, K. A., Ames, M. M., and Reid, J. M. (2015). Quantification of the impact of enzyme-inducing antiepileptic drugs on irinotecan pharmacokinetics and SN-38 exposure. J. Clin. Pharmacol. 55 (11), 1303–1312. doi:10.1002/jcph.543
Brendel, K., Bekaii-Saab, T., Boland, P. M., Dayyani, F., Dean, A., Macarulla, T., et al. (2021). Population pharmacokinetics of liposomal irinotecan in patients with cancer and exposure-safety analyses in patients with metastatic pancreatic cancer. CPT Pharmacometrics Syst. Pharmacol. 10 (12), 1550–1563. doi:10.1002/psp4.12725
Brill, M. J., Diepstraten, J., van Rongen, A., van Kralingen, S., van den Anker, J. N., and Knibbe, C. A. (2012). Impact of obesity on drug metabolism and elimination in adults and children. Clin. Pharmacokinet. 51 (5), 277–304. doi:10.2165/11599410-000000000-00000
Chabot, G. G. (1997). Clinical pharmacokinetics of irinotecan. Clin. Pharmacokinet. 33 (4), 245–259. doi:10.2165/00003088-199733040-00001
Cockcroft, D. W., and Gault, M. H. (1976). Prediction of creatinine clearance from serum creatinine. Nephron 16 (1), 31–41. doi:10.1159/000180580
Drummond, D. C., Meyer, O., Hong, K., Kirpotin, D. B., and Papahadjopoulos, D. (1999). Optimizing liposomes for delivery of chemotherapeutic agents to solid tumors. Pharmacol. Rev. 51 (4), 691–743.
Du Bois, D., and Du Bois, E. F. (1916). A formula to estimate the approximate surface area if height and weight be known. Arch. Intern. Med. XVII, 863–871. doi:10.1001/archinte.1916.00080130010002
Gottlieb, J. A., and Luce, J. K. (1972). Treatment of malignant melanoma with camptothecin (NSC-100880). Cancer Chemother. Rep. 56 (1), 103–105.
Han, P. Y., Duffull, S. B., Kirkpatrick, C. M., and Green, B. (2007). Dosing in obesity: A simple solution to a big problem. Clin. Pharmacol. Ther. 82 (5), 505–508. doi:10.1038/sj.clpt.6100381
Herben, V. M. M., ten Bokkel Huinink, W. W., and Beijnen, J. H. (1996). Clinical pharmacokinetics of topotecan. Clin. Pharmacokinet. 31 (2), 85–102. doi:10.2165/00003088-199631020-00001
Hertzberg, R. P., Caranfa, M. J., and Hecht, S. M. (1989). On the mechanism of topoisomerase I inhibition by camptothecin: Evidence for binding to an enzyme-DNA complex. Biochemistry 28 (11), 4629–4638. doi:10.1021/bi00437a018
Karlsson, M. O., and Sheiner, L. B. (1993). The importance of modeling interoccasion variability in population pharmacokinetic analyses. J. Pharmacokinet. Biopharm. 21 (6), 735–750. doi:10.1007/bf01113502
Keys, A., Fidanza, F., Karvonen, M. J., Kimura, N., and Taylor, H. L. (1972). Indices of relative weight and obesity. J. Chronic Dis. 25 (6), 329–343. doi:10.1016/0021-9681(72)90027-6
Klein, C. E., Gupta, E., Reid, J. M., Atherton, P. J., Sloan, J. A., Pitot, H. C., et al. (2002). Population pharmacokinetic model for irinotecan and two of its metabolites, SN-38 and SN-38 glucuronide. Clin. Pharmacol. Ther. 72 (6), 638–647. doi:10.1067/mcp.2002.129502
Liu, Z., Martin, J. H., Liauw, W., McLachlan, S. A., Link, E., Matera, A., et al. (2022). Evaluation of pharmacogenomics and hepatic nuclear imaging-related covariates by population pharmacokinetic models of irinotecan and its metabolites. Eur. J. Clin. Pharmacol. 78 (1), 53–64. doi:10.1007/s00228-021-03206-w
Marik, P., and Varon, J. (1998). The obese patient in the ICU. Chest 113 (2), 492–498. doi:10.1378/chest.113.2.492
Mathijssen, R. H., Verweij, J., de Jonge, M. J., Nooter, K., Stoter, G., and Sparreboom, A. (2002). Impact of body-size measures on irinotecan clearance: Alternative dosing recommendations. J. Clin. Oncol. 20 (1), 81–87. doi:10.1200/JCO.2002.20.1.81
McCarron, M. M., Devine, B. J. J. D. I., and Pharmacy, C. (1974). Clinical pharmacy: Case studies: Case number 25 gentamicin therapy. Drug Intell. Clin. Pharm. 8 (11), 650–655. doi:10.1177/106002807400801104
Morgan, D. J., and Bray, K. M. (1994). Lean body mass as a predictor of drug dosage. Implications for drug therapy. Clin. Pharmacokinet. 26 (4), 292–307. doi:10.2165/00003088-199426040-00005
Oyaga-Iriarte, E., Insausti, A., Sayar, O., and Aldaz, A. (2019). Population pharmacokinetic model of irinotecan and its metabolites in patients with metastatic colorectal cancer. Eur. J. Clin. Pharmacol. 75 (4), 529–542. doi:10.1007/s00228-018-02609-6
Park, J. H., Choi, S. M., Park, J. H., Lee, K. H., Yun, H. J., Lee, E. K., et al. (2018). Population pharmacokinetic analysis of propofol in underweight patients under general anaesthesia. Br. J. Anaesth. 121 (3), 559–566. doi:10.1016/j.bja.2018.04.045
Pommier, Y. (2006). Topoisomerase I inhibitors: Camptothecins and beyond. Nat. Rev. Cancer 6 (10), 789–802. doi:10.1038/nrc1977
Powis, G., Reece, P., Ahmann, D. L., and Ingle, J. N. (1987). Effect of body weight on the pharmacokinetics of cyclophosphamide in breast cancer patients. Cancer Chemother. Pharmacol. 20 (3), 219–222. doi:10.1007/BF00570489
Redinbo, M. R., Stewart, L., Kuhn, P., Champoux, J. J., and Hol, W. G. (1998). Crystal structures of human topoisomerase I in covalent and noncovalent complexes with DNA. Science 279 (5356), 1504–1513. doi:10.1126/science.279.5356.1504
Robinson, J. D., Lupkiewicz, S. M., Palenik, L., Lopez, L. M., and Ariet, M. (1983). Determination of ideal body weight for drug dosage calculations. Am. J. Hosp. Pharm. 40 (6), 1016–1019. doi:10.1093/ajhp/40.6.1016
Rozencweig, M., Slavik, M., Muggia, F. M., and Carter, S. K. (1976). Overview of early and investigational chemotherapeutic agents in solid tumors. Med. Pediatr. Oncol. 2 (4), 417–432. doi:10.1002/mpo.2950020408
Selas, A., Martin-Encinas, E., Fuertes, M., Masdeu, C., Rubiales, G., Palacios, F., et al. (2021). A patent review of topoisomerase I inhibitors (2016-present). Expert Opin. Ther. Pat. 31 (6), 473–508. doi:10.1080/13543776.2021.1879051
Winter, M. A., Guhr, K. N., and Berg, G. M. (2012). Impact of various body weights and serum creatinine concentrations on the bias and accuracy of the Cockcroft-Gault equation. Pharmacotherapy 32 (7), 604–612. doi:10.1002/j.1875-9114.2012.01098.x
Xie, J., Roberts, J. A., Alobaid, A. S., Roger, C., Wang, Y., Yang, Q., et al. (2017). Population pharmacokinetics of tigecycline in critically ill patients with severe infections. Antimicrob. Agents Chemother. 61 (8), 003455–e417. doi:10.1128/AAC.00345-17
Xie, R., Mathijssen, R. H., Sparreboom, A., Verweij, J., and Karlsson, M. O. (2002). Clinical pharmacokinetics of irinotecan and its metabolites: A population analysis. J. Clin. Oncol. 20 (15), 3293–3301. doi:10.1200/JCO.2002.11.073
Yang, F., Wang, H., Liu, M., Hu, P., and Jiang, J. (2013). Determination of free and total vincristine in human plasma after intravenous administration of vincristine sulfate liposome injection using ultra-high performance liquid chromatography tandem mass spectrometry. J. Chromatogr. A 1275, 61–69. doi:10.1016/j.chroma.2012.12.026
Yang, F., Zhou, J., Bo, Y., Yin, H., Liu, X. H., and Li, J. (2021). A validated UHPLC-MS/MS method for determination of TQ-B3203 in human plasma and its application to a pharmacokinetic study in Chinese patients with advanced solid tumor. J. Sep. Sci. 44 (5), 945–953. doi:10.1002/jssc.202001023
Yang, S., and Dumitrescu, T. P. (2017). Population pharmacokinetics and pharmacodynamics modelling of dilmapimod in severe trauma subjects at risk for acute respiratory distress syndrome. Drugs R. D. 17 (1), 145–158. doi:10.1007/s40268-016-0161-9
Keywords: population pharmacokinetic model, camptothecin, TQ-B3203, model validation, model application
Citation: Li X, Bo Y, Yin H, Liu X, Li X and Yang F (2023) Population pharmacokinetic analysis of TQ-B3203 following intravenous administration of TQ-B3203 liposome injection in Chinese patients with advanced solid tumors. Front. Pharmacol. 14:1102244. doi: 10.3389/fphar.2023.1102244
Received: 18 November 2022; Accepted: 04 January 2023;
Published: 16 January 2023.
Edited by:
Stanislav Yanev, Bulgarian Academy of Sciences (BAS), BulgariaReviewed by:
Xiangmeng Wu, University of Arizona, United StatesJiaqi Mi, Boehringer Ingelheim, Germany
Copyright © 2023 Li, Bo, Yin, Liu, Li and Yang. This is an open-access article distributed under the terms of the Creative Commons Attribution License (CC BY). The use, distribution or reproduction in other forums is permitted, provided the original author(s) and the copyright owner(s) are credited and that the original publication in this journal is cited, in accordance with accepted academic practice. No use, distribution or reproduction is permitted which does not comply with these terms.
*Correspondence: Fen Yang, eWY3ODU0QDE2My5jb20=
†These authors have contributed equally to this work and shared senior authorship