 Kyung U. Hong
 Kennedy M. Walls
 David W. Hein
- Department of Pharmacology & Toxicology, Brown Cancer Center, University of Louisville School of Medicine, Louisville, KY, United States
Arylamine N-acetyltransferase 2 (NAT2) is a phase II metabolic enzyme, best known for metabolism of aromatic amines and hydrazines. Genetic variants occurring in the NAT2 coding region have been well-defined and are known to affect the enzyme activity or protein stability. Individuals can be categorized into rapid, intermediate, and slow acetylator phenotypes that significantly alter their ability to metabolize arylamines, including drugs (e.g., isoniazid) and carcinogens (e.g., 4-aminobiphenyl). However, functional studies on non-coding or intergenic variants of NAT2 are lacking. Multiple, independent genome wide association studies (GWAS) have reported that non-coding or intergenic variants of NAT2 are associated with elevated plasma lipid and cholesterol levels, as well as cardiometabolic disorders, suggesting a novel cellular role of NAT2 in lipid and cholesterol homeostasis. The current review highlights and summarizes GWAS reports that are relevant to this association. We also present a new finding that seven, non-coding, intergenic NAT2 variants (i.e., rs4921913, rs4921914, rs4921915, rs146812806, rs35246381, rs35570672, and rs1495741), which have been associated with plasma lipid and cholesterol levels, are in linkage disequilibrium with one another, and thus form a novel haplotype. The dyslipidemia risk alleles of non-coding NAT2 variants are associated with rapid NAT2 acetylator phenotype, suggesting that differential systemic NAT2 activity might be a risk factor for developing dyslipidemia. The current review also discusses the findings of recent reports that are supportive of the role of NAT2 in lipid or cholesterol synthesis and transport. In summary, we review data suggesting that human NAT2 is a novel genetic factor that influences plasma lipid and cholesterol levels and alters the risk of cardiometabolic disorders. The proposed novel role of NAT2 merits further investigations.
1 Introduction
Human populations separate into rapid, intermediate and slow acetylator phenotypes based on their capacity to catalyze the N-acetylation of aromatic amine and hydrazine drugs via N-acetyltransferase 2 (NAT2) as reviewed previously (McDonagh et al., 2014). NAT2 phenotypes have been associated with both ineffective dosing and drug toxicities with drugs commonly used for important conditions such as isoniazid for the prevention and treatment of tuberculosis (Hein and Millner, 2021). Similarly, NAT2 phenotypes have been associated with differential cancer risk following exposures to aromatic amine carcinogens metabolized by NAT2 (García-Closas et al., 2005; Agúndez, 2008; Moore et al., 2011; Hein, 2018).
Numerous investigations have documented that NAT2 acetylator phenotype is associated with single nucleotide polymorphisms (SNPs) in the 870 bp NAT2 coding exon. None of these SNPs have been shown to affect NAT2 mRNA expression (Salazar-González et al., 2020); rather the SNPs in the NAT2 coding exon cause changes in NAT2 protein structure that can affect stability and/or substrate affinity (Walraven et al., 2008; Hein, 2009; Zhou et al., 2013).
2 Non-coding NAT2 variants associated with elevated plasma lipid and cholesterol levels
While previous studies on NAT2 genetic polymorphism have focused on variants in the coding exon (see Introduction), NAT2 variants in the non-coding or intergenic region have not been characterized, despite of the fact that many of these non-coding variants have been linked to pathological conditions by independent genome wide association studies (GWAS) (Table 1; Supplementary Table S1). In fact, all but one (i.e., rs1208) NAT2 variants linked to different traits by previous GWAS are either intronic or intergenic variants. Among NAT2 variants identified by GWAS, a total of 15 non-coding variants (out of 30) (i.e., rs11780610, rs11782802, rs13277394, rs1495741, rs1495743, rs1495745, rs1961456, rs34987019, rs35246381, rs35583283, rs4646248, rs4921913, rs4921914, rs4921915, and rs6997340) are independently linked to differential plasma lipid or cholesterol levels (Table 1; Supplementary Table S1).
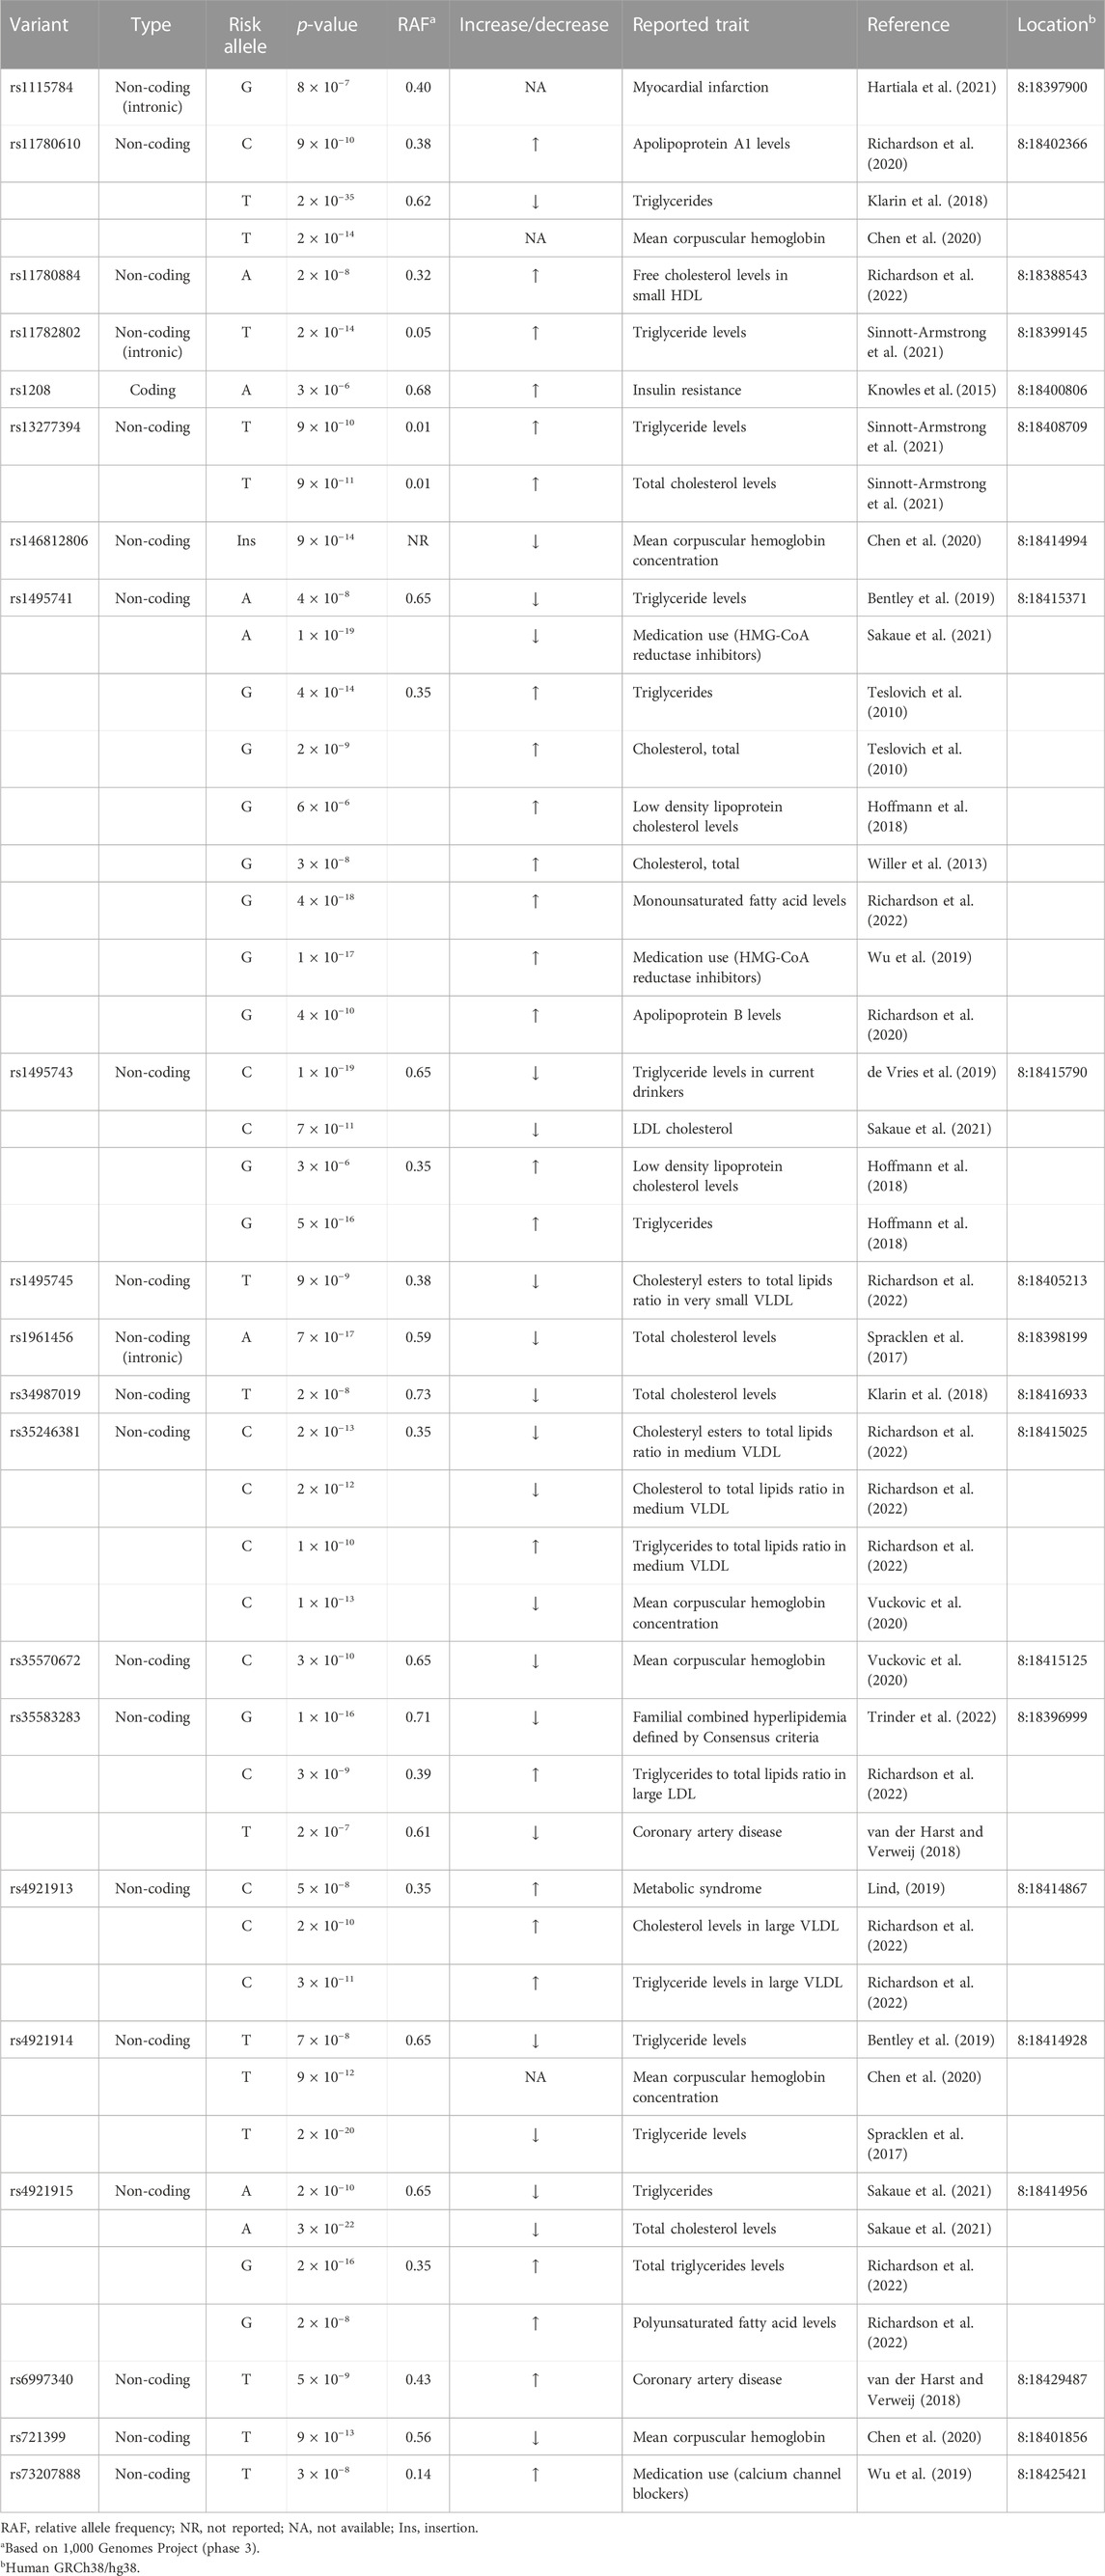
TABLE 1. NAT2 genetic variants associated with differential plasma lipid, cholesterol, or fatty acid levels.
One intergenic variant, rs1495741 (chr8: 18415371; GRCh38/hg38), located approximately 14 kb downstream of the NAT2 coding region, has been linked to more than 65 traits by multiple, independent GWAS (Table 1; Supplementary Table S1). Most of these GWAS-linked traits are related to plasma lipid, fatty acid, and cholesterol levels (i.e., 58 out of 68 traits). For instance, the “G” allele of rs1495741 (rs1495741-G) (relative allele frequency [RAF] 0.35) has been linked to elevated levels of multiple plasma lipid profiles, including triglyceride, phospholipids, and fatty acids (Table 1; Supplementary Table S1). Consistent with this finding, its other major allele, rs1495741-A (RAF 0.65), has been linked to a decreased level of plasma triglyceride (Table 1; Supplementary Table S1). In addition, rs1495741-G is independently associated with elevated plasma cholesterol (free or total) levels and also with elevated ratio of cholesteryl esters-to-total lipids in small LDL, as well as apolipoprotein B level (Table 1; Supplementary Table S1). With respect to the ratio of cholesterol-to-total lipids or cholesteryl esters-to-total lipids in HDL, rs1495741-G is associated with a significantly decreased ratio. Moreover, not only is rs1495741-G linked to an elevated level of total free fatty acids in plasma, but also to increased monosaturated or saturated free fatty acid levels (Table 1; Supplementary Table S1). Another intergenic variant, rs4921913 (chr8:18414867), which is located approximately 500 bp from rs1495741, has been linked to 30 traits so far. The common traits (i.e., 26 out of 30 reported traits) linked to the “C” allele of rs4921913 include significant increases in plasma lipid, fatty acid, and cholesterol levels (Table 1; Supplementary Table S1). Similarly, thirteen other non-coding variants of NAT2 (i.e., rs11780610, rs11782802, rs13277394, rs1495743, rs1495745, rs1961456, rs34987019, rs35246381, rs35583283, rs4646248, rs4921914, rs4921915, and rs6997340) are linked to differential plasma lipid and/or cholesterol levels. Taken together, half of non-coding or intergenic variants of NAT2 associate with dyslipidemia.
3 Non-coding NAT2 variants are associated with increased risks of cardiometabolic disorders
It is often difficult to assess if elevated lipid or cholesterol levels conferred by NAT2 genetic variants can ultimately lead to clinically meaningful outcomes. However, several GWAS findings support the idea that they contribute to clinical consequences. For instance, rs4646248-T (RAF 0.61) which is associated with elevated triglycerides to total lipids ratio, is also linked to coronary artery disease by two independent GWAS (Table 1; Supplementary Table S1), whereas its other major allele, r4646248-C (RAF 0.39), is linked to decreased coronary artery disease risk by two independent GWAS (Table 1; Supplementary Table S1). Similarly, rs1115784-G (RAF 0.40) is linked to increased risk of myocardial infarction (Table 1; Supplementary Table S1). A couple of coding (rs1208-A; RAF 0.68) and non-coding (rs4921913-C; RAF 0.35) NAT2 SNPs also have been linked to metabolic disorders, i.e., insulin resistance and metabolic syndrome, respectively (Table 1; Supplementary Table S1). Although rs1208, a coding SNP, has not been linked to differential plasma lipid or cholesterol levels by previous GWAS, rs4921913-C is linked to elevated plasma cholesterol, triglyceride, total lipid, and phospholipid levels by numerous GWAS (Table 1; Supplementary Table S1).
Additionally, a recent GWAS by Trinder et al. (2022) reported that “G” allele of an intronic SNP, rs35583283 (RAF 0.71), is associated with familial combined hyperlipidemia (Table 1; Supplementary Table S1). A GWAS study published in 2014 investigated shared molecular pathways and gene networks for cardiovascular disease and type 2 diabetes in women of three different ethnic backgrounds (Chan et al., 2014). Among Caucasian women, for the combined phenotype (cardiovascular disease + type 2 diabetes), a NAT2 SNP, rs7825609, reached genome-wide significance in the standard GWAS analysis (Table 1; Supplementary Table S1) (Chan et al., 2014). Unlike other non-coding variants discussed above, rs7825609 is located approximately 2.5 kb upstream of the NAT2 coding region and approximately 0.4 kb downstream of a long non-coding RNA gene, ENSG00000285624 (chr8:18386311–18388323).
Non-coding NAT2 variants also have been associated with increased cardiovascular medication usage, which indirectly supports that dyslipidemia conferred by risk alleles of NAT2 variants can result in clinically pathological conditions. For example, rs73207888-T (RAF 0.14) is associated with increased usage of calcium channel blockers (Table 1; Supplementary Table S1) which are commonly prescribed for cardiovascular conditions, such as hypertension (Eisenberg et al., 2004). In addition, rs1495741-G, which is linked to elevated cholesterol levels by multiple, independent GWAS, is also associated with increased incidence of HMG-CoA reductase inhibitor use (Table 1; Supplementary Table S1), a popular class of drugs used to treat hypercholesterolemia and prevent development of atherosclerosis (Bansal and Cassagnol, 2022).
In summary, some of the NAT2 variants, which are associated with elevated plasma lipid and cholesterol levels, also have been identified as risk alleles for cardiometabolic disorders, including coronary artery disease, myocardial infarction, and metabolic syndrome, as well as increased cardiovascular drug use. Collectively, these data suggest that elevated plasma lipid or cholesterol levels conferred by the NAT2 risk alleles can culminate in development of cardiometabolic disorders. These GWAS findings are consistent with the well-established fact that hyperlipidemia or hypercholesterolemia is a major risk factor for cardiometabolic disease (Nelson, 2013).
4 Identification of a new NAT2 haplotype/locus linked to plasma lipid and cholesterol levels
Previously, it was reported that two variants associated with hyperlipidemia, rs1495741 and rs4921914, are in linkage disequilibrium (LD) (Fathzadeh et al., 2018). We examined if other NAT2 genetic variants linked to hyperlipidemia (Table 1; Supplementary Table S1) are in LD with one another, using tools available at Ensembl genome browser and data from 1000 Genomes Project (Fairley et al., 2020; Ensembl Genome Browser, 2022; Linkage Disequilibrium Calculator - Homo_sapiens - Ensembl genome browser 106, 2022), Surprisingly, seven variants (i.e., rs1495741, rs4921913, rs4921914, rs4921915, rs146812806, rs35246381, and rs35570672) showed LD r2 value of approximately 1.0 with one another in all human populations from 1000 Genomes Project (Figure 1 and data not shown). Six of them are SNPs, whereas rs146812806 is an insertion–deletion mutation (i.e., “indel”). Interestingly, these seven variants are all non-coding, intergenic variants located approximately 14 kb downstream of NAT2 coding region and within ∼0.5 kb from one another (ch8: 18272377–18272881) (Figure 1; Table 3). This implies that these seven closely located variants represent a haplotype (a.k.a, linked polymorphism). To our knowledge, such finding has never been reported previously. Another SNP, rs34987019 (ch8:18,416,933), associated with plasma cholesterol level (Table 1; Supplementary Table S1), also is in LD with rs14957141 in certain populations (LD r2 = 0.36–0.94) (Linkage Disequilibrium Calculator - Homo_sapiens - Ensembl genome browser 106, 2022). However, according to our in silico analysis, the insulin resistance risk allele, rs1208, or a myocardial infarction risk allele, rs1115784, (Table 1; Supplementary Table S1), were not in LD (r2 < 0.8) with any of the seven variants in the haplotype (data not shown).
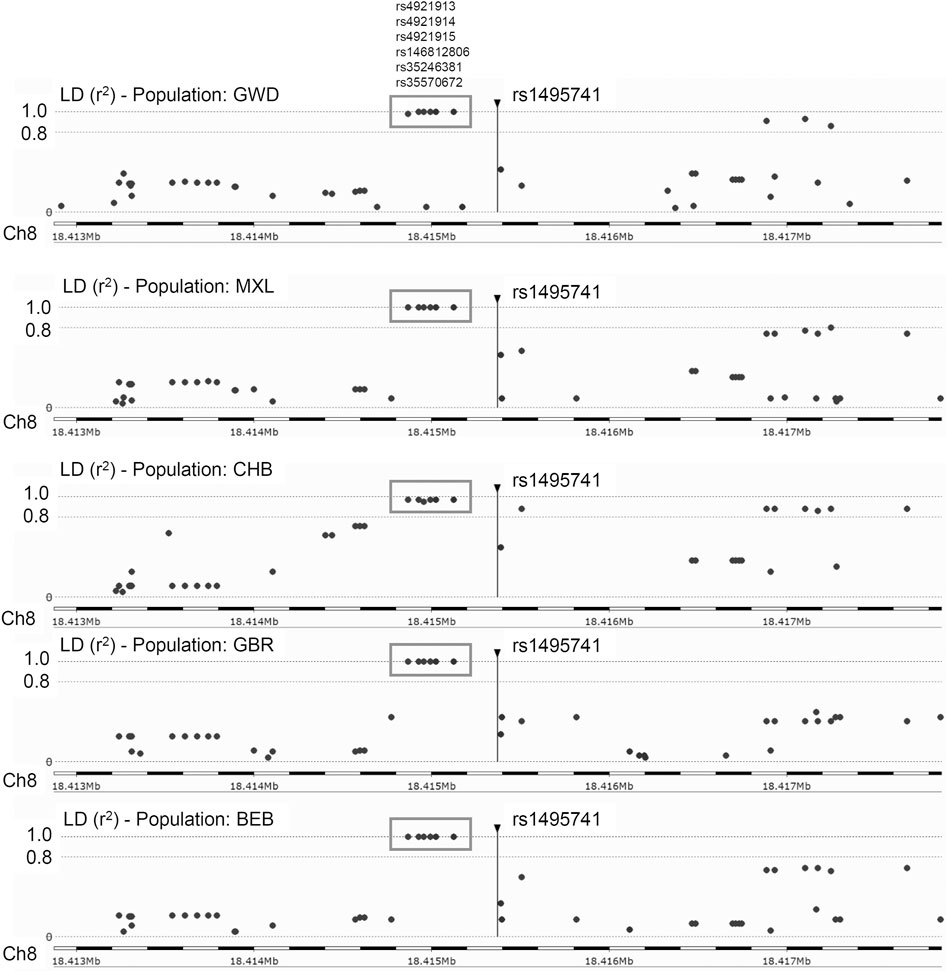
FIGURE 1. Linkage disequilibrium (LD) plots for rs1495741 in representative populations from 1000 Genomes Project. The plots show variants that are (or are not) in linkage disequilibrium with rs1495741. Each dot represents a variant (in a surrounding 5-kb region). The longitudinal dotted lines show LD r2 value of 1.0 and 0.8, with respect to rs1495741. Numbers on the bottom axis show the location on human chromosome 8 (GRCh38/hg38). The position of rs1495741 is represented by a vertical line. Six variants in the grey box (i.e., rs4921913, rs4921914, rs4921915, rs146812806. rs35246381, and rs35570672) are in linkage disequilibrium with rs1495741 with r2 value of ∼1.0 in multiple human populations from 1000 Genomes Project (1000 Genomes Project Consortium et al., 2015). GWD, Gambian in Western Division; MXL, Mexican Ancestry in Los Angeles; CHB, Han Chinese in Beijing, China; GBR, British in England and Scotland; BEB, Bengali in Bangladesh. The plots were generated using Ensembl’s linkage disequilibrium calculator (Linkage Disequilibrium Calculator - Homo_sapiens - Ensembl genome browser 106, 2022).
Five out of the seven variants (rs1495741, rs35246381, rs4921915, rs4921914, and rs4921913) in this haplotype have been reported to be associated with elevated plasma and cholesterol levels by previous GWAS (Table 1; Supplementary Table S1). Although rs35570672 and rs146812806 have never been associated with plasma lipid and cholesterol levels, they are associated with differential urinary and serum metabolite levels (Table 2; Supplementary Table S2) that are indicative of systemic NAT2 activity (see discussions below in Section 6). It is notable that both rs35570672 and rs146812806 have been associated with differential levels of mean corpuscular hemoglobin, a parameter measured in complete blood count (CBC). Components of the CBC, such as the red blood cell, platelet counts, hemoglobin and hematocrit values, are associated with coronary artery disease and can be used in combination with the white blood cell (WBC) count to predict the risk (Madjid and Fatemi, 2013). One study by Anderson et al. (2007) showed that CBC-derived risk scores for coronary artery disease can be further improved by incorporating values on hematocrit, mean corpuscular volume, red blood cell distribution width, mean corpuscular hemoglobin concentration, and platelet and WBC counts. We speculate that the association between two NAT2 variants (rs35570672 and rs146812806) and mean corpuscular hemoglobin level is reflective of the dyslipidemia and coronary artery disease risk associated with the haplotype. This is supported by the fact that rs35570672-T and rs146812806-TGCCTG (insertion) alleles are co-segregated with the rest of the variants in the seven-variant haplotype, including rs1495741-G and s4921913-C (Figure 1; Table 3). As previously mentioned, rs1495741-G is not only linked to elevated plasma cholesterol, triglyceride, total lipid, and phospholipid levels, but also to metabolic syndrome (Table 1; Supplementary Table S1), which implies that the seven-variant haplotype is a risk locus for dyslipidemia as well as cardiometabolic disorders.
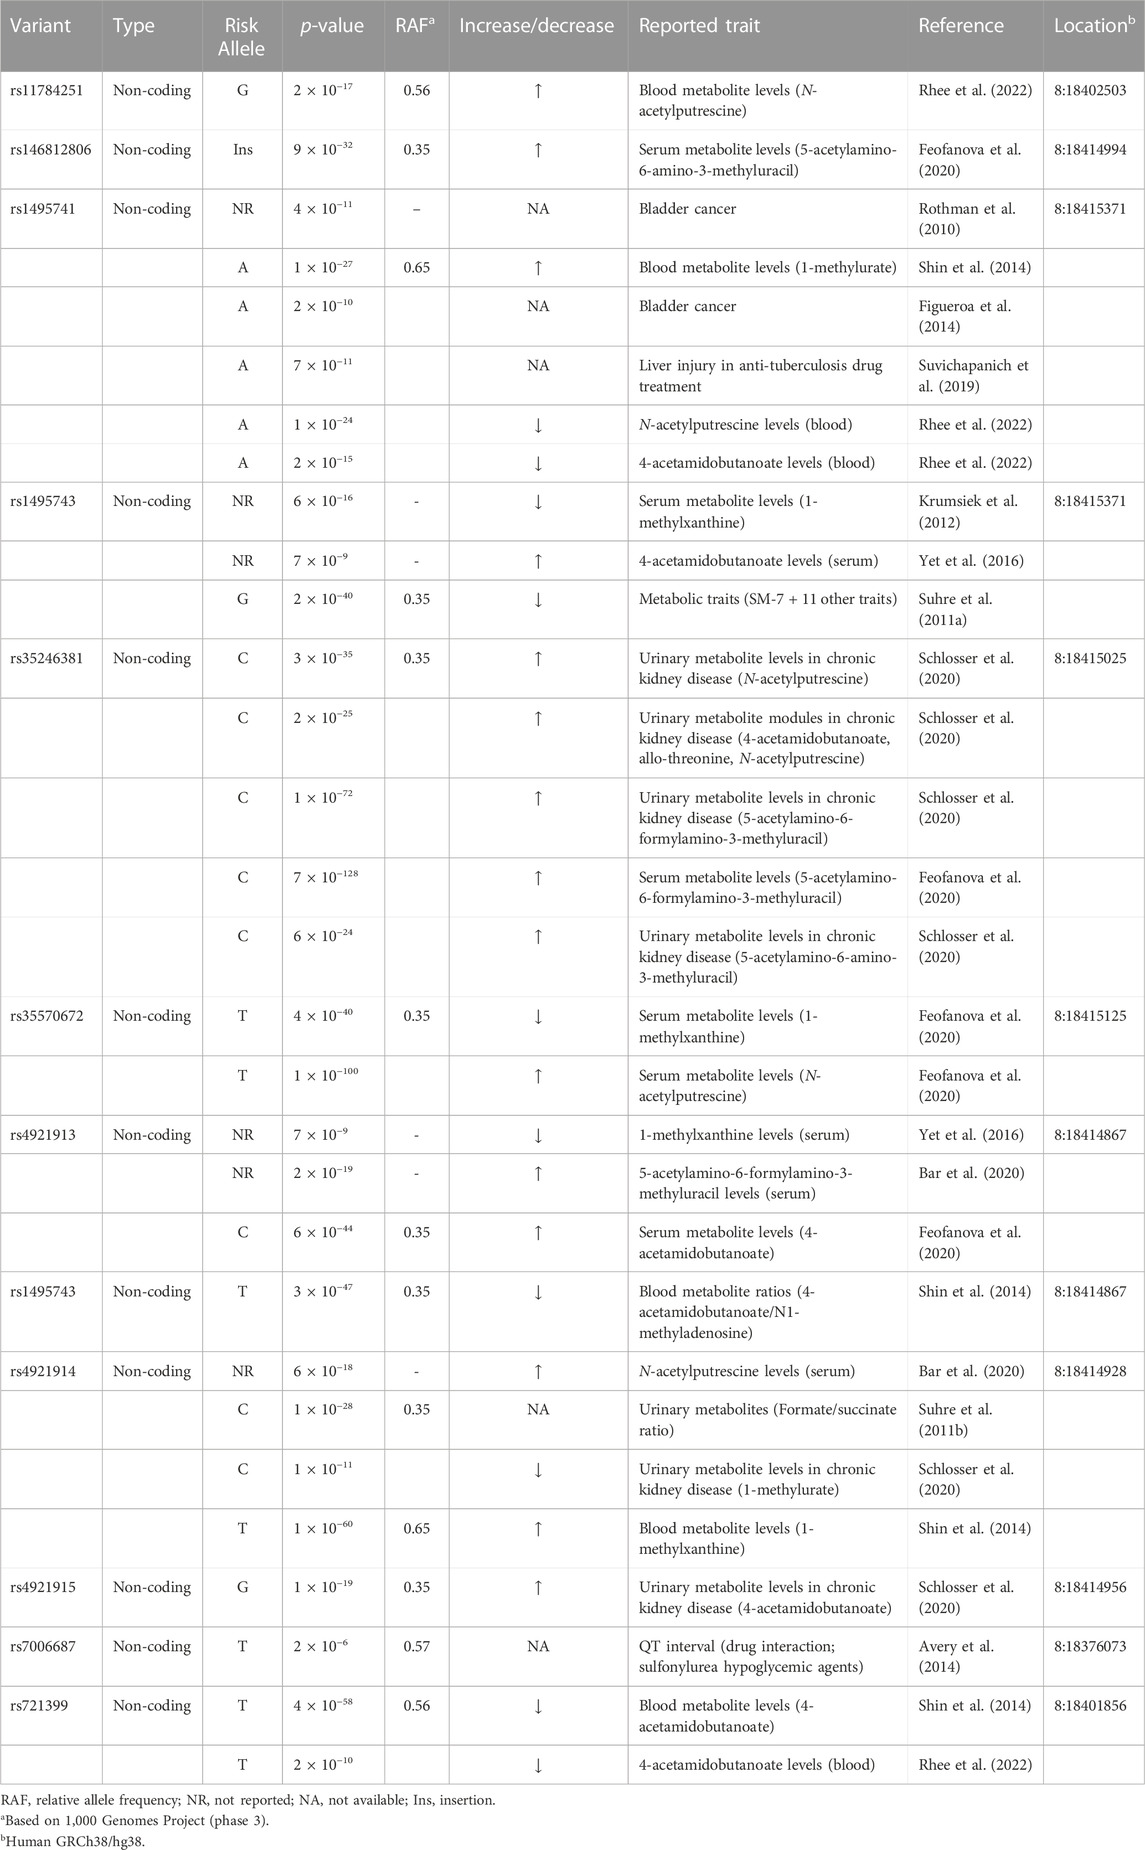
TABLE 2. NAT2 genetic variants associated with differential urinary or serum metabolite levels and other traits.
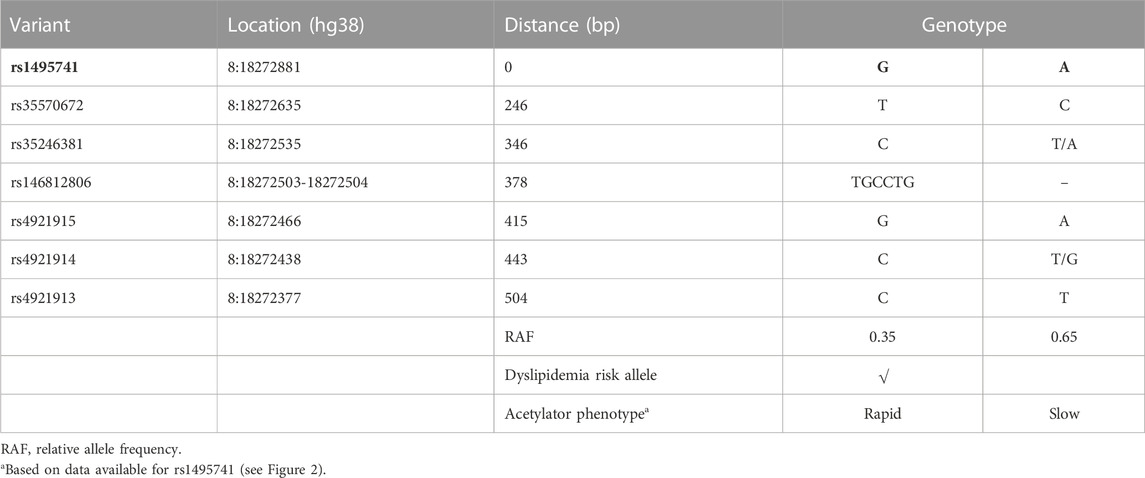
TABLE 3. Seven-variant dyslipidemia haplotype in NAT2.
These findings have the following, important implications: 1) the risk of hyperlipidemia and metabolic syndrome is conferred by this newly discovered haplotype; 2) approximately 5%–40% of the world population (i.e., homozygotes for rs1495741-G) may be at a greater risk of developing dyslipidemia and cardiometabolic disease.
5 Linkage disequilibrium between other variants
NAT2 SNPs, rs11780610 and rs4646248, which are linked with differential triglyceride levels and coronary artery disease risk, respectively (Table 1; Supplementary Table S1), are in linkage disequilibrium (LD r2 > 0.9) based on data from 1000 Genomes Project (Linkage Disequilibrium Calculator - Homo_sapiens - Ensembl genome browser 106, 2022). These two SNPs exhibit variable linkage disequilibrium with rs1495741 (of the seven-variant dyslipidemia haplotype; Table 3), depending on the population, with r2 value ranging between 0.08 and 0.84.
SNPs, rs11784251 and rs1390360, which are linked with differential serum N-acetylputrescine level and serum albumin level, respectively (Table 2; Supplementary Table S2), are in linkage disequilibrium (LD r2 > 0.9). These two SNPs exhibit variable linkage disequilibrium with rs1495741, depending on the population, with r2 value ranging between 0.28 and 0.85. In addition, rs4646248 and rs1495747 (Tables 1, 2) also are in linkage disequilibrium in most populations from the 1000 Genomes Project (r2 = 0.2–1.0). Similarly, they exhibit variable linkage disequilibrium with rs1495741, depending on the population, with r2 value ranging between 0.28 and 0.87.
6 Dyslipidemia risk alleles are linked to rapid acetylator phenotype
How do non-coding or intergenic NAT2 variants confer risk of dyslipidemia and cardiometabolic disease? Although experimental evidence is lacking, the dyslipidemia risk alleles have been associated with rapid NAT2 acetylator phenotypes (i.e., relatively high NAT2 activity). Our lab previously measured NAT2 activity in 154 human hepatocytes from individuals of European background according to genotypes at rs1495741 (i.e., A/A, G/A, and G/G) and found that hepatocytes from individuals that carry the G allele had significantly higher NAT2 activity compared to those with the A allele (Figure 2). Accordingly, the G/G genotype at rs1495741 accurately predicted the rapid acetylator phenotype (García-Closas et al., 2011) (Figure 2). In other words, the dyslipidemia risk allele, rs1495741-G, is associated with relatively high NAT2 activity in human hepatocytes, although the mechanism is presently unknown.
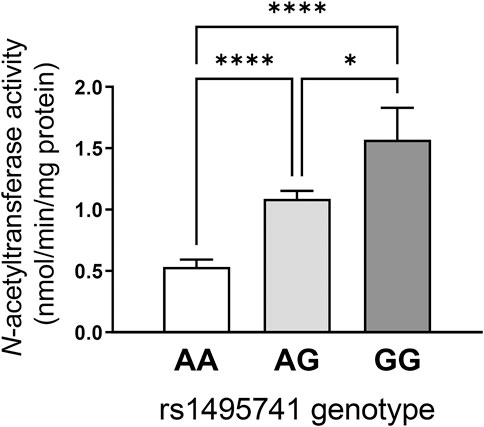
FIGURE 2. rs1495741 genotype-dependent changes in NAT2 activity in cryopreserved human hepatocytes. Bar graphs showing NAT2 activities (measured by N-acetylation of sulfamethazine) in cryopreserved human hepatocytes from 154 individuals of European background. Data was categorized by genotypes of rs1495741, a non-coding NAT2 SNP (i.e., AA, AG, and GG). The “G” allele represents the dyslipidemia allele (see Table 1 and Supplementary Table S1). One-way ANOVA analysis was done followed by Tukey’s multiple comparison test. *, p < 0.05. ****, p < 0.0001. The figure was modified from data presented in our previous study (García-Closas et al., 2011).
Variants that are linked to differential urinary or serum metabolite levels (Table 2; Supplementary Table S2) also support the idea that the dyslipidemia risk alleles are associated with high NAT2 activity. Multiple, non-coding NAT2 variants, including all seven variants in the haplotype (rs721399, rs4921913, rs4921914, rs4921915, rs146812806, rs35246381, rs35570672, rs1495741, and rs1495743; variants in the seven-variant haplotype in bold) associate with differential levels of urinary and serum metabolites, including 5-acetylamino-6-amino-3-methyluracil (AAMU), 5-acetylamino-6-formylamino-3-methyluracil (AAFU), 1-methylxanthine, 1-methylurate, 4-acetamidobutanoate, and N-acetylputrescine (Table 2; Supplementary Table S2). For instance, two risk alleles in the dyslipidemia risk haplotype, rs35246381-C and rs146812806-insertion, are both associated with a significant increase in AFMU and AAMU, respectively (Table 2; Supplementary Table S2). These metabolites are both major intermediates in caffeine metabolism involving NAT2 (Relling et al., 1992; Welfare et al., 2000). Accordingly, the elevated serum level of these caffeine metabolites associated with rs35246381-C and rs146812806-insertion may be attributed to relatively high NAT2 activity. Consistent with this finding, rs35246381-C, and rs146812806-insertion are in linkage disequilibrium with rs1495741-G, and thus are, both, associated with the rapid NAT2 acetylator phenotype (Figure 2; Table 3).
Additionally, rs35570672-T, which is associated with hyperlipidemia (Table 1; Supplementary Table S1), is also associated with elevated level of N-acetylputrescine in serum (Table 2; Supplementary Table S2). Putrescine is a recently identified endogenous substrate of human NAT2 (Conway et al., 2020; Salazar-Gonzalez and Hein, 2022), and N-acetylputrescine can form by acetylation of putrescene by human NAT2. Thus, the significant increase in serum N-acetylputrescine may reflect relatively high, systemic NAT2 activity. This, again, supports that rs35570672-T, a risk allele for hyperlipidemia, is linked to rapid NAT2 acetylator phenotype (Table 3).
In summary, some of the risk alleles for dyslipidemia or cardiometabolic disease also have been associated with differential urinary or serum metabolite levels which are indicative of relative NAT2 activity. Analysis of these genetic variants, that are associated with both dyslipidemia and differential serum or urine metabolite levels (e.g., rs35570672-T) (Tables 1, 2), demonstrate that the risk alleles of NAT2 for dyslipidemia are associated with higher NAT2 activity (i.e., rapid NAT2 acetylator phenotype). Importantly, this implies that 1) plasma lipid or cholesterol levels may be, in part, determined by the level of enzymatic activity of NAT2 and 2) NAT2 may play a novel role in lipid and cholesterol homeostasis.
7 Evidence supporting the role of NAT2 in lipid and cholesterol homeostasis
7.1 Acetylator genotype-dependent dyslipidemia in rats congenic for Nat2
In rats, Nat2 acetylator status has been shown to influence plasma lipid and cholesterol levels. In our previous study (Hong et al., 2020), we investigated the interaction between diet (control vs. high-fat) and acetylator phenotype (rapid vs. slow) using previously established congenic rat lines that exhibit rapid or slow NAT2 acetylator phenotypes. Male and female rats of each genotype were fed control or high-fat diet for 26 weeks. Regardless of the diet, rapid acetylator rats (with higher NAT2 activity) were more prone to develop dyslipidemia overall. Rapid rats exhibited higher plasma levels of triglyceride and LDL, and lower HDL level, compared to slow acetylator rats (Hong et al., 2020). Rapid acetylator rats also displayed a significantly higher total cholesterol-to-HDL ratio (Hong et al., 2020). Notably, the total cholesterol-to-HDL ratio serves as important indicators of cardiovascular risk (Millán et al., 2009). These findings suggest that rats with higher, systemic NAT2 activity exhibit dyslipidemia which raises the risk of cardiovascular dysfunction. Although there are functional differences between rat NAT2 and human NAT2 (Hein et al., 2008; Hein, 2009), this study supports the idea that high NAT2 activity results in an elevated plasma triglyceride and LDL. Furthermore, this is consistent with the aforementioned finding that the G allele of rs1495741, which is a predictor of rapid acetylator genotype (Figure 2), is associated with elevated plasma lipid and cholesterol levels (Table 1; Supplementary Table S1).
7.2 Transcriptional regulation of human NAT2 by glucose and insulin
Multiple GWAS reports link non-coding NAT2 variants to differential plasma lipid and cholesterol levels (Table 1; Supplementary Table S1). However, until recently, no non-GWAS studies have implicated human NAT2 in the process of lipid or cholesterol homeostasis. Although no direct evidence is available, our recent findings support the novel hypothesis that NAT2 is involved in regulation of lipid or cholesterol homeostasis. In HepG2 and Hep3B hepatocellular carcinoma cell lines, we observed that the transcript levels of human NAT2 varies dynamically, depending on the nutrient status of the culture media (Hong et al., 2022). Particularly, NAT2 transcripts are significantly upregulated by glucose (Hong et al., 2022). Glucose promotes de novo lipid synthesis via activation of ChREBP (MLXIPL) (Ortega-Prieto and Postic, 2019) or indirectly via insulin-SREBF1 (sterol regulatory element-binding protein 1) (Eberlé et al., 2004). In response to glucose and its metabolites (e.g., glucose-6-phosphate), ChREBP is activated and binds to a cis-acting regulatory element called “carbohydrate response element” and transactivates the target genes (Ortega-Prieto and Postic, 2019). Its target genes encode key enzymes of de novo lipogenesis, such as fatty acid synthase (FAS; FASN), acetyl-CoA carboxylase (ACC; ACACA) and stearoyl-CoA desaturase (SCD) (Kawaguchi et al., 2001). It is possible that NAT2 is regulated in a similar mechanism by glucose.
NAT2 is also upregulated by insulin in HepG2 cells (Hong et al., 2022), indicating that NAT2 may be a novel insulin-receptor target gene in hepatocytes. Elevated blood glucose induces secretion of insulin which suppresses gluconeogenesis and promotes lipogenesis in the liver. In support of this finding, a recent study reported that insulin induces mouse Nat1 (functional homolog of human NAT2) expression in a mouse endothelial cancer cell line (Zou et al., 2020). In addition, cerebro-microvessels isolated from endothelial cell-specific insulin receptor knockout mice express reduced levels of both mRNA and protein of mouse Nat1, suggesting that insulin regulates expression of mouse Nat1 in endothelial cells in vivo (Zou et al., 2020). These previous findings collectively suggest that expression of human NAT2 (and mouse Nat1) is regulated by insulin in multiple cell types, including hepatocytes and endothelial cells. Importantly, this also implicates NAT2 in the process of lipogenesis, which is regulated by insulin. SREBF1 mediates the induction of lipogenic genes by insulin in hepatocytes (Horton et al., 2002). Activation of SREBF1 by insulin promotes fatty acid and cholesterol biosynthesis, for its target genes include the rate-limiting lipogenic and cholesterol biosynthetic genes, such as fatty acid synthase (FASN; FAS), acetyl-CoA carboxylase (ACC1; ACACA), HMG-CoA reductase (HMGCR) and the LDL receptor (LDLR) (Eberlé et al., 2004; Osborne and Espenshade, 2009). Transcriptional regulation of human NAT2 by both glucose and insulin suggests that hepatic NAT2 expression is induced by nutrient excess which coincide with the conditions that promote lipogenesis and cholesterol biosynthesis.
7.2.1 Genes co-expressed with human NAT2
Another piece of evidence that implicates NAT2 in lipid or cholesterol homeostasis comes from an in silico analysis of genes co-regulated or co-expressed with human NAT2 (Hong et al., 2022). As expected, biological processes related to xenobiotic metabolism are enriched among the co-expressed genes. Interestingly, Gene Ontology (GO) terms that are related to triglyceride, lipid, lipoprotein, and cholesterol synthesis and transport are overwhelmingly enriched among the genes co-expressed with human NAT2. These included “cholesterol homeostasis” (GO:0042632), “lipid homeostasis” (GO:0055088), “triglyceride homeostasis” (GO:0070328), “regulation of cholesterol transport” (GO:0032374), “plasma lipoprotein particle assembly” (GO:0034377), and “plasma lipoprotein particle remodeling” (GO:0034369) (Hong et al., 2022). Co-expressed genes, such as APOA5, APOB, APOC2, APOC3, ABCG8, ANGPTL3, FABP1, MOGAT2, and PLA2G12B, contributed to the enrichment of these biological processes. The findings of the in silico analysis strongly suggest that NAT2 plays a novel role in lipid and cholesterol metabolism and/or transport in the liver where it is mostly abundantly expressed.
The list of genes co-expressed with human NAT2 (Hong et al., 2022) contrasts to the genes co-regulated with mouse Nat1 (functional homolog of human NAT2) in adipose tissue (Chennamsetty et al., 2016). The authors reported that genes that are positively correlated with mouse Nat1 in fat tissue are significantly enriched for biological processes associated with mitochondrial biology, glucose metabolism, and energy balance (Chennamsetty et al., 2016). The discrepancy between the two studies can be attributed to the differences between human NAT2 and mouse Nat1. For example, human NAT2 is predominantly expressed in the liver and small and large intestines and absent from adipose tissue (Single cell type - NAT2 - The Human Protein Atlas, 2022), whereas expression of mouse Nat1 is more wide spread and present in multiple tissues (Loehle et al., 2006; Nat1 MGI Mouse Gene Detail - MGI:97279 - N-acetyl transferase 1). In addition, Laurieri and others reported that the substrate profiles of mouse NAT1 and human NAT2 are less similar than previously believed (Laurieri et al., 2014). This indicates that they may not share identical cellular functions and that findings in mouse models may not be directly applicable to humans.
8 Summary and conclusion
Numerous GWAS reports link non-coding human NAT2 genetic variants to differential plasma lipid and cholesterol levels, as well as cardiometabolic disorders. A seven-intergenic-variant haplotype is associated with differential risks of dyslipidemia. Moreover, the risk alleles for dyslipidemia (e.g., rs1495741-G) are associated with rapid NAT2 acetylator phenotype, suggesting that increased systemic NAT2 activity contributes to increases in plasma lipid and cholesterol levels. The findings described herein collectively suggest that non-coding NAT2 genetic variants play functionally important roles in regulation of lipid and cholesterol homeostasis. We propose that human NAT2 represents a novel genetic factor that influences plasma lipid and cholesterol levels and, ultimately, alters the risk of cardiometabolic disorders. The mechanism, however, is unknown. The question of how non-coding, intergenic variants alter NAT2 expression or activity is of high interest and subject to future studies.
Author contributions
All authors listed have made a substantial, direct, and intellectual contribution to the work and approved it for publication.
Funding
Funding was provided by NIEHS grants T32-ES015564 and P30-ES030283.
Conflict of interest
The authors declare that the research was conducted in the absence of any commercial or financial relationships that could be construed as a potential conflict of interest.
Publisher’s note
All claims expressed in this article are solely those of the authors and do not necessarily represent those of their affiliated organizations, or those of the publisher, the editors and the reviewers. Any product that may be evaluated in this article, or claim that may be made by its manufacturer, is not guaranteed or endorsed by the publisher.
Supplementary material
The Supplementary Material for this article can be found online at: https://www.frontiersin.org/articles/10.3389/fphar.2023.1091976/full#supplementary-material
References
1000 Genomes Project Consortium Auton, A., Brooks, L. D., Durbin, R. M., Garrison, E. P., Kang, H. M., et al. (2015). A global reference for human genetic variation. Nature 526, 68–74. doi:10.1038/nature15393
Agúndez, J. A. G. (2008). Polymorphisms of human N-acetyltransferases and cancer risk. Curr. Drug Metab. 9, 520–531. doi:10.2174/138920008784892083
Anderson, J. L., Ronnow, B. S., Horne, B. D., Carlquist, J. F., May, H. T., Bair, T. L., et al. (2007). Usefulness of a complete blood count-derived risk score to predict incident mortality in patients with suspected cardiovascular disease. Am. J. Cardiol. 99, 169–174. doi:10.1016/j.amjcard.2006.08.015
Avery, C. L., Sitlani, C. M., Arking, D. E., Arnett, D. K., Bis, J. C., Boerwinkle, E., et al. (2014). Drug-gene interactions and the search for missing heritability: A cross-sectional pharmacogenomics study of the QT interval. Pharmacogenomics J. 14, 6–13. doi:10.1038/tpj.2013.4
Bansal, A. B., and Cassagnol, M. (2022). “HMG-CoA reductase inhibitors,” in StatPearls (Treasure Island (FL): StatPearls Publishing). Available at: http://www.ncbi.nlm.nih.gov/books/NBK542212/(Accessed October 5, 2022).
Bar, N., Korem, T., Weissbrod, O., Zeevi, D., Rothschild, D., Leviatan, S., et al. (2020). A reference map of potential determinants for the human serum metabolome. Nature 588, 135–140. doi:10.1038/s41586-020-2896-2
Bentley, A. R., Sung, Y. J., Brown, M. R., Winkler, T. W., Kraja, A. T., Ntalla, I., et al. (2019). Multi-ancestry genome-wide gene-smoking interaction study of 387,272 individuals identifies new loci associated with serum lipids. Nat. Genet. 51, 636–648. doi:10.1038/s41588-019-0378-y
Chan, K. H. K., Huang, Y.-T., Meng, Q., Wu, C., Reiner, A., Sobel, E. M., et al. (2014). Shared molecular pathways and gene networks for cardiovascular disease and type 2 diabetes mellitus in women across diverse ethnicities. Circ. Cardiovasc Genet. 7, 911–919. doi:10.1161/CIRCGENETICS.114.000676
Chen, M.-H., Raffield, L. M., Mousas, A., Sakaue, S., Huffman, J. E., Moscati, A., et al. (2020). Trans-ethnic and ancestry-specific blood-cell genetics in 746,667 individuals from 5 global populations. Cell 182, 1198–1213.e14. doi:10.1016/j.cell.2020.06.045
Chennamsetty, I., Coronado, M., Contrepois, K., Keller, M. P., Carcamo-Orive, I., Sandin, J., et al. (2016). Nat1 deficiency is associated with mitochondrial dysfunction and exercise intolerance in mice. Cell Rep. 17, 527–540. doi:10.1016/j.celrep.2016.09.005
Conway, L. P., Rendo, V., Correia, M. S. P., Bergdahl, I. A., Sjöblom, T., and Globisch, D. (2020). Unexpected acetylation of endogenous aliphatic amines by arylamine N-acetyltransferase NAT2. Angew. Chem. Int. Ed. Engl. 59, 14342–14346. doi:10.1002/anie.202005915
de Vries, P. S., Brown, M. R., Bentley, A. R., Sung, Y. J., Winkler, T. W., Ntalla, I., et al. (2019). Multiancestry genome-wide association study of lipid levels incorporating gene-alcohol interactions. Am. J. Epidemiol. 188, 1033–1054. doi:10.1093/aje/kwz005
Eberlé, D., Hegarty, B., Bossard, P., Ferré, P., and Foufelle, F. (2004). SREBP transcription factors: Master regulators of lipid homeostasis. Biochimie 86, 839–848. doi:10.1016/j.biochi.2004.09.018
Eisenberg, M. J., Brox, A., and Bestawros, A. N. (2004). Calcium channel blockers: An update. Am. J. Med. 116, 35–43. doi:10.1016/j.amjmed.2003.08.027
Ensembl Genome Browser (2022). Ensembl genome browser. Available at: https://grch37.ensembl.org/index.html (Accessed June 3, 2022).
Fairley, S., Lowy-Gallego, E., Perry, E., and Flicek, P. (2020). The International Genome Sample Resource (IGSR) collection of open human genomic variation resources. Nucleic Acids Res. 48, D941–D947. doi:10.1093/nar/gkz836
Fathzadeh, M., Hein, D. W., and Knowles, J. W. (2018). “The human arylamine N-acetyltransferase type 2 gene: Genomics and cardiometabolic risk,” in Arylamine N-acetyltransferases in health and disease (World Scientific), 43–67. doi:10.1142/9789813232013_0002
Feofanova, E. V., Chen, H., Dai, Y., Jia, P., Grove, M. L., Morrison, A. C., et al. (2020). A genome-wide association study Discovers 46 loci of the human metabolome in the hispanic community health study/study of Latinos. Am. J. Hum. Genet. 107, 849–863. doi:10.1016/j.ajhg.2020.09.003
Figueroa, J. D., Ye, Y., Siddiq, A., Garcia-Closas, M., Chatterjee, N., Prokunina-Olsson, L., et al. (2014). Genome-wide association study identifies multiple loci associated with bladder cancer risk. Hum. Mol. Genet. 23, 1387–1398. doi:10.1093/hmg/ddt519
García-Closas, M., Malats, N., Silverman, D., Dosemeci, M., Kogevinas, M., Hein, D. W., et al. (2005). NAT2 slow acetylation, GSTM1 null genotype, and risk of bladder cancer: Results from the Spanish bladder cancer study and meta-analyses. Lancet 366, 649–659. doi:10.1016/S0140-6736(05)67137-1
García-Closas, M., Hein, D. W., Silverman, D., Malats, N., Yeager, M., Jacobs, K., et al. (2011). A single nucleotide polymorphism tags variation in the arylamine N-acetyltransferase 2 phenotype in populations of European background. Pharmacogenet. Genomics 21, 231–236. doi:10.1097/FPC.0b013e32833e1b54
Hartiala, J. A., Han, Y., Jia, Q., Hilser, J. R., Huang, P., Gukasyan, J., et al. (2021). Genome-wide analysis identifies novel susceptibility loci for myocardial infarction. Eur. Heart J. 42, 919–933. doi:10.1093/eurheartj/ehaa1040
Hein, D. W., and Millner, L. M. (2021). Arylamine N-acetyltransferase acetylation polymorphisms: Paradigm for pharmacogenomic-guided therapy-a focused review. Expert Opin. Drug Metab. Toxicol. 17, 9–21. doi:10.1080/17425255.2021.1840551
Hein, D. W., Bendaly, J., Neale, J. R., and Doll, M. A. (2008). Systemic functional expression of N-acetyltransferase polymorphism in the F344 Nat2 congenic rat. Drug Metab. Dispos. 36, 2452–2459. doi:10.1124/dmd.108.023960
Hein, D. W. (2009). N-Acetyltransferase SNPs: Emerging concepts serve as a paradigm for understanding complexities of personalized medicine. Expert Opin. Drug Metab. Toxicol. 5, 353–366. doi:10.1517/17425250902877698
Hein, D. W. (2018). “Arylamine N-acetyltransferase type 2 polymorphism and human urinary bladder and breast cancer risks,” in Arylamine N-acetyltransferases in health and disease (World Scientific), 327–349. doi:10.1142/9789813232013_0013
Hoffmann, T. J., Theusch, E., Haldar, T., Ranatunga, D. K., Jorgenson, E., Medina, M. W., et al. (2018). A large electronic-health-record-based genome-wide study of serum lipids. Nat. Genet. 50, 401–413. doi:10.1038/s41588-018-0064-5
Hong, K. U., Doll, M. A., Lykoudi, A., Salazar-González, R. A., Habil, M. R., Walls, K. M., et al. (2020). Acetylator genotype-dependent dyslipidemia in rats congenic for N-acetyltransferase 2. Toxicol. Rep. 7, 1319–1330. doi:10.1016/j.toxrep.2020.09.011
Hong, K. U., Salazar-González, R. A., Walls, K. M., and Hein, D. W. (2022). Transcriptional regulation of human arylamine N-acetyltransferase 2 gene by glucose and insulin in liver cancer cell lines. Toxicol. Sci. 190, 158–172. doi:10.1093/toxsci/kfac103
Horton, J. D., Goldstein, J. L., and Brown, M. S. (2002). SREBPs: Activators of the complete program of cholesterol and fatty acid synthesis in the liver. J. Clin. Invest. 109, 1125–1131. doi:10.1172/JCI15593
Kawaguchi, T., Takenoshita, M., Kabashima, T., and Uyeda, K. (2001). Glucose and cAMP regulate the L-type pyruvate kinase gene by phosphorylation/dephosphorylation of the carbohydrate response element binding protein. Proc. Natl. Acad. Sci. U. S. A. 98, 13710–13715. doi:10.1073/pnas.231370798
Klarin, D., Damrauer, S. M., Cho, K., Sun, Y. V., Teslovich, T. M., Honerlaw, J., et al. (2018). Genetics of blood lipids among ∼300,000 multi-ethnic participants of the Million Veteran Program. Nat. Genet. 50, 1514–1523. doi:10.1038/s41588-018-0222-9
Knowles, J. W., Xie, W., Zhang, Z., Chennamsetty, I., Chennemsetty, I., Assimes, T. L., et al. (2015). Identification and validation of N-acetyltransferase 2 as an insulin sensitivity gene. J. Clin. Invest. 125, 1739–1751. doi:10.1172/JCI74692
Krumsiek, J., Suhre, K., Evans, A. M., Mitchell, M. W., Mohney, R. P., Milburn, M. V., et al. (2012). Mining the unknown: A systems approach to metabolite identification combining genetic and metabolic information. PLoS Genet. 8, e1003005. doi:10.1371/journal.pgen.1003005
Laurieri, N., Kawamura, A., Westwood, I. M., Varney, A., Morris, E., Russell, A. J., et al. (2014). Differences between murine arylamine N-acetyltransferase type 1 and human arylamine N-acetyltransferase type 2 defined by substrate specificity and inhibitor binding. BMC Pharmacol. Toxicol. 15, 68. doi:10.1186/2050-6511-15-68
Lind, L. (2019). Genome-wide association study of the metabolic syndrome in UK Biobank. Metab. Syndr. Relat. Disord. 17, 505–511. doi:10.1089/met.2019.0070
Linkage Disequilibrium Calculator - Homo_sapiens - Ensembl genome browser 106 (2022). Linkage Disequilibrium Calculator - Homo_sapiens - Ensembl genome browser 106. Available at: https://useast.ensembl.org/Homo_sapiens/Tools/LD (Accessed June 3, 2022).
Loehle, J. A., Cornish, V., Wakefield, L., Doll, M. A., Neale, J. R., Zang, Y., et al. (2006). N-acetyltransferase (Nat) 1 and 2 expression in Nat2 knockout mice. J. Pharmacol. Exp. Ther. 319, 724–728. doi:10.1124/jpet.106.108662
Madjid, M., and Fatemi, O. (2013). Components of the complete blood count as risk predictors for coronary heart disease: In-depth review and update. Tex Heart Inst. J. 40, 17–29.
McDonagh, E. M., Boukouvala, S., Aklillu, E., Hein, D. W., Altman, R. B., and Klein, T. E. (2014). PharmGKB summary: Very important pharmacogene information for N-acetyltransferase 2. Pharmacogenet. Genomics 24, 409–425. doi:10.1097/FPC.0000000000000062
Millán, J., Pintó, X., Muñoz, A., Zúñiga, M., Rubiés-Prat, J., Pallardo, L. F., et al. (2009). Lipoprotein ratios: Physiological significance and clinical usefulness in cardiovascular prevention. Vasc. Health Risk Manag. 5, 757–765. doi:10.2147/vhrm.s6269
Moore, L. E., Baris, D. R., Figueroa, J. D., Garcia-Closas, M., Karagas, M. R., Schwenn, M. R., et al. (2011). GSTM1 null and NAT2 slow acetylation genotypes, smoking intensity and bladder cancer risk: Results from the new England bladder cancer study and NAT2 meta-analysis. Carcinogenesis 32, 182–189. doi:10.1093/carcin/bgq223
Nat1 MGI Mouse Gene Detail - MGI:97279 - N-acetyl transferase 1 (2022). Nat1 MGI mouse gene Detail - MGI:97279 - N-acetyl transferase 1. Available at: http://www.informatics.jax.org/marker/MGI:97279 (Accessed October 5, 2022).
Nelson, R. H. (2013). Hyperlipidemia as a risk factor for cardiovascular disease. Prim. Care 40, 195–211. doi:10.1016/j.pop.2012.11.003
Ortega-Prieto, P., and Postic, C. (2019). Carbohydrate sensing through the transcription factor ChREBP. Front. Genet. 10, 472. doi:10.3389/fgene.2019.00472
Osborne, T. F., and Espenshade, P. J. (2009). Evolutionary conservation and adaptation in the mechanism that regulates SREBP action: What a long, strange tRIP it’s been. Genes Dev. 23, 2578–2591. doi:10.1101/gad.1854309
Relling, M. V., Lin, J. S., Ayers, G. D., and Evans, W. E. (1992). Racial and gender differences in N-acetyltransferase, xanthine oxidase, and CYP1A2 activities. Clin. Pharmacol. Ther. 52, 643–658. doi:10.1038/clpt.1992.203
Rhee, E. P., Surapaneni, A., Zheng, Z., Zhou, L., Dutta, D., Arking, D. E., et al. (2022). Trans-ethnic genome-wide association study of blood metabolites in the Chronic Renal Insufficiency Cohort (CRIC) study. Kidney Int. 101, 814–823. doi:10.1016/j.kint.2022.01.014
Richardson, T. G., Sanderson, E., Palmer, T. M., Ala-Korpela, M., Ference, B. A., Davey Smith, G., et al. (2020). Evaluating the relationship between circulating lipoprotein lipids and apolipoproteins with risk of coronary heart disease: A multivariable mendelian randomisation analysis. PLoS Med. 17, e1003062. doi:10.1371/journal.pmed.1003062
Richardson, T. G., Leyden, G. M., Wang, Q., Bell, J. A., Elsworth, B., Davey Smith, G., et al. (2022). Characterising metabolomic signatures of lipid-modifying therapies through drug target mendelian randomisation. PLoS Biol. 20, e3001547. doi:10.1371/journal.pbio.3001547
Rothman, N., Garcia-Closas, M., Chatterjee, N., Malats, N., Wu, X., Figueroa, J. D., et al. (2010). A multi-stage genome-wide association study of bladder cancer identifies multiple susceptibility loci. Nat. Genet. 42, 978–984. doi:10.1038/ng.687
Sakaue, S., Kanai, M., Tanigawa, Y., Karjalainen, J., Kurki, M., Koshiba, S., et al. (2021). A cross-population atlas of genetic associations for 220 human phenotypes. Nat. Genet. 53, 1415–1424. doi:10.1038/s41588-021-00931-x
Salazar-Gonzalez, R. A., and Hein, D. W. (2022). Influence of N-acetyltransferase polymorphism in the N-acetylation of asparagine and putrescine. FASEB J. 36. doi:10.1096/fasebj.2022.36.S1.R4723
Salazar-González, R. A., Doll, M. A., and Hein, D. W. (2020). Human arylamine N-acetyltransferase 2 genotype-dependent protein expression in cryopreserved human hepatocytes. Sci. Rep. 10, 7566. doi:10.1038/s41598-020-64508-0
Schlosser, P., Li, Y., Sekula, P., Raffler, J., Grundner-Culemann, F., Pietzner, M., et al. (2020). Genetic studies of urinary metabolites illuminate mechanisms of detoxification and excretion in humans. Nat. Genet. 52, 167–176. doi:10.1038/s41588-019-0567-8
Shin, S.-Y., Fauman, E. B., Petersen, A.-K., Krumsiek, J., Santos, R., Huang, J., et al. (2014). An atlas of genetic influences on human blood metabolites. Nat. Genet. 46, 543–550. doi:10.1038/ng.2982
Single cell type - NAT2 - The Human Protein Atlas (2022). Single cell type - NAT2 - The Human Protein Atlas. Available at: https://www.proteinatlas.org/ENSG00000156006-NAT2/single+cell+type (Accessed May 18, 2022).
Sinnott-Armstrong, N., Tanigawa, Y., Amar, D., Mars, N., Benner, C., Aguirre, M., et al. (2021). Genetics of 35 blood and urine biomarkers in the UK Biobank. Nat. Genet. 53, 185–194. doi:10.1038/s41588-020-00757-z
Spracklen, C. N., Chen, P., Kim, Y. J., Wang, X., Cai, H., Li, S., et al. (2017). Association analyses of East Asian individuals and trans-ancestry analyses with European individuals reveal new loci associated with cholesterol and triglyceride levels. Hum. Mol. Genet. 26, 1770–1784. doi:10.1093/hmg/ddx062
Suhre, K., Shin, S.-Y., Petersen, A.-K., Mohney, R. P., Meredith, D., Wägele, B., et al. (2011a). Human metabolic individuality in biomedical and pharmaceutical research. Nature 477, 54–60. doi:10.1038/nature10354
Suhre, K., Wallaschofski, H., Raffler, J., Friedrich, N., Haring, R., Michael, K., et al. (2011b). A genome-wide association study of metabolic traits in human urine. Nat. Genet. 43, 565–569. doi:10.1038/ng.837
Suvichapanich, S., Wattanapokayakit, S., Mushiroda, T., Yanai, H., Chuchottawon, C., Kantima, T., et al. (2019). Genomewide association study confirming the association of NAT2 with susceptibility to Antituberculosis drug-induced liver Injury in Thai patients. Antimicrob. Agents Chemother. 63, 026922-e2718. doi:10.1128/AAC.02692-18
Teslovich, T. M., Musunuru, K., Smith, A. V., Edmondson, A. C., Stylianou, I. M., Koseki, M., et al. (2010). Biological, clinical and population relevance of 95 loci for blood lipids. Nature 466, 707–713. doi:10.1038/nature09270
Trinder, M., Vikulova, D., Pimstone, S., Mancini, G. B. J., and Brunham, L. R. (2022). Polygenic architecture and cardiovascular risk of familial combined hyperlipidemia. Atherosclerosis 340, 35–43. doi:10.1016/j.atherosclerosis.2021.11.032
van der Harst, P., and Verweij, N. (2018). Identification of 64 novel genetic loci Provides an expanded View on the genetic architecture of coronary artery disease. Circ. Res. 122, 433–443. doi:10.1161/CIRCRESAHA.117.312086
Vuckovic, D., Bao, E. L., Akbari, P., Lareau, C. A., Mousas, A., Jiang, T., et al. (2020). The polygenic and monogenic Basis of blood traits and diseases. Cell 182, 1214–1231.e11. doi:10.1016/j.cell.2020.08.008
Walraven, J. M., Zang, Y., Trent, J. O., and Hein, D. W. (2008). Structure/function evaluations of single nucleotide polymorphisms in human N-acetyltransferase 2. Curr. Drug Metab. 9, 471–486. doi:10.2174/138920008784892065
Welfare, M. R., Bassendine, M. F., and Daly, A. K. (2000). The effect of NAT2 genotype and gender on the metabolism of caffeine in nonsmoking subjects. Br. J. Clin. Pharmacol. 49, 240–243. doi:10.1046/j.1365-2125.2000.00130.x
Willer, C. J., Schmidt, E. M., Sengupta, S., Peloso, G. M., Gustafsson, S., Kanoni, S., et al. (2013). Discovery and refinement of loci associated with lipid levels. Nat. Genet. 45, 1274–1283. doi:10.1038/ng.2797
Wu, Y., Byrne, E. M., Zheng, Z., Kemper, K. E., Yengo, L., Mallett, A. J., et al. (2019). Genome-wide association study of medication-use and associated disease in the UK Biobank. Nat. Commun. 10, 1891. doi:10.1038/s41467-019-09572-5
Yet, I., Menni, C., Shin, S.-Y., Mangino, M., Soranzo, N., Adamski, J., et al. (2016). Genetic influences on metabolite levels: A comparison across metabolomic Platforms. PLoS One 11, e0153672. doi:10.1371/journal.pone.0153672
Zhou, X., Ma, Z., Dong, D., and Wu, B. (2013). Arylamine N-acetyltransferases: A structural perspective. Br. J. Pharmacol. 169, 748–760. doi:10.1111/bph.12182
Keywords: triglyceride, cholesterol, fatty acids, GWAS, haplotype, arylamine N-acetyltransferase 2, dyslipidemia
Citation: Hong KU, Walls KM and Hein DW (2023) Non-coding and intergenic genetic variants of human arylamine N-acetyltransferase 2 (NAT2) gene are associated with differential plasma lipid and cholesterol levels and cardiometabolic disorders. Front. Pharmacol. 14:1091976. doi: 10.3389/fphar.2023.1091976
Received: 07 November 2022; Accepted: 02 March 2023;
Published: 03 April 2023.
Edited by:
José A. G. Agúndez, University of Extremadura, SpainReviewed by:
Michael Davidson, University of Chicago Medicine, United StatesPedro Ayuso Parejo, University Institute of Molecular Pathology Biomarkers, Spain
Copyright © 2023 Hong, Walls and Hein. This is an open-access article distributed under the terms of the Creative Commons Attribution License (CC BY). The use, distribution or reproduction in other forums is permitted, provided the original author(s) and the copyright owner(s) are credited and that the original publication in this journal is cited, in accordance with accepted academic practice. No use, distribution or reproduction is permitted which does not comply with these terms.
*Correspondence: David W. Hein, ZGF2aWQuaGVpbkBsb3Vpc3ZpbGxlLmVkdQ==