- 1Department of Clinical Pharmacy and Pharmacy Administration, School of Pharmacy, Fudan University, Shanghai, China
- 2Department of Pharmacy, Minhang Hospital, Fudan University, Shanghai, China
- 3The National Clinical Research Center for Mental Disorders & Beijing Key Laboratory of Mental Disorders, Beijing Anding Hospital, Capital Medical University, Beijing, China
- 4Advanced Innovation Center for Human Brain Protection, Capital Medical University, Beijing, China
The sublingual combination of buprenorphine (BUP) and naloxone (NLX) is a new treatment option for opioid use disorder (OUD) and is effective in preventing drug abuse. This study aimed to explore rational dosing regimen for OUD patients in China via a model-based dose optimization approach. BUP, norbuprenorphine (norBUP), and NLX plasma concentrations of 34 healthy volunteers and 12 OUD subjects after single or repeated dosing were included. A parent-metabolite population pharmacokinetics (popPK) model with transit compartments for absorption was implemented to describe the pharmacokinetic profile of BUP-norBUP. In addition, NLX concentrations were well captured by a one-compartment popPK model. Covariate analysis showed that every additional swallow after the administration within the observed range (0–12) resulted in a 3.5% reduction in BUP bioavailability. This provides a possible reason for the less-than-dose proportionality of BUP. There were no differences in the pharmacokinetic characteristics between BUP or NLX in healthy volunteers and OUD subjects. Ethnic sensitivity analysis demonstrated that the dose-normalized peak concentration and area-under-the-curve of BUP in Chinese were about half of Puerto Ricans, which was consistent with a higher clearance observed in Chinese (166
1 Introduction
Opioid abuse can lead to adverse consequences and death. According to the 2019 report published by the International Drug Policy Consortium (IDPC), opioid abuse in China was serious with 850,000 opioid use disorders (OUD) subjects in the country. Buprenorphine (BUP) is one of the agonistic substitution drugs commonly used to treat OUD. It has a high μ-opioid receptor (
Although sublingual administration circumvents first-pass metabolism, the pharmacokinetics (PK) of BUP exhibits a less-than-dose proportionality profile, especially at high doses (Chiang and Hawks, 2003). It has been hypothesized that increased swallowing by OUD subjects during high dose administration is responsible for the decreased bioavailability, which increases the proportion entering the gastrointestinal tract. Currently there is few prospective studies that examined this phenomenon. Clinical studies have suggested that BUP plasma concentration is positively associated with μ-opioid receptor occupancy (
In 2006, Ashraf Yassen et al. (2006) established a population pharmacokinetic/pharmacodynamic (popPK/PD) model of BUP injection, characterizing for the first time the PK behavior of BUP in healthy volunteers. Recently, Darlene Santiago et al. (2020) used a two-compartment model to characterize the PK profile of sublingual BUP tablets in Puerto Rican OUD subjects. However, there are limited popPK models of sublingual BUP tablets, most of which had small sample sizes and limited the robustness results, especially in OUD subjects. To our knowledge, no popPK studies of BUP and NLX in BUP/NLX formulations existed at the time of writing. As NLX has a low sublingual bioavailability, its clinical use should result in a low plasma concentration that does not exceed the withdrawal threshold, but studies that ascertain the NLX plasma concentration in Chinese subjects were still lacking (Culpepper-Morgan et al., 1992). Furthermore, there is only one non-compartmental analysis (NCA) study of BUP/NLX formulation for the Chinese population, and population pharmacokinetics studies were lacking (Dong et al., 2019). Therefore, there is an urgent need to develop a popPK model of BUP/NLX sublingual tablets for dose optimization of OUD treatment in Chinese.
The overarching aim of this study was to determine the population pharmacokinetics of BUP/NLX sublingual tablets in the Chinese population to guide rational dosing. Specifically, we aimed to: 1) Perform a non-compartmental analysis and evaluate the impact of ethnic difference on the PK of BUP; 2) develop a popPK model for BUP/NLX sublingual tablets and assess the effect of swallowing on the bioavailability of BUP; 3) perform model-based dose optimization by balancing the efficacy and toxicity of the treatment.
2 Materials and methods
2.1 Study design
Data used for analyses were extracted from a clinical trial that utilized both the single and multiple dosage regimens of BUP and NLX (each tablet contains 2 mg buprenorphine hydrochloride and 0.5 mg naloxone hydrochloride), where plasma concentrations were measured in eligible subjects. The trial was conducted in accordance with Chinese legal requirements and the Declaration of Helsinki, and was approved by the Ethics Committee of Beijing Anding Hospital, China (approval number: 2008L10448).
2.2 Subjects
This study included single and multiple dosing trials. Healthy volunteers were recruited as the single dosing regimen should not lead to addiction. On the other hand, considering the addiction risk of the multiple dosing regimens, subjects in the multiple dosing group were recruited from a rehabilitation center after informed consent had been given freely. Inclusion criteria included subject aged between 18–30 years and 18–45 years respectively in the single- and multiple-dose group, and should weighed no less than 50 kg. Exclusion criteria included a history of cardiac, hepatic, renal, respiratory, gastrointestinal, or neurological disease, and a history of psychiatric or metabolic disease. Healthy volunteers had not taken other drugs within 2 weeks before the clinical trial, and OUD subjects were not allowed to take other drugs during the trial period. In addition, physical examination and urine morphine concentration of OUD subjects should not be abnormal. Subjects who had missed a dose, or received a wrong dose (either more or less than the prescribed dose) during the trial were also excluded from the analysis. All subjects provided informed consent prior to any study-related activity.
2.3 Dosing scheme
The single-dose trial consisted of three dose groups, 4 mg, 8 mg, and 16 mg, which were administered at 8:00 a.m. on the first day of the study. The multiple-dose trial only had one dose group, and subjects were given a daily dose at 8:00 a.m. consecutively for 8 days. All doses were administered sublingually. To protect healthy subjects, naltrexone was given at 6 p.m. the day before the study, at 7 a.m. on the first day, and at 8 a.m. on the second day. Subjects in the 4 mg, 8 mg, and 16 mg groups were given naltrexone 25 mg, 50 mg, and 100 mg, respectively, to avoid the risk of physical dependence.
2.4 Blood and number of swallows sampling
In the single-dose trial, the blood concentrations of BUP, norBUP, and NLX were collected before dose administration and at 0.25, 0.5, 0.75, 1, 1.5, 2, 3, 4, 6, 8, 10, 12, 24, 36, 48, 60, and 72 h after administration. Blood samples from the multiple-dose trial were collected on the sixth, seventh, and eighth day before administration, and 0.25, 0.5, 1, 1.5, 2, 4, 8, 12, and 24 h after administration on the eighth day only. In addition, the number of swallow (NOS) performed by the subject in the single-dose group after drug administration was recorded.
2.5 Analytical method
All collected samples were centrifuged within 1 h and stored at −20°C. The concentration of BUP, norBUP and NLX were quantified using a validated high-performance liquid chromatography-tandem mass spectroscopy (HPLC-MS) method. The mobile phase for BUP and norBUP detection was 80% methanol (0.005
2.6 Non-compartmental pharmacokinetic analysis
Non-compartmental analysis was performed using R studio version 4.1.1 (ncappc package version 0.3.0). Pharmacokinetic parameters, including maximum concentration (
3 Overview of population pharmacokinetic analysis
The non-linear mixed-effects modeling software NONMEM (version 7.5, ICON Development Solutions, MD, United States) was used to develop the popPK models. The evaluation of the NONMEM outputs was performed with Perl-speaks-NONMEM (PsN, version 5.2.6, Uppsala University, Sweden) and Pirana (version 3.0.0, Certara, United States) was used to handle modeling workflow. For statistical analysis and output visualization, R (version 4.1.1) was employed. Visual predictive check (VPC) and prediction corrected visual predictive check (pcVPC) were performed using the R package tidyvpc (version 1.2.0, Certara, United States). When the percentage of below quantification limit (BQL) data was less than 10%, BQL data were removed (M1 method) and the first-order conditional estimation with interaction (FOCE-I) method was used for parameter estimations. On the other hand, the likelihood-based method (M3 method) along with LAPLACIAN estimation was used if the proportion of BQL data was more than 10% or when necessary (Ahn et al., 2008). Since there was no pharmacokinetic interaction between BUP and NLX, PK models for BUP parent-metabolite model and NLX were developed separately (Harris et al., 2000). The parent-metabolite model was built using a sequential Population PK Parameters and Data (PPPD) approach (Zhang et al., 2003). First, the parent drug model was developed. Subsequently, the typical population parameters of the parent model were fixed and the plasma concentrations of both the parent drug and metabolite were fitted simultaneously to estimate the metabolite-related parameters. Finally, the parameters of the parent drug and the metabolite were estimated simultaneously based on the full data.
3.1 Base model development
3.1.1 Buprenorphine parent-metabolite model
Based on published studies and exploratory analysis results (Supplementary Figure S1), one-, two- and three-compartment models were selected as candidate structural models for BUP. In addition, first order, first order with lag time and transit compartment model were tested for the absorption processes. As data on intravenous administration was lacking, it was challenging to accurately estimate the proportion of BUP metabolized to norBUP (
3.1.2 Naloxone model
Results from previous studies and exploratory analyses (Supplementary Figure S5) support one-, two- and three-compartment models with first-order absorption and first-order elimination as candidate structural models (Yassen et al., 2007; Dowling et al., 2008; Papathanasiou et al., 2019; Skulberg et al., 2019). The code of final model can be found in Supplementary Material.
3.2 Random effect model
The exponential model was used to model the inter-individual variability (IIV) of each pharmacokinetic parameter Eq. 1.
where
Specification of the residual error structure is evaluated, including additive, proportional, and combined error models. The equations are as follows Eqs. 2–4.
Where
The dosage form used in this clinical trial was a sublingual tablet, and had minimal absorption when swallowed (went into the gastrointestinal tract rather than the blood circulation). The bioavailability of BUP was poorer in the high-dose group and NOS was collected in the single-dose group (Chiang and Hawks, 2003). NOS was not recorded in the multiple-dose group due to operational challenges, but was imputed with the median from the single-dose 8 mg group (the same dose as the multiple-dose group). During modeling, NOS as an important covariate with clear physiological significance, was preferentially investigated in the BUP parent-metabolite structural model to examine its effects on absorption-related parameters (inclusion criterion was p < 0.01 and exclusion criterion p < 0.001).
Structural model selection was based on the value of Akaike information criterion (AIC), goodness-of-fit (GOF) plots, the precision of parameter estimations (as percentage relative standard error, % RSE), and the condition number.
3.3 Covariate analysis
The impact of covariates on PK parameters was evaluated. An exploratory analysis of all covariates was carried out by plotting. The correlation between covariates was investigated through exploratory data analysis and statistical evaluation. Analyses of variance (ANOVA) tests were performed for categorical covariates, while linear regression was used to analyze continuous covariates. For univariate analysis, a p-value of less than 0.05 (p < 0.05) was considered significant. Among the highly correlated covariates, the most biologically plausible covariates were selected for stepwise covariate modelling (SCM). SCM relies on likelihood ratio test (LRT) to automate the search for covariates and included both the forward inclusion and backward elimination steps. In forward inclusion, the covariates were retained when the addition of a covariate resulted in a reduction in objective function value (OFV)
Where
3.4 Model evaluation
The final model was graphically evaluated by GOF plots such as observed values (DV) versus individual prediction (IPRED) and population predictions (PRED), conditional weighted residuals (CWRES) versus time and PRED, individual weighted residual (IWRES) versus IPRED, and the normality test of CWRES. CWRES was replaced with normalized prediction distribution error (NPDE) in the GOF plots when the M3 method was used to handle BQL data.
Bootstrap was performed with PsN for internal validation of the model. One thousand sets of parameters were estimated by repeating 1,000 datasets from the original dataset after stratifying by different dose groups. Median values and 95% confidence intervals (CI) were derived and compared with the final model parameters to assess the robustness of the final model.
In addition, VPC, pcVPC and the numerical predictive check (NPC) were performed to assess the prediction power of the final model. One-thousand simulations were implemented and the 5th, 50th, and 95th percentiles of the observed and simulated data (included concentration, AUC and
3.5 Dose optimization via Monte Carlo simulations
According to published data, suppression of opioid withdrawal responses requires plasma concentrations to be maintained above 1
3.5.1 Simulation of minimum suppression concentration
The minimum suppression concentration (MSC) was used to represent the threshold (3
3.5.2 Simulation of μ-opioid receptor occupancy
Model-based simulation was used to explore receptor occupancy at the steady state under different dose regimens. The simulation for PK profiles was identical as that for %T > MSC simulation (as above). The conversion from BUP plasma concentration to
Where
3.5.3 Simulation of naloxone
The plasma concentrations of NLX were simulated based on the established popPK model to explore the maximum concentration of NLX under all the investigated dosage regimens. According to the literature, the 2-h AUC of 550
4 Results
4.1 Patient characteristics
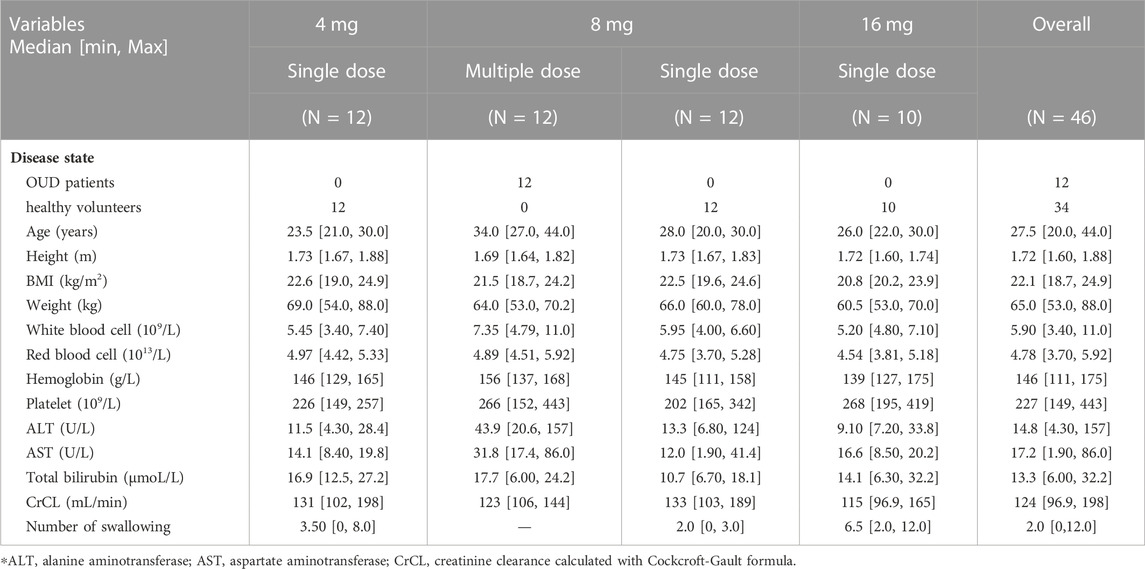
A total of 46 Han Chinese males were included in this study. In addition, eight subjects were excluded because their vital signs or biochemical tests were outside the normal range and were clinically significant. The subjects in the single-dose group were all healthy volunteers, 12 individuals in each of the 4 mg and 8 mg groups, and 10 individuals in the 16 mg group. The 12 subjects in the multiple-dosing group were OUD individuals. In total, 34 healthy volunteers and 12 OUD subjects with 1874 plasma concentrations were collected, of which 699 were BUP samples, 691 were norBUP samples and 484 were NLX samples. The percentage of BQL within all subgroups of BUP and norBUP was less than 10% and treated with the M1 method. For NLX concentrations, 20.3% of single doses and 56.2% of repeat doses were BQL and were analyzed using the M3 method. There was no significant difference between healthy volunteers and OUD subjects in height, BMI and weight, except for the median age (26 years vs. 34 years). The observed number of swallows after dose administration ranged from 0 to 12, with high doses often accompanied by multiple swallows. All demographic characteristics of the included subjects were listed in Table 1.
4.2 Non-compartmental pharmacokinetic analysis
The estimated PK parameters of each dose group were summarized in Supplementary Table S1. In the single-dose group of BUP and norBUP, the 16 mg group of BUP had a smaller dose normalization AUC (4 mg:8 mg:16 mg median = 3869:3928:2656 (ng*h/L)/mg) and dose normalization
4.3 Buprenorphine parent-metabolite model
For buprenorphine, the two-compartment model could describe the data better than the one-compartment model (∆AIC = −588.7). In addition, compared with the time lag model, the transit absorption model resulted in a further decrease in AIC (∆AIC = −74.8). A two-compartment model with transit compartments for absorption was finally selected as the structure model to describe the PK profile of BUP (see Figure 1A). As an important covariate of interest and mechanism, the NOS was preferentially considered for the structure model. The inclusion of NOS in bioavailability significantly improved the model, with 16.92 points reduction in OFV (p < 0.001). In the observed range of 0–12 swallows, bioavailability decreased by 3.50% for each additional swallow. For norBUP, a two-compartment model could describe the data better than a one-compartment model (∆AIC = −765.1). Due to the lack of intravenous administration data, the fraction of the BUP transformed to norBUP (
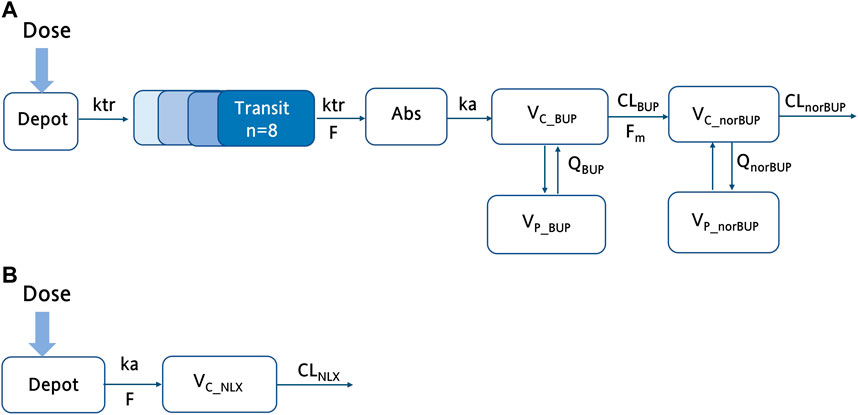
FIGURE 1. The schematic structure of the final buprenorphine-norbuprenorphine and naloxone model. (A) The schematic diagram of the buprenorphine parent-metabolite model, including wo compartment model for buprenorphine, two compartment model for norbuprenorphine, and transit compartments for absorption; (B) The schematic diagram of the NLX with one compartment model. ka, the absorption rate constant; F, bioavailability;
The covariates investigated included disease state (healthy volunteers or OUD subjects), age, weight, height, and dosage administered. Since weight was highly correlated with height, only the disease state, age, weight, and dosage were selected for the SCM procedure. After the forward selection and backward elimination, the dosage (4 mg, 8 mg, and 16 mg) on
All the parameters of the final model were estimated with acceptable precision (Table 2). The GOF result of the final parent-metabolite model (Supplementary Figures S5, S6) demonstrated a good fit of the final model. The success rate of bootstrap was 90.1%, and the estimated values of the final model parameters were close to the median and within the 95% CI from the non-parametric bootstrap (see Table 2). The pcVPC result (Figure 2) suggested that most of the observed values were contained within the 90% prediction intervals, indicating that the final model has sufficient predictive ability. The simulated median of the BQL fraction was consistent with the observed BQL fraction over time, suggesting that the M1 method was sufficient in handling BQL data for the buprenorphine parent-metabolite model. The result of the median and 95% CI of NPC also agreed with the observed data (Supplementary Table S2).
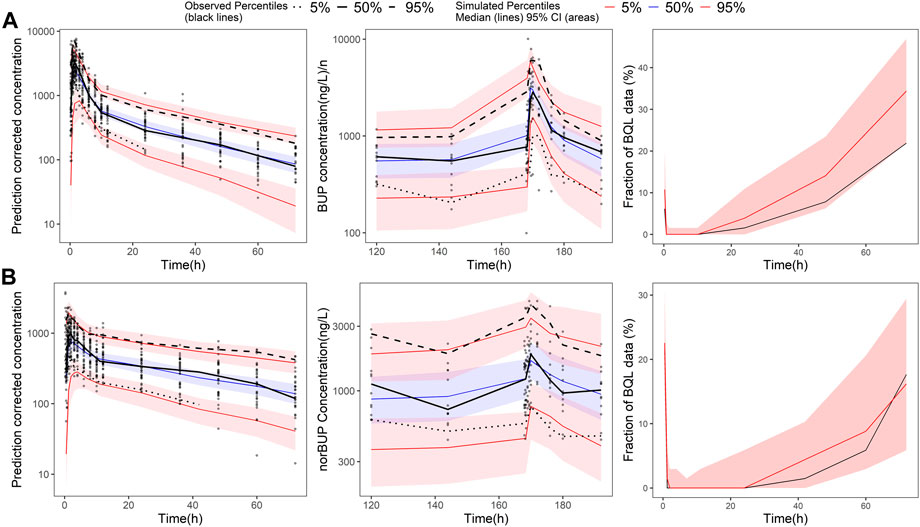
FIGURE 2. Prediction-corrected visual predictive check of the final buprenorphine-norbuprenorphine population pharmacokinetic model. The first row shows the results for buprenorphine (BUP), and the second row shows the results for norbuprenorphine (norBUP). (A) pcVPC of BUP for single dose study; (B) VPC of BUP for multiple dose study; (C) the fraction of BQL data over time in BUP; (D) pcVPC of norBUP after a single dose; (E) VPC of norBUP after multiple doses; (F) the fraction of BQL data over time in norBUP. Circles represent observed data. Black lines represent the 5% (dashed), 50% (solid), and 95% (dashed) percentiles of the observed data. Shaded areas represent 95% confidence intervals of the median 5% (red), 50% (blue), and 95% (red) percentiles of the predicted concentrations. For C and G, the red and black lines represent the median of predicted and observed BQL fraction, respectively. Shaded areas represent 90% prediction intervals.
4.4 Naloxone model
Compared with the two-compartment model, a one-compartment model was sufficient to describe the observed concentrations of NLX (∆AIC = −8.06). According to previous study, the bioavailability of NLX sublingual tablet was fixed to 0.01 (McDonald et al., 2018). The IIV term was estimated for
In the covariate analysis, age, weight, NOS, dosage, and disease state (healthy volunteers or OUD subjects) were tested. After SCM, dosage on bioavailability was a significant covariate, resulting in a decrease in OFV by 12.02 points (p < 0.001). The final model parameters were estimated with acceptable precision (Table 3). The GOF plots for the final model of NLX showed good agreement between model prediction and observed data. No obvious trend was observed in the NPDE analysis (Supplementary Figure S8). The 95% CI of bootstrap included the parameter estimates of the final model, and the median was close to the final parameter estimates, with a success rate of 96.8% (Table 4). Furthermore, VPC result indicated the final model well described the general trend of the observed data and adequately captured the variability in this study (Figure 3). According to the NPC results, the median and 95% CI in the model-based predictions agreed with the observed data (Supplementary Table S2).
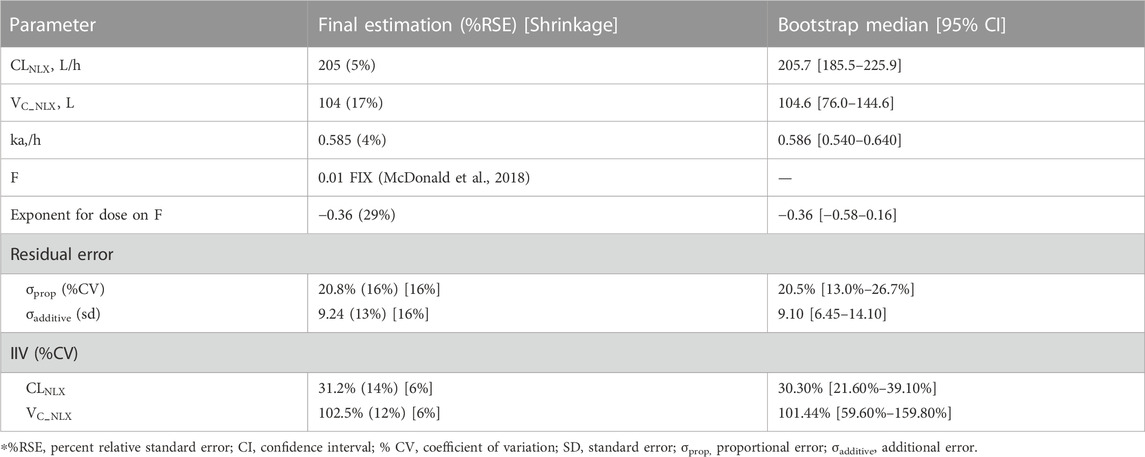
TABLE 3. Parameter estimates of the final naloxone population pharmacokinetic model and bootstrap results.
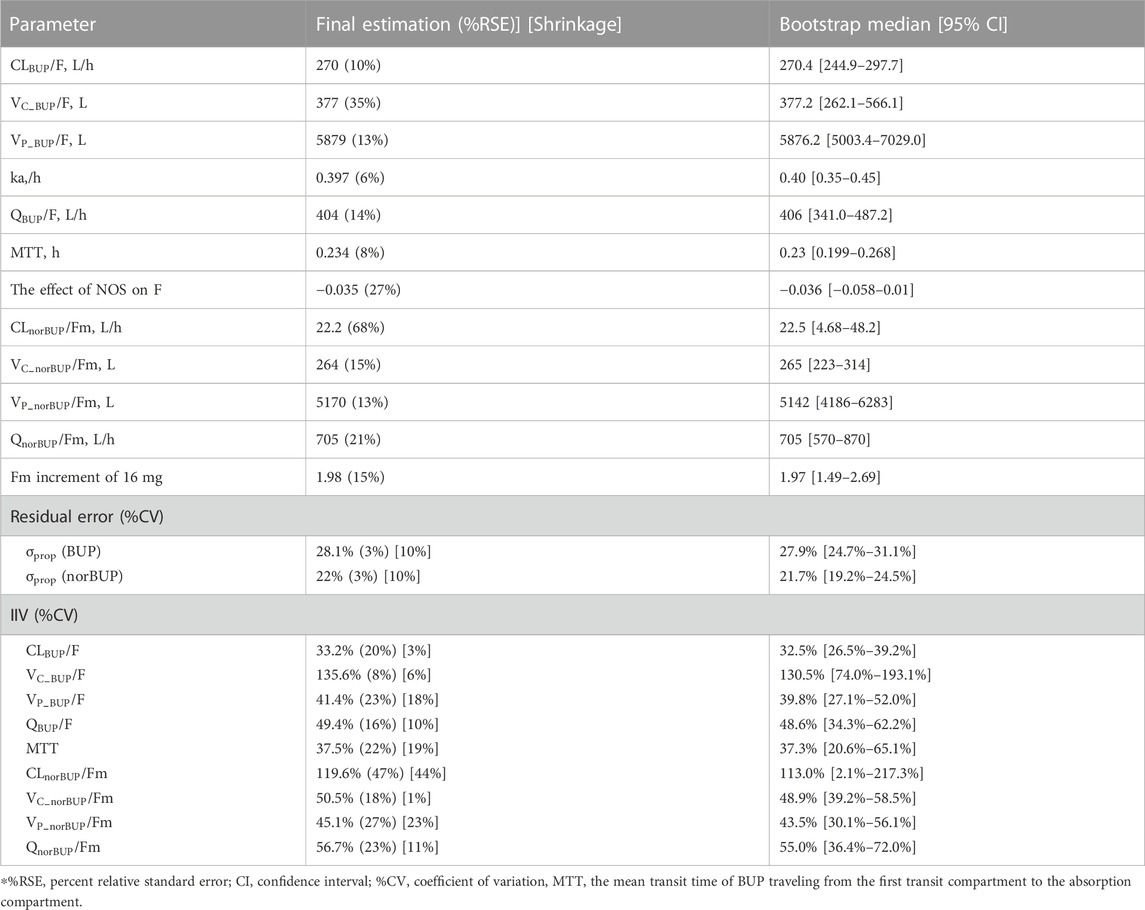
TABLE 4. Parameter estimates of the final buprenorphine-norbuprenorphine population pharmacokinetic model and bootstrap results.
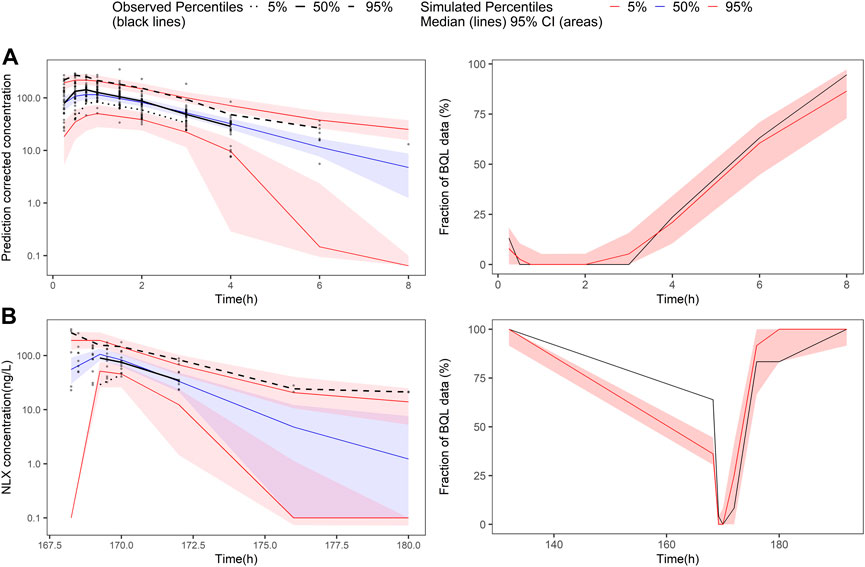
FIGURE 3. Prediction-corrected visual predictive check and visual predictive check of the final naloxone population pharmacokinetic model. The first row shows the results for single dose study, and the second row shows the repeat dose study. (A) pcVPC results for single dose study; (B) the fraction of BQL data over time after a single dose; (C) VPC results for multiple dose study; (D) the fraction of BQL data over time after multiple doses. Circles represent observed data. Black lines represent the 5% (dashed), 50% (solid), and 95% (dashed) percentiles of the observed data. Shaded areas represent 95% confidence intervals of the median 5% (red), 50% (blue), and 95% (red) percentiles of the predicted concentrations. For B and D, the red and black lines represent the median of predicted and observed BQL fraction, respectively. Shaded areas represent 90% prediction intervals.
4.5 Dose optimization via Monte Carlo simulations
Figure 4 illustrated the probability of target attainment (PTA) for different %T > MSC targets under various dose regimens at steady state. With the target of %T > MSC equal to 50%, the PTA of 16 mg BID, 8 mg TID and 16 mg + 8 mg + 8 mg daily dose regimens all approached 70%.
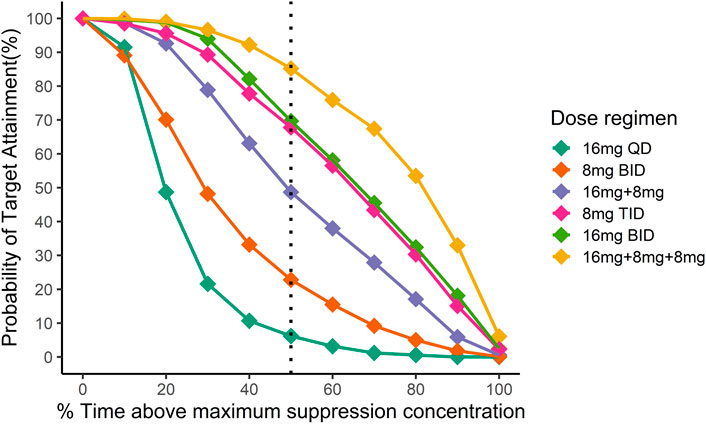
FIGURE 4. Simulation of the time above minimum suppression concentration in Chinese after different dosing regimens. Different colors indicate different dosing regimens. The x-axis is the mean proportion of the time when the plasma concentration exceeds the target concentration at the steady state, and the y-axis is the proportion of the population that reaches the %T > MSC target. Then black dotted line indicates the fraction of time above maximum suppression concentration equal to 50%.
In addition, these dosing regimens showed comparable results in μ-opioid receptor occupancy (
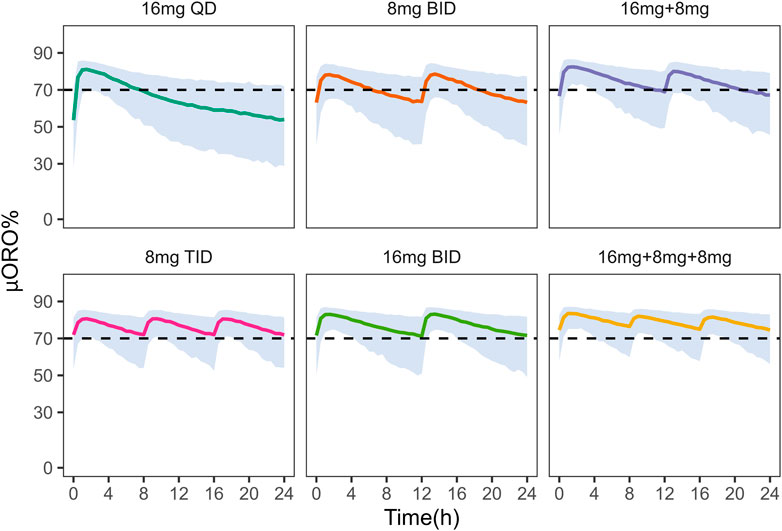
FIGURE 5. Simulation of μ-opioid receptor occupancy in Chinese after different dosing regimens. The shaded areas represent the 90% prediction intervals of the simulated data. Above the black dashed line, the receptor occupancy exceeds 70%.
On the other hand, under the 8 mg TID dosing regimen, the peak concentration of NLX at the steady state was below the withdrawal reaction threshold (4.6
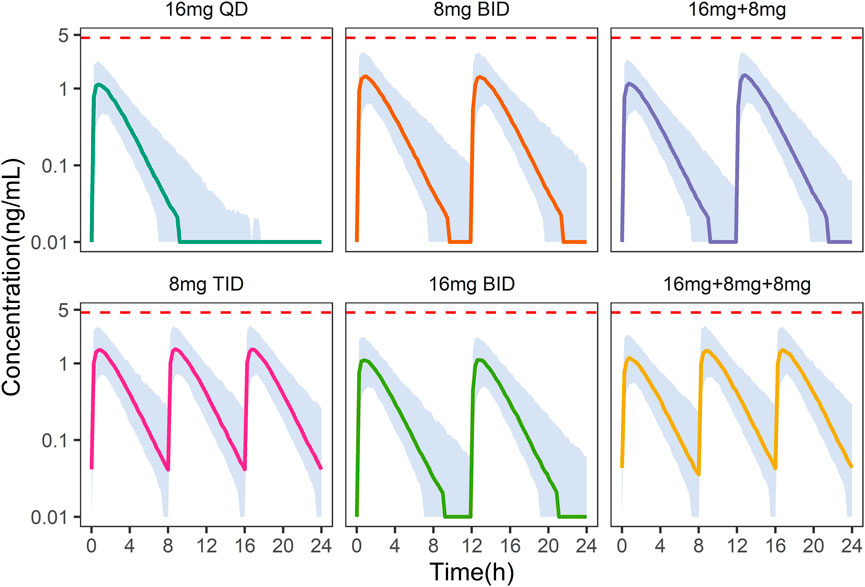
FIGURE 6. Simulation of plasma naloxone concentration in Chinese after different dosing regimens. Different colors indicate different dosing regimens. The shaded areas represent the 90% prediction intervals of the simulated data. The dashed red line indicates a concentration of 4.6 ng/mL, above which withdrawal may occur.
5 Discussion
This study was based on data from healthy Chinese volunteers and OUD subjects after single and repeated administration of BUP/NLX sublingual tablets. In this study, we developed two popPK models to clarify the pharmacokinetic profile of BUP/NLX sublingual tablets. The PK characteristics of BUP-norBUP was described using a four-compartment model with transit-compartments for the absorption processes. A one-compartment model was selected to describe NLX data. No differences were found between healthy volunteers and OUD subjects in the pharmacokinetics of BUP, norBUP and NLX. Model-based simulations suggest that 8 mg TID was the optimised dosage for combined efficacy and safety in Chinese OUD subjects.
According to the NCA results, the
This was the first popPK study to describe the PK characteristics of BUP and norBUP in a Chinese population. The apparent CL of BUP was consistent with a previous NCA study of sublingual BUP/NLX in Chinese healthy subjects (8 mg: 270
In China and other countries, such as Iran and United States, daily doses of
There are some limitations to this study. Due to the lack of actual bioavailability of BUP and the metabolism ratio of BUP to norBUP, only apparent parameters could be estimated. The measurement of BUP and norBUP in urine may be added in subsequent trials to compensate for this deficiency. In addition, the missing of female pharmacokinetic data in clinical trial limits the capability of the developed model in describing human pharmacokinetics in a more general sense. Hence, further studies may be warranted to investigate the impact of sex on human pharmacokinetics.
6 Conclusion
In conclusion, a popPK model for BUP/NLX sublingual tablets was developed to describe the time course of the three compounds (BUP, norBUP and NLX) in Chinese healthy volunteers and individuals with opioid use disorders. The model-based dose optimization recommended 8 mg TID as the initial dose regimen for Chinese OUD patients with satisfactory efficacy and safety profiles.
Data availability statement
The raw data supporting the conclusion of this article will be made available by the authors, without undue reservation.
Ethics statement
The studies involving human participants were reviewed and approved by Ethics Committee of Beijing Anding Hospital. The patients/participants provided their written informed consent to participate in this study.
Author contributions
XZ, AL, BH, and CW designed this study. AL, FD, NZ, CR, WG, and CW performed clinical trials. MG and XZ performed modelling and simulation. MG, XZ, XX, WM, QH, JZ, NX, ZT, and YS wrote the manuscript. All the authors reviewed the manuscript.
Funding
XZ received research funding from Fudan University, Scientific Research Foundation for Talented Scholars (JIF301052). AL received research funding from Beijing Hospitals Authority Youth Program (QMS20201903); Beijing Municipal Administration of Hospitals Incubating Program (PX2019070); National Natural Science Foundation--Youth Foundation (81801322). BH received research funding from Natural Science Foundation of Minhang District in Shanghai (2020MHZ035).
Acknowledgments
The authors would like to thank Certara for the free academic license of Pirana. We thank Zhen Feng for proofreading the manuscript.
Conflict of interest
The authors declare that the research was conducted in the absence of any commercial or financial relationships that could be construed as a potential conflict of interest.
Publisher’s note
All claims expressed in this article are solely those of the authors and do not necessarily represent those of their affiliated organizations, or those of the publisher, the editors and the reviewers. Any product that may be evaluated in this article, or claim that may be made by its manufacturer, is not guaranteed or endorsed by the publisher.
Supplementary material
The Supplementary Material for this article can be found online at: https://www.frontiersin.org/articles/10.3389/fphar.2023.1089862/full#supplementary-material
References
Ahlers, S. J., Valitalo, P. A., Peeters, M. Y., Gulik, L., van Dongen, E. P., Dahan, A., et al. (2015). Morphine glucuronidation and elimination in intensive care patients: A comparison with healthy volunteers. Anesth. Analg. 121 (5), 1261–1273. doi:10.1213/ANE.0000000000000936
Ahn, J. E., Karlsson, M. O., Dunne, A., and Ludden, T. M. (2008). Likelihood based approaches to handling data below the quantification limit using NONMEM VI. J. Pharmacokinet. Pharmacodyn. 35 (4), 401–421. doi:10.1007/s10928-008-9094-4
Chiang, C. N., and Hawks, R. L. (2003). Pharmacokinetics of the combination tablet of buprenorphine and naloxone. Drug Alcohol Depend. 70 (2), S39–S47. doi:10.1016/s0376-8716(03)00058-9
Ciraulo, D. A., Hitzemann, R. J., Somoza, E., Knapp, C. M., Rotrosen, J., Sarid-Segal, O., et al. (2006). Pharmacokinetics and pharmacodynamics of multiple sublingual buprenorphine tablets in dose-escalation trials. J. Clin. Pharmacol. 46 (2), 179–192. doi:10.1177/0091270005284192
Culpepper-Morgan, J. A., Inturrisi, C. E., Portenoy, R. K., Foley, K., Houde, R. W., Marsh, F., et al. (1992). Treatment of opioid-induced constipation with oral naloxone: A pilot study. Clin. Pharmacol. Ther. 52 (1), 90–95. doi:10.1038/clpt.1992.106
Dong, R., Wang, H., Li, D., Lang, L., Gray, F., Liu, Y., et al. (2019). Pharmacokinetics of sublingual buprenorphine tablets following single and multiple doses in Chinese participants with and without opioid use disorder. Drugs R. D. 19 (3), 255–265. doi:10.1007/s40268-019-0277-9
Dowling, J., Isbister, G. K., Kirkpatrick, C. M., Naidoo, D., and Graudins, A. (2008). Population pharmacokinetics of intravenous, intramuscular, and intranasal naloxone in human volunteers. Ther. Drug Monit. 30 (4), 490–496. doi:10.1097/FTD.0b013e3181816214
Greenwald, M. K., Comer, S. D., and Fiellin, D. A. (2014). Buprenorphine maintenance and mu-opioid receptor availability in the treatment of opioid use disorder: Implications for clinical use and policy. Drug Alcohol Depend. 144, 1–11. doi:10.1016/j.drugalcdep.2014.07.035
Greenwald, M., Johanson, C. E., Bueller, J., Chang, Y., Moody, D. E., Kilbourn, M., et al. (2007). Buprenorphine duration of action: Mu-opioid receptor availability and pharmacokinetic and behavioral indices. Biol. Psychiatry 61 (1), 101–110. doi:10.1016/j.biopsych.2006.04.043
Greenwald, M. K., Johanson, C. E., Moody, D. E., Woods, J. H., Kilbourn, M. R., Koeppe, R. A., et al. (2003). Effects of buprenorphine maintenance dose on mu-opioid receptor availability, plasma concentrations, and antagonist blockade in heroin-dependent volunteers. Neuropsychopharmacology 28 (11), 2000–2009. doi:10.1038/sj.npp.1300251
Harris, D. S., Jones, R. T., Welm, S., Upton, R. A., Lin, E., and Mendelson, J. (2000). Buprenorphine and naloxone co-administration in opiate-dependent patients stabilized on sublingual buprenorphine. Drug Alcohol Depend. 61 (1), 85–94. doi:10.1016/s0376-8716(00)00126-5
McDonald, R., Danielsson Glende, Ø., Dale, O., and Strang, J. (2018). International patent applications for non-injectable naloxone for opioid overdose reversal: Exploratory search and retrieve analysis of the PatentScope database. Drug Alcohol Rev. 37 (2), 205–215. doi:10.1111/dar.12571
Nasser, A. F., Heidbreder, C., Gomeni, R., Fudala, P. J., Zheng, B., and Greenwald, M. K. (2014). A population pharmacokinetic and pharmacodynamic modelling approach to support the clinical development of RBP-6000, a new, subcutaneously injectable, long-acting, sustained-release formulation of buprenorphine, for the treatment of opioid dependence. Clin. Pharmacokinet. 53 (9), 813–824. doi:10.1007/s40262-014-0155-0
Papathanasiou, T., Springborg, A. D., Kongstad, K. T., Staerk, D., Moller, K., Taylor, B. K., et al. (2019). High-dose naloxone, an experimental tool uncovering latent sensitisation: Pharmacokinetics in humans. Br. J. Anaesth. 123 (2), E204–E214. doi:10.1016/j.bja.2018.12.007
Santiago, D., Mangas-Sanjuan, V., Melin, K., Duconge, J., Zhao, W., and Venkataramanan, R. (2020). Pharmacokinetic characterization and external evaluation of a quantitative framework of sublingual buprenorphine in patients with an opioid disorder in Puerto Rico. Pharmaceutics 12 (12), 1226. doi:10.3390/pharmaceutics12121226
Skulberg, A. K., Åsberg, A., Khiabani, H. Z., Røstad, H., Tylleskar, I., and Dale, O. (2019). Pharmacokinetics of a novel, approved, 1.4-mg intranasal naloxone formulation for reversal of opioid overdose-a randomized controlled trial. Addiction 114 (5), 859–867. doi:10.1111/add.14552
UNODC (2020). Synthetic drugs in east and southeast asia: Latest developments and challenges [online]. Available: https://idpc.net/publications/2020/06/synthetic-drugs-in-east-and-southeast-asia-latest-developments-and-challenges.
Yassen, A., Olofsen, E., Romberg, R., Sarton, E., Danhof, M., and Dahan, A. (2006). Mechanism-based pharmacokinetic-pharmacodynamic modeling of the antinociceptive effect of buprenorphine in healthy volunteers. Anesthesiology 104 (6), 1232–1242. doi:10.1097/00000542-200606000-00019
Yassen, A., Olofsen, E., van Dorp, E., Sarton, E., Teppema, L., Danhof, M., et al. (2007). Mechanism-based pharmacokinetic-pharmacodynamic modelling of the reversal of buprenorphine-induced respiratory depression by naloxone: A study in healthy volunteers. Clin. Pharmacokinet. 46 (11), 965–980. doi:10.2165/00003088-200746110-00004
Zhang, L., Beal, S. L., and Sheiner, L. B. (2003). Simultaneous vs. sequential analysis for population PK/PD data I: Best-case performance. J. Pharmacokinet. Pharmacodyn. 30 (6), 387–404. doi:10.1023/b:jopa.0000012998.04442.1f
Keywords: buprenorphine + naloxone, sublingual, population pharmacokinetics, parent-metabolite model, opioid use disorder
Citation: Gu M, Li A, Mak W, Dong F, Xu N, Zhang J, Shi Y, Zheng N, Tang Z, He Q, Ruan C, Guo W, Xiang X, Wang C, Han B and Zhu X (2023) Population pharmacokinetics of buprenorphine and naloxone sublingual combination in Chinese healthy volunteers and patients with opioid use disorder: Model-based dose optimization. Front. Pharmacol. 14:1089862. doi: 10.3389/fphar.2023.1089862
Received: 04 November 2022; Accepted: 04 January 2023;
Published: 19 January 2023.
Edited by:
Rufeng Wang, Beijing University of Chinese Medicine, ChinaReviewed by:
Wenfu MA, Beijing University of Chinese Medicine, ChinaSiddharth Sarkar, All India Institute of Medical Sciences, India
Copyright © 2023 Gu, Li, Mak, Dong, Xu, Zhang, Shi, Zheng, Tang, He, Ruan, Guo, Xiang, Wang, Han and Zhu. This is an open-access article distributed under the terms of the Creative Commons Attribution License (CC BY). The use, distribution or reproduction in other forums is permitted, provided the original author(s) and the copyright owner(s) are credited and that the original publication in this journal is cited, in accordance with accepted academic practice. No use, distribution or reproduction is permitted which does not comply with these terms.
*Correspondence: Xiao Zhu, eGlhb3podUBmdWRhbi5lZHUuY24=; Bing Han, aGJzaGNuQDE2My5jb20=; Chuanyue Wang, d2FuZ19jeUBjY211LmVkdS5jbg==
†These authors have contributed equally to this work and share first authorship
 Meng Gu
 Anning Li3,4†
 Yufei Shi
 Zhijia Tang
 Qingfeng He
 Wei Guo
 Xiaoqiang Xiang
 Chuanyue Wang
 Xiao Zhu