 Guangzhe Yao1,2
 Yanxu Chang
 Jun He
- 1Tianjin State Key Laboratory of Component-based Chinese Medicine, Tianjin University of Traditional Chinese Medicine, Tianjin, China
- 2Haihe Laboratory of Modern Chinese Medicine, Tianjin, China
Terminalia chebula Retz. (TC) is a well-known Chinese herbal medicine and rich in chemical components with multiple pharmacological effects. In this study, an ultra-performance liquid chromatography-tandem mass spectroscopy (UPLC-MS/MS) method was developed and used to determine the blood concentrations of nine active compounds (chebulic acid, gallic acid, protocatechuic acid, corilagin, chebulagic acid, chebulinic acid, 1,2,3,4,6-O-pentagalloylglucose, ellagic acid and ethyl gallate) after oral administration of TC extracts in rats. Pretreatment of plasma samples with protein precipitate with methanol was carried out, and caffeic acid was used as the internal standard (IS). Compounds precisions of intra- and inter-day were less than 14.6%, and the accuracy ranged from −11.7% to 13.5%. The extraction recoveries of compounds were between 84.9% and 108.4%, while matrix effects occurred between 86.4% and 115.9%. Stability tests showed that all nine analytes had been stable under four storage conditions, and statistically significant the relative standard deviations were under 13.7%. The validated UPLC-MS/MS method was applied with great success to plasma pharmacokinetics analysis of the TC extracts, and the pharmacokinetic results showed that among the nine components, the area under the concentration-time curve (AUC(0-tn), 231112.38 ± 64555.20 h ng/mL) and maximum concentration (Cmax, 4,983.57 ± 1721.53 ng/mL) of chebulagic acid were relatively large, which indicated that it had a higher level of plasma exposure. The half-life of elimination (T1/2) of chebulinic acid, corilagin and chebulagic acid were 43.30, 26.39 and 19.98 h, respectively, suggesting that these analytes showed prolonged retention and metabolize more slowly in vivo. This study would deliver a theoretical foundation for the further application of TC in clinical practice.
1 Introduction
Terminalia chebula Retz. is to be derived from the well-ripened fruit of the plant in the family Combretaceae, which includes Terminalia chebula Retz. or Terminalia chebula Retz. var. tomentella Kurt (State Pharmacopoeia Commission, 2020). It is always listed at the top of the list of “Ayurvedic Materia Medica” because of its strong detoxifying properties for the body. Moreover, it mainly used for its effects on the gastrointestinal and respiratory systems in Chinese medicine. And it also exists in lots of Tibetan medicine prescription to cure various diseases, which makes its known as the “King of Tibetan Medicine”. With pronounced antibacterial (Kuchma and O’Toole, 2000), neuroprotective (TC alcohol extracts in the concentration range of 6.25–50 μg/ml had no toxic effects on cells, and concentrations above 25 μg/ml significantly increased the viability of quinolinic acid-injured cells.) (Sadeghnia et al., 2017), antioxidant (Kim et al., 2014), anticancer (TC ethyl acetate fraction in the concentration of 50 g/ml alleviated HSC-T6 growth and some anticancer activity.) (Chen et al., 2015), antidiabetic (Kannan et al., 2012), enhancing immunity effect (TC extract (100 mg/kg/p.o.) has better immunomodulatory activity) (Aher et al., 2010) and prevention of atherosclerosis (The concentration of TC at 100 and 250 μg/ml preventede atherosclerosis) (Lee et al., 2015). Because of its rich chemical components, TC can be used to treat sore throat, asthma, vomiting, diarrhea, bleeding and other diseases (Bag et al., 2013; Gaire et al., 2013; Ekambaram et al., 2020).
Modern pharmacological studies showed extensively that tannins such as chebulinic acid, chebulagic acid, ellagic acid, and corilagin, phenolic acids such as gallic acid, protocatechuic acid and ethyl gallate were the main bioactive components underpinning the pharmacological effects of TC (Reddy et al., 1994; Walia and Arora, 2013). For instance, tannins such as chebulinic acid protects the stomach by inhibiting the activity of the H+K+-ATP (proton pump) enzyme, indicating that it might represent an effective treatment to reduce the incidence of gastric ulcers (Chebulinic acid at a dose of 40 mg/kg has a good anti-gastric ulcer effect) (Mishra et al., 2013). Chebulagic acid inhibits the activation of ERK, JNK, p38, and Akt as well as NF-KB signaling pathways, reduces MDR-1 through COX-2, and has a synergistic effect with azamycin-induced human hepatoma cell toxicity (HepG2) (The concentration of chebulagic acid at 50 μM increased the sensitivity of HepG2 cells towards Dox induced cytotoxicity) (Achari et al., 2011). Furthermore, phenolic acids (gallic acid, protocatechuic acid and ethyl gallate) is an active substance isolated from the TC, which has extensive pharmacological actions such as antioxidant and anti-inflammatory effects (Hazra et al., 2010). It is worth emphasizing that the compounds in TC have far-reaching medicinal value and are worthy of further research and development.
The therapeutic effect of Chinese herbal medicine is based on two key prerequisites, that is, it has sufficient bioavailability and biological effect in the active site after administration, and has the inherent ability to produce the expected effect in its main action forms, namely invariance and metabolism. Because of the chemical complexity of herbal medicine, pharmacokinetics can be used as a screening method to examine whether the components are effectively utilized by the body after administration (Acosta-Estrada et al., 2014; Zhang et al., 2017). Meanwhile, the components that deserve further study would be found, and make a critical step to revealing the material basis of the efficacy of herbal medicine. The bioactive components of TC including chebulic acid, gallic acid, protocatechuic acid, corilagin, chebulagic acid, chebulinic acid, 1,2,3,4,6-O-pentagalloylglucose, ellagic acid and ethyl gallate have good therapeutic effects, such as anti-inflammatory, anti-viral and hypoglycaemic (Li et al., 2018; Shanmuganathan and Angayarkanni, 2018; Song et al., 2020). However, their pharmacokinetics in rats is still to be studied in depth to provide a theoretical basis for the safe clinical use of TC.
Among the compounds isolated and identified from TC, tannins and phenolic acids were found to be a widely studied chemical classes. Meanwhile, the pharmacokinetic profiles of tannins, chebulagic acid and chebulinic acid in rats based on LC-MS/MS methods have been reported (Bei et al., 2013; Lu et al., 2019). However, only the pharmacokinetics and tissue distribution of three monomer components were studied, which could not fully reveal the scientific connotation of TC integrity. Therefore, in this study, a reliable method of UPLC-MS/MS system was established and applied to the pharmacokinetic study of nine bioactive components after oral administration. Through the study of the dynamic changes of multi-compounds in vivo, the material basis of TC to exert its efficacy can be fully elucidated, which provided a meaningful reference for the rational usage of TC and the development of safe and effective drugs.
2 Materials and method
2.1 Chemicals and reagents
Chengdu Desite Bio-Technology Co., Ltd. (Chengdu, China) had a large supply of the standard compounds of chebulic acid, gallic acid, 1,2,3,4,6-O-pentagalloylglucose, protocatechuic acid, corilagin, chebulagic acid, chebulinic acid, ellagic acid, ethyl gallate and caffeic acid (IS) (purity ≥98%). Fisher Scientific (Fair Lawn, NJ, United States) made both methanol and acetonitrile (chromatographic grade) available. Formic acid (chromatographic grade) was provided by ROE (St. Louis, MO, United States). The Millipore-Q water purification system (Tianjin Xinrui Bio-Technology Co., Ltd) was used to produce demineralized water. TC was collected from Anhui province in China.
2.2 Chromatographic and mass spectrometry conditions
UPLC-MS/MS system was used for analysis and monitoring, which consisted primarily of an Agilent 1290 UPLC system (Agilent Technologies, Germany) and an Agilent 6,470 series triple quad (TQ) mass spectrometer (MS) (Agilent Technologies, Singapore) equipped with an electrospray ionization source.
Separation was carried out on an ACQUITY UPLC® HSS T3 column (2.1 × 100 mm, 1.8 μm), and temperature in the column was kept at 20°C. In the mobile phase, 0.1% formic acid in water and acetonitrile were used as solvents A and B, respectively. Gradient elution was performed as follows: 1%–5% B at 0–3 min; 5%–30% B at 3–4 min; 30%–40% B at 4–8 min; 40%–100% B at 8–9 min; 100%–100% B at 9–12 min. The flow rate was set at 0.3 ml/min and the injection volume was 10 μL.
Multiple reaction monitoring (MRM) was used for quantitative analysis in negative (−) ionization mode. The mass spectrometric parameters were set as follows: drying gas (N2) temperature was 300°C; gas (N2) flow rate was 7 L/min; atomizer pressure was 35 psi; sheath gas flow was 11 L/min and capillary voltage was 3800 V. The specific mass spectrometric parameters of the precursor ion, product ion, fragmentor, collision energy, and ion modes of the nine compounds and IS are shown in Table 1.
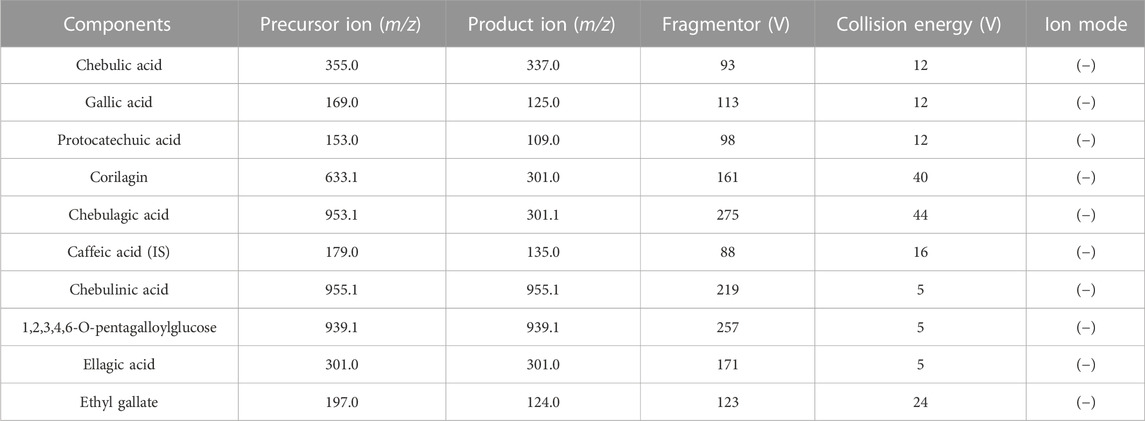
TABLE 1. Mass spectrometry parameters of nine analytes and IS in TC extracts.
2.3 Terminalia chebula Retz. Extracts preparation
Ripe fruits of Terminalia chebula Retz are yellowish grey, spherical or ovoid and about one to two inches in size, which has five lines or five ribs on the outer skin. And TC samples of this study were purchased from Bozhou Chinese herbal medicine market in Anhui province and crushed in a grinder and passed through a 60 mesh sieve. The preparation method of TC extracts was as follows: 100.0 g TC was precisely weighed and extracted with ethanol with 30% water under hot reflux for 10 times, each time for an hour. The extracts were then filtered and mixed, which was evaporated and concentrated in the decompressed state, and the TC extracts after drying were finally sprayed into a fine powder, which was stored in desiccant before analysis. Table 2 displayed the content of chebulic acid, gallic acid, protocatechuic acid, corilagin, chebulagic acid, chebulinic acid, 1,2,3,4,6-O-pentagalloylglucose, ellagic acid and ethyl gallate in TC extracts.
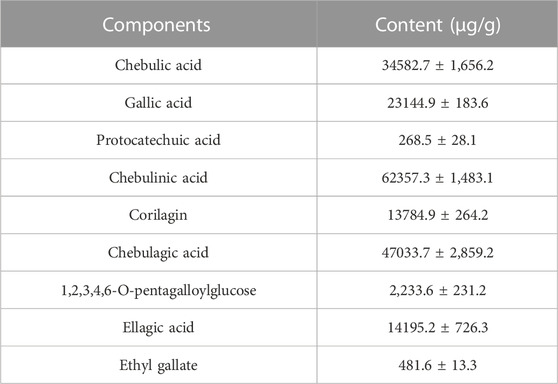
TABLE 2. The content of nine analytes in TC extracts (n = 3).
2.4 Preparation of standard solutions, calibration standards and quality control samples
The standard stock solutions of 1 mg/ml were prepared by weighing 10 mg of chebulic acid, gallic acid, protocatechuic acid, corilagin, chebulagic acid, chebulinic acid, 1,2,3,4,6-O-pentagalloylglucose, ellagic acid, ethyl gallate and caffeic acid (IS). Continuous dilution with methanol produced a working solution from the stock solution.
A mixture of 20 μl serial concentration mixed working solutions of standards and 20 μl IS solutions (caffeic acid, 1,000 ng/ml) was added to 100 μl blank plasma to obtain standard curve samples. The final plasma sample concentrations were 100, 250, 500, 1,000, 2000, 5,000, 10000, 20000, 40000 ng/mL for chebulinic acid; 25, 62.5, 125, 250, 500, 1,000, 2,500, 5,000, 10000 ng/ml for chebulic acid, gallic acid, chebulagic acid and corilagin; 1, 2.5, 5, 10, 20, 50, 100, 200, 400 ng/ml for protocatechuic acid, ethyl gallate and 1,2,3,4,6-O-pentagalloylglucose; and 10, 25, 50, 100, 200, 500, 1,000, 2000, 4,000 ng/ml for ellagic acid.
Preparation of quality control (QC) samples with three concentrations (low, medium, and high) of 16, 160, and 3,200 ng/ml for ellagic acid; 1.6, 16, 320 ng/ml for protocatechuic acid, ethyl gallate and 1,2,3,4,6-O-pentagalloylglucose; 40, 400 and 8,000 ng/ml for chebulic acid, gallic acid, corilagin and chebulinic acid and 160, 1,600, 32000 ng/ml for chebulagic acid. Both QC samples and stock solutions were stored in a refrigerator at 4°C.
2.5 Plasma sample preparation
The plasma sample (100 μl) was sequentially spiked with 20 μl IS solutions (caffeic acid, 1,000 ng/ml); 20 μL methanol, and 10 μl formic acid, then vortex-mixed for 1 min. The mixture was precipitated protein with 1,000 μl methanol by vortex mixing for 3 min. The supernatant was collected into a 1.5 ml clean centrifuge tube after centrifugation at for 10 min 14,000 rpm, and evaporated under a nitrogen stream until dry. After that, the residue was redissolved in 100 μl methanol, vortex-mixed for 3 min, then centrifuged for 10 min at 14,000 rpm. 10 μl analyte was injected into the UPLC-MS/MS system.
2.6 Method validation
2.6.1 Specificity
The specificity was assessed by way of paralleling chromatograms of blank plasma samples, corresponding blank plasma samples spiked with analytes and IS, as well as plasma samples from the rats collected after oral administration of TC extracts.
2.6.2 Linearity and lower limit of quantification
A calibration curve was derived by plotting each analyte’s peak area ratio to IS versus its concentration. The regression relationship is described by linear regression equation with weighting coefficient of 1/X. The signal-to-noise ratio (S/N) is defined as approximately 10 based on the lower limits of quantification (LLOQ) of the baseline noise assessment.
2.6.3 Precision and accuracy
Six replications of QC samples at three concentrations (low, medium, and high) were analyzed within 1 day or over three consecutive days to assess precision and accuracy. The accuracy was assessed by calculating the relative error (RE %), while intra and inter-day precision were defined as the relative standard deviation (RSD).
2.6.4 Extraction recovery and matrix effect
The extraction recoveries and matrix effects were all investigated by six replicates at the three concentrations mentioned above low, medium and high. The recovery was then determined by comparison of the peak areas of the analytes in the pre-precipitated and post-precipitated samples of the spiked standards. While matrix effects were evaluated by calculating the area of the peak of the analyte in the precipitated spiked sample compared to the area of the peak in the standard solutions.
2.6.5 Stability
Under variable treatment conditions: stored for 12 h at auto-sampler, for 4 hours at room temperature, under three freeze-thaw cycles, and kept at −80°C for 7 days, quality control samples were analyzed to assess the stability of the nine analytes in plasma.
2.7 Pharmacokinetic study
Male Sprague-Dawley rats (220 ± 10) g from the Beijing HUAFUKANG Bioscience Co., Inc. (Beijing, China) were selected. In this study, six of male rats were used, given free access to water, and fasted for 12 h before the experimental period. The TC extracts were dissolved in 0.5% CMC-Na aqueous solution as a suspension at a concentration of 1 g/ml. A dose of 10 g/kg of the suspension was administered to the rats orally, the blood samples of approximately 300 μL were drawn from the fundus venous plexus of rats pre- and post-oral administration at 0.00, 0.08, 0.17, 0.25, 0.50, 0.75, 1, 2, 4, 6, 8, 10, 12, 24, 36, 48, 60, 72, 84, 96, 120, 144 and 168 h, respectively. For analysis, the plasma supernatants collected from the centrifuged plasma were frozen at −80°C after centrifugation for 10 min at 6,000 rpm.
2.8 Data analysis
Data were expressed as mean ± standard deviation (mean ± SD). MassHunter Workstation software (version B.09.00) was quantitatively used to calculate the plasma concentrations of nine analytes. To evaluate the specific pharmacokinetic parameters, DAS Software (DAS 3.0, Medical College of Wannan, China) was used to process the pharmacokinetic results.
3 Results and discussions
3.1 Optimization of chromatographic and mass spectrometry conditions
Suitable chromatographic conditions are important for the analysis of nine compounds. The effects of ACQUITY UPLC® BEH C 18 column (2.1 × 100 mm, 1.7 μm) and ACQUITY UPLC® HSS T3 column (2.1 × 100 mm, 1.8 μm) on chromatographic peaks and elution time were studied experimentally. Meanwhile, water (0.1% formic acid)-acetonitrile and water (0.1% formic acid)-methanol were compared to determine the optimum mobile phase. The results displayed that water (0.1% formic acid)-acetonitrile flow has a better peak shape and lower background noise than water (0.1% formic acid)-methanol flow. Nine analytes and IS were purged in 12 min using ACQUITY UPLC® HSS T3 column at a flow phase flow rate of 0.3 mL/min, as shown in Figure 1. No interference peaks were observed.
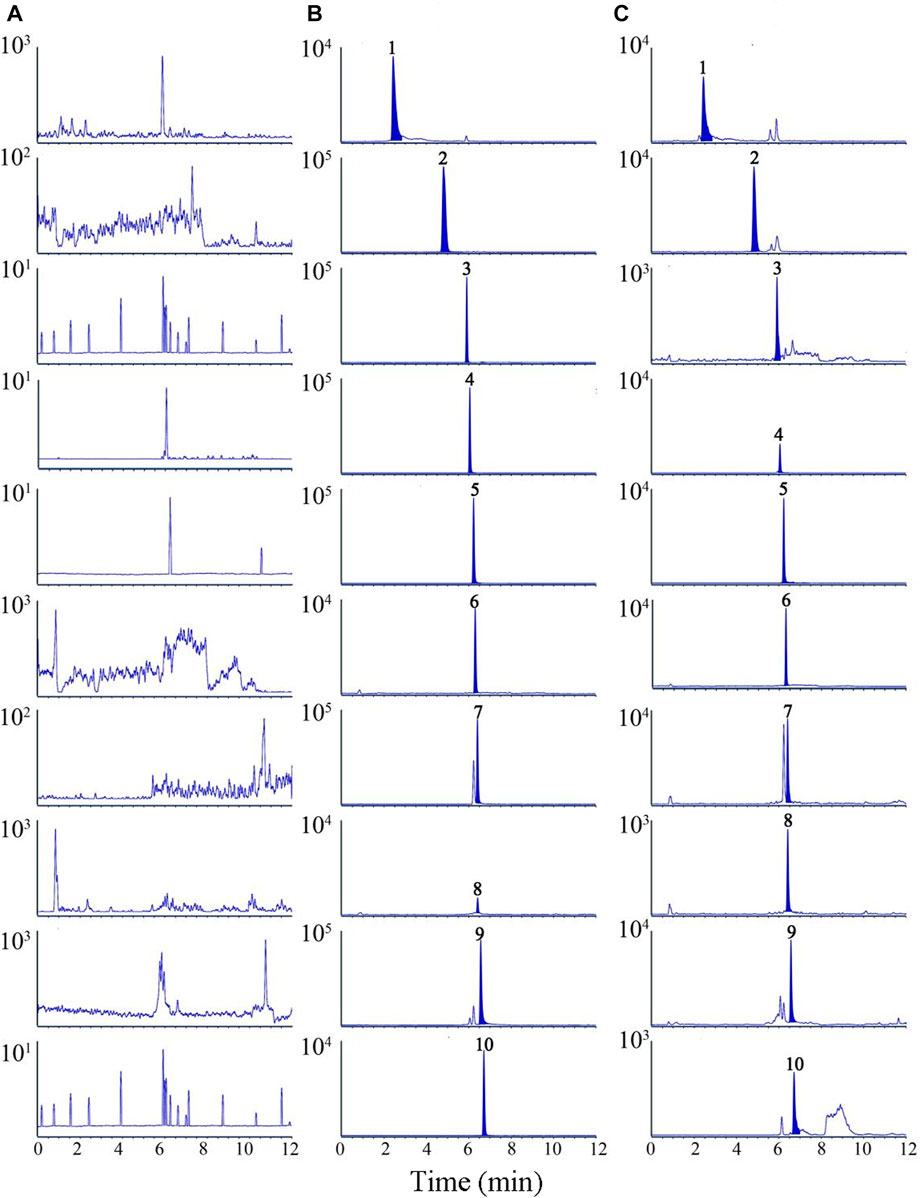
FIGURE 1. Representative multiple reaction monitoring (MRM) chromatograms of nine analytes and IS in rat plasma samples. (A) blank plasma sample, (B) blank plasma spiked with nine analytes and IS, (C) plasma samples after oral administration of TC extracts. 1. chebulic acid, 2. gallic acid, 3. protocatechuic acid, 4. corilagin, 5. chebulagic acid, 6. caffeic acid (IS), 7. chebulinic acid, 8.1,2,3,4,6-O-pentagalloylglucose, 9. ellagic acid, 10. ethyl gallate.
A comparison of electrospray ionisation sources in positive and negative ionisation modes was carried out. The results showed the target substances in negative ion mode are more responsive and stable. MS/MS ion conversion monitoring in multiple reaction monitoring (MRM) mode improves the specificity of the detection method. Therefore, the nine analytes were quantitated with electron spray ionization (ESI) in the negative ionisation mode.
3.2 Sample preparation
Protein precipitation with methanol acetonitrile and liquid-liquid extraction with ethyl acetate were used to find a suitable method for preparing plasma samples. The results showed that the methanol precipitation protein method had good extraction recoveries for the nine analytes and the matrix effects met the assay requirements. Thus, the protein precipitation method using methanol was used in the sample preparation. Furthermore, the effects of different volumes (400 μl, 600 μl, 800 μl, 1,000 μl) of precipitation solvent on extraction recovery and matrix effect were investigated, and it was found that when the volume of methanol was 1,000 μl, the extraction recovery was between 84.9% and 108.4%, and the matrix effect was between 86.4% and 115.9%, indicating that protein precipitation with methanol could obtain satisfactory extraction recovery and matrix effect.
3.3 Method validation
3.3.1 Specificity
Figure 2 is an MRM chromatogram of a blank plasma sample (A), a blank plasma sample with the addition of nine analytes and IS (B), and a plasma sample taken after oral administration of TC extract (C). As against the sample without reference solution, the samples of standard solution with a certain concentration and the medicated plasma were no obvious interference peaks in the residence time of all the analyzed substances.
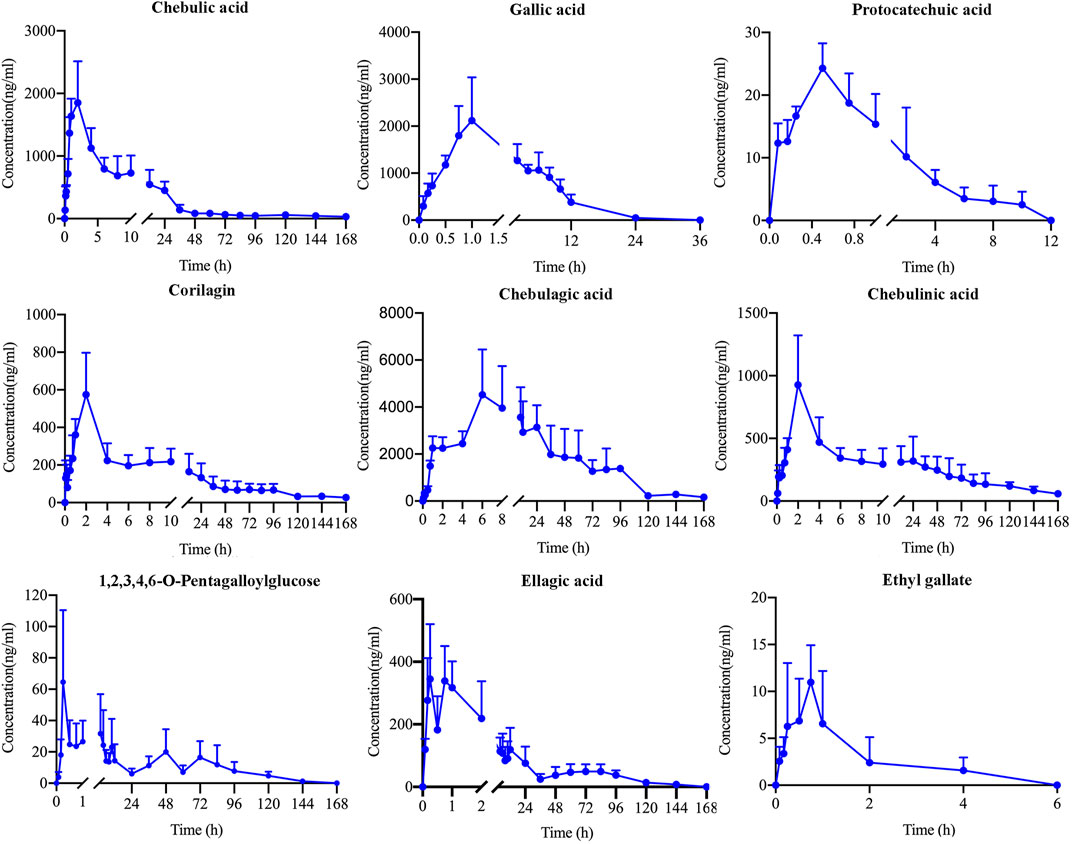
FIGURE 2. Mean plasma concentration-time profiles of chebulic acid, gallic acid, protocatechuic acid, corilagin, chebulagic acid, chebulinic acid, 1,2,3,4,6-O-pentagalloylglucose, ellagic acid and ethyl gallate in rats after oral administration of TC extracts.
3.3.2 Linearity and lower limits of quantification
Table 3 displayed the regression equations, linear ranges, correlation coefficients and LLOQs for the nine analytes. The results indicate that the calibration curves for these analytes showed good linearity (r2 > 0.991) over the corresponding concentration ranges. The LLOQs of chebulic acid, chebulinic acid, protocatechuic acid, corilagin, chebulagic acid, gallic acid, 1,2,3,4,6-O-pentagalloylglucose, ellagic acid, ethyl gallate were 12.0, 17.0, 0.4, 0.1, 8.0, 0.9, 0.1, 8.5 and 0.2 ng/mL, separately.
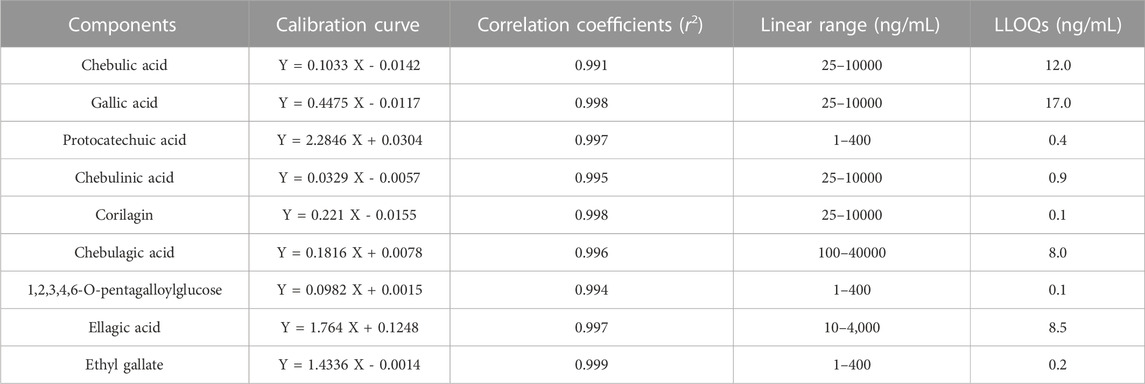
TABLE 3. Calibration profiles, correlation coefficients, linear ranges and LLOQs of the nine analytes.
3.3.3 Precision and accuracy
Table 4 showed intra-day, inter-day and accurate results of QC samples with low, medium and high concentrations in rat biological matrix. It was less than 11.6% for the RSD of intraday, and it was between −9.3% and 13.3% for the RE of intraday. The daily RSD was less than 14.6%, and the daily RE was between −11.7% and 13.5%. Based on the results, this method has an acceptable level of precision and accuracy.
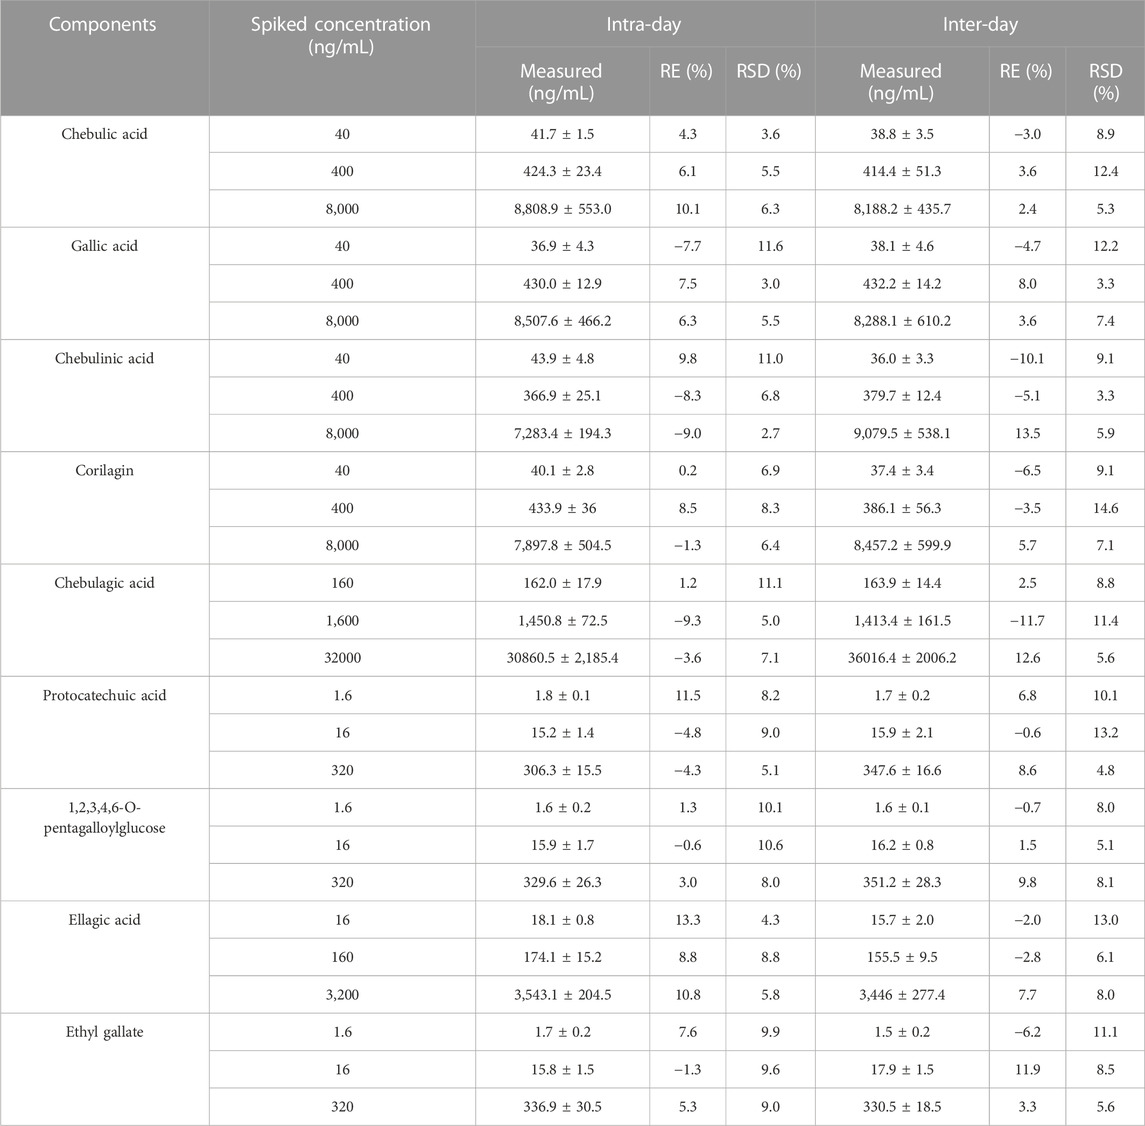
TABLE 4. Precision and accuracy of nine analytes in rat plasma (n = 6).
3.3.4 Extraction recovery and matrix effect
Table 5 summarizes the recoveries of analytes at low, medium and high concentrations and their matrix effects. As a result, total analytes had extraction recoveries ranging from 84.9% to 108.4% (RSD <13.5%). Matrix effects varied from 86.4% to 115.9% (RSD <14.6%). These results showed the accuracy and acceptability of extraction recovery and matrix effects.
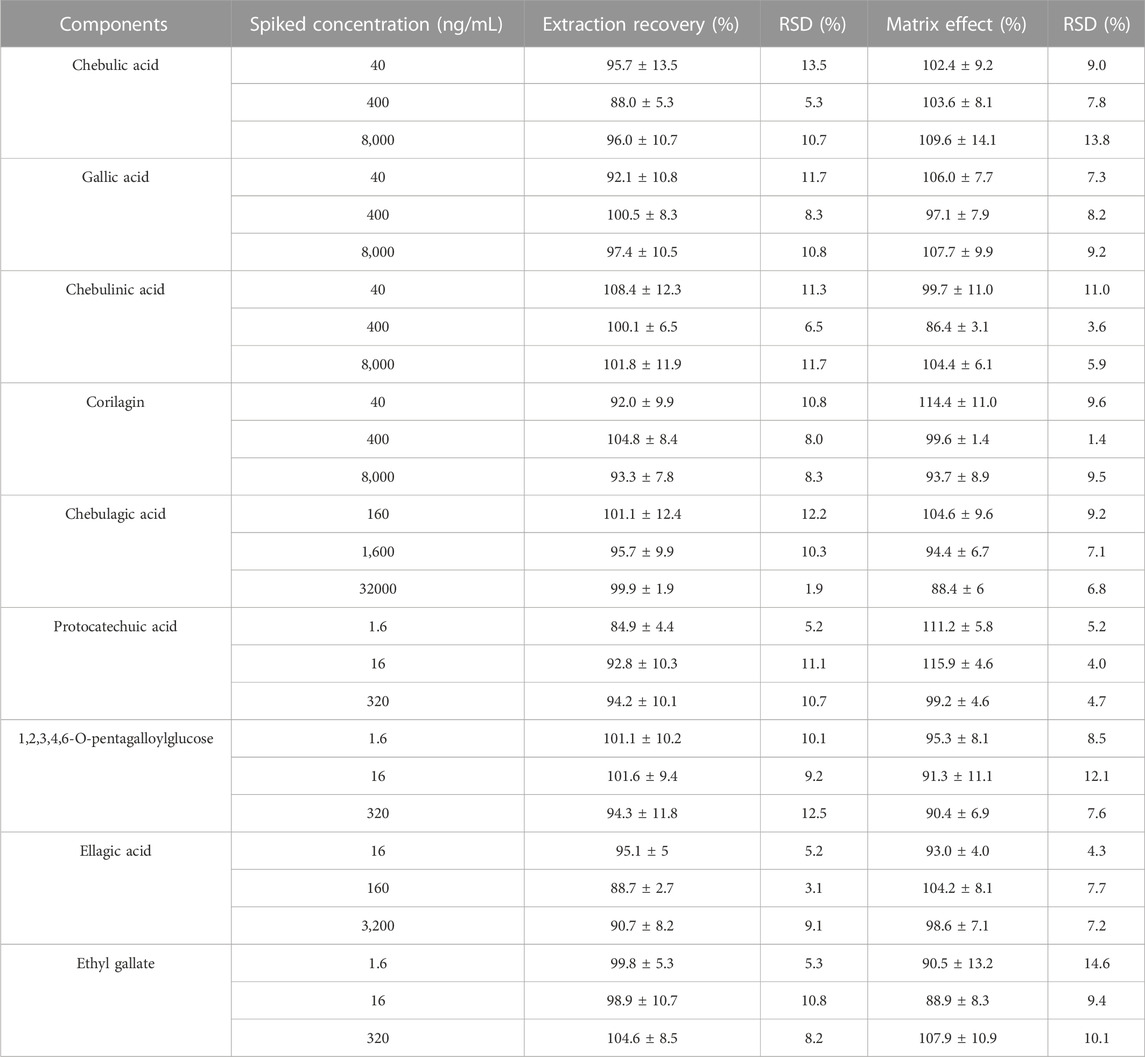
TABLE 5. Extraction recovery and matrix effects of nine analytes in rat plasma (n = 6).
3.3.5 Stability
Table 6 gave the stability evaluation results of QC samples under different conditions. The sample was stabilized at room temperature for 4 h, in an automatic sampler for 12 h and at −80°C for 7 days. The results showed that nine analytic substances in rat plasma can be determined with UPLC-MS/MS, and the relative standard deviation is less than 13.7%.

TABLE 6. Stability of nine analytes in rat plasma (n = 6).
3.4 Pharmacokinetic study
This study examined the pharmacokinetics of nine components of TC extract administered intragastrically to rats. Figure 2 depicted the blank plasma concentration-time curve and Table 7 summarizes the corresponding pharmacokinetic parameters.
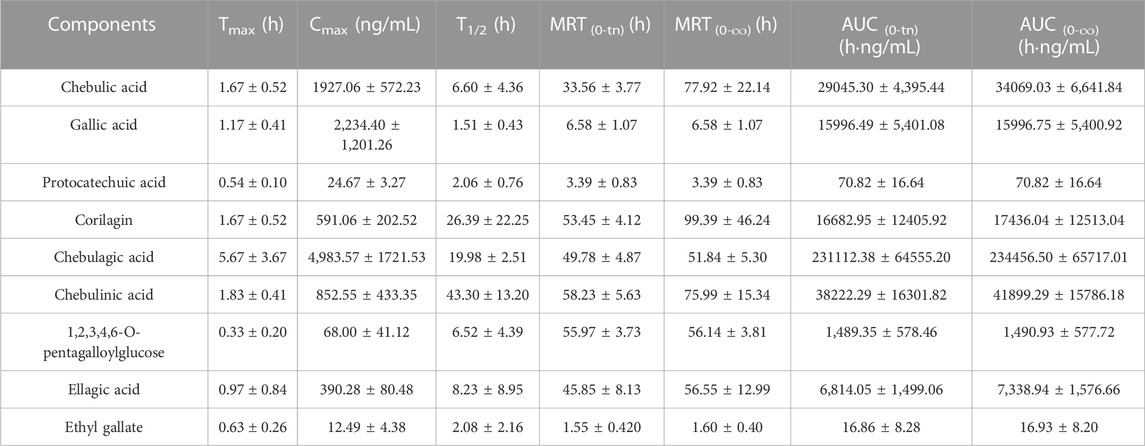
TABLE 7. Pharmacokinetic parameters of nine analytes in normal administration and model administration groups of rats. (Mean ± SD, n = 6).
The T1/2 values of 1,2,3,4,6-O-pentagalloylglucose, chebulic acid, gallic acid, protocatechuic acid, ellagic acid and ethyl gallate were 6.60, 1.51, 2.06, 6.52, 8.23 and 2.08 h, separately, these analytes were shown to be eliminated shortly after oral administration. However, the T1/2 values of corilagin, chebulagic acid and chebulinic acid were 26.39, 19.98, 43.30 h, separately, and their mean residence time (MRT) were 53.45 ± 4.12, 49.78 ± 4.87 and 58.23 ± 5.63 h, separately, which demonstrated that these three analytical substances existed inside the body for a comparatively long term and may have a continuous treatment effect and enhance the clinical efficacy (Ma, 2015; Gao et al., 2016). The AUC(0-tn) and AUC (0-∞) values of chebulic acid, gallic acid, corilagin, chebulagic acid and chebulinic acid were a lot higher than the others, suggesting that these analytes had higher levels of plasma exposure. And the Cmax of chebulic acid, gallic acid and chebulinic acid were 1927.06 ± 572.23, 2,234.40 ± 1,201.26 and 852.55 ± 433.35 ng/ml, respectively, suggesting that the concentration of those compounds was high. In combination with AUC results, chebulic acid, gallic acid and chebulinic acid might be the potential active compounds leading to the effect of TC in vivo.
Furthermore, it was found that ellagic acid and 1,2,3,4,6-O-pentagalloylglucose had double peaks phenomenon on the blank plasma concentration-time curves in Figure 2. This phenomenon may be caused by hepatointestinal circulation. And, perhaps because of the complexity of the gastrointestinal environment, where are multiple sites of absorption at different points, and their permeability of the ingredients is different (Metsugi et al., 2007; Shin et al., 2009; Müller, and Kanfer, 2011).
4 Conclusion
In this study, a simple UPLC-MS/MS method was established and applied to study the pharmacokinetics of 10 g/kg TC extract in rats after a single oral administration. The method was verified, and the detection ability of a low concentration for nine compounds was demonstrated. (chebulic acid, gallic acid, corilagin, protocatechuic acid, chebulagic acid, chebulinic acid, ellagic acid, ethyl gallate and 1,2,3,4,6-O-pentagalloylglucose) with protein precipitation method. The results indicated that the blood concentration and plasma exposure of chebulic acid, gallic acid, corilagin, chebulagic acid and chebulinic acid were higher than other compounds. In addition, compared to the other six components, corilagin, chebulagic acid and chebulinic acid showed prolonged retention and metabolize more slowly. The data obtained in this study can provide useful information for preclinical application, and also provide theoretical basis for the further development of TC.
Data availability statement
The original contributions presented in the study are included in the article/supplementary material, further inquiries can be directed to the corresponding author.
Ethics statement
The animal study was reviewed and approved by the Principles of Animal Care and Use approved by The Animal Ethic Review Committee of Tianjin University of Traditional Chinese Medicine.
Author contributions
JH contributed to the design and development of this research. GY analyzed the data and drew up the first draft framework. XM, ZL, MW, and YB wrote sections of the manuscript. JH, HO, and YC reviewed this manuscript. Authors contributed to the article and approved the final version.
Funding
This study was supported by Science and Technology Project of Haihe Laboratory of Modern Chinese Medicine (22HHZYJC00005).
Conflict of interest
The authors declare that the research was conducted in the absence of any commercial or financial relationships that could be construed as a potential conflict of interest.
Publisher’s note
All claims expressed in this article are solely those of the authors and do not necessarily represent those of their affiliated organizations, or those of the publisher, the editors and the reviewers. Any product that may be evaluated in this article, or claim that may be made by its manufacturer, is not guaranteed or endorsed by the publisher.
References
Achari, C., Reddy, G. V., Reddy, T. C. M., and Reddanna, P. (2011). Chebulagic acid synergizes the cytotoxicity of doxorubicin in human hepatocellular carcinoma through COX-2 dependant modulation of MDR-1. Med. Chem. 7 (5), 432–442. doi:10.2174/157340611796799087
Acosta-Estrada, B., Gutiérrez-Uribe, J. A., and Serna-Saldívar, S. R. O. (2014). Bound phenolics in foods, a review. Food Chem. 152, 46–55. doi:10.1016/j.foodchem.2013.11.093
Aher, V. D., Kumar, A., and Wahi, A. (2010). Immunomodulatory effect of alcoholic extract of Terminalia chebula ripe fruits. J Pharm Sci Res 2 (9), 539–544. doi:10.4314/TJPR.V10I5.5
Bag, A., Bhattacharyya, S. K., and Chattopadhyay, R. R. (2013). The development of Terminalia chebula Retz. (Combretaceae) in clinical research. Asian Pac J. Trop. Biomed. 3 (3), 244–252. doi:10.1016/s2221-1691(13)60059-3
Bei, D., Xie, L., Lu, K., Chan, K., Basu, S., and Liu, Z. (2013). Abstract 4879: Determination of chebulagic acid and chebulinic acid and their pharmacokinetics in mouse. Cancer Res. 73, 4879. doi:10.1158/1538-7445.am2013-4879
Chen, Y., Tong, J., Ge, L., Ma, B., He, J., Wang, Y., et al. (2015). Ethyl acetate fraction of Terminalia bellirica fruit inhibits rat hepatic stellate cell proliferation and induces apoptosis. Ind. Crops Prod. 76, 364–373. doi:10.1016/J.INDCROP.2015.07.007
Ekambaram, S. P., Perumal, S. S., Erusappan, T., and Srinivasan, A. (2020). Hydrolysable tannin-rich fraction from Terminalia chebula Retz. fruits ameliorates collagen-induced arthritis in BALB/c mice. Inflammopharmacology 28 (1), 275–287. doi:10.1007/s10787-019-00629-x
Gaire, B. P., Jamarkattel-Pandit, N., Lee, D., Song, J., Kim, J. Y., Park, J., et al. (2013). Terminalia chebula extract protects OGD-R induced PC12 cell death and inhibits lps induced microglia activation. Molecules 18 (3), 3529–3542. doi:10.3390/molecules18033529
Gao, J., Ajala, O. S., Wang, C. Y., Xu, H. Y., Yao, J. H., Zhang, H. P., et al. (2016). Comparison of pharmacokinetic profiles of Terminalia phenolics after intragastric administration of the aqueous extracts of the fruit of Terminalia chebula and a Mongolian compound medicine-Gurigumu-7. J. Ethnopharmacol. 185, 300–309. doi:10.1016/j.jep.2016.03.016
Hazra, B., Sarkar, R., Biswas, S., and Mandal, N. (2010). Comparative study of the antioxidant and reactive oxygen species scavenging properties in the extracts of the fruits of Terminalia chebula, Terminalia belerica and Emblica officinalis. BMC Complement. Altern. Med. 10 (1), 20–15. doi:10.1186/1472-6882-10-20
Kannan, V. R., Rajasekar, G., Rajesh, P., Balasubram, V., Ramesh, N., Solomon, E. K., et al. (2012). Anti-diabetic activity on ethanolic extracts of fruits of Terminalia chebula Retz. Alloxan induced diabetic rats. Am. J. Drug Discov. Dev. 2 (3), 135–142. doi:10.3923/AJDD.2012.135.142
Kim, H. J., Kim, J., Kang, K. S., Lee, K. T., and Yang, H. O. (2014). Neuroprotective effect of chebulagic acid via autophagy induction in SH-SY5Y cells. Biomol. Ther. 22 (4), 275–281. doi:10.4062/biomolther.2014.068
Kuchma, S. L., and O’Toole, G. A. (2000). Surface-induced and biofilm-induced changes in gene expression. Curr. Opin. Biotechnol. 11 (5), 429–433. doi:10.1016/S0958-1669(00)00123-3
Lee, H. H., Paudel, K. R., and Kim, D. W. (2015). Terminalia chebula fructus inhibits migration and proliferation of vascular smooth muscle cells and production of inflammatory mediators in RAW 264.7. Evid. Based Complement. Altern. Med. 2015, 502182. doi:10.1155/2015/502182
Li, X., Deng, Y., Zheng, Z., Huang, W., Chen, L., Tong, Q., et al. (2018). Corilagin, a promising medicinal herbal agent. Biomed. Pharmacother. 99, 43–50. doi:10.1016/j.biopha.2018.01.030
Lu, Y., Yan, H., Teng, S., and Yang, X. (2019). A liquid chromatography-tandem mass spectrometry method for preclinical pharmacokinetics and tissue distribution of hydrolyzable tannins chebulinic acid and chebulagic acid in rats. Biomed. Chromatogr. BMC 33, e4425. doi:10.1002/bmc.4425
Ma, T. Y. (2015). Ingenuity Toxicokinetics analysis of “Terminalia chebula detoxocate Aconitum kusnezoffi” in Mongolian. China: Inner Mongolia Medical University. doi:10.7666/d.D716027
Metsugi, Y., Miyaji, Y., Ogawara, K.-i., Higaki, K., and Kimura, T. (2007). Appearance of double peaks in plasma concentration–time profile after oral administration depends on gastric emptying profile and weight function. Pharm. Res. 25 (4), 886–895. doi:10.1007/s11095-007-9469-z
Mishra, V., Agrawal, M., Onasanwo, S. A., Madhur, G., Rastogi, P., Pandey, H. P., et al. (2013). Anti-secretory and cyto-protective effects of chebulinic acid isolated from the fruits of Terminalia chebula on gastric ulcers. Phytomedicine 20 (6), 506–511. doi:10.1016/j.phymed.2013.01.002
Müller, A. C., and Kanfer, I. (2011). Potential pharmacokinetic interactions between antiretrovirals and medicinal plants used as complementary and African traditional medicines. Biopharm. Drug Dispos. 32 (8), 458–470. doi:10.1002/bdd.775
Reddy, B. M. K., Rao, N. K., Ramesh, M. V., Rao, A. V., Lin, L.-z., Lin, L. Z., et al. (1994). Chemical investigation of the fruits of Terminalia chebula. Int. J. Pharmacogn. 32 (4), 352–356. doi:10.3109/13880209409083014
Sadeghnia, H. R., Jamshidi, R., Afshari, A. R., Mollazadeh, H., Forouzanfar, F., and Rakhshandeh, H. (2017). Terminalia chebula attenuates quinolinate-induced oxidative PC12 and OLN-93 cell death. Mult. Scler. Relat. Disord. 14, 60–67. doi:10.1016/j.msard.2017.03.012
Shanmuganathan, S., and Angayarkanni, N. (2018). Chebulagic acid Chebulinic acid and Gallic acid, the active principles of Triphala, inhibit TNFα induced pro-angiogenic and pro-inflammatory activities in retinal capillary endothelial cells by inhibiting p38, ERK and NFkB phosphorylation. Vasc. Pharmacol. 108, 23–35. doi:10.1016/j.vph.2018.04.005
Shin, B. S., Hong, S. H., Bulitta, J. B., Hwang, S. W., Kim, H. J., Lee, J. B., et al. (2009). Disposition, oral bioavailability, and tissue distribution of zearalenone in rats at various dose levels. J. Toxicol. Env. Health Part A 72 (21-22), 1406–1411. doi:10.1080/15287390903212774
Song, J., He, Y., Luo, C., Feng, B., Ran, F., Xu, H., et al. (2020). New progress in the pharmacology of protocatechuic acid: A compound ingested in daily foods and herbs frequently and heavily. Pharmacol. Res. 161, 105109. doi:10.1016/j.phrs.2020.105109
State Pharmacopoeia Commission (2020). Pharmacopoeia of the people’s Republic of China. Beijing: China Medical Science Press, 194.
Walia, H. K., and Arora, S. (2013). Terminalia chebula - a pharmacognistic account. J. Med. Plant Res. 7 (20), 1351–1361. doi:10.5897/JMPR12.050
Keywords: Terminalia chebula Retz. extracts, active compounds, pharmacokinetic, UPLC-MS/MS, Rat plasma
Citation: Yao G, Miao X, Wu M, Lv Z, Bai Y, Chang Y, Ouyang H and He J (2023) Pharmacokinetics of active compounds of a Terminalia chebula Retz. Ethanolic extract after oral administration rats using UPLC-MS/MS. Front. Pharmacol. 14:1067089. doi: 10.3389/fphar.2023.1067089
Received: 11 October 2022; Accepted: 06 January 2023;
Published: 13 January 2023.
Edited by:
Yung-Yi Cheng, University of North Carolina at Chapel Hill, United StatesReviewed by:
Kevin Spelman, Health Education & Research, United StatesHua Yang, China Pharmaceutical University, China
Copyright © 2023 Yao, Miao, Wu, Lv, Bai, Chang, Ouyang and He. This is an open-access article distributed under the terms of the Creative Commons Attribution License (CC BY). The use, distribution or reproduction in other forums is permitted, provided the original author(s) and the copyright owner(s) are credited and that the original publication in this journal is cited, in accordance with accepted academic practice. No use, distribution or reproduction is permitted which does not comply with these terms.
*Correspondence: Jun He, aGVqdW42NzNAMTYzLmNvbQ==