 Hongping Hou1Tengfei Chen1Ziying Xu2Zihui Yu2Caixia Wang1Rongxia Liu3Bo Peng1Wei Yang1Feng Li4Xiangyi Che4Bing Li5Yu Wang5Ling Song1Yunhang Gao1
 Zuguang Ye1*
 Guangping Zhang1*
- 1Institute of Chinese Materia Medica, China Academy of Chinese Medical Sciences, Beijing, China
- 2Capital Institute of Pediatrics, Beijing, China
- 3School of Pharmacy, Yantai University, Yantai, China
- 4Gansu Cheezheng Tibetan Medicine Co., Ltd., Beijing, China
- 5Yantai Saipute Analyzing Service Co., Ltd., Yantai, China
Tibetan medicine is one of the oldest traditional medicine systems in the world. Taking the Ruyi Zhenbao tablet (RYZB) as an example, which is a widely used classic oral Tibetan medicine, this article discusses the pharmacokinetics of single administration and long-term treatment and analyzed its metabolic properties and tissue distribution in vivo. After single administration, blood samples were collected before administration and at different time points after administration in different groups of rats. In the study of long-term treatment effects, blood samples were collected from the animals in each group on days 1, 15, and 30 and on day 15 after withdrawal. The results showed that after a single administration, the dose change had no significant effect on the T1/2 and Tmax of agarotetrol, isoliquiritigenin, and piperine (p > 0.05). There was a certain correlation between the increase in AUC0-t and the Cmax of agarotetrol, isoliquiritigenin, piperine, and the increase in dosage, with a dose range of 0.225–0.900 g/kg. There were no significant differences in Cmax and AUC0-t of ferulic acid at different doses (p > 0.05). Meanwhile, there was no significant sex-based difference in the pharmacokinetic parameters of these four components in rats. After long-term administration, the distribution agarotetrol in various tissues of rats was kidney > liver > heart > brain; the tissue distribution in low- and medium-dose groups of isoliquiritigenin was liver > kidney > heart > brain, and in the high-dose group, kidney > liver > heart > brain. The tissue distribution of piperine in each dose group was liver > kidney > heart > brain, and that of ferulic acid in each dose group was kidney > liver > heart > brain. Through the establishment of the previously developed methodology, the pharmacokinetic properties of RYZB were analyzed after a single administration and long-term administration. Our findings confirmed this approach for the exploration and establishment of a pharmacokinetic evaluation of Tibetan medicine, to support its guiding role in clinical application, but also to accelerate research into Tibetan medicine theory and medicine and to provide a solid foundation for the translation of Tibetan medicine throughout the world.
Background
Tibetan medicine, originating from Tibet, China, is one of the oldest traditional medicine systems in the world. In its natural environment with high altitude, thin air, and lack of oxygen, through long-term rich production and living practice, Tibetan medicine has unique properties and advantages over other traditional medicines, generating a complete medical theoretical system with good clinical efficacy (Dakpa, 2014; Sun et al., 2020), and thus, has gradually been accepted throughout China and across the world. However, basic research on Tibetan medicine has been relatively limited and no accurate clinical guidelines or rationale drug usage standards have been established (Liang et al., 2021). Therefore, analyzing the characteristics and advantages of classical Tibetan medicine using modern medical techniques and means can not only support its clinical value in modern medicine but may also complement the shortcomings of modern medicine (Guo et al., 2012).
Ruyi Zhenbao tablet (RYZB) is a widely used classic oral Tibetan medicine, which was recorded in the book Tibetan Medicine Notes written by the famous doctor Gong Zhi Yuan Dan Jia Cuo. RYZB consists of 30 types of medicinal constituents, such as Mother-of-Pearl, Aquilariae Lignum Resinatum, Travertine, Micae Aureus Lapis, Carthami Flos, Brachyura, Caryophylli Flos, and Fructus Terminaliae Billericae. It has effects of clearing away heat, resuscitating, relaxing muscles and tendons, activating collaterals, and drying yellow water, and has mainly been used to treat diseases such as white chanel disorder (a term of Tibetan medicine, which means diseases of the nervous system in modern medical science), numbness of the limbs, paralysis, facial distortion, unconsciousness, arthralgia, gout, limb rigidity, and joint disadvantage (Liu et al., 2015; Wang et al., 2016).
In the previous pre-experiment, we did a lot of work to explore the pharmaceutical ingredients in RYZB that need to be detected. Different from chemical medicine, RYZB contains a lot of medicinal materials and there are many components in different medicinal materials. At present, pharmacokinetic research on TCM was very little, especially in Tibetan medicine. The current research studies on RYZB mainly focused on pharmacology and quality standards (Liu et al., 2015; Gongbao et al., 2019; Ling et al., 2022), but there were no reports on related pharmacokinetics.
Thus, in this study, based on the composition of medicinal materials in RYZB and the prior studies on blood components, the main active components in the medicinal materials from RYZB, which were successfully detected in plasma and were more suitable for the construction of analytical methods; meanwhile, whose standard products could be purchased, were used for the pharmacokinetic study (Wang et al., 2014; Xu et al., 2018; Guo et al., 2020). A total of 10 standard materials (4,4′-dihydroxy-2-methoxychalcone, thymoquinone, daidzein, quercetin-3-rhamnoside, chlorogenic acid, agarotetrol, piperine, ferulic acid, cholan-24-oic acid, isoliquiritigenin, vestitone, and gallic acid) were purchased and used to screen for the target compounds. Finally, agarotetrol (C17H18O6) present in Aquilariae Lignum Resinatum, piperine (C17H19NO3) in Piper longum L., isoliquiritigenin (C15H12O4) in Dalbergia odorifera T. Chen, and ferulic acid in licorice cream were selected.
Now we used RYZB as a typical example, to evaluate the pharmacokinetic characteristics of single administration and long-term administration of a traditional Tibetan medicine in detail. The metabolic characteristics, tissue distribution, and deposition in vivo were analyzed (EMEA, 1994; FDA, 2001) to determine the characteristics of the medication rules of Tibetan medicine and to demonstrate the accurate clinical role and rationale for the use of RYZB within the practice of Tibetan medicine.
Materials and methods
Reagents and drug information
RYZB was purchased from Gansu Cheezheng Tibetan Medicine Co., Ltd., China, batch no. 2004007 (date of manufacture, April 2020; date of expiration, April 2023). Agarotetrol was obtained from Chengdu Push Biotechnology Co., Ltd., China, batch no. PU0295-0025, purity 99.7%. Piperine was obtained from Dalian meilunbio® Co., Ltd., China, batch no. PU0295-0025, purity 99.0%. Isoliquiritigenin was purchased from Shanghai Macklin Biochemical Co., Ltd., China, batch no. C10987045, purity 99.2%. Ferulic acid was purchased from Shanghai Macklin Biochemical Co., Ltd., China, batch no. C11347527, purity 99.2%. Vorinostat was obtained from Shanghai Macklin Biochemical Co., Ltd., China, batch no. C11120592, purity 98.7%. Methanol (chromatographic purity) was purchased from Merck, United States, batch no. l1108107033 and formic acid amine was from Sinopharm Chemical Reagents Co., Ltd., China, batch no. 30011661.
Equipment
The liquid chromatography system, Waters ACQUITY UPLC H-CLASS ultra-high performance liquid chromatography, was obtained from Waters Company, United States. High-resolution mass detection was performed on a Q-Exactive-Orbitrap mass spectrometer, Thermo Fischer Scientific, United States; mass spectrometry system, 6500+ triple quadrupole tandem mass spectrometer, SCIEX Company, United States. The analytical balance was obtained from the METTLER TOLEDO XPE205 millionth analytical balance, Mettler Toledo Instrument Co., Ltd., United States and the centrifuge, EPPENDORF 5427R small desktop freezing high-speed centrifuge was from EPPENDORF Company, Germany. The vortex mixer, IKA VORTEX2, was from IKA Company, Germany.
Experimental methods
Single administration
Clinical dosage of RYZB: each tablet weighs 0.5 g, 4–5 tablets once, twice a day (Schultze-Mosgau et al., 2022). The clinical dosage for human is 4–5 g. According to the multiple body surface areas of humans and rats, the equivalent dose for rats is 0.450 g kg−1. A total of 24 SD rats (180–220 g, 3–4 weeks old) were randomly divided into four groups: control group, low-dose group (2× equivalent dose, 0.225 g kg−1), middle-dose group (equivalent dose, 0.450 g kg−1), and high-dose group (1/2 equivalent dose, 0.900 g kg−1), at a ratio of 1:1 males to females. Blood samples were collected from the eye socket before and at 0.25, 0.5, 0.75, 1, 2, 4, 8, 24, and 48 h after administration and heparin anticoagulation was used. Samples were centrifuged at 4°C and 10,000 rpm for 2 min, divided into aliquots, and frozen at −80°C.
Long-term administration
Plasma analysis
A total of 64 SD rats (180–220 g, 3–4 weeks old) were randomly divided into four groups: control group, high-dose group (maximum administration concentration, 6.0 g kg−1), middle-dose group (1/2 of high dose, 3.0 g kg−1), and low-dose group (1/2 of middle dose, 1.5 g kg−1), with 16 rats in each group, divided into eight males and eight female rats, of which eight rats were treated at 1 month after administration (Geisser and Banke-Bochita, 2010). The remaining eight animals were treated and collected half a month after withdrawal. Blood samples were collected from the eye socket of each group on the day of administration (D1), the middle period of administration (D15), and the last administration (D30) at 0.25, 0.5, 0.75, 1, 2, 4, 8, and 24 h after administration, and blood was collected 15 days after administration. Blood samples were processed as indicated previously.
Tissue measurement
One month after drug administration and 15 days after drug withdrawal (defined the recovery period), the animals were anesthetized and blood was drawn from the abdominal aorta (Bo and Wu, 2020). Organs such as the heart, liver, kidney, and brain were collected, washed quickly with saline at 4°C, weighed, and frozen at −80°C until use.
Treatment methods and processing of plasma samples
Pre-treatment of samples
A 50.0 µl volume of rat plasma was placed in a 2.0 ml centrifuge tube and 150 µl of methanol solution (80.0 ng ml−1) containing internal standard was added (Polson et al., 2003; Pang et al., 2022). The solution was swirled for 1 min and then centrifuged for 15 min (12,700 rpm, 4°C). A 100 µl volume of supernatant was transferred to a 2.0 ml centrifuge tube and diluted with 50.0 µl of water. The sample was swirled for 1 min to mix and 100 µl of supernatant was transferred to a sample vial and then analyzed with LC-MS/MS.
Preparation of the standard curve and quality control of rat plasma
A 45.0 µl sample of blank rat plasma was transferred into a 2.0 ml centrifuge tube and 5.0 µl of standard series solution or of quality control solution was added (Janssen et al., 2022). After swirling for 10 s, plasma concentrations of piperine and isoliquiritigenin were equal to 0.100, 0.500, 1.000, 4.000, 10.000, 40.000, 100, and 200 ng ml−1, respectively. The concentrations of agarotetrol and ferulic acid were equivalent to 0.500, 2.500, 5.000, 20.000, 50.000, 200, 500, and 1,000 ng/ml or that of isoliquiritigenin and piperine was equivalent to 0.300, 1.500, 15.000, and 150 ng/ml. The concentrations of agarotetrol and ferulic acid were equivalent to 1.500, 7.500, 75.000, and 750 ng ml−1. LC-MS/MS analysis was carried out.
Analysis conditions
Chromatographic conditions
Chromatographic column: waters ACQUITY UPLC BEH C18, 2.1 mm × 100 mm I.D, 1.7 μm (Waters Corporation, United States); precolumn: ACQUITY UPLC BEH C18 VanGuard Pre-column, 130 Å, 1.7 µm, 2.1 mm × 5 mm; mobile phase A (MPA): 5 mmol L−1 ammonium formate aqueous solution (containing 0.1% formic acid); mobile phase B (MPB): methanol; column temperature: 4°C; flow rate: 0.300 ml min−1; temperature of the automatic sampler: 4°C; injection volume: 5.00 μl; the chromatographic gradients are described in Supplementary Table S1 (Jiang et al., 2010).
Mass spectrometry
The following mass spectrometry conditions were used: ion source: electrospray ionization (ESI); ionization mode (positive/negative); mode: multi-reaction monitoring (MRM); ion spray voltage: 5,500–4,500 V; turbo ion spray temperature: 450°C; curtain gas type: nitrogen setting, 35.0 psi; nebulizing gas; gas 1: nitrogen setting, 50.0 psi; auxiliary gas, gas 2 nitrogen setting, 50.0 psi; acquisition time: 10.0 min (Chinese Pharmacopoeia, 2012). The mass spectrum conditions of the four components agarotetrol, piperine, isoliquiritigenin, and ferulic acid are shown in Supplementary Table S2.
Treatment methods and analysis conditions of tissue samples
Pre-treatment of samples
The tissue samples were accurately weighed and placed in a homogenizer, and pure water (0.02% formic acid) was added according to the mass-volume ratio of 1:2 to fully homogenize the samples. A 100-μl sample of uniform tissue homogenate was placed in a 2.0 ml Eppendorf tube (blank sample together with an equal volume of water or blank tissue homogenate), 900 μl of methanol (containing 0.1% formic acid) was added and the tube was vortexed for 5min, followed by ultrasonic mixing for 1 min. After centrifuging at 4°C for 5 min (12,000 rpm), 900 μl of the supernatant was transferred to a new test tube and dried in a 48°C water bath. A 100 μl equal proportion mobile phase was added to the precipitate before loading.
Analysis conditions
Chromatographic conditions
The following liquid chromatography system and conditions were used: Waters ACQUITY UPLC H-CLASS ultra-high performance liquid chromatography; column: Waters Acquity UPLC HSS T3 column (100 × 2.1 mm, 1.8 μm); MPA: 0.02% formic acid water; MPB: acetonitrile: methanol = 1:1 (containing 0.02% formic acid); flow rate: 0.300 ml min−1; column temperature: 40°C; sampling volume: 5.00 μl; the chromatographic gradients are shown in Supplementary Table S3 (Liu et al., 2020).
Mass spectrometry conditions
The following mass spectrometry (MS) conditions were used: MS/MS system: Q Exactive Orbitrap Mass Spectrometer; ion source: heated electrospray ion source; scan mode: full MS/dd-MS2 (Top 5); polarity: positive and negative ion scanning; resolution: 70000 FWHM (Full MS); 17500 FWHM (dd-MS2); scan range: 150–800 m·z−1; spray voltage: +3.8 kV/−2.8 kV; AGC target: 3e6 (Full MS); 1e5 (dd-MS2); microscans: 1; maximum inject time: 50.0 ms (Full MS); 50.0 ms (dd-MS2); isolation window: 2.00 m z−1; dynamic exclusion: 10.0 s; sheath gas flow rate: 35.0 arbs; auxiliary gas flow rate: 10.0 arbs; sweep gas flow rate: 0 arbs; capillary temperature: 325°C; heater temperature: 350°C; stepped normalized collision energy: 20.0, 40.0, and 60.0 eV (Liu et al., 2019).
Data processing and analysis
The chromatogram collection and peak integration of analyte and internal standard were processed by MultiQuant 3.0.3 analysis software (AB Sciex). After optimizing the integration parameters, the target peak was automatically integrated and it was not allowed to integrate the peak separately or manually.
Calculation of the analyte concentration was determined by obtaining the chromatographic peak areas of the analyte and the internal standard using software Analyst 1.6.3. The ratio of the analyte concentration (x) to peak area (y) in plasma was linearly regressed using the weighted least squares method (W = 1/x2), and the regression equation (Y = a+bX) was the standard curve. The concentration of the analyte in the rat plasma was calculated according to the standard curve of the analysis batch, and the concentration unit was ng ml−1. The Phoenix WinNonlin non-compartment model module (version 8.1.0.3530) was used to calculate the pharmacokinetic parameters.
The statistical analysis assumed that the main pharmacokinetic parameters (Cmax and AUC0-t) obeyed a normal distribution after logarithmic conversion. The LEVENE test was used to test the homogeneity of variance for the converted parameters. When the variance was uniform (p > 0.05), Student’s t-test was used to evaluate sex-based differences and single-factor variance analysis was used for dose difference. When the variance was uneven (p ≤ 0.05), the Mann–Whitney U-test (M–W method) was used for sex-based differences, while the Kruskal–Wallis H rank sum test was used to evaluate dose difference.
Methodological verification
The results of the method verification are shown in Supplementary Figures S1–S6 and Supplementary Table S4 (EMEA, 1994; FDA, 2001; CFDA, 2014).
Results
Single administration
Drug–time curves of four components in plasma
After oral administration of RYZB in rats, the mean plasma concentration–time curves of agarotetrol, isoliquiritigenin, piperine, and ferulic acid are shown in Figure 1.
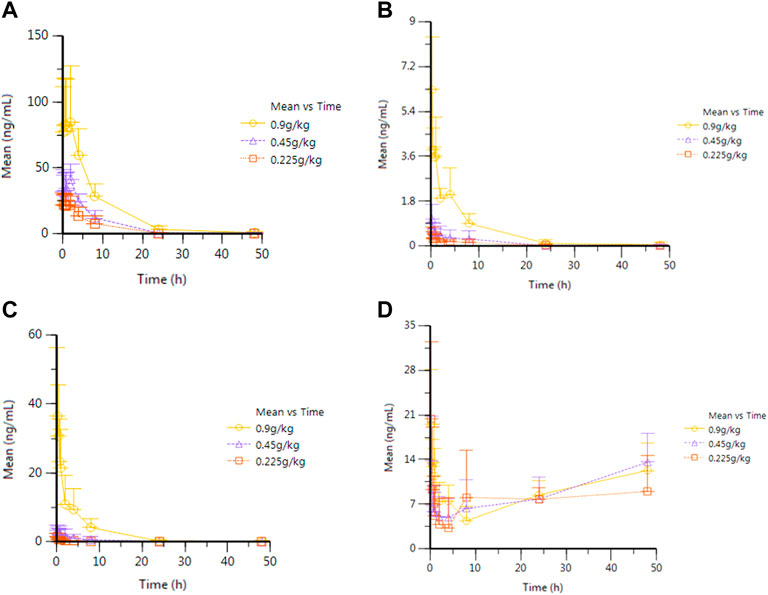
FIGURE 1. Average plasma concentration–time curve of eagleditol after different doses of RYZB. (A) Agarotetrol; (B) isoliquiritigenin; (C) piperine; (D) ferulic acid.
Main pharmacokinetic parameters of the four components
After oral administration of RYZB in rats, the main pharmacokinetic parameters of agarotetrol, isoliquiritigenin, piperine, and ferulic acid are shown in Supplementary Tables S5–S8.
Investigation of linear pharmacokinetics in different dosages
After oral administration of RYZB in the low, middle, and high groups in rats, the main pharmacokinetic parameters AUC0-t and Cmax were logarithmic and then linearly regressed with the logarithmic values of the doses given (see Figure 2 for details). The statistical results showed that the Cmax and AUC0-t of agarotetrol, isoliquiritigenin, and piperine changed significantly after the dose change (p < 0.01 or p < 0.001), and t1/2 and Tmax were not affected by the dose change (p > 0.05) (see Supplementary Tables S5–S8 for details). However, the dose change had no effect on the Cmax, AUC0-t, and t1/2 of ferulic acid, but had a significant effect on the Tmax (p < 0.05).
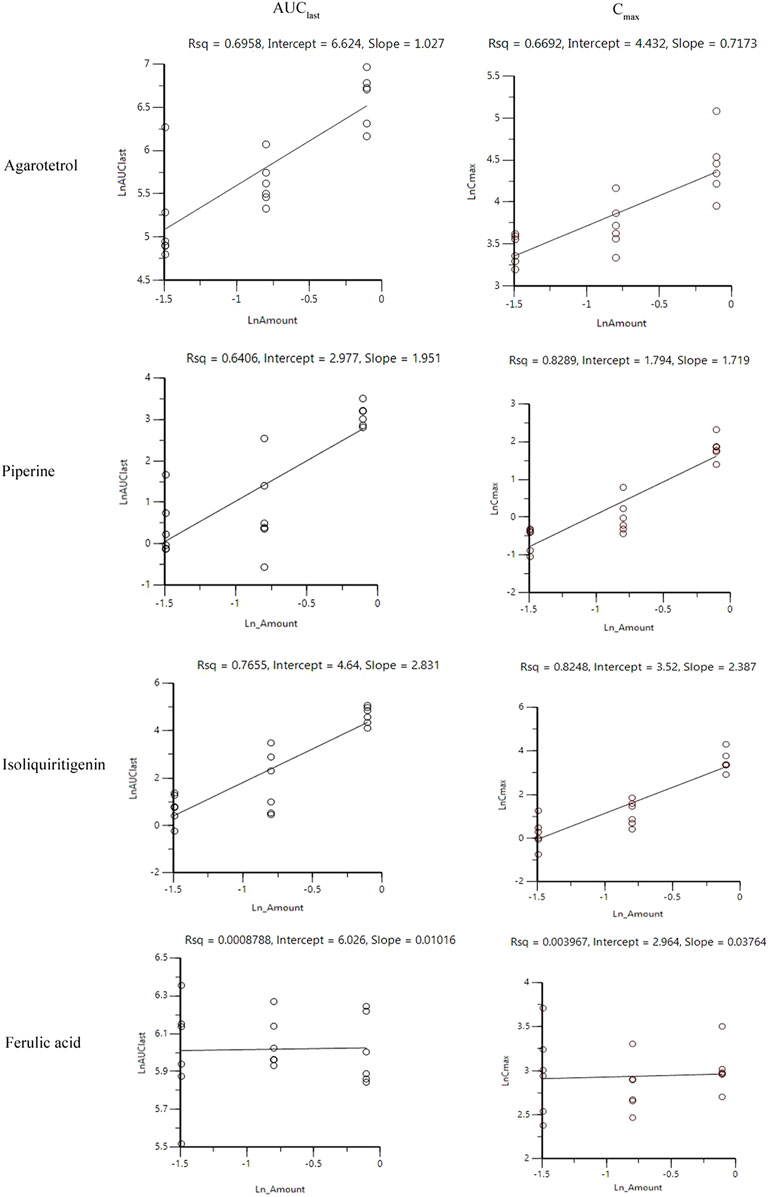
FIGURE 2. Linear relationship between the logarithmic dose of AUC0-t and Cmax.
Comparison of differences in pharmacokinetic parameters caused by sex in vivo
The statistical results showed that sex-based differences have no influence on the main pharmacokinetic parameters of agarotetrol, isoliquiritigenin, piperine, and ferulic acid (p > 0.05) (see Supplementary Tables S5–S8 for details).
Long-term administration
Plasma
Average drug–time curves of the four components in different administration cycles and different doses
Rats were given RYZB at a dose of 1.50, 3.00, or 6.00 g kg−1 orally. Average drug–time curves of agarotetrol, isoliquiritigenin, piperine, and ferulic acid in plasma at D1, D15, D30, and D15 of withdrawal are shown in Figure 3.
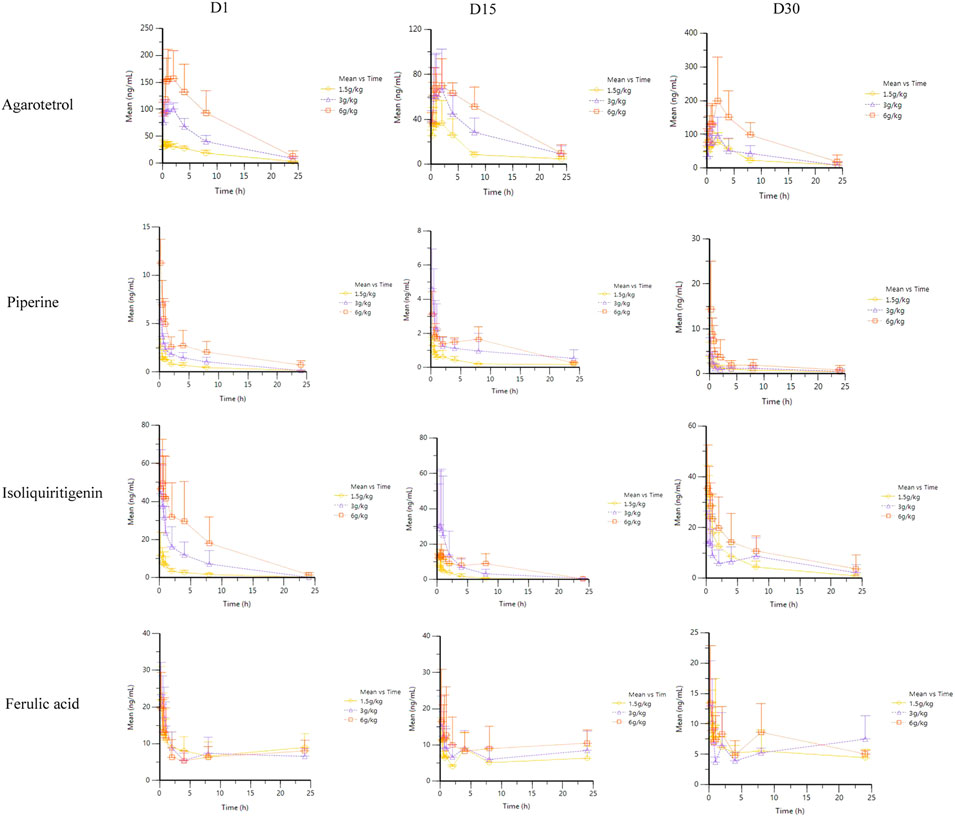
FIGURE 3. Average plasma concentration–time curve of four components at different times after different doses of RYZB.
Main pharmacokinetic parameters
The pharmacokinetic parameters of agarotetrol, isoliquiritigenin, piperine, and ferulic acid at D1, D15, and D30 are given in Tables 1–Tables 12.
TABLE 1. Pharmacokinetic parameters of agarotetrol after different doses of TYZB in rats (D1).
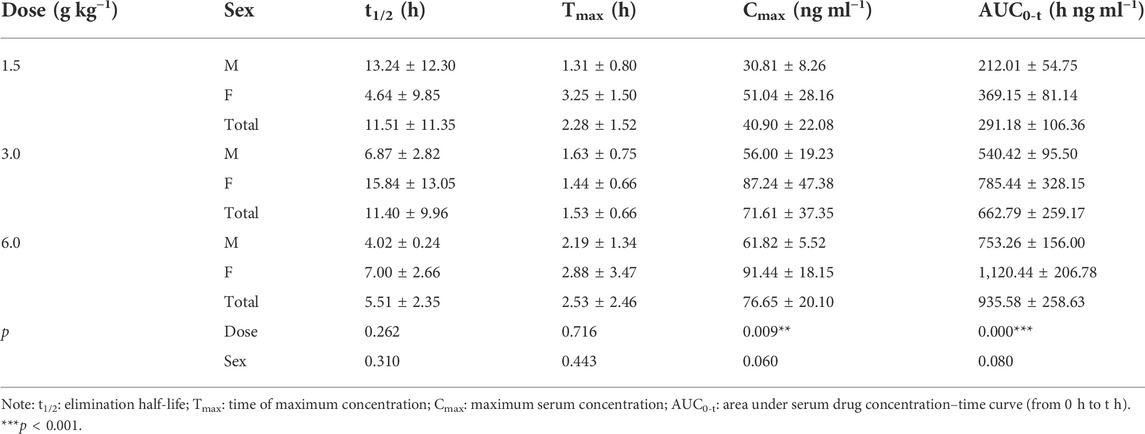
TABLE 2. Pharmacokinetic parameters of agarotetrol after different doses of TYZB in rats (D15).
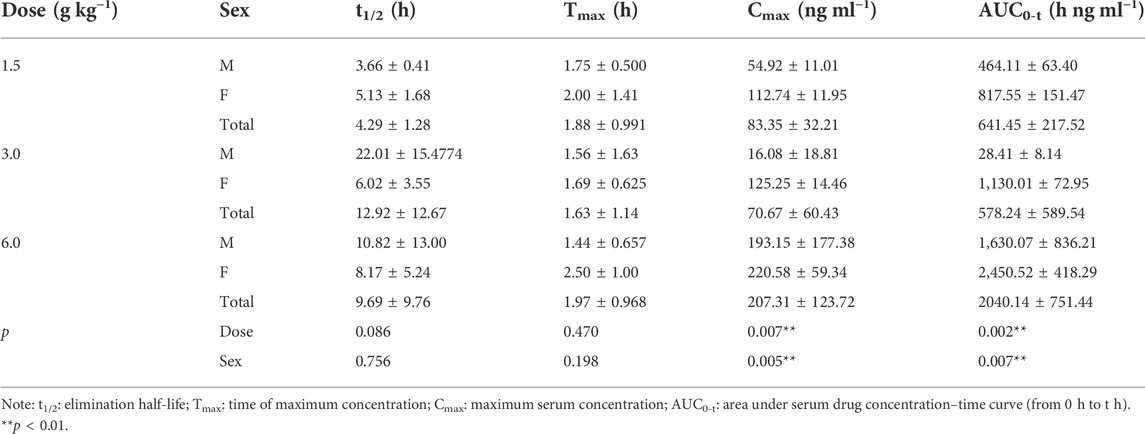
TABLE 3. Pharmacokinetic parameters of agarotetrol after different doses of TYZB in rats (D30).
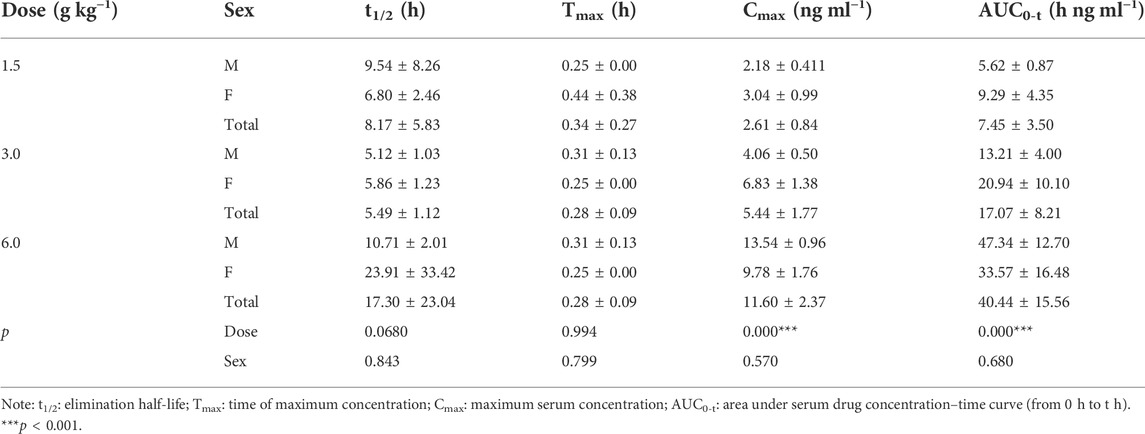
TABLE 4. Pharmacokinetic parameters of isoliquiritigenin after different doses of TYZB in rats (D1).
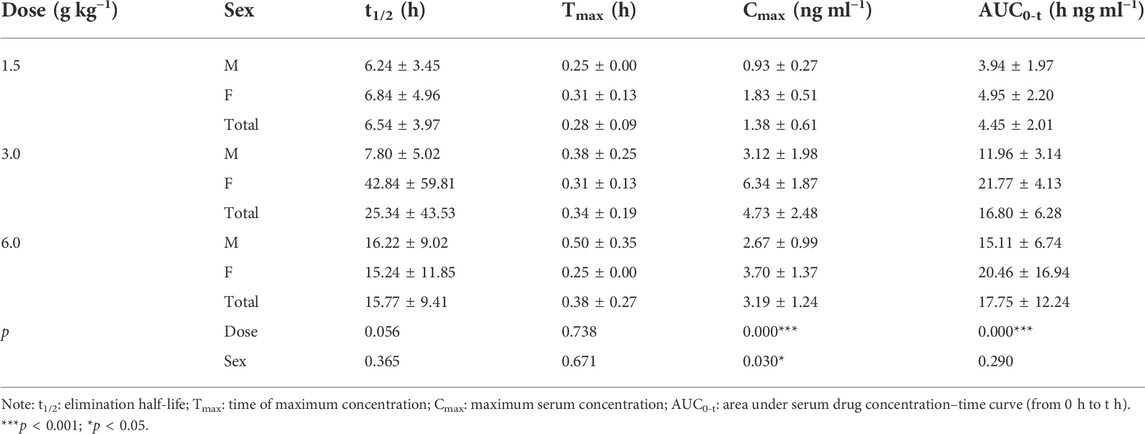
TABLE 5. Pharmacokinetic parameters of isoliquiritigenin after different doses of TYZB in rats (D15).
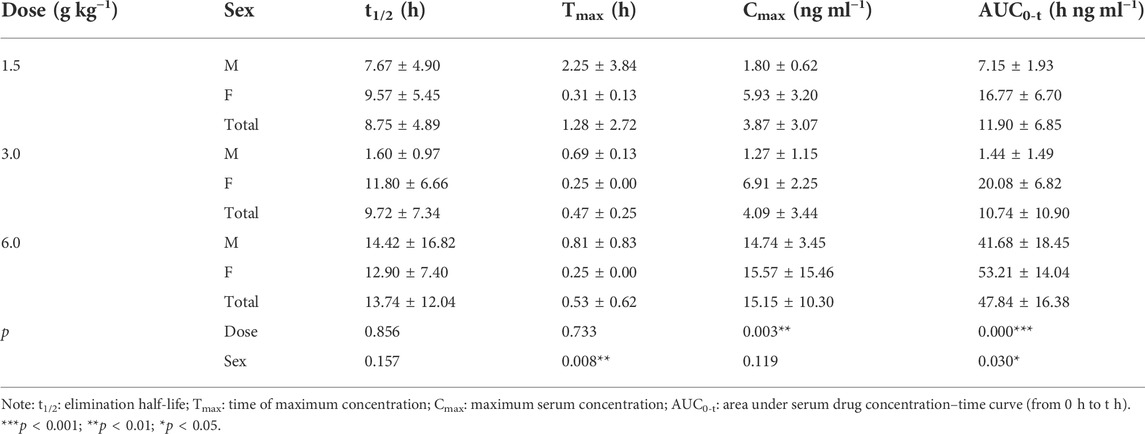
TABLE 6. Pharmacokinetic parameters of isoliquiritigenin after different doses of TYZB in rats (D30).
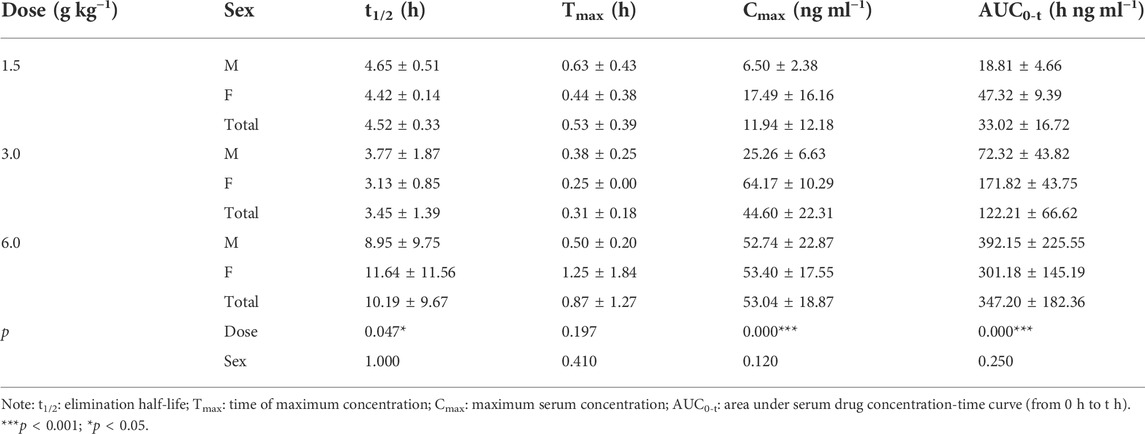
TABLE 7. Pharmacokinetic parameters of piperine after different doses of TYZB in rats (D1).

TABLE 8. Pharmacokinetic parameters of piperine after different doses of TYZB in rats (D15).

TABLE 9. Pharmacokinetic parameters of piperine after different doses of TYZB in rats (D30).
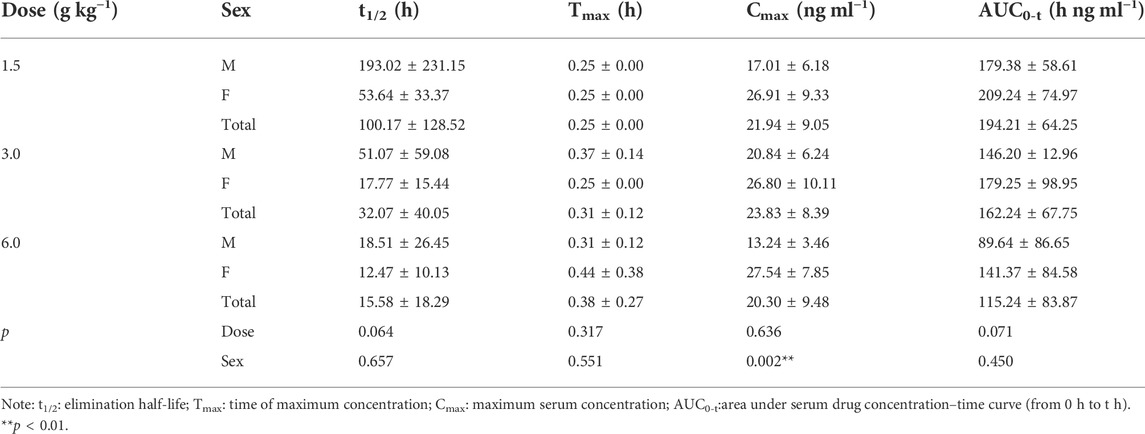
TABLE 10. Pharmacokinetic parameters of ferulic acid after different doses of TYZB in rats (D1).
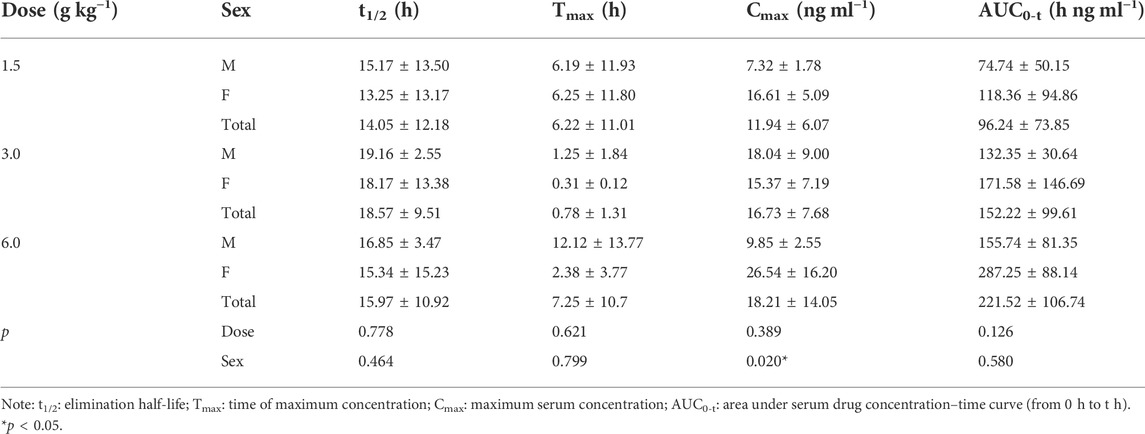
TABLE 11. Pharmacokinetic parameters of ferulic acid after different doses of TYZB in rats (D15).
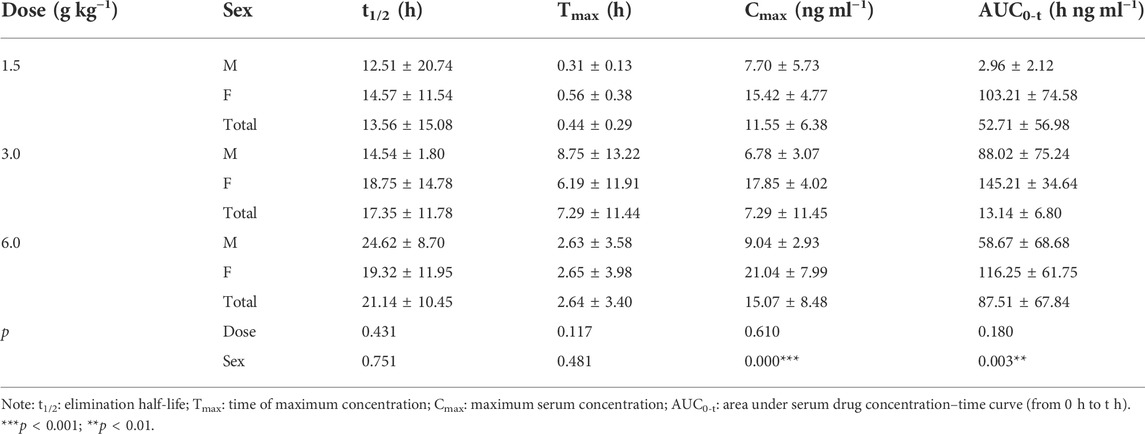
TABLE 12. Pharmacokinetic parameters of ferulic acid after different doses of TYZB in rats (D30).
Investigation of linear pharmacokinetics for different dosages
After oral administration of RYZB in the low, middle, and high dose groups in rats, the main pharmacokinetic parameters AUC0-t and Cmax increased logarithmically and then linearly regressed with the logarithmic values of the given doses, as shown in Figures 4, 5.
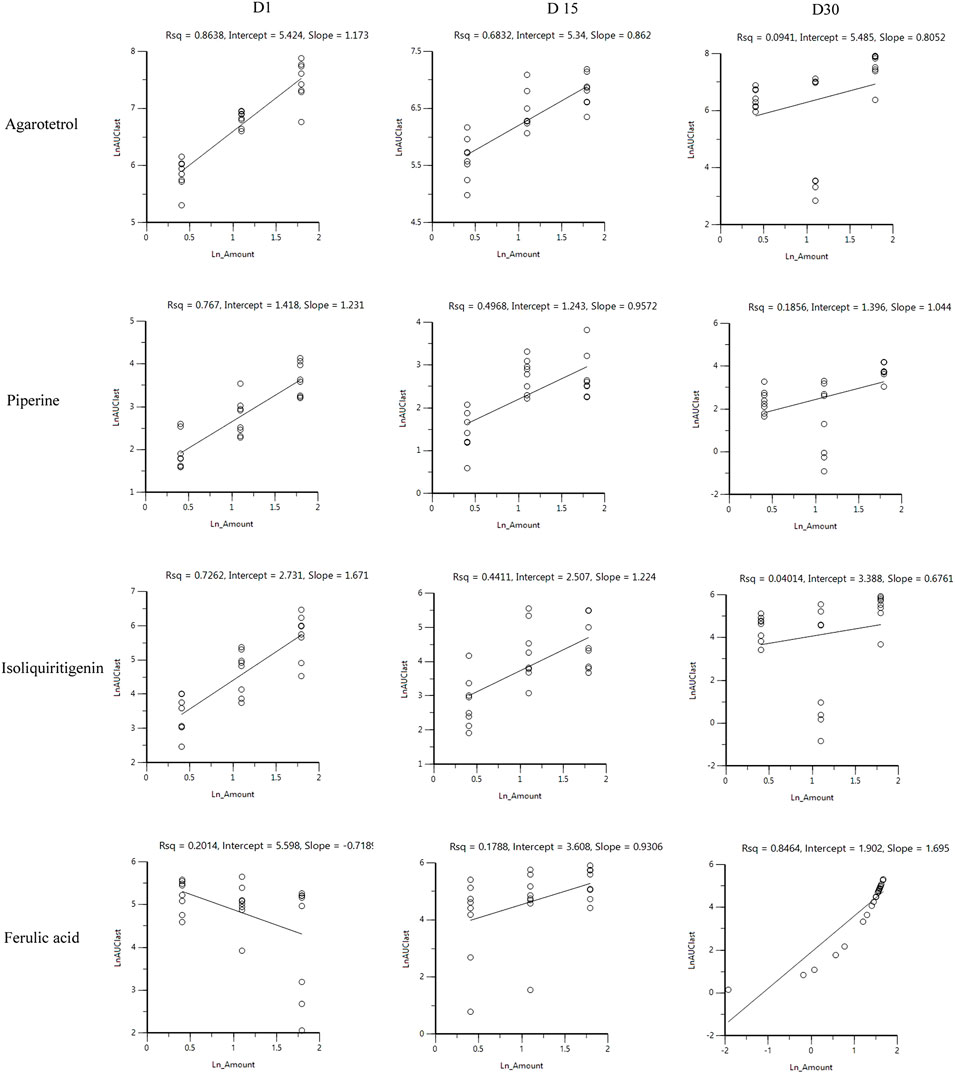
FIGURE 4. Linear relationship diagram between the logarithmic dose value and the logarithmic AUC0-t value.
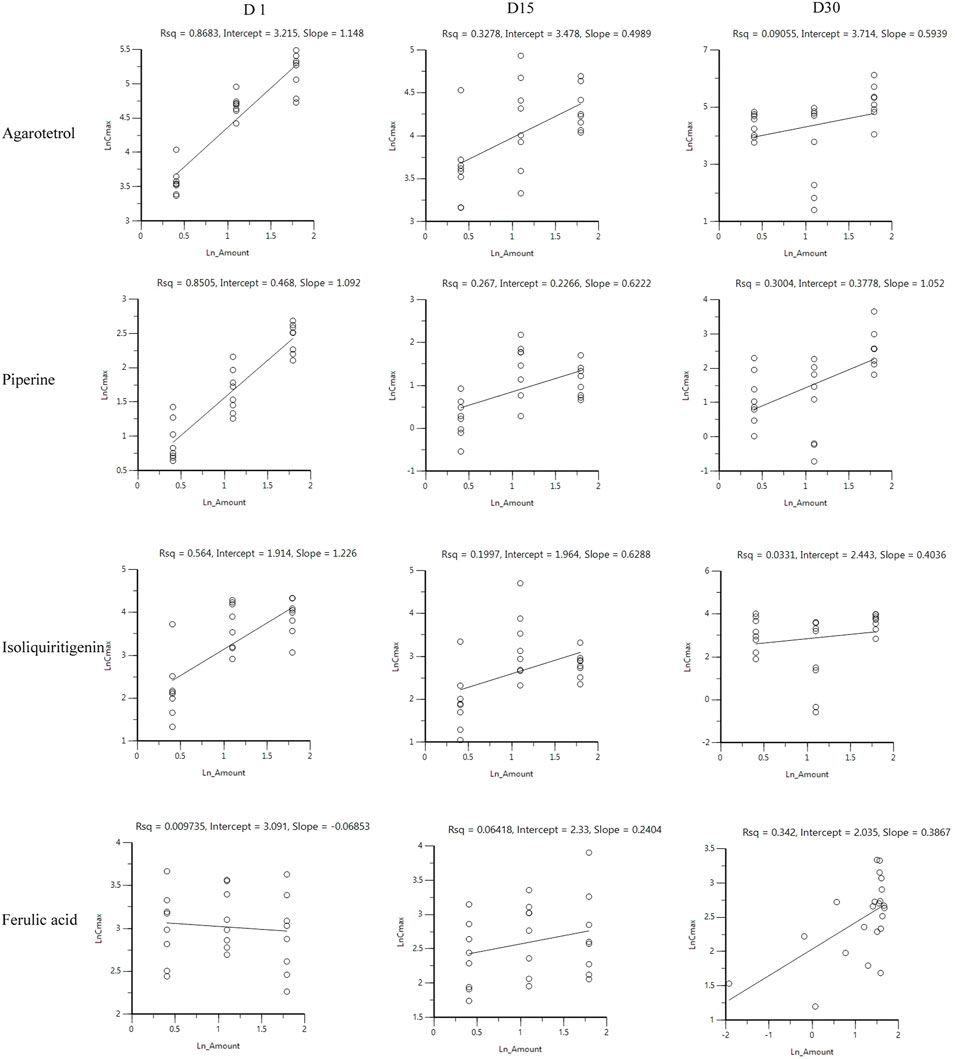
FIGURE 5. Linear relationship diagram between the logarithmic dose value and the logarithmic Cmax value.
On D1 after administration, Cmax and AUC0-t of agarotetrol and isoliquiritigenin changed significantly (p < 0.05), and t1/2 and Tmax were not affected by dose change (p > 0.05). Cmax, AUC0-t, and t1/2 of piperine changed significantly (p < 0.05), but did not have a significant effect on the Tmax (p > 0.05). There was no significant effect on Cmax, AUC0-t, t1/2, or the Tmax of ferulic acid (p > 0.05); details are given in Tables 1, 4, 7, 10.
On D15 after administration, Cmax and AUC0-t of agarotetrol and isoliquiritigenin changed significantly (p < 0.05), although t1/2 and Tmax were not affected by dose changes (p > 0.05); Cmax, AUC0-t, and Tmax of piperine changed significantly (p < 0.05), but had no significant effect on t1/2 (p > 0.05). The dosage change had no significant effects on Cmax, AUC0-t, Tmax, or t1/2 of ferulic acid (p > 0.05), details are given in Tables 2, 5, 8, 11.
On D30 after administration, Cmax and AUC0-t of agarotetrol, isoliquiritigenin, and piperine changed significantly (p < 0.05), but had no significant effect on t1/2 or Tmax (p > 0.05). The dosage change had no significant effect on Cmax, AUC0-t, Tmax, or the t1/2 of ferulic acid (p > 0.05), details are given in Tables 3, 6, 9, 12.
Comparison of sex-based differences in pharmacokinetic parameters in vivo
Agaroterol: on D1 and D15 of administration, sex did not have an effect on the main pharmacokinetic parameters of agaroterol (p > 0.05). On D30 of administration, sex-based differences were significant, with differences in Cmax and AUC0-t (p < 0.05), while t1/2 and Tmax were not affected by sex (p > 0.05); see Tables 1–Tables 3 for details.
Isoliquiritigenin: the pharmacokinetic parameters of isoliquiritigenin were not affected by sex on D1 of administration (p > 0.05). After D15 of administration, sex had a significant effect on Cmax (p < 0.05), but had no effect on other pharmacokinetic parameters (p > 0.05). On the D30 of administration, sex had a significant effect on AUC0-t and Tmax (p < 0.05), but had no effect on Cmax and t1/2 (p > 0.05); see Tables 4–Tables 6 for details.
Piperine: on D1 and D15 of administration, the results showed that sex had no effect on the pharmacokinetic parameters of piperine (p > 0.05). After D30 of administration, sex significantly influenced the pharmacokinetic parameters Cmax, AUC0-t, and Tmax (p < 0.05), but not t1/2 (p > 0.05); see Tables 7–Tables 9 for details.
Ferulic acid: on D1 and D15 of administration, sex had significant influence on Cmax (p < 0.05), but had no influence on other pharmacokinetic parameters (p > 0.05). On D30 of administration, the results showed that sex had significant effects on AUC0-t and Cmax (p < 0.05), but had no significant effects on t1/2 or Tmax (p > 0.05); see Tables 10–Tables12 for details.
Test results of the four components after 15 days of withdrawal
After 15 days of withdrawal, agarotetrol and piperine were not detected for any of the three doses; isoliquiritigenin and ferulic acid could be detected in the low dose group, while ferulic acid could be detected in the middle and high doses; see Table 13 for details.
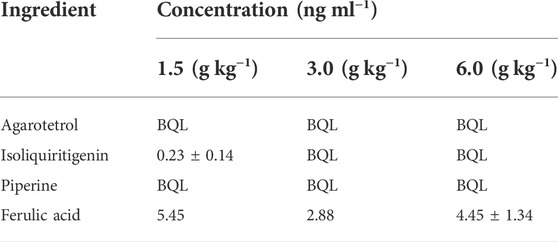
TABLE 13. Test results of four components after 15 days of withdrawal.
Accumulation index of systemic exposure of four components in plasma
The average ratios of AUC0-t for the low, middle, and high dose groups of agarotetrol in plasma were 2.39, 0.77, and 1.10, respectively, and the Cmax ratio was 2.28, 0.65, and 1.14, respectively. The average ratios of AUC0-t and Cmax for isoliquiritigenin were 1.60, 0.63, and 1.17, respectively, and 1.48, 0.75, and 1.30 respectively. The average ratios of AUC0-t and Cmax for piperine were 2.94, 0.657, and 0.735, respectively, and 2.29, 0.38, and 0.76, respectively. The average ratios of AUC0-t and Cmax for ferulic acid were 0.27, 0.08, and 0.76, and 0.53, 0.31, and 0.74, respectively; see Table 14 for details.
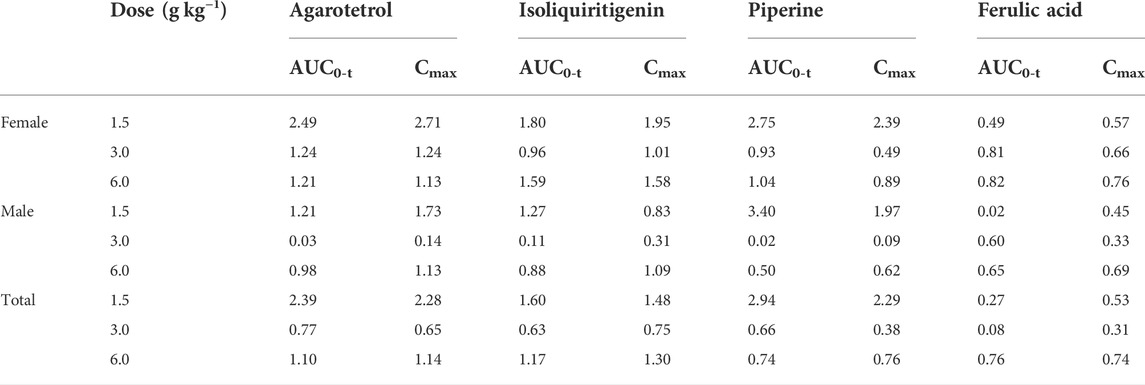
TABLE 14. Accumulation index of systemic exposure of four components in plasma (ratio).
Tissue
Contents of four components in different tissues at different doses
After rats were given 1.50, 3.00, and 6.00 g kg−1 of RYZB, agarotetrol, ferulic acid, piperine, and isoliquiritigenin were detected in the brain, heart, liver, and kidney tissues and their concentrations were higher in the kidney and liver, but lower in the heart and brain tissues. Agarotetrol was distributed mainly to the kidney, liver, and heart, but less to the brain. Isoliquiritigenin was distributed more to the kidney and liver, but less to the brain and heart. Piperine was distributed more in the liver and distributed more to the brain than the other three substances, and was less distributed to the heart and kidney. Ferulic acid was mainly distributed to the kidney, followed by the liver, but was less distributed to the brain and heart; see Figure 6 for details.
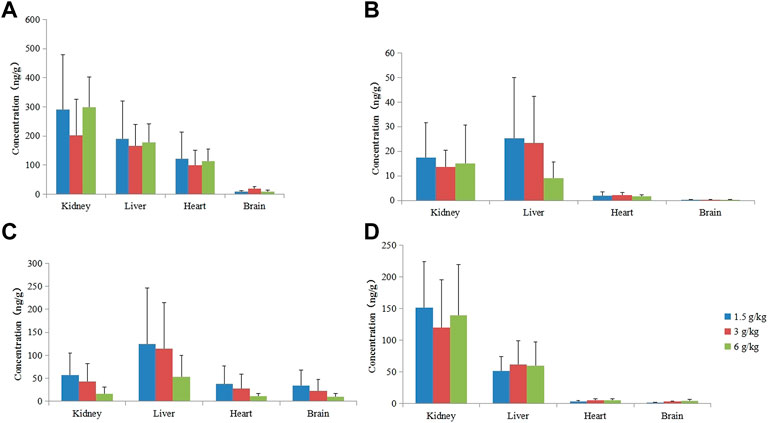
FIGURE 6. Concentration of four components in different tissues at different doses. (A) Agarotetrol; (B) isoliquiritigenin; (C) piperine; (D) ferulic acid.
Qualitative analysis of tissue samples
After RYZB was administered to rats, tissue samples were analyzed and processed using a combination of full MS/dd-MS2 and the database mzCloud and ChemSpider. Fourteen components were identified in brain samples, which were 7-hydroxy-3′,4′-dimethoxyisofavone, 2′-methoxyformononetin, vestitone, sativanone, piperine, piperlongumine, pipernonaline, tryptophan, liquiritin, isocostic acid, glycocholic acid, lecithos, oleic acid, and cholan-24-oic acid. A total of 18 components were detected in the heart: agarotetrol, linolenic acid, 7-hydroxy-3′,4′-dimethoxyisoflavone, 2′-methoxyformononetin, daidzin, vestitone, sativanone, piperine, piperlongumine, tryptophan, liquiritin, isocostic acid, linoleic acid, glycocholic acid, glycochenodeoxycholic acid, corchoionoside C, oleic acid, and cholan-24-oic acid. There were 24 components detected in the liver: agarotetrol, linolenic acid, 7-hydroxy-3′,4′- dimethoxyisoflavone, 2-methoxyformononetin, daidzein, isoliquiritigenin, vestitone, sativanone, piperine, piperlongumine, pipernonaline, apigenin, tryptophan, liquiritin, ferulic acid, isocostic acid, linoleic acid, normuscone, glycocholic acid, glycochenodeoxycholic acid, lecithos, corchoionoside C, oleic acid, and cholan-24-oic acid. A total of 24 components were detected in the kidney: agarotetrol, linolenic acid, 7-hydroxy-3′,4′-dimethoxyisoflavone, 2′-methoxyformononetin, daidzein, isoliquiritigenin, vestitone, sativanone, piperine, piperlongumine, pipernonaline, apigenin, tryptophan, liquiritin, ferulic acid, isocostic acid, dehydrocostus lactone, linoleic acid, glycocholic acid, glycochenodeoxycholic acid, lecithos, corchoionoside C, oleic acid, and cholan-24-oic acid.
Discussion
Hydroxysafflor yellow A was the quality control index of the Ruyi Zhenbao tablet, but in the early blood components, hydroxysafflor yellow A was not detected, which was closely related to its low bioavailability. According to literature reports, hydroxysafflor yellow A was poorly absorbed by rats, and its absolute bioavailability is 1. 2%, which has a bile efflux effect (Li et al., 2015; Chen et al., 2022). So the other four components were chosen to be detected. Through the pharmacokinetic study of the bioactive components of RYZB, such as agaroterol, piperine, isoliquiritigenin, and ferulic acid, we could understand their changing rules in the body and provide a reasonable basis for clinical applications.
After a single administration, the Tmax of agarotetrol, isoliquiritigenin, piperine, and ferulic acid in plasma was achieved mainly between 0.25 and 4 h. The Cmax of the high dose was 89.5 ± 37.9 ng ml−1, 6.42 ± 2.02 ng ml−1, 36.8 ± 19.6 ng ml−1, and 21.1 ± 6.22 ng ml−1, respectively. AUC0-t was 768 ± 217 h ng ml−1, 22.8 ± 6.16 h ng ml−1, 110 ± 38.8 h ng ml−1, and 413 ± 76.9 h ng ml−1, respectively. The plasma t1/2 was 6.84 ± 2.40 h, 8.65 ± 5.42 h, 5.34 ± 3.44 h, and 82.6 ± 42.7 h respectively. MRT0-t was 6.69 ± 1.82 h, 5.63 ± 3.52 h, 4.33 ± 1.96 h, and 28.0 ± 3.74 h, respectively.
The T-test and the rank sum test were used to evaluate the dose differences of the main pharmacokinetic parameters. The results showed that the dose change had no significant effect on t1/2 and Tmax of agarotetrol, isoliquiritigenin, and piperine (p > 0.05). The aforementioned results showed that in the dose range of 0.225–0.900 g kg−1, the increase in the AUC0-t and Cmax values of agarotetrol, isoliquiritigenin, and piperine was related to the dose increase. There were no significant differences in Cmax and AUC0-t of ferulic acid at different doses (p > 0.05), mainly because ferulic acid was not only an effective component of TCM but also a functional phenolic acid component in plant cell walls, which was commonly found in grains and nuts (Russell and Duthie, 2011; Tinikul et al., 2018; Kumar and Goel, 2019). After 4 h of administration, the rats were fed again and, thus, there was no significant difference in the low, middle, and high doses.
The T-test and the rank sum test were used to test sex-based differences in the main pharmacokinetic parameters in each group. The results showed that the pharmacokinetic parameters of agarotetrol, isoliquiritigenin, piperine, and ferulic acid in rats did not show significant sex-based differences (p > 0.05).
After long-term administration, the distribution order of agarotetrol in various tissues of rats was kidney > liver > heart > brain; the distribution order of tissues in the low- and middle-dose groups of isoliquiritigenin was liver > kidney > heart > brain, and that in the high dose group was kidney > liver > heart > brain. The tissue distribution of piperine in each dose group was liver > kidney > heart > brain, and that of ferulic acid in each dose group was kidney > liver > heart > brain. Isoliquiritigenin was not detected in all tissues during the recovery period, and agarotetrol was not detected in the brain, heart, or liver tissues and its concentration in kidney tissues was lower than 2.50 ng ml−1. Piperine was not detected in the brain, heart, and kidney, but the concentration in liver tissue was less than 6.95 ng ml−1. Ferulic acid was not detected in the brain but was present in the heart, liver, and kidney tissues.
Unlike chemical medicines, TCM often contains many different kinds of medicinal materials, and each medicinal material can also have different ingredients. How to choose ingredients to represent the pharmacokinetics of TCM is a problem faced by the development of TCM. How to guide the clinical usage of TCM is another important problem faced by TCM. According to the current research methods and means, it is of great significance to study the pharmacology and kinetics of TCM, especially of Tibetan medicine. In future research, we should adopt a more scientific and reasonable evaluation method to evaluate the pharmacokinetics of TCM according to its characteristics, to provide a more valuable reference for clinics.
In summary, by adopting and verifying a previously described methodology, the pharmacokinetic characteristics of the classic Tibetan medicine RYZB tablet after single administration and long-term administration were analyzed, which will not only play a guiding role in supporting the clinical application of RYZB, but will also accelerate research into Tibetan medicine theory and its application, thus, providing a solid foundation for the acceptance of Tibetan medicine throughout the world.
Data availability statement
The original contributions presented in the study are included in the article/Supplementary Material; further inquiries can be directed to the corresponding authors.
Ethics statement
All animal procedures were carried out in compliance with the Guidelines for Scientific Animal Procedures and approved by the Ethics Committee of the China Academy of Chinese Medical Sciences.
Author contributions
GZ and ZY designed the research. HH, RL, CW, YW, YG, LS, and BL operated the research. HH, FL, CW, and WY wrote the manuscript. HH, TC, ZX, and ZY analyzed the data.
Funding
This research was supported by the National Key Research and Development Program of China (No. 2019YFC1712403) and the Fundamental Research Funds for the Central Public Welfare Research Institutes (Nos. ZZ13-YQ-060 and ZXKT21020).
Conflict of interest
Authors FL and XC were employed by the company Gansu Cheezheng Tibetan Medicine Co., Ltd. Authors BL and YW were employed by the company Yantai Saipute Analyzing Service Co., Ltd.
The remaining authors declare that the research was conducted in the absence of any commercial or financial relationships that could be construed as a potential conflict of interest.
Publisher’s note
All claims expressed in this article are solely those of the authors and do not necessarily represent those of their affiliated organizations, or those of the publisher, the editors, and the reviewers. Any product that may be evaluated in this article, or claim that may be made by its manufacturer, is not guaranteed or endorsed by the publisher.
Supplementary material
The Supplementary Material for this article can be found online at: https://www.frontiersin.org/articles/10.3389/fphar.2022.948693/full#supplementary-material
SUPPLEMENTARY FIGURE S1 | Q1 full-scan mass spectrum of agarotetrol, isoliquiritigenin, piperine, ferulic acid, and internal standard.(A) Agarotetrol; (B) isoliquiritigenin; (C) piperine; (D) ferulic acid; (E) interior label.
SUPPLEMENTARY FIGURE S2 | Ion full scanning mass spectrum of products of agarotetrol, isoliquiritigenin, piperine, ferulic acid, and internal standard.(A) Agarotetrol; (B) isoliquiritigenin; (C) piperine; (D) ferulic acid; (E) interior label.
SUPPLEMENTARY FIGURE S3 | Typical MRM chromatogram of agarotetrol and internal standard in rat plasma by the LC-MS/MS method. I represents the analyte and II represents the internal standard.(A) Blank plasma in rats (double blank); (B) blank plasma with the internal standard (blank); (C) real sample (single administration for 15.0 min); (D) quantitative lower limit sample.
SUPPLEMENTARY FIGURE S4 | Typical MRM chromatogram of isoliquiritigenin and internal standard in rat plasma by the LC-MS/MS method. I represents the analyte and II represents the internal standard.(A) Blank plasma in rats (double blank); (B) blank plasma with internal standard (blank); (C) real sample (single administration for 15.0 min); (D) quantitative lower limit sample.
SUPPLEMENTARY FIGURE S5 | Typical MRM chromatogram of piperine and internal standard in rat plasma by LC-MS/MS. I represents the analyte and II represents the internal standard.(A) Blank plasma in rats (double blank); (B) blank plasma with internal standard (blank); (C) real sample (single administration for 15.0 min); (D) quantitative lower limit sample.
SUPPLEMENTARY FIGURE S6 | Typical MRM chromatogram of ferulic acid and internal standard in rat plasma by LC-MS/MS. I represents the analyte and II represents the internal standard.(A) Blank plasma in rats (double blank); (B) blank plasma with internal standard (blank); (C) real sample (single administration for 15.0 min); (D) quantitative lower limit sample.
Abbreviations
AUC0∼t, area under serum drug concentration–time curve (from 0 h to t h); AUC0-∞, area under serum drug concentration–time curve (from 0 h to ∞ h); BQL, below the quantization limit; Cmax, maximum serum concentration; ESI, electrospray ionization; LC-HRMS, liquid chromatography high resolution mass spectrometer; LC-MS/MS, liquid chromatography-tandem mass spectrometry; LLOQ, lower limit of quantification; MPA, mobile phase A; MPB, mobile phase B; MRM, multi-reaction monitoring; MRT0∼t, mean residence time (from 0 to t h); MRT0-∞, mean residence time (from 0 to ∞ h); M–W method, Mann–Whitney U test; QC, quality control; RYZB, Ruyi Zhenbao tablet; t1/2, elimination half-life; Tmax, time of maximum concentration; TCM, traditional Chinese medicine.
References
Bo, X. Q., and Wu, H. N. (2020). Study on pharmacokinetics and tissue distribution characteristics of salidroside in mice[J]. China J. Chin. Materia Medica 45 (18), 4466–4471.
Chen, Q., Wan, J., Zhang, Y., He, Y., Bao, Y., Yu, L., et al. (2022). Pharmacokinetic-pharmacodynamic modeling analysis for hydroxysafflor yellow A-calycosin in compatibility in normal and cerebral ischemic rats: A comparative study. Biomed. Pharmacother. 150, 112950. doi:10.1016/j.biopha.2022.112950
Chinese Pharmacopoeia, (2012). Guiding principles of biological quantitative analysis methods[S]. Beijing, China: Chinese Pharmacopoeia.
Dakpa, T. (2014). Unique aspect of Tibetan medicine. Acupunct. Electrother. Res. 39 (1), 27–43. doi:10.3727/036012914x13966138791145
EMEA. 3BS11A Pharmacokinetics and metabolic studies in the safety evaluation of new medicinal products in animals.[S]. 1994.
FDA (2001). Guidance for industry: Bioanalytical method validation. Washington, DC: U.S. Department of Health and Human Services[S].
Geisser, P., and Banke-Bochita, J. (2010). Pharmacokinetics, safety and tolerability of intravenous ferric carboxymaltose: A dose-escalation study in volunteers with mild iron-deficiency anaemia. Arzneimittelforschung. 60 (6), 362–372. doi:10.1055/s-0031-1296301
Gongbao, D. Z., Wencheng, D. Z., Zhaxi, L. B., Zeng, S. Y., Qieni, X. M., Song, X. C., et al. (2019). [Study on regularity of Tibetan medicine in treatment of gZav-Grib disease (apoplexy sequelae) based on HIS clinical medical records]. China J. Chin. Materia Medica 44 (15), 3135–3142. doi:10.19540/j.cnki.cjcmm.20190628.203
Guo, D. A., Lu, A., and Liu, L. (2012). Modernization of traditional Chinese medicine. J. Ethnopharmacol. 141 (2), 547–548. doi:10.1016/j.jep.2012.05.001
Guo, Y., Lu, S., Yang, B., Li, G., Ma, W., Guo, Q., et al. (2020). HPLC-MS/MS method for the determination and pharmacokinetic study of six compounds against rheumatoid arthritis in rat plasma after oral administration of the extract of Caulophyllum robustum Maxim. J. Pharm. Biomed. Anal. 181, 112923. doi:10.1016/j.jpba.2019.112923
Janssen, W., Schwarz, T., Butehorn, U., Steinke, W., Sandmann, S., Lang, D., et al. (2022). Pharmacokinetics and mass balance of vericiguat in rats and dogs and distribution in rats[J]. Xenobiotica, 1–10. doi:10.1080/00498254.2022.2082899
Jiang, Y., David, B., Tu, P., and Barbin, Y. (2010). Recent analytical approaches in quality control of traditional Chinese medicines--a review. Anal. Chim. Acta 657 (1), 9–18. doi:10.1016/j.aca.2009.10.024
Kumar, N., and Goel, N. (2019). Phenolic acids: Natural versatile molecules with promising therapeutic applications. Biotechnol. Rep. 24, e00370. doi:10.1016/j.btre.2019.e00370
Li, C. Y., Yin, J. G., Zhang, J., Wang, X. X., Xu, M. J., Liu, F., et al. (2015). Pharmacokinetic profiles of hydroxysafflor yellow A following intravenous administration of its pure preparations in healthy Chinese volunteers. J. Ethnopharmacol. 162, 225–230. doi:10.1016/j.jep.2014.12.068
Liang, Z., Lai, Y., Li, M., Shi, J., Lei, C. I., Hu, H., et al. (2021). Applying regulatory science in traditional Chinese medicines for improving public safety and facilitating innovation in China: A scoping review and regulatory implications. Chin. Med. 16 (1), 23. doi:10.1186/s13020-021-00433-2
Ling, S. S., Pan, R. H., Zhan, L. C., Li, M., Yang, Z-J., Yang, H-D., et al. (2022). Ruyi Zhenbao pills for patients with motor and sensory dysfunction after stroke: A double-blinded, randomized placebo-controlled clinical trial[J]. Chin. J. Integr. Med. doi:10.1007/s11655-022-3577-9
Liu, R., Liu, Q., Li, B., Liu, L., Cheng, D., Cai, X., et al. (2020). Pharmacokinetics, bioavailability, excretion, and metabolic analysis of Schisanlactone E, a bioactive ingredient from Kadsura heteroclita (Roxb) Craib, in rats by UHPLC-MS/MS and UHPLC-Q-Orbitrap HRMS. J. Pharm. Biomed. Anal. 177, 112875. doi:10.1016/j.jpba.2019.112875
Liu, R. Y., Wu, W. J., Tan, R., Xie, B., Zhong, Z. d., He, J. p., et al. (2015). [Intervention effect of Tibetan patent medicine Ruyi Zhenbao pills in acute ischemic stroke in rats]. China J. Chin. Materia Medica 40 (3), 556–559.
Liu, R., Zhao, Z., Dai, S., Che, X., and Liu, W. (2019). Identification and quantification of bioactive compounds in diaphragma juglandis Fructus by UHPLC-Q-orbitrap HRMS and UHPLC-MS/MS. J. Agric. Food Chem. 67 (13), 3811–3825. doi:10.1021/acs.jafc.8b06890
Pang, M., Jeon, S. Y., Choi, M. K., Jeon, J. H., Ji, H. Y., Choi, J. S., et al. (2022). Pharmacokinetics and tissue distribution of enavogliflozin in mice and rats. Pharmaceutics 14 (6), 1210. doi:10.3390/pharmaceutics14061210
Polson, C., Sarkar, P., Incledon, B., Raguvaran, V., and Grant, R. (2003). Optimization of protein precipitation based upon effectiveness of protein removal and ionization effect in liquid chromatography-tandem mass spectrometry. J. Chromatogr. B Anal. Technol. Biomed. Life Sci. 785 (2), 263–275. doi:10.1016/s1570-0232(02)00914-5
Russell, W., and Duthie, G. (2011). Plant secondary metabolites and gut health: The case for phenolic acids. Proc. Nutr. Soc. 70 (3), 389–396. doi:10.1017/S0029665111000152
Schultze-Mosgau, M. H., Matsuki, S., Okumura, K., and Kaneko, M. (2022). Single- and multiple-dose pharmacokinetics and safety of vilaprisan in healthy postmenopausal Japanese women: A randomized clinical trial. Eur. J. Drug Metab. Pharmacokinet. 47 (1), 49–56. doi:10.1007/s13318-021-00727-8
Sun, X. M., Wang, C. Q., Dong, L. L., Zhang, J. Q., and Zhang, X. H. (2020). Research on planting area and industrial development strategy of Tibetan medicine. China J. Chin. Materia Medica 45 (11), 2708–2713. doi:10.19540/j.cnki.cjcmm.20200331.101
Tinikul, R., Chenprakhon, P., Maenpuen, S., and Chaiyen, P. (2018). Biotransformation of plant-derived phenolic acids. Biotechnol. J. 13 (6), e1700632. doi:10.1002/biot.201700632
Wang, T., Duan, S., Wang, H., Sun, S., Han, B., and Fu, F. (2016). Neurological function following cerebral ischemia/reperfusion is improved by the Ruyi Zhenbao pill in a rats. Biomed. Rep. 4 (2), 161–166. doi:10.3892/br.2016.568
Wang, Y. F., Liu, Y. N., Xiong, W., Yan, D. M., Zhu, Y., Gao, X. M., et al. (2014). A UPLC-MS/MS method for in vivo and in vitro pharmacokinetic studies of psoralenoside, isopsoralenoside, psoralen and isopsoralen from Psoralea corylifolia extract. J. Ethnopharmacol. 151 (1), 609–617. doi:10.1016/j.jep.2013.11.013
Xu, B., Qu, C., Zheng, W., Xi, Y., Zhao, X., Li, H., et al. (2018). UHPLC-MS/MS method for simultaneous determination of Radix Polygalae glycolipids and organic acids in rat plasma and application in a pharmacokinetic study. J. Chromatogr. B Anal. Technol. Biomed. Life Sci. 1100-1101, 165–173. doi:10.1016/j.jchromb.2018.09.037
Keywords: Tibetan medicine, Ruyi Zhenbao tablet, single administration, long-term administration, pharmacokinetics
Citation: Hou H, Chen T, Xu Z, Yu Z, Wang C, Liu R, Peng B, Yang W, Li F, Che X, Li B, Wang Y, Song L, Gao Y, Ye Z and Zhang G (2022) Study and exploration of the pharmacokinetics of traditional Tibetan medicine Ruyi Zhenbao tablets after single and long-term administration. Front. Pharmacol. 13:948693. doi: 10.3389/fphar.2022.948693
Received: 20 May 2022; Accepted: 02 August 2022;
Published: 29 September 2022.
Edited by:
Jiangxin Wang, Shenzhen University, ChinaReviewed by:
Chee Loong Teo, Agri Season Sdn Bhd, MalaysiaBorjigidai Almaz, Minzu University of China, China
Liu Chunsheng, School of Chinese Materia Medica, Beijing University of Chinese Medicine, China
Copyright © 2022 Hou, Chen, Xu, Yu, Wang, Liu, Peng, Yang, Li, Che, Li, Wang, Song, Gao, Ye and Zhang. This is an open-access article distributed under the terms of the Creative Commons Attribution License (CC BY). The use, distribution or reproduction in other forums is permitted, provided the original author(s) and the copyright owner(s) are credited and that the original publication in this journal is cited, in accordance with accepted academic practice. No use, distribution or reproduction is permitted which does not comply with these terms.
*Correspondence: Guangping Zhang, Z3B6aGFuZ0BpY21tLmFjLmNu; Zuguang Ye, emd5ZUBpY21tLmFjLmNu