
94% of researchers rate our articles as excellent or good
Learn more about the work of our research integrity team to safeguard the quality of each article we publish.
Find out more
ORIGINAL RESEARCH article
Front. Pharmacol., 15 November 2022
Sec. Renal Pharmacology
Volume 13 - 2022 | https://doi.org/10.3389/fphar.2022.942129
 Qiongbo Huang1†
 Xiaobin Lin2†Yang Wang3†
 Xiujuan Chen4Wei Zheng1Xiaoli Zhong5
 Dewei Shang6
 Min Huang5
 Xia Gao7
 Hui Deng7
 Jiali Li5*Fangling Zeng1*
 Xiaolan Mo1*
Background and Aim: Tacrolimus (TAC) is a first-line immunosuppressant for the treatment of refractory nephrotic syndrome (RNS), but the pharmacokinetics of TAC varies widely among individuals, and there is still no accurate model to predict the pharmacokinetics of TAC in RNS. Therefore, this study aimed to combine population pharmacokinetic (PPK) model and machine learning algorithms to develop a simple and accurate prediction model for TAC.
Methods: 139 children with RNS from August 2013 to December 2018 were included, and blood samples of TAC trough and partial peak concentrations were collected. The blood concentration of TAC was determined by enzyme immunoassay; CYP3A5 was genotyped by polymerase chain reaction-restriction fragment length polymorphism method; MYH9, LAMB2, ACTN4 and other genotypes were determined by MALDI-TOF MS method; PPK model was established by nonlinear mixed-effects method. Based on this, six machine learning algorithms, including eXtreme Gradient Boosting (XGBoost), Random Forest (RF), Extra-Trees, Gradient Boosting Decision Tree (GBDT), Adaptive boosting (AdaBoost) and Lasso, were used to establish the machine learning model of TAC clearance.
Results: A one-compartment model of first-order absorption and elimination adequately described the pharmacokinetics of TAC. Age, co-administration of Wuzhi capsules, CYP3A5 *3/*3 genotype and CTLA4 rs4553808 genotype were significantly affecting the clearance of TAC. Among the six machine learning models, the Lasso algorithm model performed the best (R2 = 0.42).
Conclusion: For the first time, a clearance prediction model of TAC in pediatric patients with RNS was established using PPK combined with machine learning, by which the individual clearance of TAC can be predicted more accurately, and the initial dose of administration can be optimized to achieve the goal of individualized treatment.
Nephrotic syndrome is a disease characterized by massive proteinuria, hypoproteinemia, edema and hyperlipidemia as the main clinical manifestations, and is one of the most common glomerular diseases in children (Noone et al., 2018). Currently, tacrolimus (TAC), a calcineurin inhibitor, is the first-line immunosuppressive agent for the treatment of pediatric refractory nephrotic syndrome (RNS). However, the narrow therapeutic window and large individual differences in pharmacokinetics of TAC require adjustment of individual dosing by therapeutic drug monitoring (TDM), yet TDM reflects changes in blood concentrations with a lag. Therefore, it is important to identify the significant factors affecting the pharmacokinetic parameters of TAC and establish a prediction model before dosing to achieve individualized treatment.
Large individual differences in the pharmacokinetics of TAC are mainly due to clinical characteristics and genetic polymorphisms of patients. Studies have shown that clinical factors such as body weight, age and combined use of Wuzhi capsules significantly influence TAC pharmacokinetic parameters (Hao et al., 2018; Wang D. et al., 2019a; Wang X. et al., 2019b; Chen et al., 2020; Huang et al., 2020). Genetic factors include genetic polymorphisms related to metabolic enzymes, transporter proteins, receptors and other drug targets (Evans and Relling, 1999). Currently, CYP3A5 genotype is the only key factor that has been shown to affect TAC pharmacokinetics (Birdwell et al., 2015). However, CYP3A5 genotype does not fully reflect the individual differences in TAC pharmacokinetics. Other genetic factors include the renal podocyte-associated genes ACTN4 and MYH9 (Pecci et al., 2018; Feng et al., 2020), the pharmacodynamic pathway protein gene MAP3K, the CTLA4 gene associated with the immune response, and inflammatory cytokine genes such as IL2RA may also influence the pharmacokinetics of TAC (Agrawal et al., 2020). In addition, most established PPK models in children with nephrotic syndrome incorporate only CYP3A5 as a genetic variable, with limited studies of other relevant genes. Therefore, it is necessary to investigate the clinical characteristics and the comprehensive genetic variables when we build models to predict TAC pharmacokinetics.
Currently, methods for predicting pharmacokinetics in different individuals mainly include traditional multiple linear regression methods, population pharmacokinetic (PPK) methods, and machine learning methods (Agrawal et al., 2020; Li et al., 2021; Woillard et al., 2021). Multiple linear regression methods are simple to operate, but they cannot distinguish inter-and intra-individual variability. In contrast, PPK can fully account for inter-and intra-individual variation, but requires collecting multiple blood points for perfect model performance (Bon et al., 2018; Campagne et al., 2019). Unlike traditional statistical methods and PPK methods, machine learning methods are capable of handling complex, multidimensional data. Based on the characteristics of these various methods, Tang et al. developed a prediction model for six renal clearance drugs by combining PPK with machine learning methods (Tang et al., 2021), validating the good performance of novel approach of combining PPK with machine learning. Nevertheless, it is worth mentioning that there is no model for predicting TAC pharmacokinetics using PPK combined with machine learning.
Therefore, the purpose of this study was first to investigate the effects of clinical characteristics and genetic polymorphisms on the pharmacokinetics of TAC in pediatric patients with nephrotic syndrome, and to develop a PPK model for this population. Further, a simpler and more accurate machine learning model for predicting the clearance of TAC was developed based on the above PPK model, to provide a powerful tool for individualized therapy of TAC in pediatric patients with nephrotic syndrome.
Patients diagnosed with nephrotic syndrome and taking oral TAC ((Prograg™, Astellas, Killorglin, Ireland) at Guangzhou Women and Children’s Medical Center between August 2013 and December 2018 were included in this study. Inclusion criteria: (1) All children were diagnosed in accordance with the 2012 KDIGO guidelines for the diagnosis of nephrotic syndrome (Lombel et al., 2013). (2) Steroid resistance or dependence. (3) Age of onset was less than 18 years. (4) Regularly taking TAC (Prograg™, Astellas, Killorglin, Ireland) and steroid (prednisone, prednisolone) as prescribed; Exclusion criteria: (1) Those who cannot take the medication regularly and follow up. (2) Combined use of other immunosuppressive agents (e.g. cyclophosphamide). (3) Combined use of drugs affecting the blood concentration of TAC (e.g. verapamil, ketoconazole, itraconazole). (4) Those who are allergic to macrolides. (5) Combination of liver and renal impairment and other disorders.
The starting dose of TAC in the dosing regimen was 500–3000 μg, administered orally every 12 h, and the dose was adjusted according to the whole blood trough concentration (target concentration 5–10 μg L−1). 2 ml of peripheral venous blood was collected in ethylenediaminetetraacetic acid (EDTA) anticoagulation tubes from children half an hour before dosing in the early morning, and blood samples at peak concentration were also collected from some children after dosing (0.5∼3 h). Clinical data (gender, age, weight, daily dose of TAC, records of co-administered drugs, laboratory test results, etc) were collected from the children. The whole blood concentration of TAC was determined by enzyme multiplication immunoassay technique (Viva-E, Siemens, Germany).
DNA was extracted using the Genomic Tiangen Blood Deoxyribonucleic Acid Extraction Kit (DP348, Beijing, China). Polymerase chain reaction-restriction fragment length polymorphism method was used to determine CYP3A5 rs776746, and MALDI-TOF MS method (Agena Bioscience MassARRAY® system [Agena Bioscience, San Diego, CA, United States)] was used to detect other SNPs. The Hardy-Weinberg equilibrium test was performed using the chi-square test.
SPSS software (version 25.0) was used for univariate analysis; Phoenix NLME pharmacokinetic software (Version 8.1, Pharsight Corporation, United States) was used for PPK modelling; Scikit-learn 0.19.1 plug-in package in Python 3.6.5 was used for machine learning modelling.
Pharmacokinetic data of TAC were analyzed for PPK using a nonlinear mixed effects model (NLME) approach. First-order conditional estimation-extended least squares (FOCE-ELS) was applied to all model runs.
A one-compartment model of first-order absorption and elimination was used to fit the data. The absorption rate constant (Ka) was fixed at 4.48 h−1 based on reports in the literature and suitability for pediatric populations (Wang D. et al., 2019a; Chen et al., 2020; Huang et al., 2020; Li et al., 2021). Inter-individual variation was described using an exponential model.
(where Pi is the value of the pharmacokinetic parameter for the ith subject, TV(P) is the population typical value of this parameter, and ηi is the interindividual random variation obeying a normal distribution with mean 0 and variance
The following model was used to assess the residual variance.
(where Yobs is the measured concentration, Ypred is the model prediction, and ε is the residual variance obeying a normal distribution with mean 0 and variance σ2)
The optimal residual variance model was determined using -2 times the logarithm of the maximum likelihood (−2 log likelihood, −2LL), the standard value of the Akaike information criterion (AIC), and the goodness-of-fit plot (GOF)).
The variables screened included: gender, age, weight, erythrocyte pressure (HCT), serum albumin (ALB), etc, prior to administration, and the combination of Wuzhi capluses (combWZ) was considered in the combined dosing. Gene-related factors were included in CYP3A5 rs776746, MYH9 rs2239781, LAMB2 rs62119873, ACTN4 rs62121818, ACTN4 rs3745859, MAP3K11 rs7946115, ACTN4 rs56113315, MYH9 rs4821478, INF2 rs1128880, IL2RA rs12722489, NPHS2 rs2274622, CTLA4 rs4553808, etc. These SNPs were all variables that were correlated with TAC concentrations after a prior univariate analysis (p < 0.1) (Mo et al., 2020).
In this study, the stepwise regression method was used to screen covariates, and the selection of covariates was determined by the objective function value (OFV). In the forward selection process, covariates with an OFV decrease >3.84 (p < 0.05) were included in the model. In the backward elimination process, covariates with an OFV increase >6.63 (p < 0.01) were retained in the model. The principle follows the extended least square (ELS) method, where OFV is the -2LL value in the fitting process, and the smallest value of -2LL is used as the overall measure of the fitting effect. The expressions for the continuous and categorical covariate models are as follows, respectively.
(COV: value of covariate; θ: fixed parameter coefficient of covariate; COVmedian: median of covariate)
Model evaluation and validation (1) Plot the goodness-of-fit (GOF) of the base model and the final model for visual evaluation, including: ① population predicted value-detected value (PRED-DV), ② individual predicted value-measured value (IPRED-DV), ③ conditional weight residual-population predicted value (CWRES-PRED), and ④ conditional weight residual-time (CWRES-TIME) of the scatter plot. (2) The final model is validated using visual predictive check (VPC). (3) Bootstrap method based on data resampling technique is used for internal validation of the final model. (4) Normalized prediction distribution error (NPDE) is used to evaluate the predictive performance of the final model based on a Monte Carlo simulation with the R software (Version 4.1.0,http://www.r-project.org). NPDE results are summarized graphically using: ① quantile-quantile plot of the NPDE, ② a histogram of the NPDE, ③ scatterplot of NPDE vs. time, and ④ scatterplot of NPDE vs. PRED.
Machine learning modelling was performed on the variables screened by PPK. The categorical variables were first discretized.
The data set is randomly divided into a test set and a training set by 3:7. Based on the five-fold cross-validation and hyperparameter search, the training set is used for the model generation: the training set is randomly divided into five equal parts, and the leave-one method is used. Each time, one piece of data is left for model verification, and the remaining four pieces of data are searched for hyperparameters to build a model. This is repeated 5 times, and the best model hyperparameters combination is finally determined. Furthermore, the five data sets are used to build a model based on a combination of certain hyperparameters, and the test set is used to evaluate the model. In this step, the hyperparameters will be fine-tuned. Then, re-divide the data set randomly into the test set and the training set by 3:7, repeat the above modelling process, and loop 5 times in this way. Finally, each algorithm will get 5 models, and the average of the performance of the 5 models is taken as the final model performance result.
A total of 139 patients with 432 blood concentration data were included in this study, of which 35 were peak concentrations and the rest were trough concentrations. The curve of concentration varying with time is shown in Figure 1. All participants met the inclusion and exclusion criteria and signed an informed consent form. 139 patients had a median age and weight of 5.3 (range 1.1–15.6) years; 19.7 (range 9.5–88.0) kg, respectively, and a median blood concentration of 6.48 (range 2.0–41.2) μg/L. The final genotypes included in the PPK analysis were 12 SNPs, genotyping of 12 SNPs by genetic testing. All SNPs met Hardy-Weinberg equilibrium test. The clinical characteristics and genotypes of the patients are shown in Tables 1, 2, respectively.
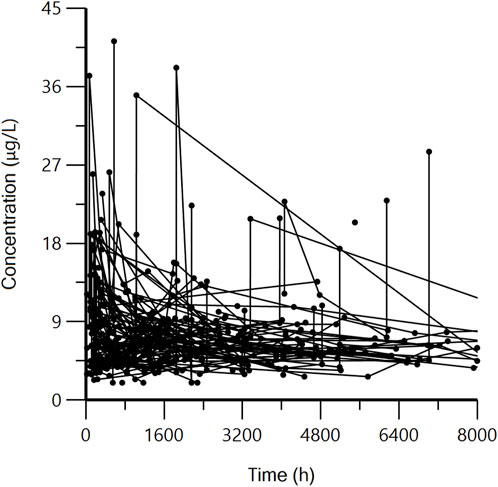
FIGURE 1. Tacrolimus concentration vs. time.
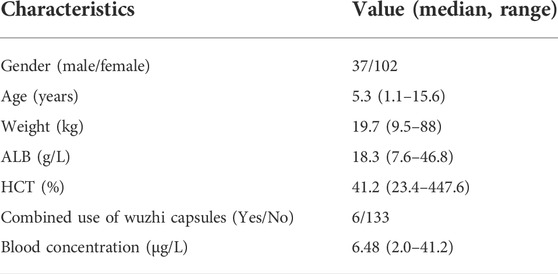
TABLE 1. Demographic and clinical characteristics of patients.
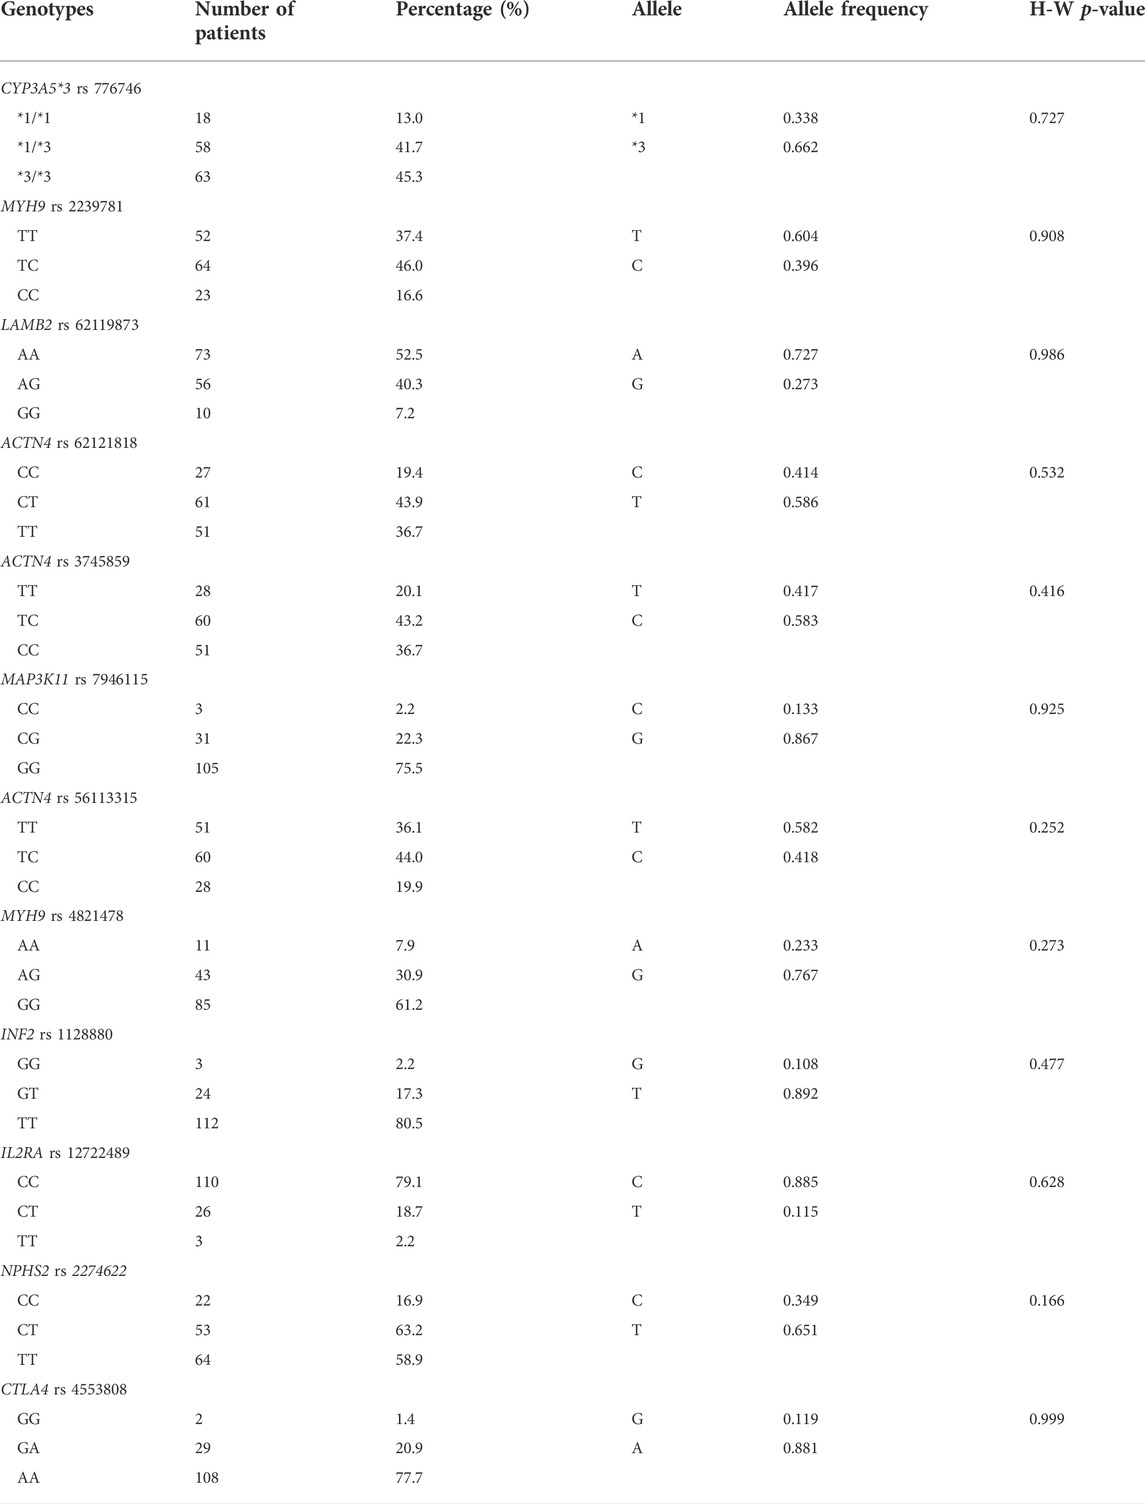
TABLE 2. Genotypes and allele frequencies of patients.
A one-compartment model of first-order absorption and elimination was used to characterize the pharmacokinetics of TAC in pediatric patients with nephrotic syndrome. Exponential and proportional models were chosen to describe the interindividual variability and residual variability, respectively. The base model was
After a stepwise regression approach, covariates retained in the final model that significantly affected clearance included: age, co-administration of Wuzhi capsules, CYP3A5 *3/*3 genotype, and CTLA4 rs4553808 genotype. No covariates were screened that significantly influenced the apparent volume of distribution. The final model expression equations are shown in Eqs. 1, 2. The pharmacokinetic parameters of the final model were estimated in Table 3. The typical values of the population for CL and V were 10.54 L·h−1and 192.03 L, respectively.
(CTLA4 GA = 1 and CTLA4 AA = 1 when genotypes are CTLA4 GA, CTLA4 AA, respectively, 0 otherwise; CYP3A5 *3/*3 = 1 when genotype is CYP3A5 *3/*3, 0 otherwise; combWZ = 1 when combined with Wuzhi capsules, 0 otherwise.)
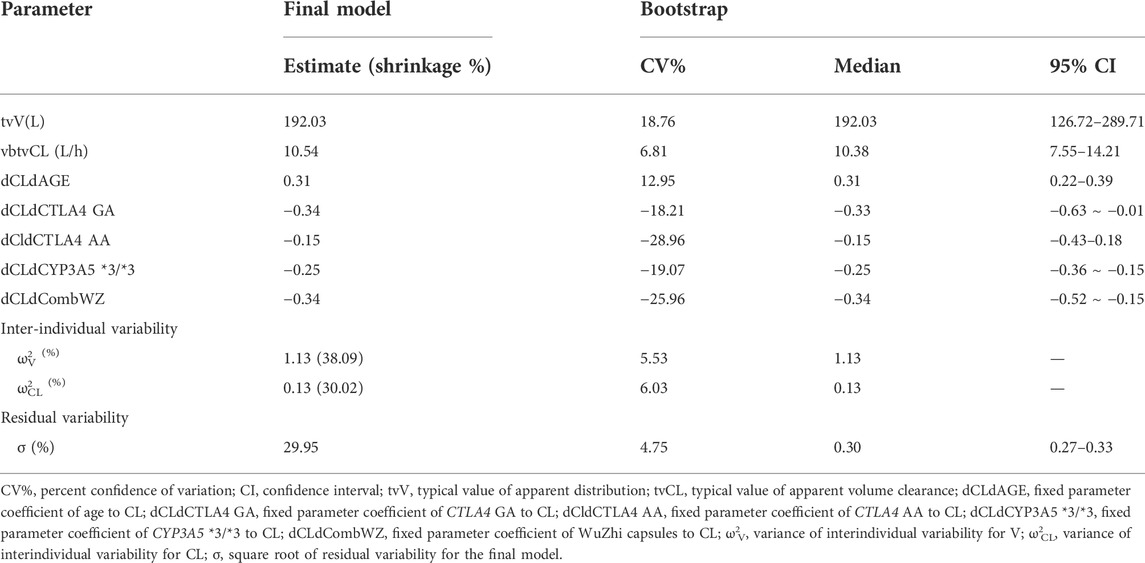
TABLE 3. Parameter estimation results and bootstrap results of the final population pharmacokinetic model.
The GOF plots of the final model are shown in Figure 2. The IPRED-DV scatterplot and IPRED-DV scatterplot show that the data in the final model are more evenly concentrated on both sides of the reference line, which proves that the prediction errors are not significantly biased. The CWRES-PRED scatterplot and CWRES-TIME scatterplot show that the residuals are more symmetrically distributed, and most of them are in the (y = −2 ∼ +2) range.
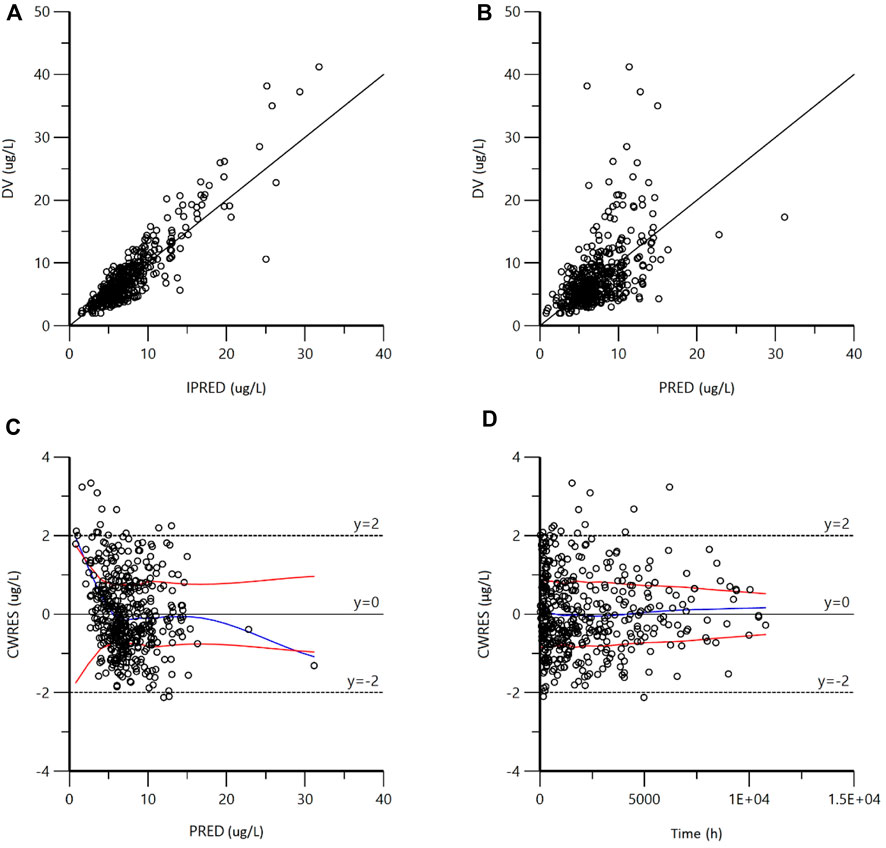
FIGURE 2. Goodness-of-fit plots for the final model. (A) Observed concentrations (DV) vs. individual predictions (IPRED); (B) DV vs. population predictions (PRED); (C) conditional weighted residuals (CWRES) vs. PRED; (D) CWRES vs. Time). As shown in figures (A,B), the scatter points generated by the final model are evenly distributed on both sides of the reference line; as shown in figures C and D, the residual scatter points are symmetrically distributed. Most of them are in the range of (−2 ∼ + 2), which proves that there is no obvious bias in the prediction error.
The VPC results showed that the 95% confidence interval based on the simulation covered the 50% and 95% quartiles corresponding to the observed values. The observed values in the 5% quartile partially did not fall within the prediction interval, but the overall was closer to the prediction interval (<2.0 μg/L). This indicates that the final model has good predictive performance. See Figure 3.
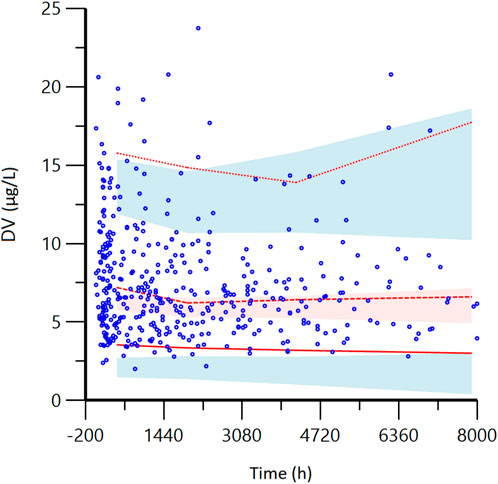
FIGURE 3. Visual predictive check (VPC) from the final model. DV: observed concentrations; The red lines from bottom to top represent the 5th, 50th, and 95th percentiles of the observed concentrations; Blue shaded regions are 95% confidence intervals for predicted 5th and 95th percentiles. Red shaded regions are 95% confidence intervals for the predicted 50th percentile. As shown in the figure, most of the red lines representing the measured concentration positioned are within the predicted shadow range, indicating that the model has good prediction performance.
The NPDE distribution and histogram are presented in Figure 4. The assumption of a normal distribution for the differences between predictions and observations was acceptable. The quantile-quantile plots and histogram also confirmed the normality of the NPDE, which indicates that the final model has strong predictive performance.
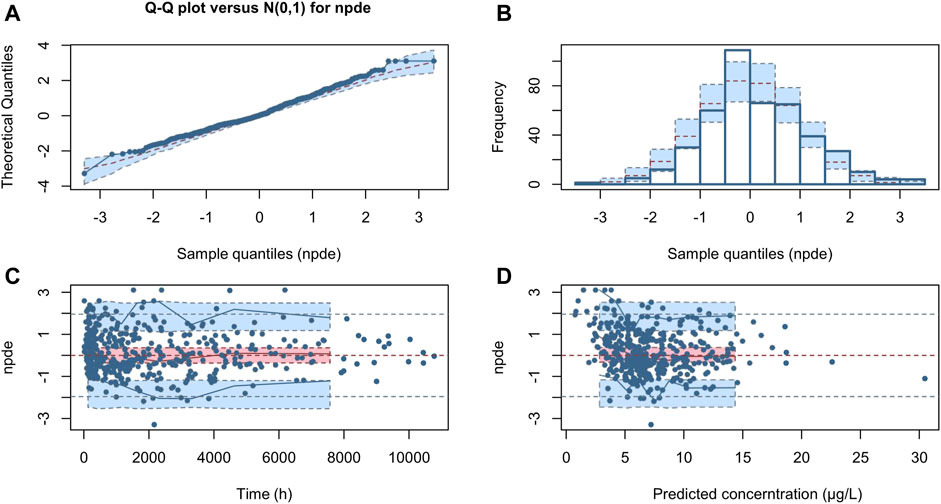
FIGURE 4. Normalized prediction distribution error (NPDE) for the final model. Quantile-quantile plots of NPDE vs. the expected standard normal distribution (A). Histogram of NPDE values with the standard normal distribution overlayed (B). Scatter plot of the time vs. NPDE (C). Scatterplot of predictions vs. NPDE (D).
The comparison between the model parameters obtained from 1000 bootstrap validations and the final model parameters is shown in Table 3. The results show that the median parameter estimates obtained from the bootstrap process are consistent with the final model, and the final model parameters all fall within the 95% confidence interval of the bootstrap parameters, indicating that the final model has good robustness and accuracy.
Based on the PPK model, we further used six machine learning algorithms, XGBoost, RF, Extra-Trees, GBDT, AdaBoost, and Lasso, to build a machine learning model on the clearance of TAC. Among the six machine learning models, the Lasso algorithm model has the largest R-squared (0.42), which is greater than the second-ranked Extra-Trees algorithm model (0.39). Other metrics include MSE, MAE, MedAE and RE, the Lasso algorithm model has the smallest value among all six models, indicating that the Lasso machine learning model is the optimal model. See Table 4. In clinical practice, we can input patients’ variables into the best model to predict the patient’s clearance rate, and then adjust the dose administered according to the target blood concentration.
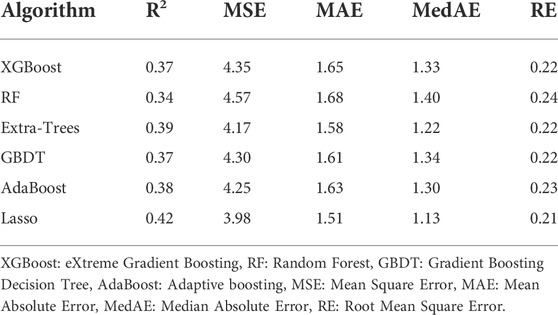
TABLE 4. Algorithm performance results (test set).
In this study, a PPK model of TAC in a pediatric population with refractory nephrotic syndrome (RNS) was developed using a nonlinear mixed-effects model. Similar to most studies (Hao et al., 2018; Wang D. et al., 2019a; Wang X. et al., 2019b; Chen et al., 2020), the classical one-compartment model of first-order absorption and elimination adequately described the pharmacokinetic process of TAC, and the final model fit was good (Figures 2–4). The population typical value of the final model for estimating TAC clearance was 10.54 L h−1. Age, combined use of Wuzhi capsules, CYP3A5*3 rs776746 and CTLA4 rs4553808 significantly affect TAC clearance. Based on this, six machine learning algorithms, XGBoost, RF, Extra-Trees, GBDT, AdaBoost, and Lasso, were used to build a machine learning model on TAC clearance, where the Lasso algorithm had the best model performance with the largest R2 value (0.42).
Unlike previous studies, we used PPK combined with machine learning for the first time to predict the individual clearance of TAC. Machine learning is an emerging and more advanced algorithm that is able to process complex, multidimensional, interacting variables for predictions by classification or regression. For example, machine learning has been used to screen genes affecting TAC pharmacokinetics (Gim et al., 2020) and to predict stable doses of TAC in renal transplant patients (Tang et al., 2017). However, machine learning has drawbacks, such as the inability to measure and distinguish intra- and inter-individual variability. The advantage of PPK to fully account for inter-and intra-individual variability and to quantify the effect of these variations on pharmacokinetic parameters precisely compensates for the shortcomings of machine learning (Bon et al., 2018; Campagne et al., 2019). Therefore, PPK combined with machine learning to accurately predict pharmacokinetics may be a better approach (van Gelder and Vinks, 2021; Yang et al., 2022). Tang et al. (2021) developed an individual clearance prediction model for neonatal renal clearance of drugs and successfully validated that PPK combined with machine learning can improve the prediction accuracy of drug clearance. In this study, we first obtained variables significantly associated with TAC clearance (age, combined use of Wuzhi capsules, CYP3A5*3 rs776746 and CTLA4 rs4553808) by PPK approach, and then further developed a machine learning model for TAC clearance, and the final model had a good predictive performance with an R2 value of 0.42, similar to our previous tacrolimus dose/weight-adjusted trough concentration prediction model (R2 = 0.44), but superior to the groups of whether CYP3A5 was expressed (Mo et al., 2022); and the Lasso algorithm outperformed other machine learning algorithms such as XGBoost, RF, and Extra-Trees.
The final PPK model did not screen out covariates affecting the apparent volume of distribution of TAC, which may be related to the fact that we included mostly trough concentration data then not enough for the analysis of the distribution. The covariates associated with TAC clearance in the final model included: age, co-administration of wuzhi capsules, CYP3A5 genotype, and CTLA4 genotype (Table 3). Among them, age, wuzhi capsules, and CYP3A5 genotype have been reported (Wang D. et al., 2019a; Chen et al., 2020). The results of this study showed that age affects the clearance of TAC, which may be related to the growth and development of children. Emoto et al. (2019) suggested that the age-dependent changes in TAC trough concentrations in pediatric patients were mainly attributable to the individual developmental characteristics of CYP3A. In addition, the individual clearance of TAC can be decreased by the combination of Wuzhi capsules. Studies have shown that the main active ingredients in Wuzhi capsules (pentosidine and pentosanol) can significantly increase TAC concentrations by inhibiting CYP3A and P-glycoprotein (P-gp)-mediated metabolism and transport (Qin et al., 2010; Wei et al., 2013; Qin et al., 2014; Cheng et al., 2021). In addition to age and combined use of Wuzhi capsules, CYP3A5 genotype is an important influencing factor on the clearance of TAC. The Clinical Pharmacogenetics Implementation Consortium (CPIC) guideline recommendations for TAC use in transplant patients suggest that CYP3A5 *3*3 carriers have a lower clearance, which means CYP3A5 *3*3 carriers require a lower dose (Birdwell et al., 2015). This is also consistent with our findings that there is a negative correlation between CYP3A5 *3*3 and clearance.
Among the numerous genetic variables included, in addition to the CYP3A5 gene, the CTLA4 gene also has a significant effect. CTLA4 (cytotoxic T lymphocyte-associated protein 4) is a receptor on the surface of T cells which is an inhibitory stimulator that inhibits T cell activation. Our results showed that the CTLA4 rs4553808 significantly affected the clearance of TAC, The GA and AA genotypes showed a negative correlation with the clearance of TAC (Table 3). Similar to our findings, (Liu et al., 2017) found that the CTLA4 rs4553808 genotype significantly affected the postoperative TAC concentration in Chinese kidney transplant patients. As is well known, CTLA4 is an inhibitory co-stimulatory factor in the CD28 family, competing with the T cell co-stimulatory receptor CD28 for the ligand B7-1 (CD80)/B7-2 (CD86) on the surface of antigen-presenting cells (Thompson and Allison, 1997; Crespo et al., 2013). This inhibits the activation of T cells and suppresses the secretion of the cytokine interleukin 2 (IL2). Similarly, the complex formed by TAC and FK-binding protein 12 (FKBP12) can block the production of IL2 (Li and Li, 2015; Martial et al., 2021). Therefore, CTLA4 may act as an upstream regulator of IL2 secretion and indirectly influence the pharmacokinetic process of TAC by affecting IL2 production. In addition, some in vitro experiments have shown that increased inflammatory protein production by hepatocytes during the inflammatory response reduces the ability of hepatocytes to metabolize drugs through the cytochrome P450 system (Abdel-Razzak et al., 1993; Elkahwaji et al., 1999; Ferri et al., 2016). IL2, one of the important inflammatory cytokines, decreased the activity of CYP3A4 by 39% (Elkahwaji et al., 1999). Therefore, polymorphisms in the CTLA4 gene may affect the individual clearance of TAC by influencing the concentration of IL2 and thus the activity of TAC CYP3A4 metabolizing enzymes. In addition to this, there are also relevant studies suggesting that the pathogenesis of nephrotic syndrome may be related to CTLA4-mediated T-cell dysfunction (Reiser et al., 2004; Yu et al., 2013). Therefore, the effect of CTLA4 on TAC in the nephrotic syndrome population deserves to be explored in depth.
Our study also has some limitations. First, most of the blood samples collected were trough concentration points, and only a few had other points such as peak concentration points. This causes the performance of the model still needs to be improved, and also causes the present model less predictive at low concentrations. Second, the covariates we included can still be expanded, we currently included only clinical characteristics of patients and genomic data. In the future, more bioinformatics data, such as metabolome, proteome, gut microbiome and other multi-omics data, need to be incorporated by using machine learning to improve the prediction performance of TAC pharmacokinetics.
In summary, we firstly used PPK combined with machine learning to develop a precise model of TAC clearance in pediatric patients with nephrotic syndrome from the perspective of clinical characteristics and genetic polymorphisms. Age, combined use of Wuzhi capsules, CYP3A5*3 rs776746 covariates and CTLA4 rs4553808 were found to significantly affect the pharmacokinetics of TAC. For the first time, CTLA4 rs4553808 gene polymorphism was found to affect the clearance of TAC in the nephrotic syndrome population. The model can predict the individual clearance of TAC more accurately. It provides a reference for the clinical pharmacist or clinician to optimize the initial dose administered, ensuring the effectiveness and safety of drug treatment for each patient.
The original contributions presented in the study are included in the article, further inquiries can be directed to the corresponding authors.
This study was approved by our ethics committee (No. 201509) and also registered with NCT02602873. Written informed consent to participate in this study was provided by the participants’ legal guardian/next of kin.
XM, FZ, and JL conceived and designed the study; QH, XL, YW, XC, and DS performed the analyses of population pharmacokinetics and machine learning; WZ, XZ, XG, and HD collected and collated the data; QH, MH, XM, FZ, and JL wrote and modified the manuscript.
This research was supported by grants from Guangdong Pharmaceutical Association Program (grant no. 2021A35), Traditional Chinese Medicine Bureau of Guangdong Province (No. 20201302), Guangzhou Science and Technology Bureau program (No. 202102010237), Natural Science Foundation of Guangdong Province (No. 2021A1515011308), and Hospital Pharmacy Youth Talent Project of Hospital Pharmacy Special Committee of Chinese Pharmaceutical Society (No. CPA-Z05-ZC-2021-003).
We thank the physicians and nurses from the division of nephrology for their cooperation.
The authors declare that the research was conducted in the absence of any commercial or financial relationships that could be construed as a potential conflict of interest.
All claims expressed in this article are solely those of the authors and do not necessarily represent those of their affiliated organizations, or those of the publisher, the editors and the reviewers. Any product that may be evaluated in this article, or claim that may be made by its manufacturer, is not guaranteed or endorsed by the publisher.
Abdel-Razzak, Z., Loyer, P., Fautrel, A., Gautier, J. C., Corcos, L., Turlin, B., et al. (1993). Cytokines down-regulate expression of major cytochrome P-450 enzymes in adult human hepatocytes in primary culture. Mol. Pharmacol. 44 (4), 707–715.
Agrawal, S., Merchant, M. L., Kino, J., Li, M., Wilkey, D. W., Gaweda, A. E., et al. (2020). Predicting and defining steroid resistance in pediatric nephrotic syndrome using plasma proteomics. Kidney Int. Rep. 5 (1), 66–80. doi:10.1016/j.ekir.2019.09.009
Birdwell, K. A., Decker, B., Barbarino, J. M., Peterson, J. F., Stein, C. M., Sadee, W., et al. (2015). Clinical Pharmacogenetics implementation Consortium (CPIC) guidelines for CYP3A5 genotype and tacrolimus dosing. Clin. Pharmacol. Ther. 98 (1), 19–24. doi:10.1002/cpt.113
Bon, C., Toutain, P. L., Concordet, D., Gehring, R., Martin-Jimenez, T., Smith, J., et al. (2018). Mathematical modeling and simulation in animal health. Part III: Using nonlinear mixed-effects to characterize and quantify variability in drug pharmacokinetics. J. Vet. Pharmacol. Ther. 41 (2), 171–183. doi:10.1111/jvp.12473
Campagne, O., Mager, D. E., and Tornatore, K. M. (2019). Population pharmacokinetics of tacrolimus in transplant recipients: What did we learn about sources of interindividual variabilities? J. Clin. Pharmacol. 59 (3), 309–325. doi:10.1002/jcph.1325
Chen, X., Wang, D. D., Xu, H., and Li, Z. P. (2020). Optimization of initial dosing scheme of tacrolimus in pediatric refractory nephrotic syndrome patients based on CYP3A5 genotype and coadministration with wuzhi-capsule. Xenobiotica. 50 (5), 606–613. doi:10.1080/00498254.2019.1669844
Cheng, F., Li, Q., Wang, J., Zeng, F., and Zhang, Y. (2021). Effects and safety evaluation of Wuzhi Capsules combined with tacrolimus for the treatment of kidney transplantation recipients. J. Clin. Pharm. Ther. 46, 1636–1649. doi:10.1111/jcpt.13493
Crespo, J., Sun, H., Welling, T. H., Tian, Z., and Zou, W. (2013). T cell anergy, exhaustion, senescence, and stemness in the tumor microenvironment. Curr. Opin. Immunol. 25 (2), 214–221. doi:10.1016/j.coi.2012.12.003
Elkahwaji, J., Robin, M. A., Berson, A., Tinel, M., Lettéron, P., Labbe, G., et al. (1999). Decrease in hepatic cytochrome P450 after interleukin-2 immunotherapy. Biochem. Pharmacol. 57 (8), 951–954. doi:10.1016/s0006-2952(98)00372-4
Emoto, C., Johnson, T. N., Hahn, D., Christians, U., Alloway, R. R., Vinks, A. A., et al. (2019). A theoretical physiologically-based pharmacokinetic approach to ascertain covariates explaining the large interpatient variability in tacrolimus disposition. CPT. Pharmacometrics Syst. Pharmacol. 8 (5), 273–284. doi:10.1002/psp4.12392
Evans, W. E., and Relling, M. V. (1999). Pharmacogenomics: Translating functional genomics into rational therapeutics. Science 286 (5439), 487–491. doi:10.1126/science.286.5439.487
Feng, D., Kumar, M., Muntel, J., Gurley, S. B., Birrane, G., Stillman, I. E., et al. (2020). Phosphorylation of ACTN4 leads to podocyte vulnerability and proteinuric glomerulosclerosis. J. Am. Soc. Nephrol. 31 (7), 1479–1495. doi:10.1681/asn.2019101032
Ferri, N., Bellosta, S., Baldessin, L., Boccia, D., Racagni, G., and Corsini, A. (2016). Pharmacokinetics interactions of monoclonal antibodies. Pharmacol. Res. 111, 592–599. doi:10.1016/j.phrs.2016.07.015
Gim, J. A., Kwon, Y., Lee, H. A., Lee, K. R., Kim, S., Choi, Y., et al. (2020). A machine learning-based identification of genes affecting the pharmacokinetics of tacrolimus using the DMET(TM) plus platform. Int. J. Mol. Sci. 21 (7), E2517. doi:10.3390/ijms21072517
Hao, G. X., Huang, X., Zhang, D. F., Zheng, Y., Shi, H. Y., Li, Y., et al. (2018). Population pharmacokinetics of tacrolimus in children with nephrotic syndrome. Br. J. Clin. Pharmacol. 84 (8), 1748–1756. doi:10.1111/bcp.13605
Huang, L., Liu, Y., Jiao, Z., Wang, J., Fang, L., and Mao, J. (2020). Population pharmacokinetic study of tacrolimus in pediatric patients with primary nephrotic syndrome: A comparison of linear and nonlinear michaelis-menten pharmacokinetic model. Eur. J. Pharm. Sci. 143, 105199. doi:10.1016/j.ejps.2019.105199
Li, C. J., and Li, L. (2015). Tacrolimus in preventing transplant rejection in Chinese patients--optimizing use. Drug Des. devel. Ther. 9, 473–485. doi:10.2147/dddt.S41349
Li, L., Zhu, M., Li, D. Y., Guo, H. L., Hu, Y. H., Xu, Z. Y., et al. (2021). Dose tailoring of tacrolimus based on a non-linear pharmacokinetic model in children with refractory nephrotic syndrome. Int. Immunopharmacol. 98, 107827. doi:10.1016/j.intimp.2021.107827
Liu, M. Z., He, H. Y., Zhang, Y. L., Hu, Y. F., He, F. Z., Luo, J. Q., et al. (2017). IL-3 and CTLA4 gene polymorphisms may influence the tacrolimus dose requirement in Chinese kidney transplant recipients. Acta Pharmacol. Sin. 38 (3), 415–423. doi:10.1038/aps.2016.153
Lombel, R. M., Gipson, D. S., and Hodson, E. M. (2013). Treatment of steroid-sensitive nephrotic syndrome: New guidelines from KDIGO. Pediatr. Nephrol. 28 (3), 415–426. doi:10.1007/s00467-012-2310-x
Martial, L. C., Biewenga, M., Ruijter, B. N., Keizer, R., Swen, J. J., van Hoek, B., et al. (2021). Population pharmacokinetics and genetics of oral meltdose tacrolimus (Envarsus®) in stable adult liver transplant recipients. Br. J. Clin. Pharmacol. 87, 4262–4272. doi:10.1111/bcp.14842
Mo, X., Chen, X., Wang, X., Zhong, X., Liang, H., Wei, Y., et al. (2022). Prediction of tacrolimus dose/weight-adjusted trough concentration in pediatric refractory nephrotic syndrome: A machine learning approach. Pharmgenomics. Pers. Med. 15, 143–155. doi:10.2147/pgpm.S339318
Mo, X., Li, J., Liu, Y., Liao, X., Tan, M., Chen, Y., et al. (2020). Kidney podocyte-associated gene polymorphisms affect tacrolimus concentration in pediatric patients with refractory nephrotic syndrome. Pharmacogenomics J. 20 (4), 543–552. doi:10.1038/s41397-019-0141-x
Noone, D. G., Iijima, K., and Parekh, R. (2018). Idiopathic nephrotic syndrome in children. Lancet 392 (10141), 61–74. doi:10.1016/s0140-6736(18)30536-1
Pecci, A., Ma, X., Savoia, A., and Adelstein, R. S. (2018). MYH9: Structure, functions and role of non-muscle myosin IIA in human disease. Gene 664, 152–167. doi:10.1016/j.gene.2018.04.048
Qin, X. L., Bi, H. C., Wang, X. D., Li, J. L., Wang, Y., Xue, X. P., et al. (2010). Mechanistic understanding of the different effects of Wuzhi Tablet (Schisandra sphenanthera extract) on the absorption and first-pass intestinal and hepatic metabolism of Tacrolimus (FK506). Int. J. Pharm. 389 (1-2), 114–121. doi:10.1016/j.ijpharm.2010.01.025
Qin, X. L., Chen, X., Wang, Y., Xue, X. P., Wang, Y., Li, J. L., et al. (2014). In vivo to in vitro effects of six bioactive lignans of Wuzhi tablet (Schisandra sphenanthera extract) on the CYP3A/P-glycoprotein-mediated absorption and metabolism of tacrolimus. Drug Metab. Dispos. 42 (1), 193–199. doi:10.1124/dmd.113.053892
Reiser, J., von Gersdorff, G., Loos, M., Oh, J., Asanuma, K., Giardino, L., et al. (2004). Induction of B7-1 in podocytes is associated with nephrotic syndrome. J. Clin. Invest. 113 (10), 1390–1397. doi:10.1172/jci20402
Tang, B. H., Guan, Z., Allegaert, K., Wu, Y. E., Manolis, E., Leroux, S., et al. (2021). Drug clearance in neonates: A combination of population pharmacokinetic modelling and machine learning approaches to improve individual prediction. Clin. Pharmacokinet. 60, 1435–1448. doi:10.1007/s40262-021-01033-x
Tang, J., Liu, R., Zhang, Y. L., Liu, M. Z., Hu, Y. F., Shao, M. J., et al. (2017). Application of machine-learning models to predict tacrolimus stable dose in renal transplant recipients. Sci. Rep. 7, 42192. doi:10.1038/srep42192
Thompson, C. B., and Allison, J. P. (1997). The emerging role of CTLA-4 as an immune attenuator. Immunity 7 (4), 445–450. doi:10.1016/s1074-7613(00)80366-0
van Gelder, T., and Vinks, A. A. (2021). Machine learning as a novel method to support therapeutic drug management and precision dosing. Clin. Pharmacol. Ther. 110 (2), 273–276. doi:10.1002/cpt.2326
Wang, D., Lu, J., Li, Q., and Li, Z. (2019a). Population pharmacokinetics of tacrolimus in pediatric refractory nephrotic syndrome and a summary of other pediatric disease models. Exp. Ther. Med. 17 (5), 4023–4031. doi:10.3892/etm.2019.7446
Wang, X., Han, Y., Chen, C., Ma, L., Xiao, H., Zhou, Y., et al. (2019b). Population pharmacokinetics and dosage optimization of tacrolimus in pediatric patients with nephrotic syndrome. Int. J. Clin. Pharmacol. Ther. 57 (3), 125–134. doi:10.5414/cp203355
Wei, H., Tao, X., Di, P., Yang, Y., Li, J., Qian, X., et al. (2013). Effects of traditional Chinese medicine Wuzhi capsule on pharmacokinetics of tacrolimus in rats. Drug Metab. Dispos. 41 (7), 1398–1403. doi:10.1124/dmd.112.050302
Woillard, J. B., Labriffe, M., Prémaud, A., and Marquet, P. (2021). Estimation of drug exposure by machine learning based on simulations from published pharmacokinetic models: The example of tacrolimus. Pharmacol. Res. 167, 105578. doi:10.1016/j.phrs.2021.105578
Yang, L., Yang, N., Yi, B., Pei, Q., and Huang, Z. (2022). Population pharmacokinetic evaluation with external validation of tacrolimus in Chinese primary nephrotic syndrome patients. Pharm. Res. 39 (8), 1907–1920. doi:10.1007/s11095-022-03273-3
Keywords: tacrolimus, pediatric nephrotic syndrome, population pharmacokinetic, machine learning, gene polymorphisms
Citation: Huang Q, Lin X, Wang Y, Chen X, Zheng W, Zhong X, Shang D, Huang M, Gao X, Deng H, Li J, Zeng F and Mo X (2022) Tacrolimus pharmacokinetics in pediatric nephrotic syndrome: A combination of population pharmacokinetic modelling and machine learning approaches to improve individual prediction. Front. Pharmacol. 13:942129. doi: 10.3389/fphar.2022.942129
Received: 12 May 2022; Accepted: 30 September 2022;
Published: 15 November 2022.
Edited by:
Elham Ahmadian, Tabriz University of Medical Sciences, IranReviewed by:
Guoxiang Hao, Shandong University, ChinaCopyright © 2022 Huang, Lin, Wang, Chen, Zheng, Zhong, Shang, Huang, Gao, Deng, Li, Zeng and Mo. This is an open-access article distributed under the terms of the Creative Commons Attribution License (CC BY). The use, distribution or reproduction in other forums is permitted, provided the original author(s) and the copyright owner(s) are credited and that the original publication in this journal is cited, in accordance with accepted academic practice. No use, distribution or reproduction is permitted which does not comply with these terms.
*Correspondence: Xiaolan Mo, YWxsZW5tb3JAMTYzLmNvbQ==; Fangling Zeng, emVuZ2ZhbmdsaW5nMjAwNUAxNjMuY29t; Jiali Li, bGlqaWFsaTVAbWFpbC5zeXN1LmVkdS5jbg==
†These authors have contributed equally to this work
Disclaimer: All claims expressed in this article are solely those of the authors and do not necessarily represent those of their affiliated organizations, or those of the publisher, the editors and the reviewers. Any product that may be evaluated in this article or claim that may be made by its manufacturer is not guaranteed or endorsed by the publisher.
Research integrity at Frontiers
Learn more about the work of our research integrity team to safeguard the quality of each article we publish.