
95% of researchers rate our articles as excellent or good
Learn more about the work of our research integrity team to safeguard the quality of each article we publish.
Find out more
ORIGINAL RESEARCH article
Front. Pharmacol. , 20 September 2022
Sec. Pharmacogenetics and Pharmacogenomics
Volume 13 - 2022 | https://doi.org/10.3389/fphar.2022.942126
This article is part of the Research Topic Molecular Targets for Anti-Cancer Drug Discovery and Development View all 5 articles
 Md Shahin Alam1†
 Adiba Sultana1†
 Hongyang Sun1†Jin Wu1Fanfan Guo2Qing Li3
 Haigang Ren1Zongbing Hao1*
 Yi Zhang2*
 Guanghui Wang1*
Accurate identification of molecular targets of disease plays an important role in diagnosis, prognosis, and therapies. Breast cancer (BC) is one of the most common malignant cancers in women worldwide. Thus, the objective of this study was to accurately identify a set of molecular targets and small molecular drugs that might be effective for BC diagnosis, prognosis, and therapies, by using existing bioinformatics and network-based approaches. Nine gene expression profiles (GSE54002, GSE29431, GSE124646, GSE42568, GSE45827, GSE10810, GSE65216, GSE36295, and GSE109169) collected from the Gene Expression Omnibus (GEO) database were used for bioinformatics analysis in this study. Two packages, LIMMA and clusterProfiler, in R were used to identify overlapping differential expressed genes (oDEGs) and significant GO and KEGG enrichment terms. We constructed a PPI (protein–protein interaction) network through the STRING database and identified eight key genes (KGs) EGFR, FN1, EZH2, MET, CDK1, AURKA, TOP2A, and BIRC5 by using six topological measures, betweenness, closeness, eccentricity, degree, MCC, and MNC, in the Analyze Network tool in Cytoscape. Three online databases GSCALite, Network Analyst, and GEPIA were used to analyze drug enrichment, regulatory interaction networks, and gene expression levels of KGs. We checked the prognostic power of KGs through the prediction model using the popular machine learning algorithm support vector machine (SVM). We suggested four TFs (TP63, MYC, SOX2, and KDM5B) and four miRNAs (hsa-mir-16-5p, hsa-mir-34a-5p, hsa-mir-1-3p, and hsa-mir-23b-3p) as key transcriptional and posttranscriptional regulators of KGs. Finally, we proposed 16 candidate repurposing drugs YM201636, masitinib, SB590885, GSK1070916, GSK2126458, ZSTK474, dasatinib, fedratinib, dabrafenib, methotrexate, trametinib, tubastatin A, BIX02189, CP466722, afatinib, and belinostat for BC through molecular docking analysis. Using BC cell lines, we validated that masitinib inhibits the mTOR signaling pathway and induces apoptotic cell death. Therefore, the proposed results might play an effective role in the treatment of BC patients.
Breast cancer (BC) is the most common cancer diagnosis and the leading cause of cancer-related deaths in women worldwide. It was calculated that 2,261,419 (11.7% of all cancers) new cases and 684,996 (6.9% of all cancers) deaths occurred in BC in 2020 (Sung et al., 2021). In China, 416,371 new cases and 117,414 BC-related deaths occurred in 2020, accounting for 18.4% of diagnoses and 17.1% of deaths (Cao et al., 2021). It was also estimated that there were 1,700,000 new cases and 521,900 deaths in 2012 BC worldwide (Torre et al., 2015). We noticed that BC has a high prevalence and mortality rate and is steadily increasing every year, although it is claimed that there have been significant advances in systematic treatment over the decades. The 5-year overall survival rate for BC patients is still low, although it depends on various factors (Sarveazad et al., 2018). Therefore, the progress of the existing treatment has not yet reached a satisfactory level. Therefore, it is urgent to improve research to discover potential molecular targets and effective candidate drugs for the development of innovative therapies for BC.
Novel drug discovery is challenging, time consuming, and expensive due to the very low rate of approval through clinical trials. Discovering a new drug using the de novo technique takes approximately 14 years and costs 800 million dollars, yet many pharmaceutical companies are working on it (Song et al., 2009; Lavecchia and Di Giovanni, 2013). Drug repurposing (DR) is a promising strategy to identify new indications for a specific disease by using approved drugs (existing drugs) (Simsek et al., 2018). The DR strategy is safer, cheaper, and less time consuming than the de novo strategy due to the knowledge of in vivo screening, chemical optimization, and toxicology of existing drugs (Ko, 2020). Thus, the DR technique in computers widely used by pharmaceutical companies and researchers over the past few decades has achieved significant success (Shi et al., 2020; Alam et al., 2022b). Molecular docking analysis is a momentous strategy for validating drug-target structural binding performance in computational DR processes. Bioinformatics analysis plays a significant role in accurately identifying the key genes (KGs)/targets with candidate drugs of the disease to inform diagnosis, prognosis, and therapies. The gene expression profile analysis is one of the most popular platforms for disease-guided KG identification. Thus, we used multiple datasets collected from different environments to identify more common and stable BC-guided KG through gene expression profiles (Alam et al., 2022a).
In the present study, we identified eight stable BC-guided KGs (EGFR, FN1, EZH2, MET, CDK1, AURKA, TOP2A, and BIRC5) and highlighted their role as molecular targets. We also proposed 16 KG-guided candidate drugs (YM201636, masitinib, SB590885, GSK1070916, GSK2126458, ZSTK474, dasatinib, fedratinib, dabrafenib, methotrexate, trametinib, tubastatin A, BIX02189, CP466722, Afatinib, and Belinostat) for BC treatment and validated them in silico through molecular docking analysis. Using BC cell lines, we found that masitinib inhibits the mTOR signaling pathway and induces apoptotic cell death.
The gene expression profiles analyzed in our study were downloaded from the Gene Expression Omnibus (GEO) database (https://www.ncbi.nlm.nih.gov/geo/) (Edgar and Barrett, 2006). The workflow of the present study is presented in Supplementary Figure S1. Eight sets of gene expression profiles with accession numbers GSE54002 (Tan et al., 2014), GSE29431 (Wang et al., 2021), GSE124646 (Sinn et al., 2019), GSE42568 (Clarke et al., 2013), GSE45827 (Gruosso et al., 2016), GSE10810 (Pedraza et al., 2010), GSE65216 (Maubant et al., 2015), and GSE36295 (Karim et al., 2016) were used to identify differentially expressed genes (DEGs) between BC and normal samples. A total of 864 BC samples and 123 normal samples were included in these eight sets of profiles. An independent gene expression profile (GSE109169) (Yu et al., 2020) including 25 BC and 25 normal samples was collected to investigate the prognostic performance of KGs through the cancer prediction model. Furthermore, the six profiles (GSE54002, GSE29431, GSE42568, GSE45827, GSE10810, and GSE65216) based on the GPL570 platform, profile GSE124646 based on the GPL96 platform, profile GSE36295 based on the GPL6244 platform, and profile GSE109169 based on the GPL96 platform were identified. Details of the datasets are described in Table 1.
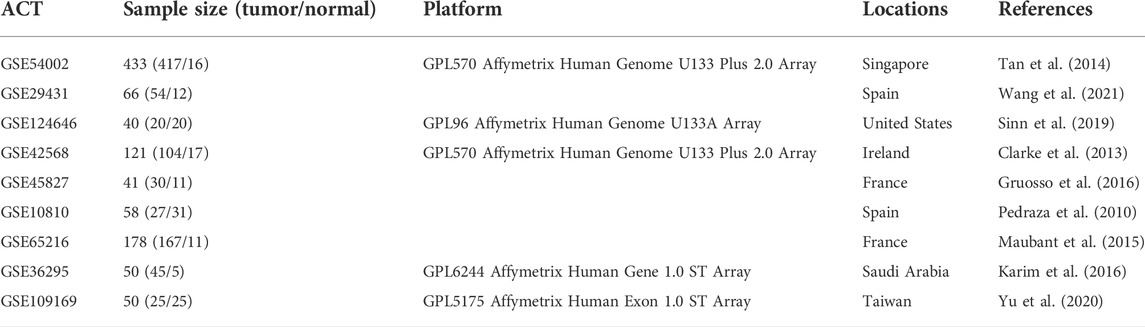
TABLE 1. Description of eight sets of gene expression profiles for BC analyzed in this study.
We normalized all datasets by using log2-transformation, after which we used the normalized data for further analysis. Then, the Limma (version: 3.14) package (Ritchie et al., 2015) in RStudio (version: 1.2.5019) was used to identify DEGs between BC samples and normal samples for eight datasets individually. The moderated T-statistics and the Benjamini and Hochberg false discovery rate method were used to calculate the p value and adjusted p value (adj.P.Val) and logFC (fold change), accordingly. The cutoff criteria adj.P.Val < 0.01 and | logFC | > 1.5 were considered to select significant DEGs. Overlapping upregulated and downregulated DEGs were screened using the Venn diagram web tool (https://bioinformatics.psb.ugent.be/webtools/Venn/).
The PPI network of oDEGs was constructed using the online database STRING (Search Tool for the Retrieval of Interacting Genes) (v 11.5) and was visualized through the Cytoscape software (Shannon et al., 2003; Szklarczyk et al., 2019). Then, we screened the top-ranked common KGs by using the six topological measures betweenness, closeness, eccentricity, degree, maximal clique centrality (MCC), and maximum neighborhood component (MNC) through the Analyze Network tool in the Cytoscape.
GO (Gene Ontology) function in three categories BPs (Biological Processes), CC (Cellular Component), and MF (MF) and KEGG (Kyoto Encyclopedia of Genes and Genomes) pathway enrichment analyzed through the R/Bioconductor package “clusterProfiler” (version: 3.14). p-value cutoff = 0.05 and q-value cutoff = 0.05 were selected as the cutoff criteria (Yu et al., 2012).
The regulatory interaction network TFs (Transcription factors)-KGs-miRNAs (microRNAs) to detect transcriptional and posttranscriptional regulatory factors of KGs. The Network Analyst (Zhou et al., 2019) web-based tool was used to construct the regulatory interaction networks and was visualized by using the Cytoscape software (Shannon et al., 2003).
We validated the expression pattern of KGs through TCGA (The Cancer Genome Atlas) RNA-seq data (independent data) by using the GEPIA database (Tang et al., 2017). Then, we performed the cancer prediction/classification model using the popular machine learning algorithm SVM to test the prognostic power of our proposed KGs. We used the expression profiles of KGs from eight sets of data (GSE54002, GSE29431, GSE124646, GSE42568, GSE45827, GSE10810, GSE65216, and GSE36295) as the prediction set and another independent validation set GSE26964. The ROCR package in R was used to generate the ROC curves (Sing et al., 2005).
To explore KG-guided candidate drugs for BC by molecular docking analysis, we considered eight KGs as drug target proteins (receptors). Subsequently, the 77 KG-associated meta-drug agents (ligands) were selected from the GSCALite database on the basis of a positive Spearman rank correlation with at least one KG (Liu et al., 2018). We downloaded 3-D structures of target proteins and drug agents for molecular docking analysis. The 3-D structures of the eight KGs EGFR, FN1, EZH2, MET, CDK1, AURKA, TOP2A, and BIRC5 were downloaded from the Protein Data Bank (PDB) database with the PDB IDs 3g5z, 2haz, 4mi0, 6hyg, 6gu6, 3dj5, 1zxm, and 1xox, respectively (Berman et al., 2002). The 3D structures of the meta-drug agents were downloaded from the PubChem database (Kim et al., 2019). The 3-D structure of receptors and ligands was preprocessed for molecular docking analysis using the PyMol software. Molecular docking analysis was performed using the AutoDock Vina software in PyRx to check the structural binding performance between receptors and ligands and computed the binding affinity scores (BAS) (kcal/mol) (Trott and Olson, 2010; Dallakyan and Olson, 2015). The “plot.matrix” package in R was used to visualize the molecular docking results.
All gene expression profiles were statistically analyzed by the R software (Version 4.0.4). Moderated t-statistics were utilized to testH0 (equally expressed gene (EEG) in both the case and control groups) versus H1 (differentially expressed gene (DEG) between the case and control groups). Statistically significant differences were considered when p < 0.05.
The BC cell lines MCF-7 and MDA-MB-231 cells were cultured in Dulbecco’s modified Eagle’s medium (Gibco, Los Angeles, CA) containing 10% fetal bovine serum (FBS, Gibco) supplemented with penicillin (100 µ/ml) and streptomycin (100 μg/ml, Gibco). Masitinib was purchased from MedChemExpress (Monmouth Junction, NJ, United States) and dissolved in dimethyl sulfoxide (DMSO). The cells were treated with different doses of masitinib for 24 or 48 h. After treatment, the cells were harvested with lysis buffer for immunoblot analyses or fixed with 4% paraformaldehyde for immunofluorescent staining.
The cells were seeded in 96-well plates and cultured overnight. After treatment with masitinib at the indicated dose, a 10 µl solution of cell counting kit-8 (CCK-8) reagent was added to each well and incubated for 1 h in the dark. The absorbance was measured at 450 nm to calculate cell viability.
The cells were treated with masitinib at different concentrations. After treatment, the cells were incubated with Hoechst 33342 (Sigma, St. Louis, MO, United States) and PI (Sigma, St. Luis, MO, United States ) for 10 min. The cells were then imaged with an inverted IX71 microscope system (Olympus, Tokyo, Japan).
Immunoblot analyses were performed as described previously (Zhang et al., 2022). In brief, the cells were lysed in 1 × SDS lysis buffer supplemented with a protease inhibitor cocktail (Roche, Basel, Switzerland). The cell lysates were subjected to SDS–PAGE and transferred onto a PVDF membrane (Millipore, Billerica, MA, United States). The membranes were incubated with the following primary antibodies: anti-β-actin, anti-cleaved caspase-3, anti-cyclin D, anti-mTOR, anti-PARP, and anti-phospho-mTOR. The secondary antibodies, sheep anti-rabbit or anti-mouse IgG-HRP, were obtained from Thermo Fisher (Waltham, MA, United States). The proteins were visualized using an ECL detection kit (Thermo Fisher, Waltham, MA, United States).
We used the LIMMA statistical approach to identify DEGs and considered the threshold adj.P.Val < 0.01 and |log2 fold change (FC) | >1.5 for selecting significantly upregulated and downregulated DEGs. The DEGs in each dataset are presented using volcano plots (Figure 1A), where red dots indicate downregulated DEGs and green dots indicate upregulated DEGs. Then, we generated a Venn diagram of the overlapping upregulated and downregulated DEGs in (Figure 1B). Finally, we obtained a total of 68 oDEGs (36 upregulated and 32 downregulated oDEGs) in Table 2, which are referred to as DEGs in this study.
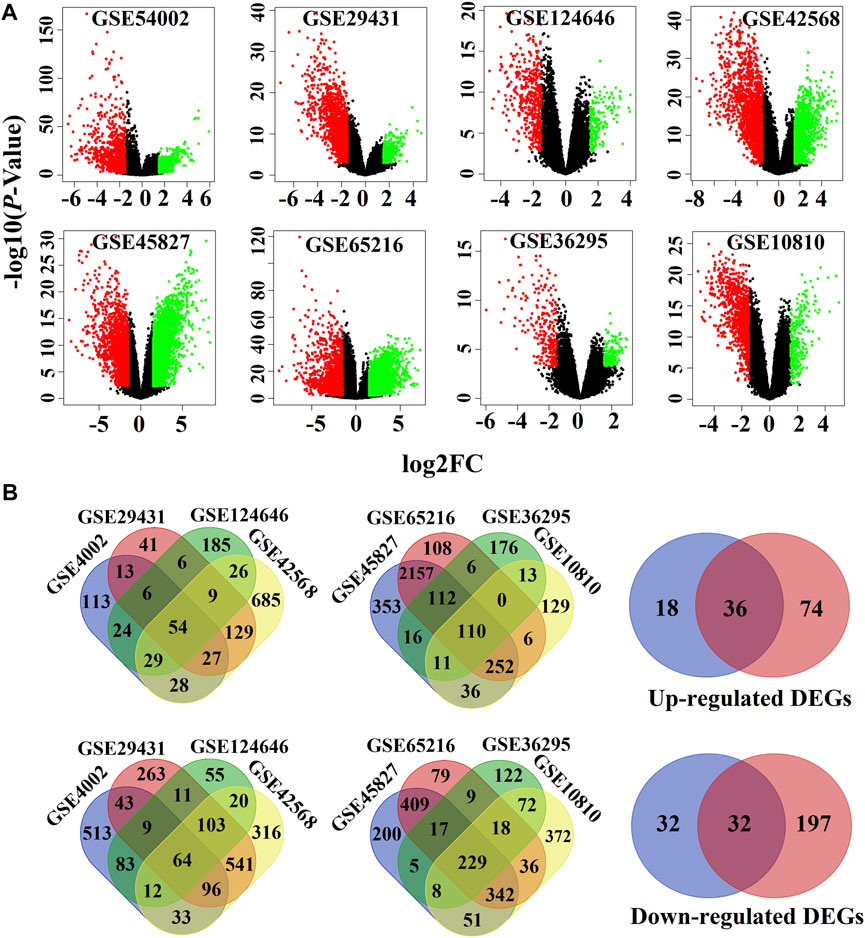
FIGURE 1. Screen of the overlapping DEGs (oDEGs) among eight sets of gene expression profiles. (A) Volcano plots of DEGs, where red dots indicate downregulated DEGs and green dots indicate upregulated DEGs. (B) Venn diagrams were used to screen overlapping upregulated and downregulated DEGs.
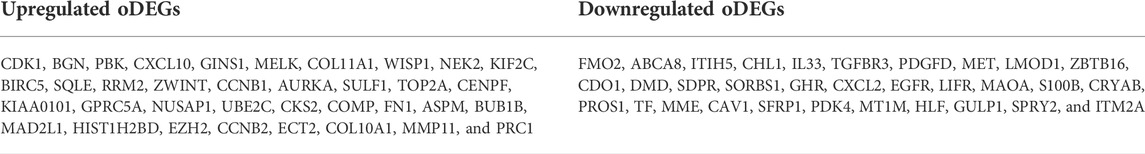
TABLE 2. List of up- and downregulated oDEGs.
We visualized the PPI network of oDEGs in Figure 2, where green indicates upregulated oDEGs, pink indicates downregulated oDEGs, and large size indicates KGs. After that, we used six network scoring measures, including betweenness, closeness, eccentricity, degree, MCC, and MNC in the Analyze Network tool in the Cytoscape, and selected the top 25 genes for each measure. We extracted eight common genes (EGFR, FN1, EZH2, MET, CDK1, AURKA, TOP2A, and BIRC5) among the six lists and considered them as KGs in this study (Table 3). Further analyzed-based information of the KGs is presented in Table 4.
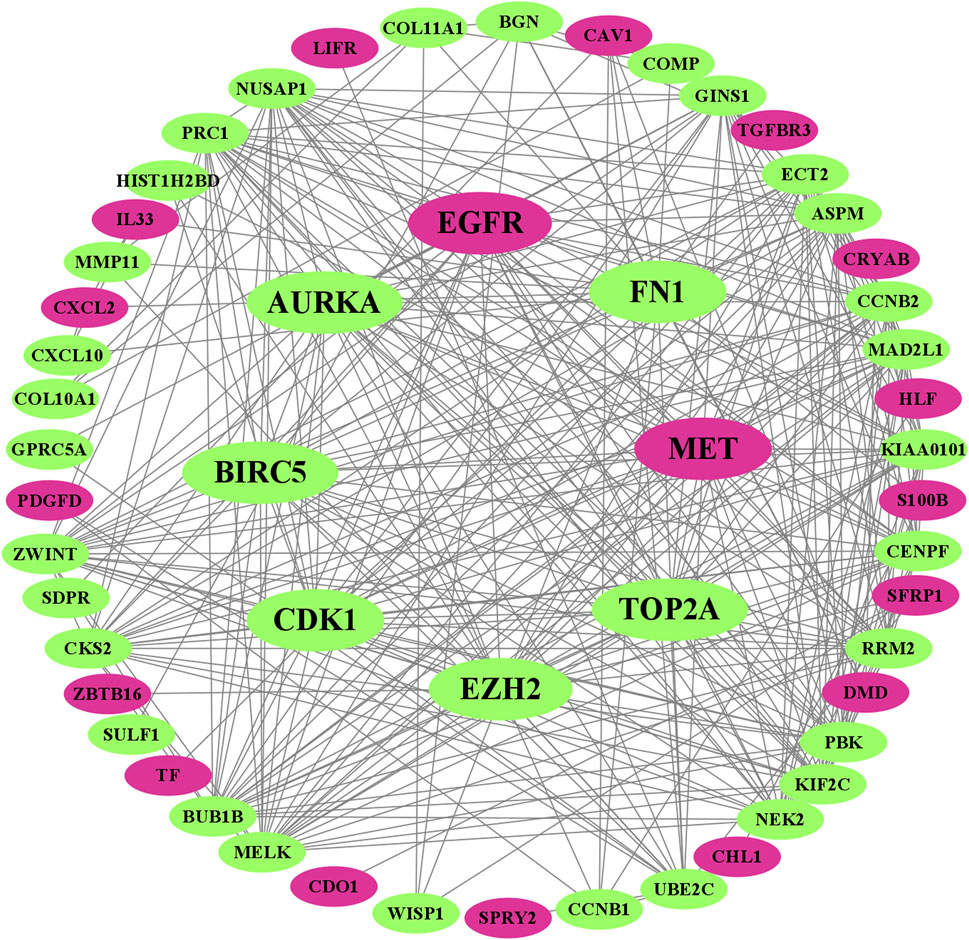
FIGURE 2. Visualized PPI network of oDEGs, where green indicates upregulated oDEGs, pink indicates downregulated oDEGs, and large size indicates KGs.
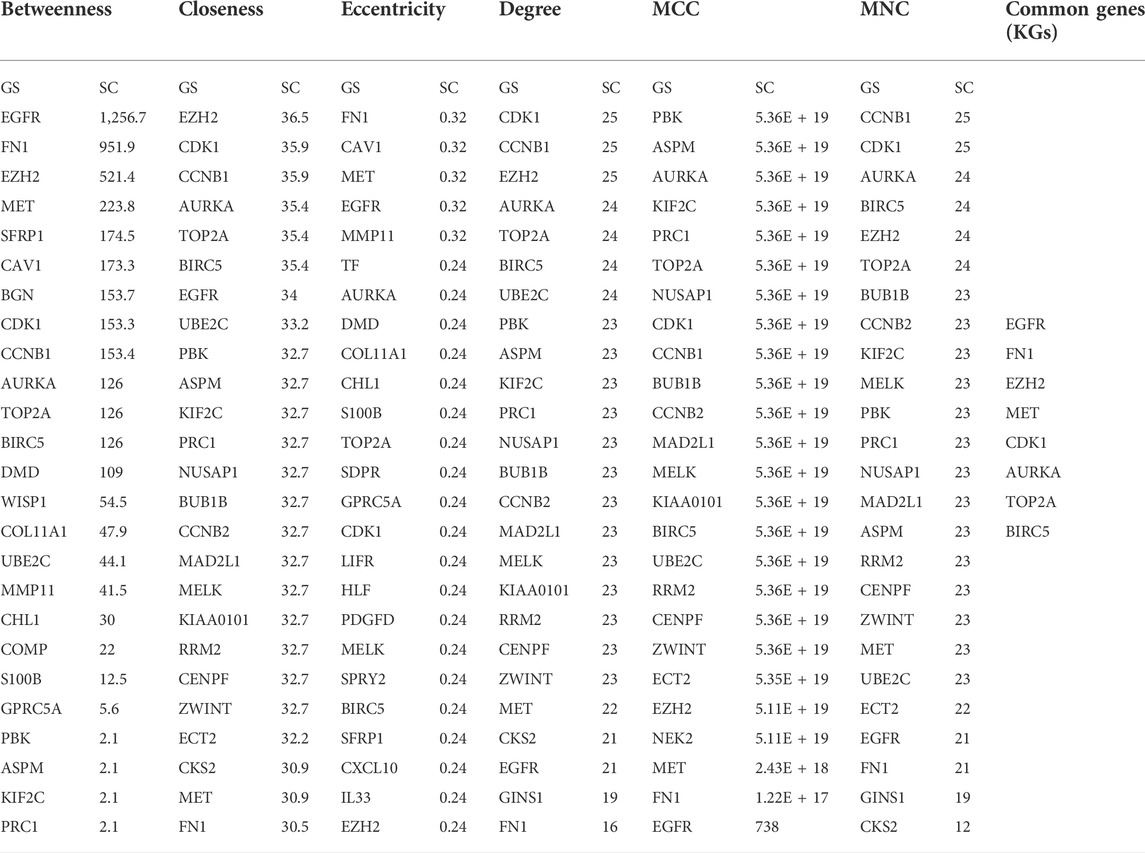
TABLE 3. Eight KGs were selected by taking the common of top 25 ranked genes for six network scoring measures through the PPI network.
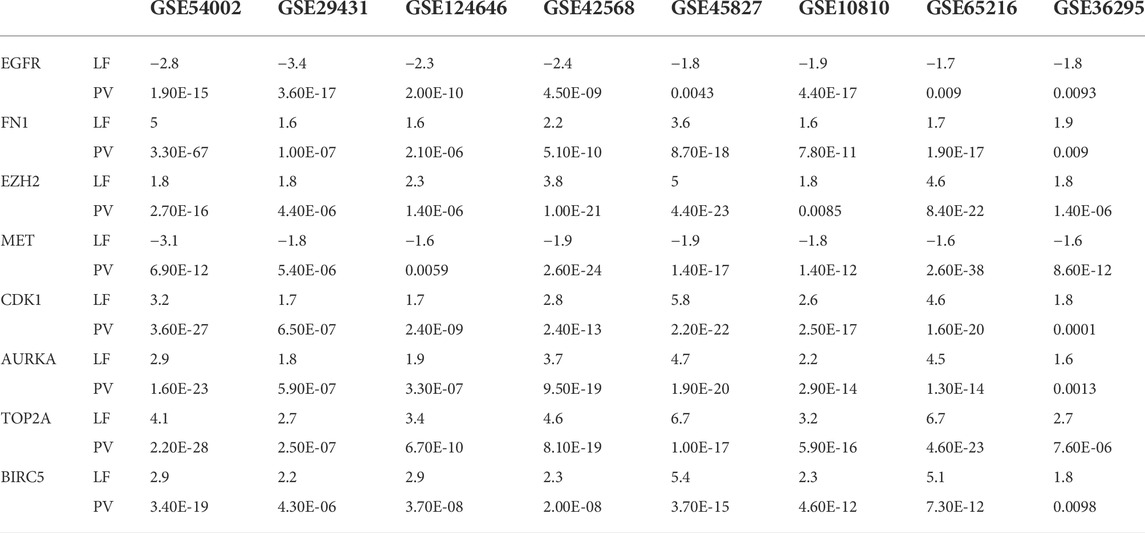
TABLE 4. List of KGS included with p values and logFC values on eight sets of data.
The GO functional and KEGG pathway enrichment analysis showed that 148 GO-BP terms, 27 GO-CC terms, 12 GO-MF terms, and 13 KEGG terms were enriched by oDEGs, and the top 10 terms of each category are represented in Figures 3A–C. Among them four significantly enriched BP terms, six CC terms, three MF terms, and five KEGG terms were directly associated with at least two KGs. The four BP terms were nuclear division, organelle fission, mitotic nuclear division, and chromosome segregation. The six CC terms were spindle, condensed chromosome, “chromosome, centromeric region”, chromosomal region, midbody, and spindle microtubule. The three MF terms were histone kinase activity, heparin binding, and protein serine/threonine kinase activity. Finally, the five KEGG terms were identified as progesterone-mediated oocyte maturation, focal adhesion, oocyte meiosis, adherens junction, and bacterial invasion of epithelial cells.
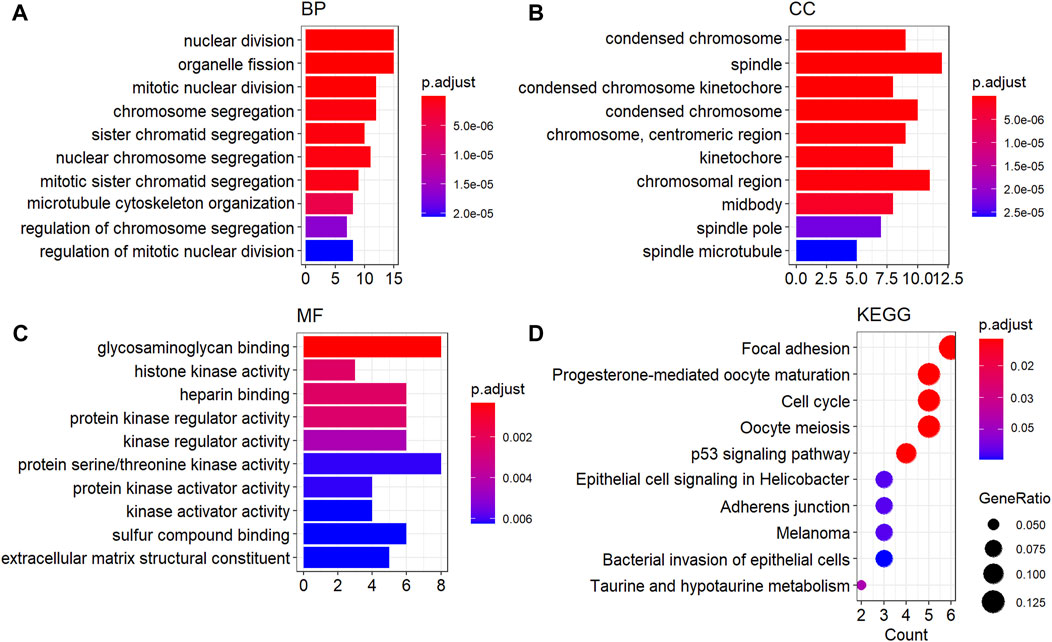
FIGURE 3. GO functional and KEGG enrichment analysis of oDEGs. (A) Top ten GO-BP terms, (B) top ten GO-CC terms, (C) top ten GO-MF terms, and (D) top ten KEGG pathway terms.
Regulatory interaction networks (TFs-KGs-miRNAs) are visualized in Figure 4, where green indicates miRNAs, pink indicates KGs, blue indicates TFs, and large size indicates key factors. We observed that the four TFs, such as TP63, MYC, SOX2, and KDM5B are associated with all KGs; therefore, we considered these four TFs to be key transcriptional regulators of KGs. Similarly, the four miRNAs, including hsa-mir-16-5p, hsa-mir-34a-5p, hsa-mir-1-3p, and hsa-mir-23b-3p were also associated with all KGs; thus, we considered these four miRNAs to be key posttranscriptional regulators of KGs.
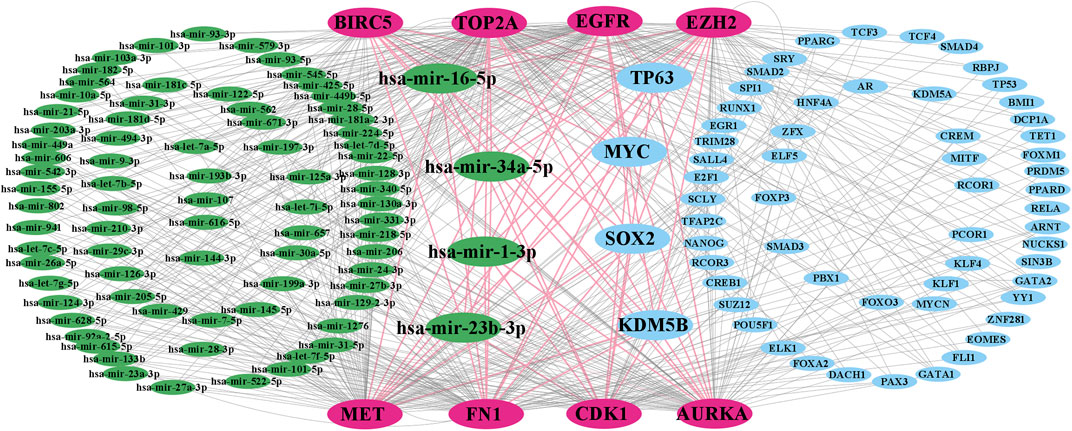
FIGURE 4. TF-KG–miRNA interaction network, where pink indicates KGs, green indicates miRNAs, blue indicates TFs, and large green and blue indicate key miRNAs and TFs, respectively.
The expression patterns of KGs are displayed by box plots for independent data (TCGA RNA-seq data) in Figure 5. We observed that the expression patterns of all KGs were highly differentiated; among them, six KGs (FN1, EZH2, CDK1, AURKA, TOP2A, and BIRC5) were upregulated, and the remaining two KGs (EGFR and MET) were downregulated, which supported our original results.
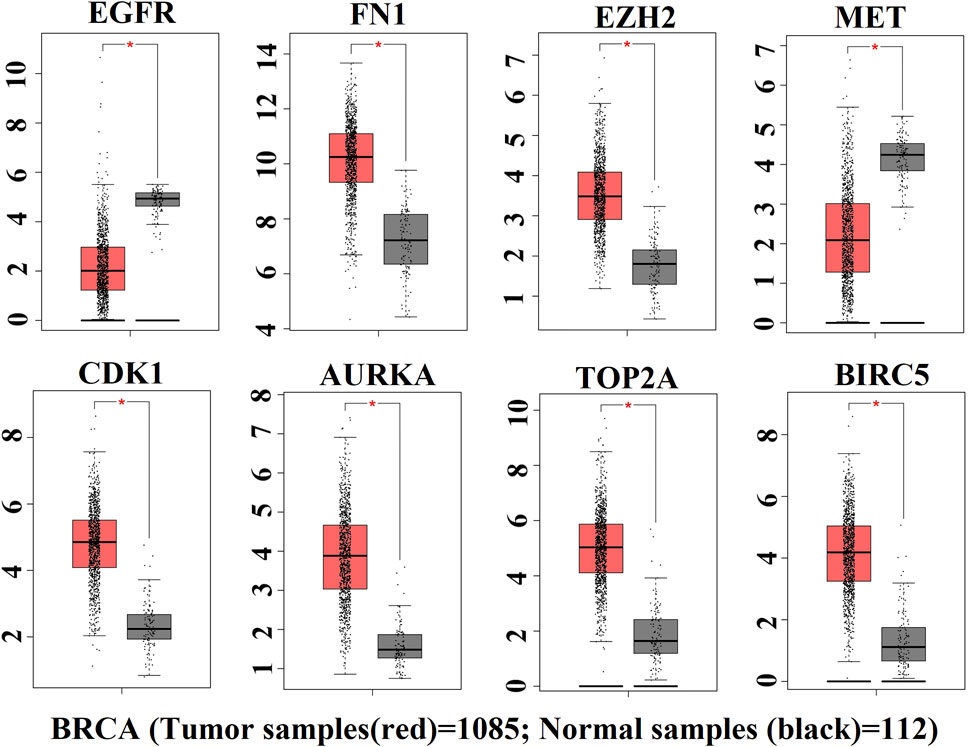
FIGURE 5. Box plot of expression patterns of KGs for RNA-seq data, where red indicates the high-risk group and black indicates the low-risk group.
The ROC curves of the cancer prediction/classification model to test the prognostic power of our proposed KGs are presented in Figure 6. The AUC ranged from 94.7 to 99.7 for the prediction set (red color) and 85.5 to 93.5 for the validation set (blue color). Overall, EGFR, FN1, EZH2, MET, CDK1, AURKA, TOP2A, and BIRC5 achieved the best performance (AUC > 85.5) for each of the training and independent test datasets, which indicates that there is a strong prognostic power of the identified KGs for discriminating between the tumor and the normal samples in BC patients.
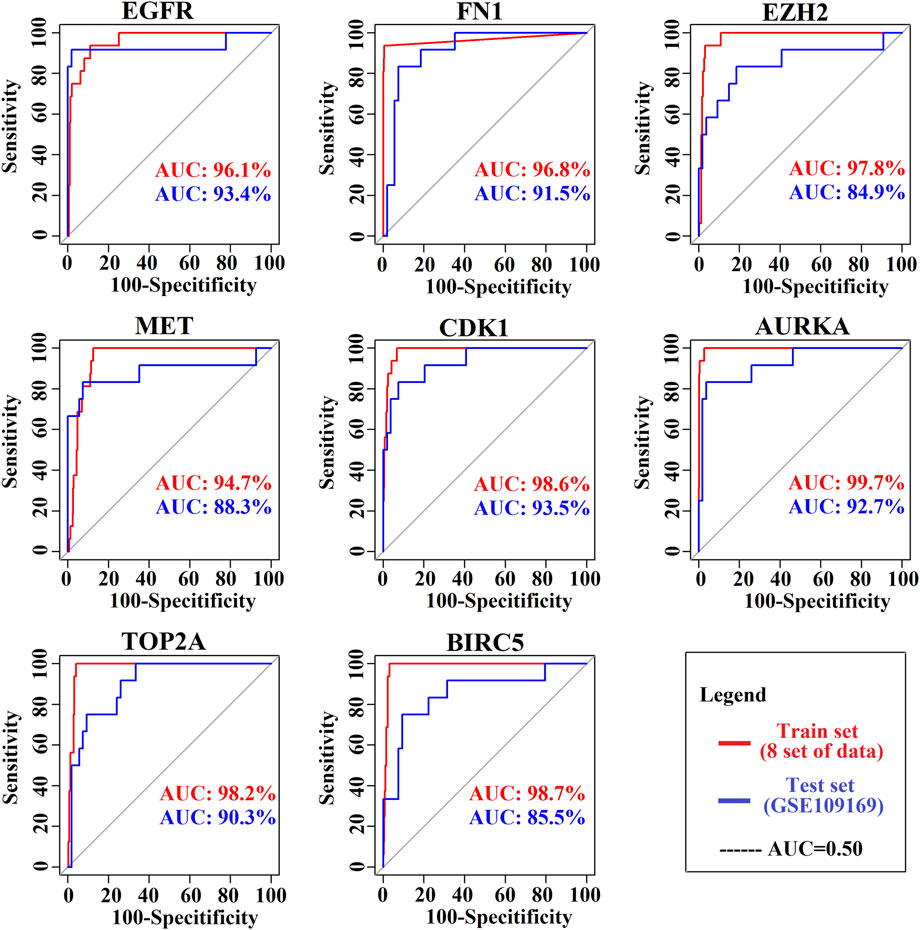
FIGURE 6. Prognostic powers of KGs were represented by ROC curves, where red indicates the prediction curve and blue indicates the validation curve.
To explore the candidate drugs for BC, we considered eight KG-based proteins EGFR, FN1, EZH2, MET, CDK1, AURKA, TOP2A, and BIRC5 as drug targets. We collected eight KG-associated drugs from the GSCALite database and considered them meta-drug agents. Then, we performed molecular docking analysis between our proposed receptors and the meta-drug agents. The binding affinity score matrix between the ordered receptors and the ordered drug agents is displayed in Figure 7. We observed that the top-order eleven leading compounds/drugs (YM201636, masitinib, SB590885, GSK1070916, GSK2126458, ZSTK474, dasatinib, TG101348, dabrafenib, methotrexate, and trametinib) produced highly significant binding affinity scores (BAS) < −7 with all target proteins. Next, six drugs (tubastatin_A, lapatinib, BIX02189, CP466722, afatinib, and belinostat) had highly significant BAS < −7 with seven target proteins. The drug laptinib was approved by the FDA in 2007 for BC. Therefore, we suggest in this computational study that 16 repurposing candidate drugs may be effective against BC patients (Table 5).
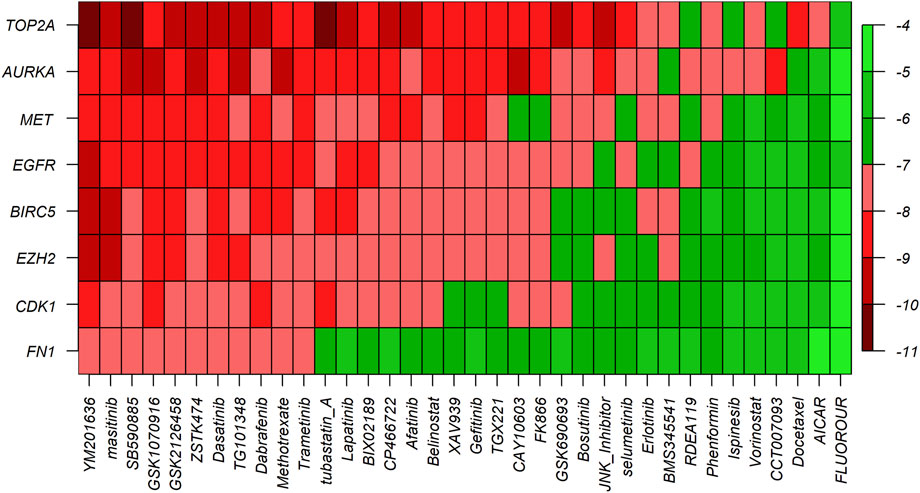
FIGURE 7. Molecular docking analysis results for exploring candidate drugs against BC. The Y-axis presents proteins (targets), the X-axis presents compounds (drugs), and different colors indicate the binding affinity score (BAS).
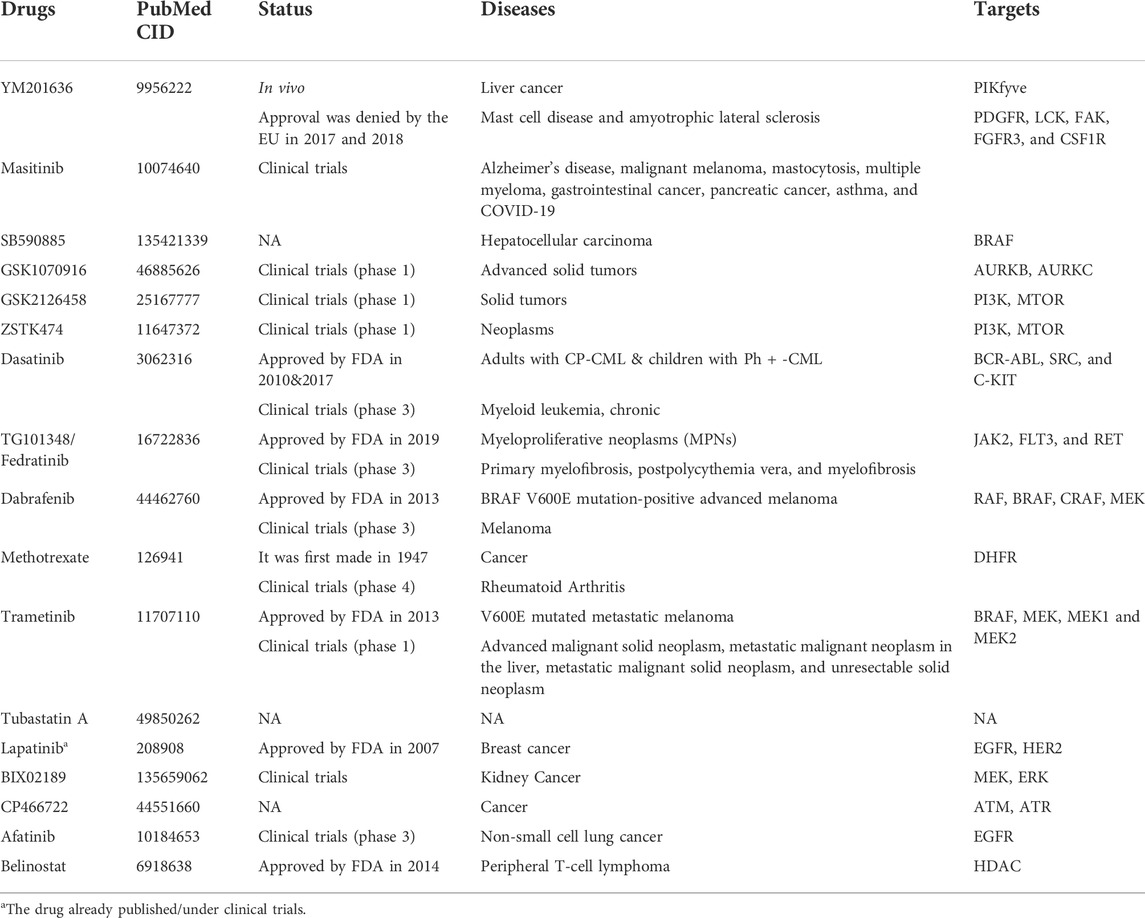
TABLE 5. List of 16 proposed repurposing drugs for BC.
To further confirm the potential roles of the candidate drugs on BC, we selected one of the candidates masitinib to examine the effects on two BC cell lines. In both MCF-7 (Figure 8A) and MDA-MB-231 (Figure 8B) cells, masitinib decreased cell viability in a dose-dependent manner. Moreover, masitinib inhibited the phosphorylation of mTOR (Figure 8C). Furthermore, masitinib decreased the levels of cyclin D, an essential regulator of the G1 to S phase transition and increased the cleavage of PARP1 (Figure 8D), suggesting that masitinib influences the cell cycle and induces apoptosis. The induction of apoptotic cell death by masitinib was further confirmed with PI staining (Figure 8E) and immunofluorescent staining using anti-cleaved caspase-3 antibodies (Figure 8F), showing that with higher doses of masitinib, more cells were labeled with PI and cleaved caspase-3 in both MCF-7 and MDA-MB-231 cells.
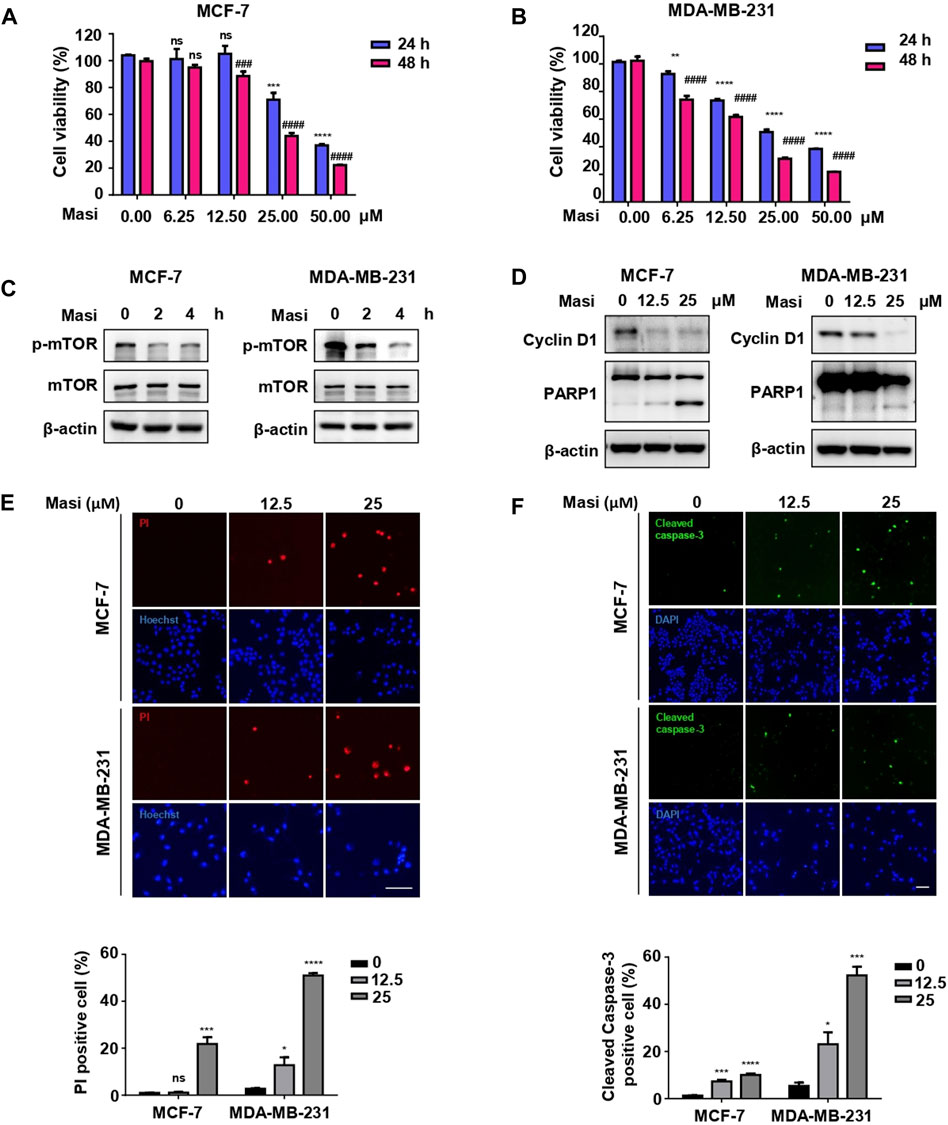
FIGURE 8. Masitinib treatment effectively killed MCF-7 cells and MDA-MB-231 cells in a dose- and time-dependent manner. (A) MCF-7 cells were treated with different dosages of masitinib (0, 6.25, 12.5, 25, and 50 μM) or DMSO for 48 h. Cell viability was determined by CCK-8 assay at different time points (24 and 48 h). The values are presented as the mean ± SEM from three independent experiments. ***p < 0.001, ****p < 0.0001, ns, no significant difference vs. 24 h DMSO group, one-way ANOVA followed by Dunnett’s multiple-comparisons test. ###p < 0.001, ####p < 0.0001, ns, no significant difference vs. 48 h DMSO group, one-way ANOVA followed by Dunnett’s multiple-comparisons test. (Masi: masitinib). (B) MDA-MB-231 cells were treated with different dosages of masitinib (0, 6.25, 12.5, 25, and 50 μM) or DMSO for 48 h. Cell viability was determined by CCK-8 assay at different time points (24 and 48 h). The values are presented as the mean ± SEM from three independent experiments. **p < 0.01, ****p < 0.0001 vs. 24 h DMSO group, one-way ANOVA followed by Dunnett’s multiple-comparisons test. ####p < 0.0001 vs. 48 h DMSO group, one-way ANOVA followed by Dunnett’s multiple-comparisons test. (Masi: masitinib). (C) Masitinib treatment inhibited the phosphorylation levels of mTOR protein in MCF-7 cells and MDA-MB-231 cells. MCF-7 cells and MDA-MB-231 cells were treated with 25 μM masitinib separately. The protein levels of p-mTOR, mTOR, and β-actin were measured using immunoblot analyses at different time points (0, 2, and 4 h). (Masi: masitinib). (D) MCF-7 cells were treated with different dosages of masitinib (0, 12.5, and 25 μM) for 48 h. MDA-MB-231 cells were treated with different dosages of masitinib (0, 12.5, and 25 μM) for 24 h. Then, the protein levels of Cyclin D1, PARP1, and β-actin in these two types of cells were measured using immunoblot analyses. (Masi: masitinib). (E) MCF-7 cells and MDA-MB-231 cells were treated as in (D) and then incubated with propidium iodide (PI) and Hoechst to detect the cell states. Scale bar, 100 μm. The PI-positive cells were counted and quantified with cell numbers marked with Hoechst. The values are presented as the mean ± SEM from three independent experiments. *p < 0.05, ***p < 0.001, ****p < 0.0001, ns, no significant difference vs. DMSO group, one-way ANOVA followed by Dunnett’s multiple-comparisons test. (F) MCF-7 cells and MDA-MB-231 cells were treated as in (E) and then stained with anti-cleaved caspase-3 antibody and DAPI. Scale bar, 100 μm. The cleaved caspased-3-positive cells were counted and quantified with cell numbers marked with DAPI. The values are presented as the mean ± SEM from three independent experiments. *p < 0.05, ***p < 0.001, ****p < 0.0001 vs. DMSO group, one-way ANOVA followed by Dunnett’s multiple-comparisons test.
BC is the cause of a high prevalence and leading mortality rate for women worldwide and is constantly increasing every year. The 5-year overall survival rate for BC patients is still very low, although there has been significant progress in systematic treatment over the past few decades. Therefore, research needs to be improved to discover potential molecular targets and effective candidate drugs that could play a significant role in improving survival rates and reducing mortality in BC patients.
In this study, we identified the potential biomarkers and the candidate drugs by highlighting their pathogenetic processes, transcriptional and posttranscriptional regulatory factors, expression levels, prognostic power, and drug molecules through integrated bioinformatics and network-based techniques. First, we screened 68 oDEGs between BC and normal samples using gene expression profiles. Then, we selected BC-causing two downregulated KGs (EGFR and MET) and six upregulated KGs (FN1, EZH2, CDK1, AURKA, TOP2A, and BIRC5) through the PPI network analysis (Figure 2; Table 3). Some studies have also proposed our identified KGs as BC-causing genes (Navolanic et al., 2003; Gastaldi et al., 2010; Li et al., 2017; Komoto et al., 2018; Deng et al., 2019). In particular, EGFR and its downstream signaling pathways are related to the progression of BC and play an important role against BC treatment using cytotoxic drugs (Navolanic et al., 2003). Analysis of gene expression profiles revealed that MET oncogene immunoreactivity is significantly higher in the progression of basal-like BC in humans than in other types of cancer (Gastaldi et al., 2010). Decreased stability of EZH2 is responsible for the progression and metastasis of BC, but ANCR plays an important role in controlling the stability of EZH2 which inhibits the progression of BC (Li et al., 2017). Bioinformatic analysis has proposed CDK1 as an upregulated gene related to BC progression and tumorigenesis (Deng et al., 2019). Chalcones inhibited the expression of AURKA protein and affected the anti-resistance and anti-metastatic properties of the BC cell lines MCF-7 and BT-20 (Komoto et al., 2018). Based on in silico analysis proposed that TOP2A is related to BC tumorigenesis and progression and has been highlighted as a pathogenetic process (Deng et al., 2019). BIRC5 was proposed as an upregulated gene and could be a significant marker for the detection and prognosis of BC at an early age (Ghaffari et al., 2016; Wang et al., 2018).
To investigate the pathogenetic processes of KGs, we selected four BP terms, six CC terms, three MF terms, and five KEGG terms based on directly associated with at least two KGs from the top ten terms of each category (Figure 3). Several studies also claimed that our identified KG-associated functional and pathway terms are responsible for BC progression (Emmert-Streib et al., 2014; Liu B. et al., 2018; Xiu et al., 2019; Han et al., 2020; Hermawan et al., 2020; Liu et al., 2020; Peng et al., 2021; Xiao et al., 2021; Zeng et al., 2021). GO functional analysis revealed that the BC-causing genes were significantly enriched in nuclear division (associated with KGs: TOP2A, AURKA, and BIRC5), organelle fission (associated with KGs: EGFR, AURKA, and BIRC5), and mitotic nuclear division (associated with KGs: MET and BIRC5) (Emmert-Streib et al., 2014; Han et al., 2020; Xiao et al., 2021). The three CC terms are condensed chromosome (associated with KGs: TOP2A, AURKA, and BIRC5), chromosomal region (associated with KGs: CDK1, AURKA, BIRC5, and EZH2) and midbody (associated with KGs: CDK1, AURKA, and BIRC5), which are associated with BC progression (Xiu et al., 2019; Liu et al., 2020). The MF term protein serine/threonine kinase activity (associated with KGs: CDK1, AURKA, and EGFR) is responsible for BC progression (Hermawan et al., 2020). Finally, the four KEGG pathway terms focal adhesion (associated with KGs: FN1, EGFR, and MET), progesterone-mediated oocyte maturation (associated with KGs: CDK1 and AURKA), oocyte meiosis (associated with KGs: CDK1 and AURKA), and adherens junction (associated with KGs: EGFR and MET), were also related to BC progression (Liu B. et al., 2018; Han et al., 2020; Peng et al., 2021; Zeng et al., 2021).
Four TFs (TP63, MYC, SOX2, and KDM5B) and four miRNAs (hsa-mir-16-5p, hsa-mir-34a-5p, hsa-mir-1-3p, and hsa-mir-23b-3p) were considered transcriptional and posttranscriptional and were connected to all KGs in the regulatory interaction network (Figure 4). Furthermore, we also checked the prognostic power of KGs for BC patients through the popular machine learning algorithm SVM. We developed a prediction model through SVM and showed good performance for both the training (GSE54002, GSE29431, GSE124646, GSE42568, GSE45827, GSE10810, GSE65216, and GSE36295) and test (GSE109169) (independent data) datasets. We found AUC values for eight KGs through the training dataset: EGFR (AUC: 96.1), FN1 (AUC: 96.8), EZH2 (AUC: 97.8), MET (AUC: 94.7), CDK1 (AUC: 98.6), AURKA (AUC: 99.7), TOP2A (AUC: 98.2), and BIRC5 (AUC: 98.7). Similarly, we found AUC values for eight KGs through the test dataset: EGFR (AUC: 93.4), FN1 (AUC: 91.5), EZH2 (AUC: 84.9), MET (AUC: 88.3), CDK1 (AUC: 93.5), AURKA (AUC: 92.7), TOP2A (AUC: 90.3), and BIRC5 (AUC: 85.5) (Figure 6). We noticed that the predictor model showed good performance with independent test datasets. These results indicate that our identified KGs have strong prognostic power for BC patients.
To discover potential candidate repurposing drugs for the treatment against BC patients, 77 KG-related drug agents were selected from the GSCALite database. Among them 16 candidate drugs (YM201636, masitinib, SB590885, GSK1070916, GSK2126458, ZSTK474, dasatinib, fedratinib, dabrafenib, methotrexate, trametinib, tubastatin A, BIX02189, CP466722, afatinib, and belinostat) were proposed based on BAS < −7 through molecular docking analysis (Figure 7; Table 5). Some of our proposed 16 drugs have already been approved, some are under clinical trial, and some are under in silico, in vivo, and in vitro analyses (Folch et al., 2015; Lee et al., 2015; Agency, 2017; FDA, 2017; European Commission, 2018; Odogwu et al., 2018; FDA, 2019; Hou et al., 2019; Drayman et al., 2021). Specifically, the drug YM201636 has been recommended which is effective against the progression of liver cancer through PIKfyve target inhibition (Hou et al., 2019). The drug masitinib was approved for mast cell disease and amyotrophic lateral sclerosis but later denied approval by the EU in 2017 and 2018 (Agency, 2017; European Commission, 2018). This drug has been studied for various human diseases and is now under clinical trial such as COVID-19 and Alzheimer’s disease (Folch et al., 2015; Drayman et al., 2021). Dasatinib was approved by the FDA in 2010 and 2017 for the treatment of adults with CP-CML and children with Ph + -CML, respectively (FDA, 2017). Fedratinib was approved by the FDA on 16 August 2019 for the treatment of MPN disease (FDA, 2019). Dabrafenib was approved by the FDA on 29 May 2013 for the treatment of BRAF V600E mutation-positive advanced melanoma disease (Odogwu et al., 2018). Tramatinib was approved by the FDA in May 2013 for the treatment of V600E mutated metastatic melanoma disease (Odogwu et al., 2018). Belinostat was approved by the FDA in 2013 for the treatment of peripheral T-cell lymphoma disease (Lee et al., 2015). However, the current study emphasizes experimental-lab verification for proposed candidate drugs with target proteins for treatment against BC.
Masitinib is an antitumor drug used primarily for mast cell tumors, but also used in solid tumors (Hahn et al., 2008). It inhibits the tyrosine kinase c-kit of mast cells, leading to a decrease in cell proliferation (Hahn et al., 2008). In BC, the cell surface receptors, including EGFR, HER-2, c-MET, and Trop2A, are cell surface markers that are potential targets for drugs (Butti et al., 2018). EGFR activation can induce the PI3K/AKT/mTOR signaling pathway to promote cell growth and proliferation (Miyamoto et al., 2017). Hyperactivation of the PI3K/AKT/mTOR pathway is commonly observed in BC, including triple-negative BC (Hussain et al., 2022). Inhibition of PI3K/AKT/mTOR by a dual PI3K/mTOR inhibitor apitolisib induces apoptotic cell death and decreases cell proliferation (Omeljaniuk et al., 2021). In the present study, we identified that masitinib as a candidate drug that potentially targets multiple BC-related products, including the cell surface marker EGFR. Using the breast cancer cell lines MCF-7 and MDA-MB-231, we observed that masitinib inhibits the activity of mTOR, a downstream effector of EGFR. It is well-documented that mTOR signaling is involved in cell proliferation, growth, metabolism, and survival (Zoungrana et al., 2022). In our observations, masitinib decreased cell migration and induced apoptotic cell death in MCF-7 and MDA-MB-231 cells. Thus, our data suggest that masitinib possibly acts on the EGFR/mTOR pathway to mediate antitumor activity.
In this study, we identified eight stable BC-guided KGs EGFR, FN1, EZH2, MET, CDK1, AURKA, TOP2A, and BIRC5 using well-established bioinformatics and network-based tools and highlighted their pathogenetic processes, regulatory factors, prognostic power, and drug molecules. Then, we proposed 16 potential candidate repurposing drugs YM201636, masitinib, SB590885, GSK1070916, GSK2126458, ZSTK474, dasatinib, fedratinib, dabrafenib, methotrexate, trametinib, tubastatin A, BIX02189, CP466722, afatinib, and belinostat through molecular docking analysis. Furthermore, we verified the proposed results through literature review and different databases. Finally, we examined one of the candidates masitinib to identify the anti-breast cancer effects. We found that masitinib inhibits the mTOR signaling pathway and induces apoptotic cell death. Therefore, the proposed molecular biomarkers and repurposing candidate drugs may play an important role in the diagnosis and therapy of BC.
Publicly available datasets were analyzed in this study. This data can be found here: https://www.ncbi.nlm.nih.gov/geo/query/acc.cgi?acc=GSE54002 https://www.ncbi.nlm.nih.gov/geo/query/acc.cgi?acc=GSE29431 https://www.ncbi.nlm.nih.gov/geo/query/acc.cgi?acc=GSE124646 https://www.ncbi.nlm.nih.gov/geo/query/acc.cgi?acc=GSE42568 https://www.ncbi.nlm.nih.gov/geo/query/acc.cgi?acc=GSE45827 https://www.ncbi.nlm.nih.gov/geo/query/acc.cgi?acc=GSE10810https://www.ncbi.nlm.nih.gov/geo/query/acc.cgi?acc=GSE65216 https://www.ncbi.nlm.nih.gov/geo/query/acc.cgi?acc=GSE36295 https://www.ncbi.nlm.nih.gov/geo/query/acc.cgi?acc=GSE109169.
MA, YZ, and GW designed the study. MA, AS, QL, ZH, and HR participated in the data collection. MA and AS participated in the data analyses and result validation. JW, HS, FG, and ZH performed the cellular experiments. MA drafted the manuscript. YZ and GW revised the manuscript. All authors read and approved the manuscript.
This work was supported by the National Natural Science Foundation of China (No. 32070970, 81973352, and 32000676), the Taicang Science and Technology Bureau (TC2018JCYL20), the Key Project of Natural Science Foundation of Jiangsu Provincial Higher Education Institutions (No. 21KJA180003), the China Postdoctoral Science Foundation (249658), and the Project Funded by the Priority Academic Program Development of Jiangsu Higher Education Institutions.
The authors declare that the research was conducted in the absence of any commercial or financial relationships that could be construed as a potential conflict of interest.
All claims expressed in this article are solely those of the authors and do not necessarily represent those of their affiliated organizations, or those of the publisher, the editors, and the reviewers. Any product that may be evaluated in this article, or claim that may be made by its manufacturer, is not guaranteed or endorsed by the publisher.
The Supplementary Material for this article can be found online at: https://www.frontiersin.org/articles/10.3389/fphar.2022.942126/full#supplementary-material
Agency, E. M. (2017). Refusal of the marketing authorisation for Masipro (masitinib). Available at: https://www.ema.europa.eu/en/documents/smop-initial/questions-answers-refusal-marketing-authorisation-masipro-masitinib_en.pdf.
Alam, M. S., Rahaman, M. M., Sultana, A., Wang, G., and Mollah, M. N. H. (2022a). Statistics and network-based approaches to identify molecular mechanisms that drive the progression of breast cancer. Comput. Biol. Med. 145, 105508. doi:10.1016/j.compbiomed.2022.105508
Alam, M. S., Sultana, A., Reza, M. S., Amanullah, M., Kabir, S. R., and Mollah, M. N. H. (2022b). Integrated bioinformatics and statistical approaches to explore molecular biomarkers for breast cancer diagnosis, prognosis and therapies. PLoS One 17, e0268967. doi:10.1371/journal.pone.0268967
Berman, H. M., Battistuz, T., Bhat, T. N., Bluhm, W. F., Bourne, P. E., Burkhardt, K., et al. (2002). The protein Data Bank. Acta Crystallogr. D. Biol. Crystallogr. 58, 899–907. doi:10.1107/s0907444902003451
Butti, R., Das, S., Gunasekaran, V. P., Yadav, A. S., Kumar, D., and Kundu, G. C. (2018). Receptor tyrosine kinases (RTKs) in breast cancer: Signaling, therapeutic implications and challenges. Mol. Cancer 17, 34. doi:10.1186/s12943-018-0797-x
Cao, W., Chen, H. D., Yu, Y. W., Li, N., and Chen, W. Q. (2021). Changing profiles of cancer burden worldwide and in China: A secondary analysis of the global cancer statistics 2020. Chin. Med. J. 134, 783–791. doi:10.1097/CM9.0000000000001474
Clarke, C., Madden, S. F., Doolan, P., Aherne, S. T., Joyce, H., O'Driscoll, L., et al. (2013). Correlating transcriptional networks to breast cancer survival: A large-scale coexpression analysis. Carcinogenesis 34, 2300–2308. doi:10.1093/carcin/bgt208
Dallakyan, S., and Olson, A. J. (2015). Small-molecule library screening by docking with PyRx. Methods Mol. Biol. 1263, 243–250. doi:10.1007/978-1-4939-2269-7_19
Deng, J. L., Xu, Y. H., and Wang, G. (2019). Identification of potential crucial genes and key pathways in breast cancer using bioinformatic analysis. Front. Genet. 10, 695. doi:10.3389/fgene.2019.00695
Drayman, N., DeMarco, J. K., Jones, K. A., Azizi, S. A., Froggatt, H. M., Tan, K., et al. (2021). Masitinib is a broad coronavirus 3CL inhibitor that blocks replication of SARS-CoV-2. Science 373, 931–936. doi:10.1126/science.abg5827
Edgar, R., and Barrett, T. (2006). NCBI GEO standards and services for microarray data. Nat. Biotechnol. 24, 1471–1472. doi:10.1038/nbt1206-1471
Emmert-Streib, F., de Matos Simoes, R., Mullan, P., Haibe-Kains, B., and Dehmer, M. (2014). The gene regulatory network for breast cancer: Integrated regulatory landscape of cancer hallmarks. Front. Genet. 5, 15. doi:10.3389/fgene.2014.00015
European Commission (2018). Union Register of refused medicinal products for human use [Online]. Available at: https://ec.europa.eu/health/documents/community-register/html/ho26580.htm.
FDA (2017). FDA approves dasatinib for pediatric patients with CML [Online]. Available at: https://www.fda.gov/drugs/resources-information-approved-drugs/fda-approves-dasatinib-pediatric-patients-cml.
FDA (2019). FDA approves treatment for patients with rare bone marrow disorder [Online]. Available at: https://www.fda.gov/news-events/press-announcements/fda-approves-treatment-patients-rare-bone-marrow-disorder.
Folch, J., Petrov, D., Ettcheto, M., Pedros, I., Abad, S., Beas-Zarate, C., et al. (2015). Masitinib for the treatment of mild to moderate Alzheimer's disease. Expert Rev. Neurother. 15, 587–596. doi:10.1586/14737175.2015.1045419
Gastaldi, S., Comoglio, P. M., and Trusolino, L. (2010). The met oncogene and basal-like breast cancer: Another culprit to watch out for? Breast Cancer Res. 12, 208. doi:10.1186/bcr2617
Ghaffari, K., Hashemi, M., Ebrahimi, E., and Shirkoohi, R. (2016). BIRC5 genomic copy number variation in early-onset breast cancer. Iran. Biomed. J. 20, 241–245. doi:10.7508/ibj.2016.04.009
Gruosso, T., Mieulet, V., Cardon, M., Bourachot, B., Kieffer, Y., Devun, F., et al. (2016). Chronic oxidative stress promotes H2AX protein degradation and enhances chemosensitivity in breast cancer patients. EMBO Mol. Med. 8, 527–549. doi:10.15252/emmm.201505891
Hahn, K. A., Ogilvie, G., Rusk, T., Devauchelle, P., Leblanc, A., Legendre, A., et al. (2008). Masitinib is safe and effective for the treatment of canine mast cell tumors. J. Vet. Intern. Med. 22, 1301–1309. doi:10.1111/j.1939-1676.2008.0190.x
Han, B., Yang, X., Zhang, P., Zhang, Y., Tu, Y., He, Z., et al. (2020). DNA methylation biomarkers for nasopharyngeal carcinoma. PLoS One 15, e0230524. doi:10.1371/journal.pone.0230524
Hermawan, A., Putri, H., and Utomo, R. Y. (2020). Comprehensive bioinformatics study reveals targets and molecular mechanism of hesperetin in overcoming breast cancer chemoresistance. Mol. Divers. 24, 933–947. doi:10.1007/s11030-019-10003-2
Hou, J. Z., Xi, Z. Q., Niu, J., Li, W., Wang, X., Liang, C., et al. (2019). Inhibition of PIKfyve using YM201636 suppresses the growth of liver cancer via the induction of autophagy. Oncol. Rep. 41, 1971–1979. doi:10.3892/or.2018.6928
Hussain, Y., Khan, H., Alam, W., Aschner, M., AbdullahAlsharif, K. F., et al. (2022). Flavonoids targeting the mTOR signaling cascades in cancer: A potential crosstalk in anti-breast cancer therapy. Oxid. Med. Cell. Longev. 2022, 4831833. doi:10.1155/2022/4831833
Karim, S., Merdad, A., Schulten, H. J., Jayapal, M., Dallol, A., Buhmeida, A., et al. (2016). Low expression of leptin and its association with breast cancer: A transcriptomic study. Oncol. Rep. 36, 43–48. doi:10.3892/or.2016.4806
Kim, S., Chen, J., Cheng, T., Gindulyte, A., He, J., He, S., et al. (2019). PubChem 2019 update: Improved access to chemical data. Nucleic Acids Res. 47, D1102–D1109. doi:10.1093/nar/gky1033
Ko, Y. (2020). Computational drug repositioning: Current progress and challenges. Appl. Sci. 10, 5076. doi:10.3390/app10155076
Komoto, T. T., Bernardes, T. M., Mesquita, T. B., Bortolotto, L. F. B., Silva, G., Bitencourt, T. A., et al. (2018). Chalcones repressed the AURKA and MDR proteins involved in metastasis and multiple drug resistance in breast cancer cell lines. Molecules 23, 2018. doi:10.3390/molecules23082018
Lavecchia, A., and Di Giovanni, C. (2013). Virtual screening strategies in drug discovery: A critical review. Curr. Med. Chem. 20, 2839–2860. doi:10.2174/09298673113209990001
Lee, H. Z., Kwitkowski, V. E., Del Valle, P. L., Ricci, M. S., Saber, H., Habtemariam, B. A., et al. (2015). FDA approval: Belinostat for the treatment of patients with relapsed or refractory peripheral T-cell lymphoma. Clin. Cancer Res. 21, 2666–2670. doi:10.1158/1078-0432.CCR-14-3119
Li, Z., Hou, P., Fan, D., Dong, M., Ma, M., Li, H., et al. (2017). The degradation of EZH2 mediated by lncRNA ANCR attenuated the invasion and metastasis of breast cancer. Cell Death Differ. 24, 59–71. doi:10.1038/cdd.2016.95
Liu, B., Tan, J., Wang, X., and Liu, X. (2018a). Identification of recurrent risk-related genes and establishment of support vector machine prediction model for gastric cancer. Neoplasma 65, 360–366. doi:10.4149/neo_2018_170507N326
Liu, C. J., Hu, F. F., Xia, M. X., Han, L., Zhang, Q., and Guo, A. Y. (2018b). GSCALite: A web server for gene set cancer analysis. Bioinformatics 34, 3771–3772. doi:10.1093/bioinformatics/bty411
Liu, D., Zhang, J., Li, L., Wang, Q., and Lan, Y. (2020). Detection of critical genes associated with poor prognosis in breast cancer via integrated bioinformatics analyses. J. BUON 25, 2537–2545.
Maubant, S., Tesson, B., Maire, V., Ye, M., Rigaill, G., Gentien, D., et al. (2015). Transcriptome analysis of Wnt3a-treated triple-negative breast cancer cells. PLoS One 10, e0122333. doi:10.1371/journal.pone.0122333
Miyamoto, Y., Suyama, K., and Baba, H. (2017). Recent advances in targeting the EGFR signaling pathway for the treatment of metastatic colorectal cancer. Int. J. Mol. Sci. 18, 752. doi:10.3390/ijms18040752
Navolanic, P. M., Steelman, L. S., and McCubrey, J. A. (2003). EGFR family signaling and its association with breast cancer development and resistance to chemotherapy (Review). Int. J. Oncol. 22, 237–252. doi:10.3892/ijo.22.2.237
Odogwu, L., Mathieu, L., Blumenthal, G., Larkins, E., Goldberg, K. B., Griffin, N., et al. (2018). FDA approval summary: Dabrafenib and trametinib for the treatment of metastatic non-small cell lung cancers harboring BRAF V600E mutations. Oncologist 23, 740–745. doi:10.1634/theoncologist.2017-0642
Omeljaniuk, W. J., Kretowski, R., Ratajczak-Wrona, W., Jablonska, E., and Cechowska-Pasko, M. (2021). Novel dual PI3K/mTOR inhibitor, apitolisib (GDC-0980), inhibits growth and induces apoptosis in human glioblastoma cells. Int. J. Mol. Sci. 22, 11511. doi:10.3390/ijms222111511
Pedraza, V., Gomez-Capilla, J. A., Escaramis, G., Gomez, C., Torne, P., Rivera, J. M., et al. (2010). Gene expression signatures in breast cancer distinguish phenotype characteristics, histologic subtypes, and tumor invasiveness. Cancer 116, 486–496. doi:10.1002/cncr.24805
Peng, J., Wu, A., Yu, X., Zhong, Q., Deng, X., and Zhu, Y. (2021). Combined network Pharmacology and cytology experiments to identify potential anti-breast cancer targets and mechanisms of delphinidin. Nutr. Cancer 74, 2591–2606. doi:10.1080/01635581.2021.2012582
Ritchie, M. E., Phipson, B., Wu, D., Hu, Y., Law, C. W., Shi, W., et al. (2015). Limma powers differential expression analyses for RNA-sequencing and microarray studies. Nucleic Acids Res. 43, e47. doi:10.1093/nar/gkv007
Sarveazad, A., Babahajian, A., Shamseddin, J., and Bahardoust, M. (2018). 5-Year survival rates and prognostic factors in patients with synchronus and metachronus breast cancer from 2010 to 2015. Asian pac. J. Cancer Prev. 19, 3489–3493. doi:10.31557/APJCP.2018.19.12.3489
Shannon, P., Markiel, A., Ozier, O., Baliga, N. S., Wang, J. T., Ramage, D., et al. (2003). Cytoscape: A software environment for integrated models of biomolecular interaction networks. Genome Res. 13, 2498–2504. doi:10.1101/gr.1239303
Shi, W., Chen, X., and Deng, L. (2020). A review of recent developments and progress in computational drug repositioning. Curr. Pharm. Des. 26, 3059–3068. doi:10.2174/1381612826666200116145559
Simsek, M., Meijer, B., van Bodegraven, A. A., de Boer, N. K. H., and Mulder, C. J. J. (2018). Finding hidden treasures in old drugs: The challenges and importance of licensing generics. Drug Discov. Today 23, 17–21. doi:10.1016/j.drudis.2017.08.008
Sing, T., Sander, O., Beerenwinkel, N., and Lengauer, T. (2005). Rocr: Visualizing classifier performance in R. Bioinformatics 21, 3940–3941. doi:10.1093/bioinformatics/bti623
Sinn, B. V., Fu, C., Lau, R., Litton, J., Tsai, T. H., Murthy, R., et al. (2019). SETER/PR: A robust 18-gene predictor for sensitivity to endocrine therapy for metastatic breast cancer. NPJ Breast Cancer 5, 16. doi:10.1038/s41523-019-0111-0
Song, C. M., Lim, S. J., and Tong, J. C. (2009). Recent advances in computer-aided drug design. Brief. Bioinform. 10, 579–591. doi:10.1093/bib/bbp023
Sung, H., Ferlay, J., Siegel, R. L., Laversanne, M., Soerjomataram, I., Jemal, A., et al. (2021). Global cancer statistics 2020: GLOBOCAN estimates of incidence and mortality worldwide for 36 cancers in 185 countries. Ca. Cancer J. Clin. 71, 209–249. doi:10.3322/caac.21660
Szklarczyk, D., Gable, A. L., Lyon, D., Junge, A., Wyder, S., Huerta-Cepas, J., et al. (2019). STRING v11: Protein-protein association networks with increased coverage, supporting functional discovery in genome-wide experimental datasets. Nucleic Acids Res. 47, D607–D613. doi:10.1093/nar/gky1131
Tan, T. Z., Miow, Q. H., Miki, Y., Noda, T., Mori, S., Huang, R. Y., et al. (2014). Epithelial-mesenchymal transition spectrum quantification and its efficacy in deciphering survival and drug responses of cancer patients. EMBO Mol. Med. 6, 1279–1293. doi:10.15252/emmm.201404208
Tang, Z., Li, C., Kang, B., Gao, G., Li, C., and Zhang, Z. (2017). GEPIA: A web server for cancer and normal gene expression profiling and interactive analyses. Nucleic Acids Res. 45, W98-W102–W102. doi:10.1093/nar/gkx247
Torre, L. A., Bray, F., Siegel, R. L., Ferlay, J., Lortet-Tieulent, J., and Jemal, A. (2015). Global cancer statistics, 2012. Ca. Cancer J. Clin. 65, 87–108. doi:10.3322/caac.21262
Trott, O., and Olson, A. J. (2010). AutoDock vina: Improving the speed and accuracy of docking with a new scoring function, efficient optimization, and multithreading. J. Comput. Chem. 31, 455–461. doi:10.1002/jcc.21334
Wang, Y., Zhang, Y., Huang, Q., and Li, C. (2018). Integrated bioinformatics analysis reveals key candidate genes and pathways in breast cancer. Mol. Med. Rep. 17, 8091–8100. doi:10.3892/mmr.2018.8895
Wang, Z., Hu, S., Li, X., Liu, Z., Han, D., Wang, Y., et al. (2021). MiR-16-5p suppresses breast cancer proliferation by targeting ANLN. BMC Cancer 21, 1188. doi:10.1186/s12885-021-08914-1
Xiao, X., Zhang, Z., Luo, R., Peng, R., Sun, Y., Wang, J., et al. (2021). Identification of potential oncogenes in triple-negative breast cancer based on bioinformatics analyses. Oncol. Lett. 21, 363. doi:10.3892/ol.2021.12624
Xiu, Y., Liu, W., Wang, T., Liu, Y., and Ha, M. (2019). Overexpression of ECT2 is a strong poor prognostic factor in ER(+) breast cancer. Mol. Clin. Oncol. 10, 497–505. doi:10.3892/mco.2019.1832
Yu, G., Wang, L. G., Han, Y., and He, Q. Y. (2012). clusterProfiler: an R package for comparing biological themes among gene clusters. OMICS 16, 284–287. doi:10.1089/omi.2011.0118
Yu, Z., He, Q., and Xu, G. (2020). Screening of prognostic factors in early-onset breast cancer. Technol. Cancer Res. Treat. 19, 1533033819893670. doi:10.1177/1533033819893670
Zeng, X., Shi, G., He, Q., and Zhu, P. (2021). Screening and predicted value of potential biomarkers for breast cancer using bioinformatics analysis. Sci. Rep. 11, 20799. doi:10.1038/s41598-021-00268-9
Zhang, S., Wang, Y., Cao, Y., Wu, J., Zhang, Z., Ren, H., et al. (2022). Inhibition of the PINK1-parkin pathway enhances the lethality of sorafenib and regorafenib in hepatocellular carcinoma. Front. Pharmacol. 13, 851832. doi:10.3389/fphar.2022.851832
Zhou, G., Soufan, O., Ewald, J., Hancock, R. E. W., Basu, N., and Xia, J. (2019). NetworkAnalyst 3.0: A visual analytics platform for comprehensive gene expression profiling and meta-analysis. Nucleic Acids Res. 47, W234–W241. doi:10.1093/nar/gkz240
Keywords: Breast cancer, gene expression profiles, molecular targets, bioinformatics and network-based discovery, molecular docking analysis, drug repurposing, apoptotic cell death
Citation: Alam MS, Sultana A, Sun H, Wu J, Guo F, Li Q, Ren H, Hao Z, Zhang Y and Wang G (2022) Bioinformatics and network-based screening and discovery of potential molecular targets and small molecular drugs for breast cancer. Front. Pharmacol. 13:942126. doi: 10.3389/fphar.2022.942126
Received: 12 May 2022; Accepted: 29 August 2022;
Published: 20 September 2022.
Edited by:
Monde Ntwasa, University of South Africa, South AfricaReviewed by:
Mustafa Ozen, Baylor College of Medicine, United StatesCopyright © 2022 Alam, Sultana, Sun, Wu, Guo, Li, Ren, Hao, Zhang and Wang. This is an open-access article distributed under the terms of the Creative Commons Attribution License (CC BY). The use, distribution or reproduction in other forums is permitted, provided the original author(s) and the copyright owner(s) are credited and that the original publication in this journal is cited, in accordance with accepted academic practice. No use, distribution or reproduction is permitted which does not comply with these terms.
*Correspondence: Zongbing Hao, aGFvemI4MzVAMTI2LmNvbQ==; Yi Zhang, emhhbmd5aUBzdWRhLmVkdS5jbg==; Guanghui Wang, d2FuZ2doQHN1ZGEuZWR1LmNu
†These authors have contributed equally to this study
Disclaimer: All claims expressed in this article are solely those of the authors and do not necessarily represent those of their affiliated organizations, or those of the publisher, the editors and the reviewers. Any product that may be evaluated in this article or claim that may be made by its manufacturer is not guaranteed or endorsed by the publisher.
Research integrity at Frontiers
Learn more about the work of our research integrity team to safeguard the quality of each article we publish.