- 1College of Chemistry and Pharmaceutical Engineering, Hebei University of Science and Technology, Shijiazhuang, China
- 2College of Pharmacy, Hebei Medical University, Shijiazhuang, China
- 3Hebei Institute of Drug and Medical Device Inspection, Shijiazhuang, China
A reliable and rapid method employing QuEChERS (Quick, Easy, Cheap, Effective, Rugged, and Safe) pretreatment coupled with ultra-performance liquid chromatography–tandem mass spectrometry (UPLC–MS/MS) was successfully developed and validated for the analysis of nine tyrosine kinase inhibitors (TKIs) in human plasma. Biological samples were extracted with acetonitrile and salted out with 350 mg of anhydrous magnesium sulfate (MgSO4), followed by purification with 40 mg of ethyl enediamine-N-propylsilane (PSA) adsorbents. All analytes and internal standards (IS) were separated on the Hypersil GOLD VANQUISH C18 (2.1 mm × 100 mm, 1.9 μM) column using the mobile phases composed of acetonitrile (phase A) and 0.1% formic acid in water (phase B) for 8.0 min. Detection was performed by selection reaction monitoring (SRM) in the positive ion electrospray mode. Lenvatinib, sorafenib, cabozantinib, apatinib, gefitinib, regorafenib, and anlotinib rendered good linearity over the range of 0.1–10 ng/ml, and 1–100 ng/ml for tivantinib and galunisertib. All linear correlation coefficients for all standard curves were ≥ 0.9966. The limits of detection (LOD) and the limits of quantitation (LOQ) ranged from 0.003 to 0.11 ng/ml and 0.01–0.37 ng/ml, respectively. The method was deemed satisfactory with an accuracy of -7.34–6.64%, selectivity, matrix effect (ME) of 90.48–107.77%, recovery, and stability. The proposed method is simple, efficient, reliable, and applicable for the detection of TKIs in human plasma samples as well as for providing a reference for the clinical adjustment of drug administration regimen by monitoring the drug concentrations in the plasma of patients.
1 Introduction
Cancer is a major public health issue across the world, with the associated global burden increasing dramatically owing to the aging of the population, environmental degradation, and undesirable lifestyle behaviors such as smoking and alcoholism (Noorolyai et al., 2019; Wu et al., 2019; Bray et al., 2020). Hepatocellular carcinoma (HCC) is a common malignant tumor with insidious onset, rapid progression, early recurrence, and poor prognosis, as well as consistently high rates of incidence and mortality (Dutta and Mahato, 2017).
Tyrosine kinase inhibitors (TKIs) are small molecule-targeted drugs that target receptor tyrosine kinases. Their action mechanism is based on competing with adenosine triphosphate (ATP) for binding to the ATP-binding site of the kinase domain in order to block or reduce the phosphorylation of tyrosine kinase and, ultimately, exert anti-tumor effects (Cammarota et al., 2022; Yang et al., 2022; Yao et al., 2022). TKIs are widely used in the treatment of small-cell lung cancer (SCLC) (Hwang et al., 2021), non-small cell lung cancer (NSCLC) (Lin et al., 2022; Ten et al., 2022), gastrointestinal mesenchymal tumor (GIST) (Mohammadi and Gelderblom, 2021; Foo et al., 2022; Klug et al., 2022), hepatocellular liver cancer (HCC) (Decraecker et al., 2021), renal cancer (RCC) (Fogli et al., 2020; Pedersen et al., 2021), and other cancers owing to their high selectivity and low adverse effects when compared with those of the traditional cytotoxic anticancer drugs (Xing et al., 2021). Sorafenib is the first first-line oral small molecule TKI approved by the U.S. Food and Drug Administration (FDA) for HCC, ushering in a new era of molecular targeting in HCC (Di et al., 2013; Decraecker et al., 2021). Sorafenib has been followed by other targeted drug studies in search of breakthroughs in molecularly targeted drug therapy for HCC. Currently, the first-line targeted agents include sorafenib and lenvatinib, while the second-line targeted agents for HCC include regorafenib and cabozantinib (Zhao et al., 2020; El-Khoueiry et al., 2021). In addition, results from a randomized, placebo-controlled, double-blind phase-III study of apatinib as the second-line treatment of Chinese patients with advanced HCC demonstrated that apatinib could significantly prolong the survival time of first-line resistant patients with advanced HCC and that it was well tolerated by patients in a safe and manageable manner (Qin et al., 2020; Qin et al., 2021). Tivantinib has been reported to downregulate the MET activity and the expression of downstream signaling pathways in tumor biopsy specimens (Rimassa et al., 2018). The safety and efficacy of galunisertib in combination with sorafenib have been reported in several publications (Yingling et al., 2018; Wick et al., 2020). In addition, it has been reported that the combination of gefitinib treatment for patients with intermediate to advanced HCC who failed to respond to lenvatinib treatment could effectively inhibit the progression of HCC (Jin et al., 2021), while anlotinib has also been demonstrated to be effective in the treatment of intermediate to advanced HCC (Guo et al., 2020). Therefore, all of the nine TKIs mentioned earlier exhibited anti-hepatocellular carcinogenic effects.
A recent review suggested that the specific metabolism (supporting the therapeutic schedule of 3 weeks on and 1 week off/month) of regorafenib may affect the blood levels and therapeutic efficacy (Granito et al., 2021). Patients with HCC may suffer from adverse events or serious adverse events associated with drug therapy owing to drug resistance and drug toxicity. An overview of the study on lenvatinib reported that 82% of patients in the trial reduced their dose or stopped treatment because of adverse effects (Rehman et al., 2021). Patients with mild or moderate renal and hepatic impairment may need to be closely monitored, according to a report of cabozantinib (D'Angelo et al., 2020). It is recommended that tivantinib requires monitoring of therapeutic agents in order to adjust the administered dose on time (Maharati et al., 2022). Therefore, monitoring the above nine TKIs have a significant meaning to improve drug efficacy and safety. It is necessary to develop a reliable, rapid, and sensitive method to monitor the concentration of anti-HCC drugs in order to facilitate clinical medication guidance.
Currently, the analysis of small-molecule tyrosinase inhibitors is mostly performed by liquid chromatography coupled with mass spectrometry (LC-MS), albeit the assay requires a good matrix effect (ME) of the sample. Accordingly, a suitable pretreatment technique needs to be selected to improve the purification efficiency and reduce the effect of the impurities. Based on the detection of TKIs, the commonly used pretreatment techniques include protein precipitation (PP) (Tibben et al., 2019; Ferrer et al., 2020; Iacuzzi et al., 2020; Krens et al., 2020; Aghai et al., 2021), liquid-liquid extraction (LLE) (Ni et al., 2017; Guan et al., 2019; Ezzeldin et al., 2020), salinization-assisted liquid-liquid extraction (SALLE) (Zhou et al., 2021), and solid-liquid extraction (SLE) (Sueshige et al., 2021), among others. While QuEChERS is an emerging pretreatment technique derived from dispersive solid-phase extraction (dSPE), it was initially applied in the field of pesticide residues. Recently, it was applied to the analysis of metabolites and other compounds in biological matrices, such as plasma and urine in parallel with the advancements in this technique.
In this study, we developed and validated the UPLC-MS/MS method combined with an emerging preprocessing technology QuEChERS (Quick, Easy, Cheap, Effective, Rugged, and Safe) for the detection of nine anti-HCC TKIs, including lenvatinib (LEN), sorafenib (SOR), cabozantinib (CBZ), apatinib (APA), gefitinib (GEF), regorafenib (RGF), anlotinib (ANL), tivantinib (TIV), and galunisertib (GAL).
2 Materials and Methods
2.1 Chemicals and Reagents
A total of nine TKIs standard substances were purchased from the Shanghai Yuanye Biotechnology Co., Ltd. (Shanghai, China). Propranolol was supplied by the China National Institute for China Drug and Biological Products Control. HPLC-grade methanol (MeOH), ethyl acetate (EtOAc), and acetone (CP) were purchased from Merck Drugs & Biotechnology (Darmstadt, Germany). HPLC-grade formic acid (FA) and acetic acid (HOAc) were purchased from Dikma (Beijing, China); LC/MS-grade acetonitrile (ACN) was acquired from ThermoFisher Scientific (Shanghai, China). Analytical-grade anhydrous magnesium sulfate (MgSO4) was purchased from the Tianjin Damao Chemical Reagent Factory (Tianjin, China). Octadecyl bonded silicagel (C18), florisil adsorbents, and graphitized carbon black (GCB) were supplied by Agela Technologies (Tianjin, China). NH2 and ethyl enediamine-N-propylsilane (PSA) were purchased from Agilent Technologies (Shanghai, China).
2.2 Instrument
Vanquish Flex Ultra-performance Liquid Chromatography (UPLC) and TSQ Altis Triple Quadrupole Mass Spectrometer (MS) (Thermo Fisher Scientific, United States), nitrogen blowing concentrator (Beijing Politech Instrument Co., Ltd., China), High-speed Refrigerated Centrifuge (Yancheng Kait Experimental Equipment Co., Ltd. China), Vortex Meter (Wiggens, Germany), Milli-Q Purification System (Millipore, United States), KQ-500E Ultrasonic Cleaner (Kunshan Ultrasonic Instrument Co., Ltd. China), and Electronic analytical balance (Mettler Toledo, United States).
2.3 Mass Conditions
The MS was operated in the positive ionization mode with electrospray ionization (ESI) and selection reaction monitoring (SRM) to analyze all compounds. Xcalibur software (Thermo Fisher Scientific) was applicated for data acquisition and processing. The ion source parameters were set as follows: the ionspray voltage was 3500 V, the sheath gas was 45 Arb, the aux gas was 10 Arb, the ion transfer tube temperature was 350°C, and the vaporizer temperature was 400°C. Argon at a pressure of 1.5 mTorr as collision gas for collision-induced dissociation (CID). In this method, the dwell time for per transition was 100 ms. The precursor ions and product ions of each compound, the fragmentor voltage, collision energy, and retention time are displayed in Table 1.
2.4 Chromatographic Conditions
Separation and analysis were achieved using the Hypersil GOLD VANQUISH C18 column (100 μM × 2.1 μM; 1.9 μM), and the mobile phase was acetonitrile (phase A) and 0.1% formic acid in water (phase B). The gradient elution was performed as follows: for the first 0.5 min, the mobile phase B was 85%, then the proportion of mobile phase B was decreased from 85 to 5% at 0.5–2 min and held for 4 min, the mobile phase B was restored to 85% within 1 min, and then equilibrated for 1 min in the final. The analytical runtime was 8 min, the flow rate was 0.3 ml/min, and the injection volume for analysis was 5 μL.
2.5 Stock Solutions, Working Solutions, and Quality Control Samples
The stock solutions of sorafenib, cabozantinib, gefitinib, regorafenib, anlotinib, tivantinib, galunisertib (1 mg/ml), lenvatinib (800 μg/ml), and IS (500 μg/ml) were prepared in methanol at room temperature and maintained at -20°C until further use.
Different concentrations of the mixing working stock solutions (100, 10, and 1 µg/ml) were prepared by dilution of the stock solutions in methanol and stored at −20°C until use. The mixed working solutions were diluted with methanol in a certain proportion to prepare a series of calibration curve samples, ranging in concentration from 0.1 to 100 ng/ml (LEN, SOR, CBZ, RGF, APA, GEF, ANL: 0.1, 0.2, 0.5, 1, 2, 5, 8, and 10 ng/ml; TIV, GAL: 1, 2, 5, 10, 20, 50, 80, and 100 ng/ml). The concentration of the final IS solution was 5 ng/ml.
Blank human plasma (200 μL) was spiked with a certain concentration of the mixed working solution (10 μL) in order to obtain the quality control (QC) samples. The low QC (LQC), the medium QC (MQC), and the high QC (HQC) samples were set at 0.2, 5, and 10 ng/ml concentration (TIV and GAL) and at 2, 50, and 100 ng/ml concentration (LEN, SOR, CBZ, RGF, APA, GEF, and ANL), respectively. All working solutions were stored in a polypropylene (PP) centrifuge tube at −20°C until further analyses.
2.6 Sample Preparation
The blood of healthy people and hepatocellular carcinoma patients were obtained from the Bethune International Peace Hospital (Hebei, China) to serve as a control.
The received blood samples were centrifuged for 10 min at 3,500 × g at 4°C, and the supernatant was separated in a PP centrifuge tube and stored at −20°C. The plasma was removed before use and then thawed at room temperature. After vortex for 1 min, 200 μL of the plasma sample was added to a 4-ml centrifuge tube, to which 10 μL of the 5 ng/ml IS solution was added and mixed for 10 s. Subsequently, the samples were added to 1.5 ml of acetonitrile for extraction and vortexed for 30 s. Then, 350 mg of the MgSO4 and 40 mg of the PSA were added respectively for salting out and purification. After vortexing for 30 s, the samples were centrifuged at 12,000 × g for 10 min. Then, 1 ml of the supernatant was filtered through a 0.22-µM microporous membrane and transferred into a centrifugal tube, followed by blowing with nitrogen at room temperature until dry. In the final step, the dried extracts were redissolved in 200 μL of the methanol solution and 5 μL of the final solution was injected into the UPLC-MS/MS system.
2.7 Method Validation
The established methods were validated in terms of selectivity, linearity, precision, accuracy, stability, and MEs based on the bioanalytical method validation guidelines by the US Food and Drug Administration (FDA) (U.S., 2018).
2.7.1 Selectivity
The selectivity of the method was evaluated by analyzing six blank blood samples from diverse individuals and six lower limits of quantitation (LLOQ) samples. The resulting chromatograms were compared and the response of interfering components was set to < 20% of the response of the analytes and < 5% of the response of IS (Verougstraete et al., 2021).
2.7.2 Calibration Curve and Lower Limit of the Quantification
Standard samples in different concentration ranges were obtained following “sample preparation” as detailed in Section 2.6. The concentration of the analytes was set as the horizontal coordinate (X) and the peak area ratio of the analytes to the internal standard as the vertical coordinate (Y). Then the calibration curves were assessed by a linearly weighted (1/x2) least-squares linear regression analysis (Fresnais et al., 2020). The correlation coefficient (R2) was > 0.990. The concentration of the calibration standard samples were based on the calibration curve, each calibration level was set to within ±15% of the nominal value, and the LLOQ was accepted for a ±20% range (He et al., 2017).
The limit of detection (LODs) and the limit of quantitation (LOQs) of the instrument was defined by the S/N (signal-to-noise ratio) (Kocan et al., 2018). The S/N of LODs was set to ≥ 3 and the S/N of LOQs to ≥ 10.
2.7.3 Precision and Accuracy
Intra-day precision and accuracy of the method were obtained by analyzing the QC samples at three different levels (i.e., LQC, MQC, and HQC) and the LLOQ samples using six replicates on the same day. The inter-day accuracy and precision were evaluated on three consecutive days (Ferrer et al., 2020). Precision was expressed in terms of relative standard deviation (RSD) and accuracy in terms of relative error (RE). For each QC level, the RSD value was required to be < 15% and the deviation of the RE value was set to be within ±15%. For the LLOQ, the RSD was set to < 20% and RE within ±20% (Reis et al., 2018).
2.7.4 Recovery and MEs
To ensure efficient recovery, six replicates of the three analyte concentration levels (i.e., LQC, MQC, and HQC) and one IS concentration level (5 ng/ml) were assessed. The analytical results of the blank plasma spiked with analyte after extraction (A) were compared to the samples spiked with the analyte before extraction (B). The extent of recovery in this experiment was evaluated based on the ratio of the analytes’ peak area to the IS area: (A/B) × 100% (Aghai et al., 2021).
The ratio of the peak area to the internal standard area was compared with QC samples (C) and the matrix-free samples(D). The ME of the QuEChERS-UPLC-MS/MS method was calculated as follows: C/D × 100%, and the RSD was set to be < 15% (Ogawa-Morita et al., 2017; Zheng et al., 2021).
2.7.5 Stability
Stability assessments under different conditions were conducted for the QC (low- and high-concentration) samples, namely at room temperature (25°C) for 24 h, under refrigeration (4°C) for 48 h, in an autosampler for 72 h, under −20°C for 15 days, and in three different freeze-thaw cycles (−20°Cto room temperature); three parallel samples were set for each concentration and then tested. If the RSD was < 15%, stability was considered to be acceptable.
3 Results and Discussion
3.1 Comparison of the Preprocessing Methods
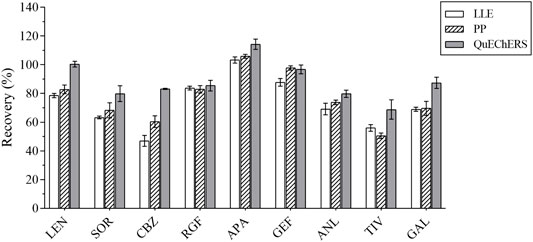
At the same spiked level, the effects of two frequently used pretreatment methods, that is, LLE and PP, and the emerging pre-treatment method QuEChERS on analyte recovery were evaluated. The recovery of the analytes in these three pretreatment methods is illustrated in Figure 1.
The QuEChERS purification method was performed according to the “sample preparation” method, as detailed in Section 2.6. Pure acetonitrile was used for PP. The IS solution (10 μL of 5 ng/ml) and 10 μL of the standard solution were added to the blank plasma sample and mixed for 30 s, followed by the use of 1 ml acetonitrile for PP. These results revealed that the acetonitrile PP method was efficient and convenient, although its purification effect was not ideal. Methyl tert-butyl ether was used for LLE, and 10 μL of the IS solution (5 ng/ml) and 10 μL of the standard solution were added to the blank plasma sample and mixed for 30 s, after which 1 ml of methyl tert-butyl ether was added for LLE. The recovery rates of several methods ranged from 47.85 to 95.01%. For instance, when compared with LLE and acetonitrile PP, the QuEchERs method revealed a higher recovery rate for most analytes, just as for the plasma samples used in this study. Accordingly, the QuEchERs method was selected for the pretreatment of plasma samples in this study.
3.2 Optimization of Preprocessing Methods
3.2.1 Optimization of the Extraction Conditions
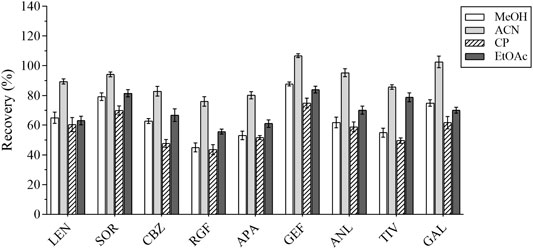
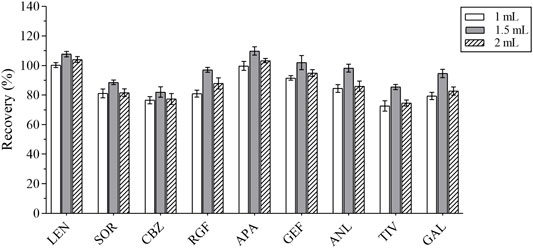
In the first place, the varieties and amounts of extraction solvents were optimized. Methanol, acetonitrile, ethyl acetate, and acetone were the commonly used extraction solvents (Perestrelo et al., 2019; Kanu et al., 2021; Chen et al., 2021). The recovery results were applied to evaluate the extraction effect of several organic solvents. Equal amounts of the intended analytes and 1 ml of the abovementioned organic solvents were then added; the experimental results revealed that the peak shape and the extraction effect of acetonitrile were better than that of the other solvents; the recovery results are shown in Figure 2. The extraction efficiency of this method was affected by the amount of extraction solvent and the addition of different volumes of acetonitrile (i.e., 1, 1.5, and 2 ml) respectively. The results are presented in Figure 3. The best extraction effect was achieved with the addition of 1.5 ml acetonitrile. Therefore, 1.5 ml of acetonitrile was selected for the extraction of these TKIs.
3.2.2 Optimization of Salting-Out Conditions
The composition of the human plasma matrix is complex and majorly attributable to water, which affects the determination of analytes and causes unnecessary loss to the MS. In this study, anhydrous MgSO4 was selected as the salting-out agent, and its dosage was optimized; the recovery of each analyte served as the evaluation index. Different masses of anhydrous MgSO4 (i.e., 250, 300, 350, 400, and 450 mg) were added for the experiments under the same spiking level (Figure 4). The best recovery of each analyte was obtained with 350 mg of anhydrous MgSO4.
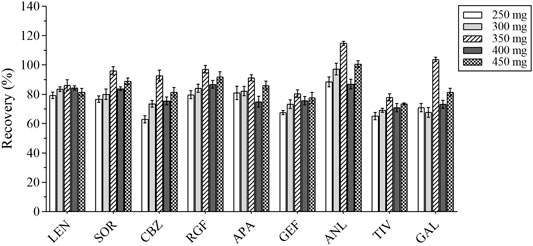
FIGURE 4. The recovery results of all analytes with different masses of anhydrous magnesium sulfate.
3.2.3 Optimization of the Adsorption Conditions
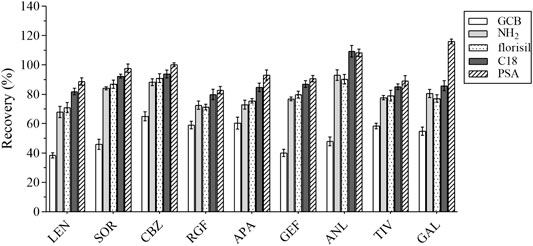
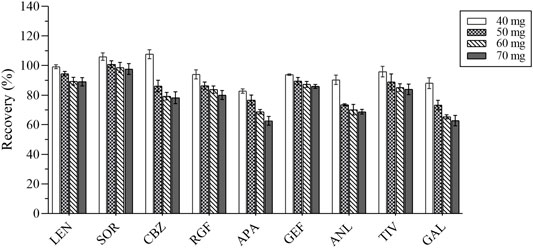
The composition of the plasma is complex, including proteins, lipids, inorganic salts, and amino acids, all of which can influence the MEs. In this study, five adsorbents were selected, including ethyl enediamine-N-propylsilane (PSA), florisil, octadecyl bonded silica gel (C18), NH2, and graphitized carbon black (GCB). Their results were compared based on the recovery rate (Figure 5). GCB exhibited poor purification results outcome not deemed suitable for plasma purification. In contrast, PSA exhibited the best results and was hence recommended for the removal of sugars, fatty acids, and organic acids (Niu et al., 2020). Various amounts of PSA (i.e., 40, 50, 60, and 70 mg) were selected as the optimum amount of the salting-out agent for this assay. The experimental results were compared by recovery and are shown in Figure 6. Therefore, 40 mg of PSA was selected as the optimal amount of adsorbent in the QuEChERS pretreatment method.
3.3 Optimization of the Mass Spectrometric
All analytes and IS (1 μg/ml) were directly injected via a needle pump and scanned in the positive ion mode and negative ion mode. We found that the response of each substance was higher in the positive ion mode. Accordingly, nine TKIs were analyzed in the positive ion mode. One quantitative ion and one qualitative ion were selected for each substance. The product spectra and the proposed fragmentation patterns of each analyte and IS are depicted in Figure 7.

FIGURE 7. The product ion spectra of [M+H]+ of lenvatinib (A), sorafenib (B), cabozantinib (C), regorafenib (D), apatinib (E), gefitinib (F), anlotinib (G), tivantinib (H), galunisertib (I) and IS (J), and their chemical structures.
3.4 Optimization of the Chromatographic Conditions
In this experiment, we attempted to compare the separation performance of 4 columns, which included the Agilent Poroshell 120 EC-C18 (3.0 mm × 50 mm, 2.7 μM) column, Hypersil GOLD VANQUISH C18 (2.1 mm × 100 mm, 1.9 μM) column, the Agilent Eclipse Plus C18 (3.0 mm × 100 mm, 1.8 μM) column, and Agilent Eclipse Plus C18 (4.6 mm × 100 mm, 3.5 μM) column. The columns were evaluated under moderate concentrations of QC samples. The results revealed that the Agilent Poroshell 120 EC-C18 column gave a good peak shape, but a relatively concentrated peak time. The Hypersil GOLD VANQUISH C18 columns were found to be good for the analysis of each determinant, with good separation performance and peak shape. The Agilent Eclipse Plus C18 (3.0 mm × 100 mm, 1.8 μM) column could not separate the analytes adequately owing to the small difference in the polarity of the analytes, resulting in poor peak shape. On the other hand, the Agilent Eclipse Plus C18 (4.6 mm × 100 mm, 3.5 μM) column was longer, and the analytes were slower to the peak. According to the experimental results, the Hypersil GOLD VANQUISH C18 column was selected for use as the analytical column in this experiment.
Moreover, the effects of different combinations of organic and aqueous phases on the peak shapes and response values of the analytes were investigated. Methanol and acetonitrile were examined and the response of the analytes was found to be slightly higher with acetonitrile as the organic phase. Subsequently, different aqueous phases were examined (e.g., water, 0.1% formic acid with water, and 0.1% acetic acid with water), and the results revealed that the optimal mobile phase was 0.1% formic acid water and acetonitrile.
3.5 Method Validation
3.5.1 Selectivity
In the analysis of blank plasma samples, no interfering peaks from the endogenous substances were detected. Among these, the method was exclusively selective for the TKIs and IS. The representative chromatograms for the LLOQ and blank plasma samples are shown in Figure 8. The retention time for LEN, SOR, CBZ, RGF, APA, GEF, ANL, TIV, GAL and IS were 2.80, 3.67, 3.10, 3.72, 3.03, 2.74, 2.78, 3.46, 1.30, and 3.05 min, respectively.
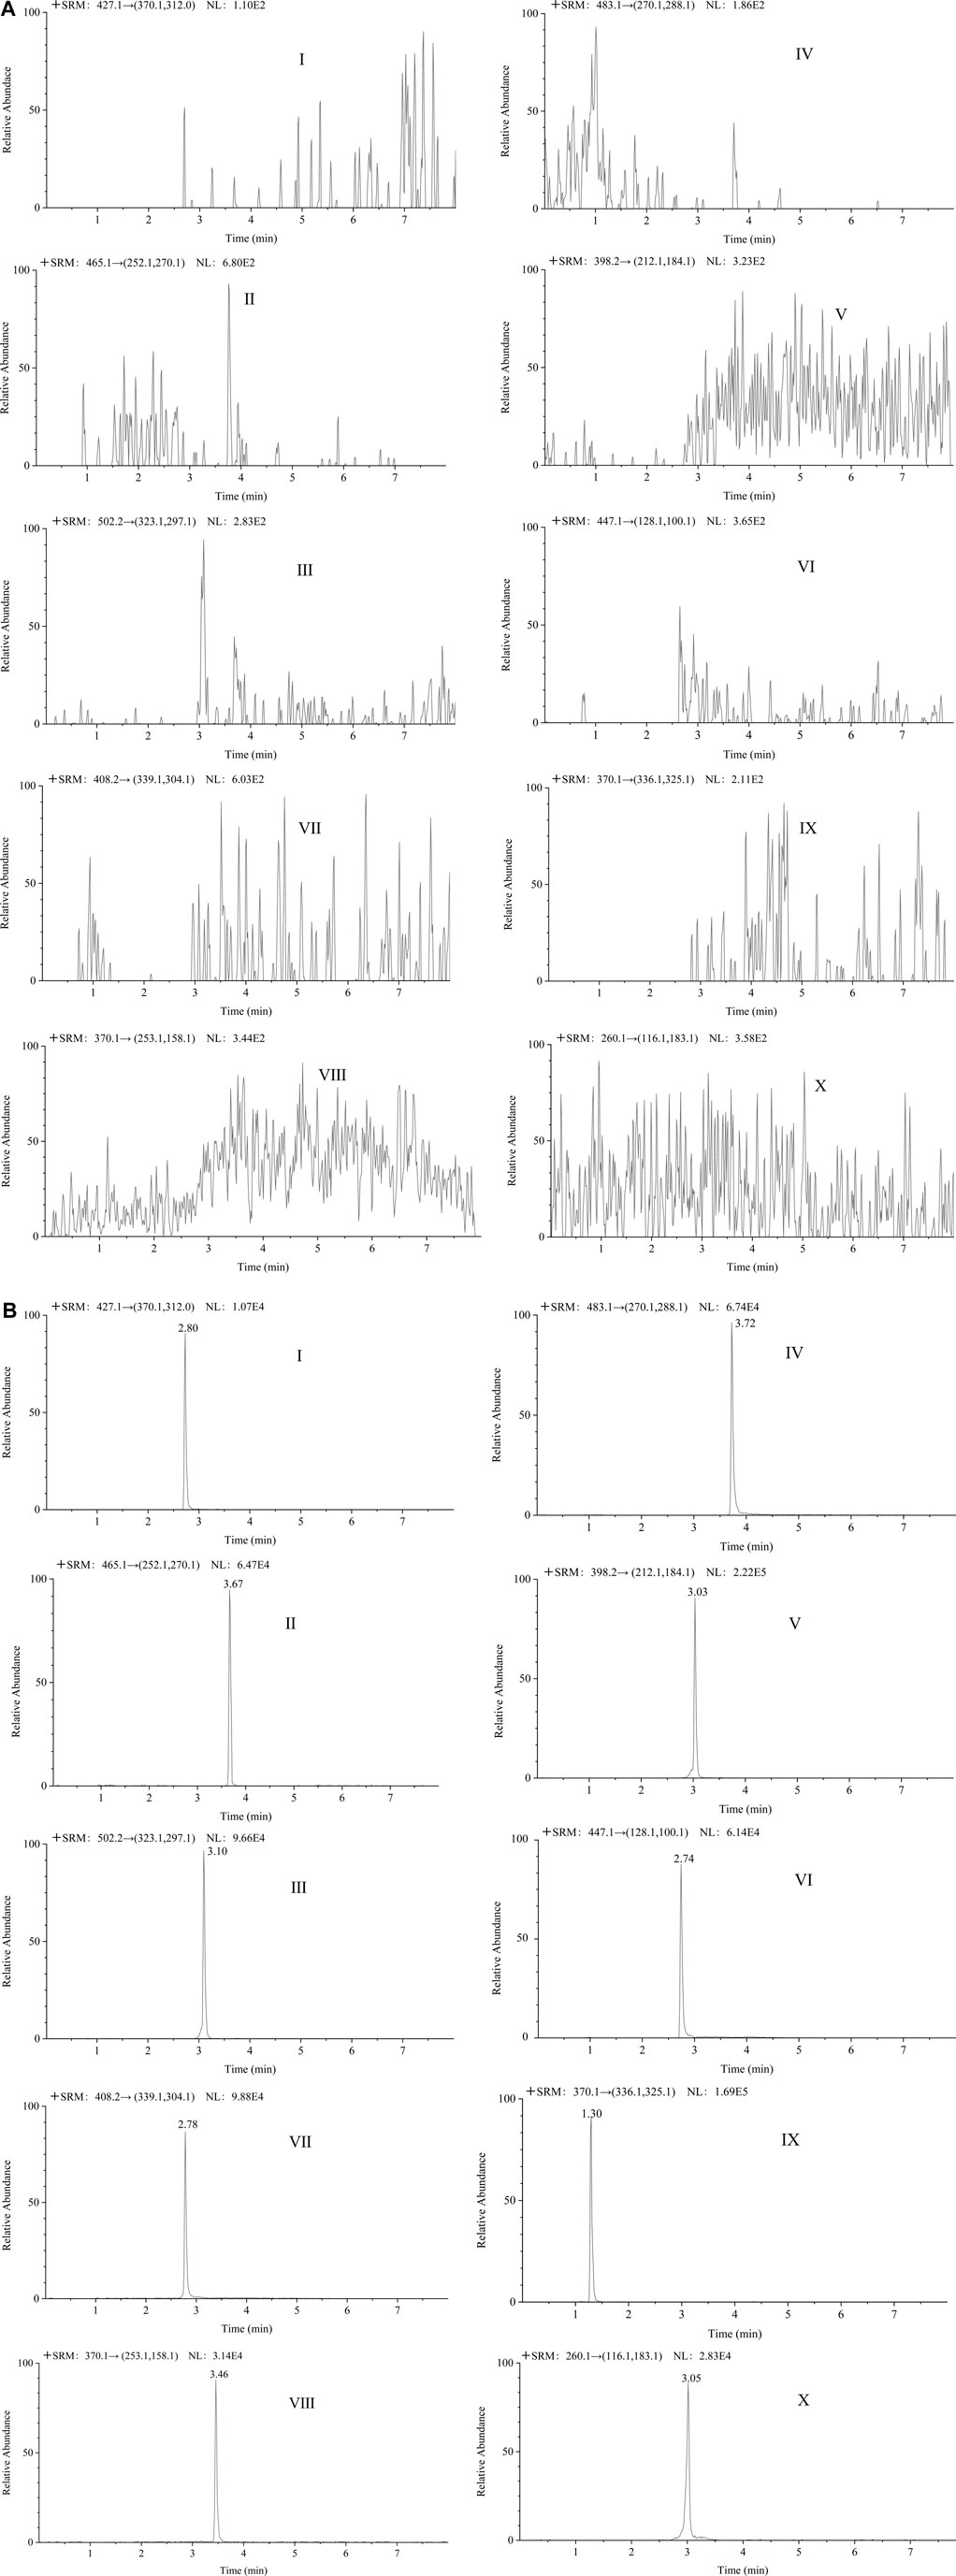
FIGURE 8. The representative chromatograms of lenvatinib (Ⅰ), sorafenib (Ⅱ), cabozantinib (Ⅲ), regorafenib (Ⅳ), apatinib (Ⅴ), gefitinib (Ⅵ), anlotinib (Ⅶ), tivantinib (Ⅷ), galunisertib (Ⅸ), and IS (Ⅹ) in blank plasma samples (A); each analyte in LLOQ samples (B).
3.5.2 Calibration Curve and the Lower Limit of Quantification
The calibration curve of nine TKIs exhibited satisfactory linearity over the range of 0.1–10 ng/ml for lenvatinib, sorafenib, cabozantinib, apatinib, gefitinib, regorafenib, and anlotinib, and that of 1–100 ng/ml for tivantinib and galunisertib, while the linear correlation coefficients (R2) of all analytes was 0.9966–0.9999. The linearity, LODs, and LOQs of the nine analytes are shown in Table 2. LODs and LOQs indicated the sensitivity of the assay, the final results showed that the LODs of these analyzed hepatic agents targeting antineoplastic drugs were 0.003–0.11 ng/ml and the LOQs as 0.01–0.37 ng/ml, respectively. Therefore, the method was determined to be sufficiently sensitive for application in quantitative analyses.
3.5.3 Precision and Accuracy
The results of intra-day and inter-day precision and accuracy at different concentration levels are depicted in Table 3. The precision for all TKIs was < 9.09%, whereas the accuracy value was -7.34–6.64%. Thus, this assay was deemed suitable for the detection of these nine TKIs with satisfying accuracy and precision at different concentration levels (LQC, MQC, HQC, and LLOQ).
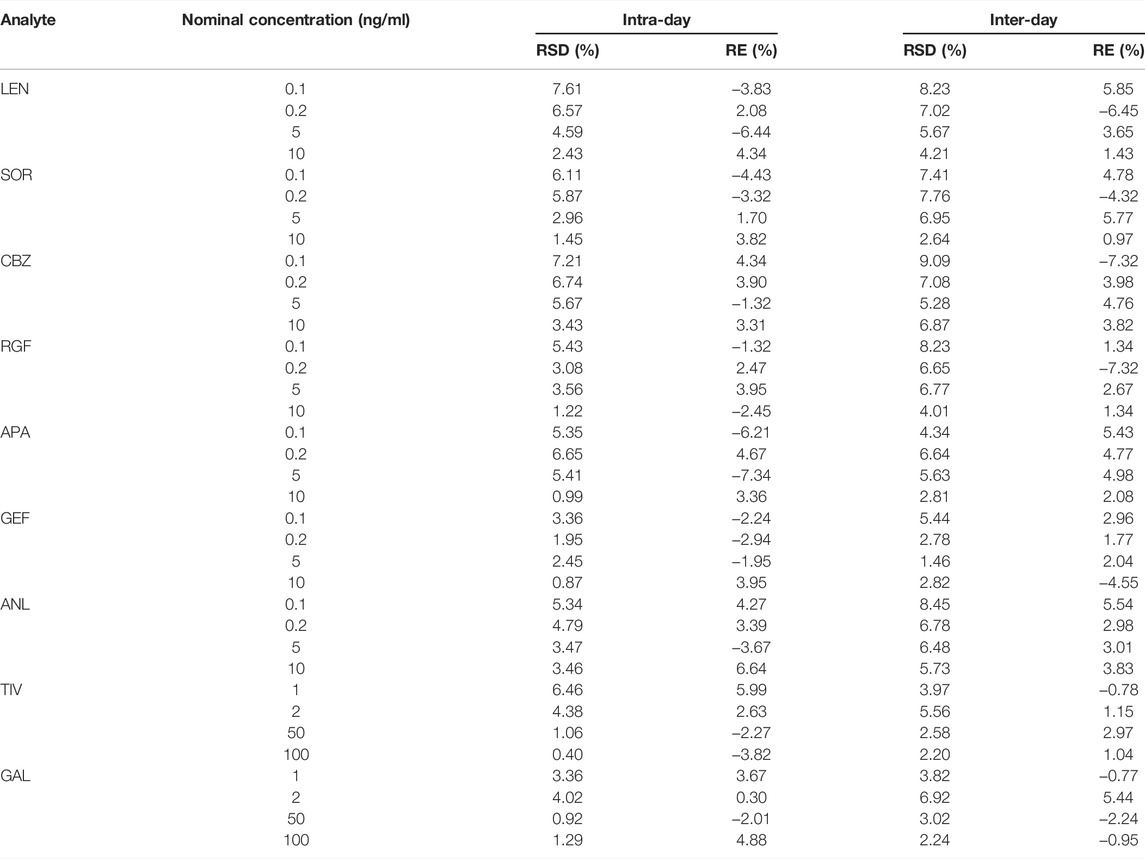
TABLE 3. Results for intra-day and inter-day precision (RSD) and accuracy (RE) of QC and LLOQ samples (n = 6).
3.5.4 MEs and Recovery
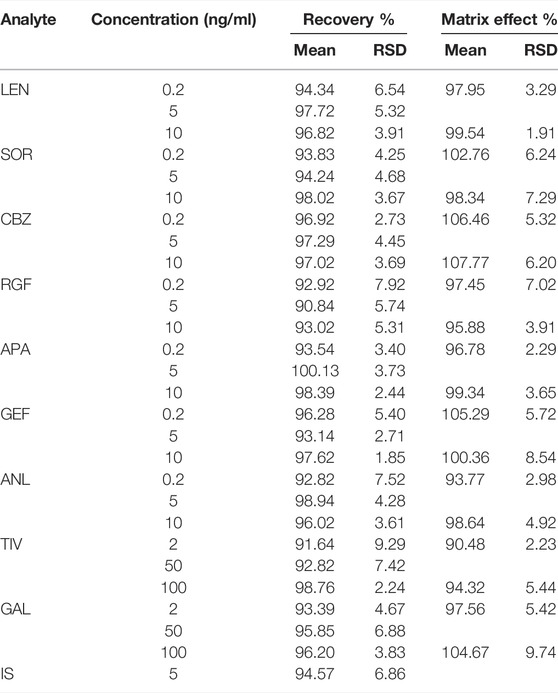
The recovery outcomes and MEs are depicted in Table 4. The recoveries of nine analytes at different concentrations ranged from 90.84 to 100.13%, and the RSD values were 1.85–9.29%. The recoverie of IS was 94.57%, and the RSD value was 6.86%. These results indicated a high extraction efficiency for nine TKIs. The MEs for all analytes ranged from 90.48 to 107.77% at the LQC and HQC levels, and the normalized matrix factors of the internal standard were determined by RSD to be < 9.74%. Therefore, the ME of the established method was negligible.
3.5.5 Stability
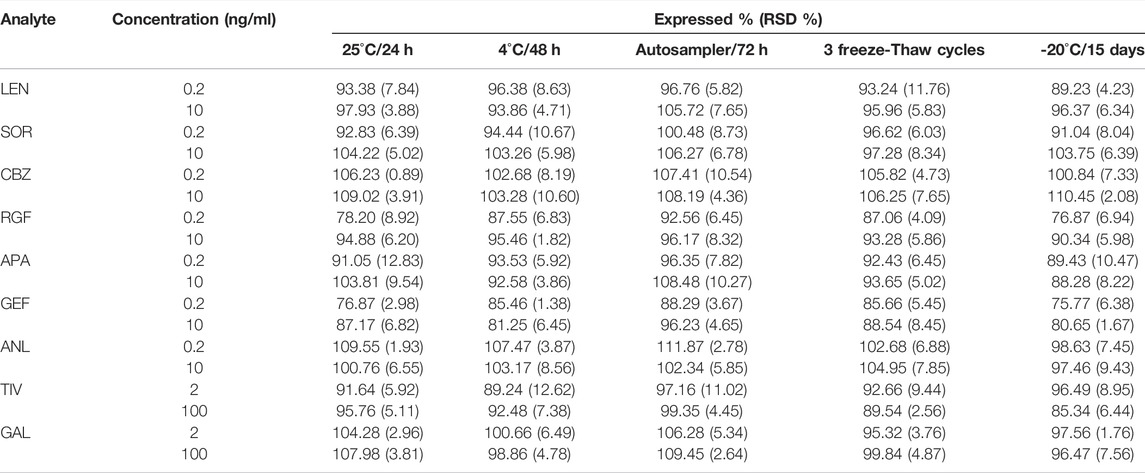
Table 5 depicts the stability outcomes of the nine TKIs under five storage conditions. The values of RSD for the stability test were < 12.83%, which is within the acceptance criteria, indicating that all TKIs have acceptable stability under different storage conditions.
3.6 Comparative Analyses With Other Published Methods
This method was compared with other published assays for the TKIs with anti-hepatocellular carcinogenic effects in terms of LOQs and recovery (Table 6). The LC-MS/MS method revealed a large dynamic range and high sensitivity, and it is hence the most widely used detection method in the present literature. Among the pretreatment methods tested, the most commonly used methods included PP and LLE. The optimized QuEChERS method employed in this research was compared with other assays to reveal relatively and significantly better recovery and LOQs. Although the recovery rates of particular methods were similar, the LOQs were low. Therefore, finally, the QuEChERS method was used for further analyses considering that it is simple, efficient, and suitable for detection.

TABLE 6. Comparison of the proposed method with other published methods for the quantitative detection of TKIs with anti-hepatocellular carcinogenic effects.
3.7 Method Application
This method is currently used only for blood concentration monitoring of apatinib and sorafenib because blood from patients with HCC is more difficult to obtain. The method was validated and has been successfully applied to the quantitative analysis of apatinib and sorafenib in the plasma of patients with HCC. The basic information of the two patients is as follows: sample 1 (male, age: 69 years), taking apatinib 250 mg daily; Sample 2 (male, age: 62 years), taking sorafenib 400 mg daily. Figures 9A,B show the chromatograms of apatinib and sorafenib in the plasma of patients with HCC, respectively. The blood drug concentrations were calculated to be 327 ng/ml and 3,842 ng/ml, respectively. The results suggest that the method is suitable for the detection of the nine TKIs in the plasma of patients with HCC.
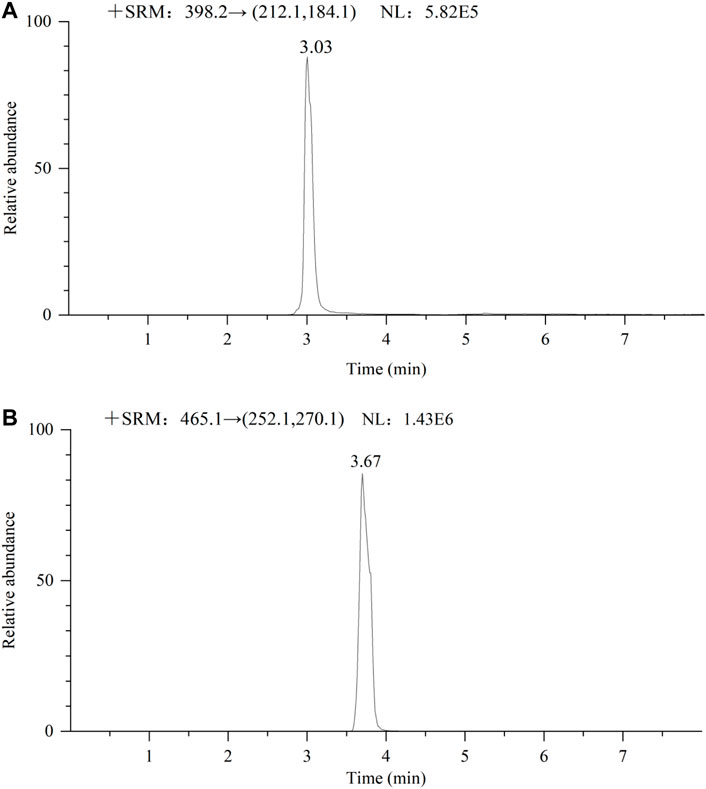
FIGURE 9. Chromatogram of 2 male patients receiving oral apatinib (A) 250 mg and sorafenib (B) 400 mg respectively.
4 Conclusion
In conclusion, in this study, we established a new method that combines the QuEChERS pretreatment technology with UPLC-MS/MS for the quantitative determination of nine TKIs in human plasma specimens. Accordingly, the factors of chromatographic conditions, MS conditions, and the QuEChERS method were optimized. When compared with the other available methods, the optimized method exhibited the advantages of simplicity, reliability, and rapidity. The LOQs of this method were 0.01–0.37 ng/ml and the total chromatographic run time was 8 min for each analyte. Moreover, the recovery and precision were found to be excellent, and the TKI samples showed acceptable stability under different conditions with negligible ME. Therefore, we recommend the proposed method for use in the routine quantitative assay to evaluate nine TKIs in the human plasma.
Data Availability Statement
The original contributions presented in the study are included in the article/supplementary materials, further inquiries can be directed to the corresponding authors.
Ethics Statement
The studies involving human participants were reviewed and approved by the Ethics Committee of Hebei Medical University. The patients/participants provided their written informed consent to participate in this study.
Author Contributions
WJ performed the experiment and statistical analysis. WJ and TZ wrote the first draft of the manuscript. XZ wrote sections of the manuscript. CJ and LH revised the final version of the article. JH and HL contributed to conception and design of the study. All authors have contributed to, read, and approved this submitted manuscript in its current form.
Conflict of Interest
The authors declare that the research was conducted in the absence of any commercial or financial relationships that could be construed as a potential conflict of interest.
Publisher’s Note
All claims expressed in this article are solely those of the authors and do not necessarily represent those of their affiliated organizations, or those of the publisher, the editors and the reviewers. Any product that may be evaluated in this article, or claim that may be made by its manufacturer, is not guaranteed or endorsed by the publisher.
Acknowledgments
The authors would like to thank the personnel at the Bethune International Peace Hospital for their assistance in collecting the plasma samples. This work was supported by the Natural Science Foundation of Hebei Province (H2019329002). The authors would like to thank all the reviewers who participated in the review and MJEditor (www.mjeditor.com) for its linguistic assistance during the preparation of this manuscript.
References
Aghai, F., Zimmermann, S., Kurlbaum, M., Jung, P., Pelzer, T., Klinker, H., et al. (2021). Development and Validation of a Sensitive Liquid Chromatography Tandem Mass Spectrometry Assay for the Simultaneous Determination of Ten Kinase Inhibitors in Human Serum and Plasma. Anal. Bioanal. Chem. 413, 599–612. doi:10.1007/s00216-020-03031-7
Bray, F., Ferlay, J., Soerjomataram, I., Siegel, R. L., Torre, L. A., and Jemal, A. (2020). Erratum: Global Cancer Statistics 2018: GLOBOCAN Estimates of Incidence and Mortality Worldwide for 36 Cancers in 185 Countries. CA Cancer J. Clin. 70, 313. doi:10.3322/caac.2149210.3322/caac.21609
Cammarota, A., Zanuso, V., D’Alessio, A., Pressiani, T., Personeni, N., and Rimassa, L. (2022). Cabozantinib Plus Atezolizumab for the Treatment of Advanced Hepatocellular Carcinoma: Shedding Light on the Preclinical Rationale and Clinical Trials. Expert Opin. Investigational Drugs 31, 401–413. doi:10.1080/13543784.2022.2032641
Chen, L., Zhang, Y., Zhou, Y., Li, G. H., and Feng, X. S. (2021). Pretreatment and Determination Methods for Benzimidazoles: An Update since 2005. J. Chromatogr. A 1644, 462068. doi:10.1016/j.chroma.2021.462068
D'Angelo, A., Sobhani, N., Bagby, S., Casadei-Gardini, A., and Roviello, G. (2020). Cabozantinib as a Second-Line Treatment Option in Hepatocellular Carcinoma. Expert Rev. Clin. Pharmacol. 13, 623–629. doi:10.1080/17512433.2020.1767591
Decraecker, M., Toulouse, C., and Blanc, J. F. (2021). Is There Still a Place for Tyrosine Kinase Inhibitors for the Treatment of Hepatocellular Carcinoma at the Time of Immunotherapies? A Focus on Lenvatinib. Cancers (Basel) 13, 6310. doi:10.3390/cancers13246310
Di Marco, V., De Vita, F., Koskinas, J., Semela, D., Toniutto, P., and Verslype, C. (2013). Sorafenib: from Literature to Clinical Practice. Ann. Oncol. 24 Suppl 2, ii30–7. doi:10.1093/annonc/mdt055
Dutta, R., and Mahato, R. I. (2017). Recent Advances in Hepatocellular Carcinoma Therapy. Pharmacol. Ther. 173, 106–117. doi:10.1016/j.pharmthera.2017.02.010
El-Khoueiry, A. B., Hanna, D. L., Llovet, J., and Kelley, R. K. (2021). Cabozantinib: An Evolving Therapy for Hepatocellular Carcinoma. Cancer Treat. Rev. 98, 102221. doi:10.1016/j.ctrv.2021.102221
Ezzeldin, E., Iqbal, M., Herqash, R. N., and ElNahhas, T. (2020). Simultaneous Quantitative Determination of Seven Novel Tyrosine Kinase Inhibitors in Plasma by a Validated UPLC-MS/MS Method and its Application to Human Microsomal Metabolic Stability Study. J. Chromatogr. B Anal. Technol. Biomed. Life Sci. 1136, 121851. doi:10.1016/j.jchromb.2019.121851
Ferrer, F., Solas, C., Giocanti, M., Lacarelle, B., Deville, J. L., Gravis, G., et al. (2020). A Simple and Rapid Liquid Chromatography-Mass Spectrometry Method to Assay Cabozantinib in Plasma: Application to Therapeutic Drug Monitoring in Patients with Renal Cell Carcinoma. J. Chromatogr. B Anal. Technol. Biomed. Life Sci. 1138, 121968. doi:10.1016/j.jchromb.2020.121968
Fogli, S., Porta, C., Del Re, M., Crucitta, S., Gianfilippo, G., Danesi, R., et al. (2020). Optimizing Treatment of Renal Cell Carcinoma with VEGFR-TKIs: a Comparison of Clinical Pharmacology and Drug-Drug Interactions of Anti-angiogenic Drugs. Cancer Treat. Rev. 84, 101966. doi:10.1016/j.ctrv.2020.101966
Foo, T., Goldstein, D., Segelov, E., Shapiro, J., Pavlakis, N., Desai, J., et al. (2022). The Management of Unresectable, Advanced Gastrointestinal Stromal Tumours. Targ. Oncol. 17, 95–110. doi:10.1007/s11523-022-00869-y
Fresnais, M., Roth, A., Foerster, K. I., Jäger, D., Pfister, S. M., Haefeli, W. E., et al. (2020). Rapid and Sensitive Quantification of Osimertinib in Human Plasma Using a Fully Validated MALDI-IM-MS/MS Assay. Cancers (Basel) 12, 1897. doi:10.3390/cancers12071897
Granito, A., Forgione, A., Marinelli, S., Renzulli, M., Ielasi, L., Sansone, V., et al. (2021). Experience with Regorafenib in the Treatment of Hepatocellular Carcinoma. Ther. Adv. Gastroenterol. 14, 17562848211016959. doi:10.1177/17562848211016959
Guan, S., Shi, W., Zhao, Z., Wang, F., Jiang, F., Zhang, C., et al. (2019). Determination of Apatinib and its Three Active Metabolites by UPLC-MS/MS in a Phase IV Clinical Trial in NSCLC Patients. Bioanalysis 11, 2049–2060. doi:10.4155/bio-2019-0214
Guo, W., Chen, S., Wu, Z., Zhuang, W., and Yang, J. (2020). Efficacy and Safety of Transarterial Chemoembolization Combined with Anlotinib for Unresectable Hepatocellular Carcinoma: A Retrospective Study. Technol. Cancer Res. Treat. 19, 1533033820965587. doi:10.1177/1533033820965587
He, Y., Zhou, L., Gao, S., Yin, T., Tu, Y., Rayford, R., et al. (2017). Development and Validation of a Sensitive LC-MS/MS Method for Simultaneous Determination of Eight Tyrosine Kinase Inhibitors and its Application in Mice Pharmacokinetic Studies. J. Pharm. Biomed. Anal. 148, 65–72. doi:10.1016/j.jpba.2017.09.013
Hwang, S., Hong, T. H., Park, S., Jung, H. A., Sun, J. M., Ahn, J. S., et al. (2021). Molecular Subtypes of Small Cell Lung Cancer Transformed from Adenocarcinoma after EGFR Tyrosine Kinase Inhibitor Treatment. Transl. Lung Cancer Res. 10, 4209–4220. doi:10.21037/tlcr-21-691
Iacuzzi, V., Zanchetta, M., Gagno, S., Poetto, A. S., Orleni, M., Marangon, E., et al. (2020). A LC-MS/MS Method for Therapeutic Drug Monitoring of Sorafenib, Regorafenib and Their Active Metabolites in Patients with Hepatocellular Carcinoma. J. Pharm. Biomed. Anal. 187, 113358. doi:10.1016/j.jpba.2020.113358
Irie, K., Shobu, S., Hiratsuji, S., Yamasaki, Y., Nanjo, S., Kokan, C., et al. (2018). Development and Validation of a Method for Gefitinib Quantification in Dried Blood Spots Using Liquid Chromatography-Tandem Mass Spectrometry: Application to Finger-Prick Clinical Blood Samples of Patients with Non-small Cell Lung Cancer. J. Chromatogr. B Anal. Technol. Biomed. Life Sci. 1087-1088, 1–5. doi:10.1016/j.jchromb.2018.04.027
Jin, H., Shi, Y., Lv, Y., Yuan, S., Ramirez, C. F. A., Lieftink, C., et al. (2021). EGFR Activation Limits the Response of Liver Cancer to Lenvatinib. Nature 595, 730–734. doi:10.1038/s41586-021-03741-7
Kanu, A. B. (2021). Recent Developments in Sample Preparation Techniques Combined with High-Performance Liquid Chromatography: A Critical Review. J. Chromatogr. A 1654, 462444. doi:10.1016/j.chroma.2021.462444
Klug, L. R., Khosroyani, H. M., Kent, J. D., and Heinrich, M. C. (2022). New Treatment Strategies for Advanced-Stage Gastrointestinal Stromal Tumours. Nat. Rev. Clin. Oncol. 19, 328–341. doi:10.1038/s41571-022-00606-4
Kocan, G. P., Huang, M. Q., Li, F., and Pai, S. (2018). A Sensitive LC-MS-MS Assay for the Determination of Lapatinib in Human Plasma in Subjects with End-Stage Renal Disease Receiving Hemodialysis. J. Chromatogr. B Anal. Technol. Biomed. Life Sci. 1097-1098, 74–82. doi:10.1016/j.jchromb.2018.09.005
Krens, S. D., van der Meulen, E., Jansman, F. G. A., Burger, D. M., and van Erp, N. P. (2020). Quantification of Cobimetinib, Cabozantinib, Dabrafenib, Niraparib, Olaparib, Vemurafenib, Regorafenib and its Metabolite Regorafenib M2 in Human Plasma by UPLC-MS/MS. Biomed. Chromatogr. 34, e4758. doi:10.1002/bmc.4758
Lin, L., Pan, H., Li, X., Zhao, C., Sun, J., Hu, X., et al. (2022). A Phase I Study of FCN-411, a Pan-HER Inhibitor, in EGFR-Mutated Advanced NSCLC after Progression on EGFR Tyrosine Kinase Inhibitors. Lung Cancer 166, 98–106. doi:10.1016/j.lungcan.2022.01.025
Maharati, A., Zanguei, A. S., Khalili-Tanha, G., and Moghbeli, M. (2022). MicroRNAs as the Critical Regulators of Tyrosine Kinase Inhibitors Resistance in Lung Tumor Cells. Cell Commun. Signal 20, 27. doi:10.1186/s12964-022-00840-4
Mohammadi, M., and Gelderblom, H. (2021). Systemic Therapy of Advanced/metastatic Gastrointestinal Stromal Tumors: an Update on Progress beyond Imatinib, Sunitinib, and Regorafenib. Expert Opin. Investig. Drugs 30, 143–152. doi:10.1080/13543784.2021.1857363
Ni, M. W., Zhou, J., Li, H., Chen, W., Mou, H. Z., and Zheng, Z. G. (2017). Simultaneous Determination of Six Tyrosine Kinase Inhibitors in Human Plasma Using HPLC-Q-Orbitrap Mass Spectrometry. Bioanalysis 9, 925–935. doi:10.4155/bio-2017-0031
Niu, Y., Gao, W., Li, H., Zhang, J., and Lian, Y. (2020). Rapid Determination of 17 Phthalate Esters in Capsanthin by QuEChERS Coupled with Gas Chromatography-Mass Spectrometry. Anal. Sci. 36, 485–490. doi:10.2116/analsci.19P421
Noorolyai, S., Mokhtarzadeh, A., Baghbani, E., Asadi, M., Baghbanzadeh Kojabad, A., Mogaddam, M. M., et al. (2019). The Role of microRNAs Involved in PI3-Kinase Signaling Pathway in Colorectal Cancer. J. Cell Physiol. 234, 5664–5673. doi:10.1002/jcp.27415
Ogawa-Morita, T., Sano, Y., Okano, T., Fujii, H., Tahara, M., Yamaguchi, M., et al. (2017). Validation of a Liquid Chromatography-Tandem Mass Spectrometric Assay for Quantitative Analysis of Lenvatinib in Human Plasma. Int. J. Anal. Chem. 2017, 2341876. doi:10.1155/2017/2341876
Pedersen, K. S., Grierson, P. M., Picus, J., Lockhart, A. C., Roth, B. J., Liu, J., et al. (2021). Vorolanib (X-82), an Oral anti-VEGFR/PDGFR/CSF1R Tyrosine Kinase Inhibitor, with Everolimus in Solid Tumors: Results of a Phase I Study. Invest. New Drugs 39, 1298–1305. doi:10.1007/s10637-021-01093-7
Perestrelo, R., Silva, P., Porto-Figueira, P., Pereira, J. A. M., Silva, C., Medina, S., et al. (2019). QuEChERS - Fundamentals, Relevant Improvements, Applications and Future Trends. Anal. Chim. Acta 1070, 1–28. doi:10.1016/j.aca.2019.02.036
Qin, S., Li, Q., Gu, S., Chen, X., Lin, L., Wang, Z., et al. (2021). Apatinib as Second-Line or Later Therapy in Patients with Advanced Hepatocellular Carcinoma (AHELP): a Multicentre, Double-Blind, Randomised, Placebo-Controlled, Phase 3 Trial. Lancet Gastroenterol. Hepatol. 6, 559–568. doi:10.1016/S2468-1253(21)00109-6
Qin, S., Li, Q., Gu, S., Chen, X., Lin, L., Wang, Z., et al. (2020). Apatinib as Second-Line Therapy in Chinese Patients with Advanced Hepatocellular Carcinoma: A Randomized, Placebo-Controlled, Double-Blind, Phase Ⅲ Study. J. Clin. Oncol. 38, 4507.
Rehman, O., Jaferi, U., Padda, I., Khehra, N., Atwal, H., Mossabeh, D., et al. (2021). Overview of Lenvatinib as a Targeted Therapy for Advanced Hepatocellular Carcinoma. Clin. Exp. Hepatol. 7 (3), 249–257. doi:10.5114/ceh.2021.109312
Reis, R., Labat, L., Allard, M., Boudou-Rouquette, P., Chapron, J., Bellesoeur, A., et al. (2018). Liquid Chromatography-Tandem Mass Spectrometric Assay for Therapeutic Drug Monitoring of the EGFR Inhibitors Afatinib, Erlotinib and Osimertinib, the ALK Inhibitor Crizotinib and the VEGFR Inhibitor Nintedanib in Human Plasma from Non-small Cell Lung Cancer Patients. J. Pharm. Biomed. Anal. 158, 174–183. doi:10.1016/j.jpba.2018.05.052
Rimassa, L., Assenat, E., Peck-Radosavljevic, M., Pracht, M., Zagonel, V., Mathurin, P., et al. (2018). Tivantinib for Second-Line Treatment of MET-High, Advanced Hepatocellular Carcinoma (METIV-HCC): a Final Analysis of a Phase 3, Randomised, Placebo-Controlled Study. Lancet Oncol. 19, 682–693. doi:10.1016/S1470-2045(18)30146-3
Sueshige, Y., Shiraiwa, K., Honda, K., Tanaka, R., Saito, T., Tokoro, M., et al. (2021). A Broad Range High-Throughput Assay for Lenvatinib Using Ultra-high Performance Liquid Chromatography Coupled to Tandem Mass Spectrometry with Clinical Application in Patients with Hepatocellular Carcinoma. Ther. Drug Monit. 43, 664–671. doi:10.1097/FTD.0000000000000872
Ten Berge, D. M. H. J., Aarts, M. J., Groen, H. J. M., Aerts, J. G. J. V., and Kloover, J. S. (2022). A Population-Based Study Describing Characteristics, Survival and the Effect of TKI Treatment on Patients with EGFR Mutated Stage IV NSCLC in the Netherlands. Eur. J. Cancer 165, 195–204. doi:10.1016/j.ejca.2022.01.038
Tibben, M. M., Huijberts, S., Li, W., Schinkel, A. H., Gebretensae, A., Rosing, H., et al. (2019). Liquid Chromatography-Tandem Mass Spectrometric Assay for the Quantification of Galunisertib in Human Plasma and the Application in a Pre-clinical Study. J. Pharm. Biomed. Anal. 173, 169–175. doi:10.1016/j.jpba.2019.05.037
U.S. Department of Health and Human Services Food and Drug Administration (2018). Bioanalytical Method Validation Guidance for Industry. Available at: https://www.fda.gov/media/70858/download (Accessed Oct 17, 2019).
Verougstraete, N., Stove, V., Verstraete, A. G., and Stove, C. (2021). Quantification of Eight Hematological Tyrosine Kinase Inhibitors in Both Plasma and Whole Blood by a Validated LC-MS/MS Method. Talanta 226, 122140. doi:10.1016/j.talanta.2021.122140
Wick, A., Desjardins, A., Suarez, C., Forsyth, P., Gueorguieva, I., Burkholder, T., et al. (2020). A Phase 1b Study of Transforming Growth Factor-Beta Receptor I in- Hibitor Galunisertib in Combination with Sorafenib in Japanese Patients with Unresectable Hepatocellular Car- Cinoma. Invest. New Drugs 37, 118–126. doi:10.1007/s10637-018-0636-3
Wu, C., Li, M., Meng, H., Liu, Y., Niu, W., Zhou, Y., et al. (2019). Analysis of Status and Countermeasures of Cancer Incidence and Mortality in China. Sci. China Life Sci. 62, 640–647. doi:10.1007/s11427-018-9461-5
Xing, R., Gao, J., Cui, Q., and Wang, Q. (2021). Strategies to Improve the Antitumor Effect of Immunotherapy for Hepatocellular Carcinoma. Front. Immunol. 12, 783236. doi:10.3389/fimmu.2021.7832369
Yang, G., Liu, C., Hu, J., Sun, Y., Hu, P., Liu, L., et al. (2022). The Lifted Veil of Uncommon EGFR Mutation p.L747P in Non-small Cell Lung Cancer: Molecular Feature and Targeting Sensitivity to Tyrosine Kinase Inhibitors. Front. Oncol. 12, 843299. doi:10.3389/fonc.2022.843299
Yao, F., Zhan, Y., Li, C., Lu, Y., Chen, J., Deng, J., et al. (2021). Single-Cell RNA Sequencing Reveals the Role of Phosphorylation-Related Genes in Hepatocellular Carcinoma Stem Cells. Front. Cell Dev. Biol. 9, 734287. doi:10.3389/fcell.2021.734287
Ye, Z., Wu, L., Zhang, X., Hu, Y., and Zheng, L. (2021). Quantification of Sorafenib, Lenvatinib, and Apatinib in Human Plasma for Therapeutic Drug Monitoring by UPLC-MS/MS. J. Pharm. Biomed. Anal. 202, 114161. doi:10.1016/j.jpba.2021.114161
Yingling, J. M., McMillen, W. T., Yan, L., Huang, H., Sawyer, J. S., Graff, J., et al. (2018). Preclinical Assessment of Galunisertib (LY2157299 Monohydrate), a First-In-Class Transforming Growth Factor-β Receptor Type I Inhibitor. Oncotarget 9, 6659–6677. doi:10.18632/oncotarget.23795
Zhao, Y., Zhang, Y. N., Wang, K. T., and Chen, L. (2020). Lenvatinib for Hepatocellular Carcinoma: From Preclinical Mechanisms to Anti-cancer Therapy. Biochim. Biophys. Acta Rev. Cancer 1874, 188391. doi:10.1016/j.bbcan.2020.188391
Zheng, M., Zhang, C., Wang, L., Wang, K., Kang, W., Lian, K., et al. (2021). Determination of Nine Mental Drugs in Human Plasma Using Solid-phase Supported Liquid-Liquid Extraction and HPLC-MS/MS. Microchem. J. 160, 105647. doi:10.1016/j.microc.2020.105647
Zhou, L., Wang, S., Chen, M., Huang, S., Zhang, M., Bao, W., et al. (2021). Simultaneous and Rapid Determination of 12 Tyrosine Kinase Inhibitors by LC-MS/MS in Human Plasma: Application to Therapeutic Drug Monitoring in Patients with Non-small Cell Lung Cancer. J. Chromatogr. B Anal. Technol. Biomed. Life Sci. 1175, 122752. doi:10.1016/j.jchromb.2021.122752
Keywords: tyrosine kinase inhibitors, UPLC-MS/MS, QuEChERS, plasma, hepatocellular carcinoma
Citation: Jiang W, Zhao T, Zhen X, Jin C, Li H and Ha J (2022) Rapid Determination of 9 Tyrosine Kinase Inhibitors for the Treatment of Hepatocellular Carcinoma in Human Plasma by QuEChERS-UPLC-MS/MS. Front. Pharmacol. 13:920436. doi: 10.3389/fphar.2022.920436
Received: 14 April 2022; Accepted: 11 May 2022;
Published: 21 June 2022.
Edited by:
Miao Yan, Central South University, ChinaReviewed by:
Priyanka Shah, Gujarat University, IndiaAlessandro Granito, University of Bologna, Italy
Copyright © 2022 Jiang, Zhao, Zhen, Jin, Li and Ha. This is an open-access article distributed under the terms of the Creative Commons Attribution License (CC BY). The use, distribution or reproduction in other forums is permitted, provided the original author(s) and the copyright owner(s) are credited and that the original publication in this journal is cited, in accordance with accepted academic practice. No use, distribution or reproduction is permitted which does not comply with these terms.
*Correspondence: Hui Li, bGlodWk3MTcxQDE2My5jb20=; Jing Ha, aGFqaW5nMDJAMTYzLmNvbQ==
 Wen Jiang
 Tingting Zhao
 Xiaolan Zhen
 Chengcheng Jin
 Hui Li
 Jing Ha
