 Parisa Ghasemiyeh1,2
 Afsaneh Vazin1*Farid Zand3Elham Haem4
 Iman Karimzadeh1Amir Azadi2Mansoor Masjedi5Golnar Sabetian6Reza Nikandish3
 Soliman Mohammadi-Samani2,7*
- 1Department of Clinical Pharmacy, Faculty of Pharmacy, Shiraz University of Medical Sciences, Shiraz, Iran
- 2Department of Pharmaceutics, Faculty of Pharmacy, Shiraz University of Medical Sciences, Shiraz, Iran
- 3Anesthesiology and Critical Care Research Center, Nemazee Hospital, Shiraz University of Medical Sciences, Shiraz, Iran
- 4Department of Biostatistics, School of Medicine, Shiraz University of Medical Sciences, Shiraz, Iran
- 5Department of Anesthesiology, Faculty of Medicine, Shiraz University of Medical Science, Shiraz, Iran
- 6Trauma Research Center, Shahid Rajaee (Emtiaz) Trauma Hospital, Shiraz University of Medical Sciences, Shiraz, Iran
- 7Pharmaceutical Sciences Research Center, Faculty of Pharmacy, Shiraz University of Medical Sciences, Shiraz, Iran
Introduction: Therapeutic drug monitoring (TDM) and pharmacokinetic assessments of vancomycin would be essential to avoid vancomycin-associated nephrotoxicity and obtain optimal therapeutic and clinical responses. Different pharmacokinetic parameters, including trough concentration and area under the curve (AUC), have been proposed to assess the safety and efficacy of vancomycin administration.
Methods: Critically ill patients receiving vancomycin at Nemazee Hospital were included in this prospective study. Four blood samples at various time intervals were taken from each participated patient. Vancomycin was extracted from plasma samples and analyzed using a validated HPLC method.
Results: Fifty-three critically ill patients with a total of 212 blood samples from June 2019 to June 2021 were included in this study. There was a significant correlation between baseline GFR, baseline serum creatinine, trough and peak concentrations, AUCτ, AUC24h, Cl, and Vd values with vancomycin-induced AKI. Based on trough concentration values, 66% of patients were under-dosed (trough concentration <15 μg/ml) and 18.9% were over-dosed (trough concentration ≥20 μg/ml). Also, based on AUC24h values, about 52.2% were under-dosed (AUC24h < 400 μg h/ml), and 21.7% were over-dosed (AUC24h > 600 μg h/ml) that emphasizes on the superiority of AUC-based monitoring approach for TDM purposes to avoid nephrotoxicity occurrence.
Conclusion: The AUC-based monitoring approach would be superior in terms of nephrotoxicity prediction. Also, to avoid vancomycin-induced AKI, trough concentration and AUCτ values should be maintained below the cut-off points.
1 Introduction
Vancomycin is a glycopeptide antibiotic considered a drug of choice for targeted or empiric therapy of many Gram-positive bacterial infections (Vazin et al., 2012), especially Methicillin-resistant Staphylococcus aureus (MRSA) and Methicillin-resistant coagulase-negative staphylococci (MRCoNS) (Vazin et al., 2018). Vancomycin is a hydrophilic drug with a log P of section 3.1 (Drugbank, 2022). It has an average molecular weight of 1,450 Da (Drugbank, 2022). Since vancomycin has limited oral bioavailability, the main route of administration is intravenous infusion (Estes and Derendorf, 2010). Due to the hydrophilic nature, almost complete urinary excretion would be expectable after intravenous administration. It has been reported that 24 h after single-dose administration of vancomycin, about 80–90% of the drug was recovered unchanged in urine samples (Rybak, 2006). Vancomycin has a narrow therapeutic index that emphasized the necessity of therapeutic drug monitoring (TDM) (Javorska et al., 2016). The most significant adverse reactions related to vancomycin are nephrotoxicity and ototoxicity that are related to the trough (Cmin) and peak (Cmax) concentration values, respectively (Sacristan and Soto, 1992). Risk scoring systems can be recruited to predict vancomycin-associated nephrotoxicity (Kim et al., 2022). Recent guideline regarding the TDM of vancomycin in severe MRSA infections has been reported that trough-only monitoring approach with a target trough concentration of 15–20 μg/ml is no longer recommended in patients with severe MRSA infection due to the lack of efficacy and higher nephrotoxicity occurrence (Rybak et al., 2020). In contrast, it has been reported that the area under the curve (AUC) to minimum inhibitory (MIC) ratio (AUC/MIC) with a target range of 400–600 μg h/ml (assuming MIC values are ≤1 μg/ml) would be an optimal pharmacokinetic/pharmacodynamic (PK/PD) parameter for vancomycin TDM to achieve both adequate clinical efficacy and safety during vancomycin administration (Rybak et al., 2020). The suggested vancomycin dosage in patients with severe MRSA infection is a loading dose of 20–35 mg/kg and a maintenance dose of 15–20 mg/kg (based on actual body weight) every 8–12 h based on TDM data (Ghasemiyeh et al., 2021a). These doses would not be appropriate for target therapeutic AUC/MIC values when MIC is 2 μg/ml (Rybak et al., 2020). In this regard, a 24-h AUC (AUC24h) calculation regardless of MIC values would be a suitable alternative to AUC/MIC ratio in these cases. It has been reported that an AUC24h target limit of 700 μg h/ml would be a more reliable pharmacokinetic parameter to achieve sufficient clinical efficacy and prevent vancomycin nephrotoxicity (Zasowski et al., 2018). Critically ill patients admitted to intensive care units (ICU) may have altered pharmacokinetic parameters compared to non-critically ill patients. So, individualized dose adjustment and TDM of vancomycin would be essential in this group of patients to achieve a targeted therapeutic response (Ghasemiyeh et al., 2021b). Also, the results of a recent study revealed that the trough-only monitoring approach should not be considered as a suitable surrogate for AUC24h monitoring in critically ill patients (Turner et al., 2018a). In this study, vancomycin TDM in critically ill patients admitted to the ICUs of Nemazee hospital in Shiraz was assessed. Different pharmacokinetic parameters including trough concentration (Cmin), peak concentration (Cmax), AUC24h, AUC of intervals (AUCτ), the volume of distribution (Vd), clearance (Cl), elimination constant (k), and half-life (t ½) were calculated individually for each patient. Finally, a comparison of the sensitivity of different pharmacokinetic parameters in the prediction of vancomycin-associated nephrotoxicity has been considered. Finally, the ROC curve has been recruited to determine the cut-off points for trough concentration, AUCτ, AUC24h, and k to avoid vancomycin-induced AKI occurrence.
2 Materials and methods
2.1 Materials and equipment
The high-performance liquid chromatography (HPLC) method was used in sample analysis (Azura, Knauer, Germany). HPLC column was C18 (250 mm length × 4.6 mm I.D.; 5 μm pore size), Knauer, Germany. Acetonitrile and methanol were HPLC grade from Merck, Germany, and purchased from a domestic supplier. Ortho-phosphoric acid and sodium hydroxide were from Merck, Germany. Vancomycin standard powder was kindly gifted by Dena Pharmaceutical Company, Tabriz, Iran. Theophylline standard powder was kindly gifted from Exir Pharmaceutical Company, Borujerd, Iran.
2.2 Study design and patient population
This is a part of prospective, interventional clinical study which was enrolled between June 2019 and June 2021. A total of 100 patients receiving vancomycin at the ICU ward of Nemazee Hospital, affiliated to Shiraz University of Medical Sciences, Shiraz, Iran, were screened primarily.
The inclusion criteria were critically ill adult patients aged ≥18 years old who were admitted to the ICU of Nemazee Hospital and received vancomycin as an empiric or definite antibiotic regimen. Also, these patients should have a GFR value of ≥45 ml/min (calculated through Cockcroft-Gault equation). Exclusion criteria were age <18 years old, pregnancy, patients with baseline renal failure [including patients with AKI, chronic kidney disease (CKD) stage IIIB or greater, end-stage renal disease (ESRD) patients on hemodialysis], burn injuries, severe hepatic failure (Child-Pugh class C), serum bilirubin level >2.5 mg/dl (Srisawasdi et al., 2010), serum albumin level <2 g/dl, and those receiving theophylline/aminophylline.
2.3 Ethical considerations
This study was approved by the Ethics Committee of the Shiraz University of Medical Sciences [Approval ID: IR. SUMS.REC.1398.605] and each patient or their family members are signed written consent forms.
2.4 Sampling
Baseline serum creatinine levels were assessed for each patient before vancomycin administration. Also, serum creatinine and creatinine clearance was assessed daily for each participant during vancomycin administration until hospital discharge and/or death occur. Four blood samples were collected from each patient after 48 h of vancomycin initiation to determine steady-state plasma concentrations. Blood samples were collected from these critically ill patients just before the fifth dose administration (trough 1), after the end of 1-h infusion of the fifth dose (peak), 6 h after the fifth dose administration (intermediate), and 12 h after the fifth dose or just before the sixth dose administration (trough 2). AUCτ was calculated in each patient using the trapezoidal method as described in our previous study (Ghasemiyeh et al., 2020).
2.4.1 Sample preparation and HPLC analysis
Five ml sample was taken at each mentioned times (0, 1, 6, and 12 h) and poured into the K2EDTA tubes to avoid clot formation. Then, blood samples were centrifuged at 4,000 rpm for 3 min to separate plasma from the whole blood. The 950 µL of the plasma was mixed with 50 µL of theophylline standard solution (with a concentration of 8 mg/L), and samples were vortexed at 2,000 rpm for 1 min. After that, the sample was mixed with 1,000 µL of methanol to precipitate plasma proteins and extract vancomycin from plasma samples. Finally, the mixture was centrifuged at 12,000 rpm for 15 min, and the supernatant was analyzed through a validated HPLC method described in detail before (Usman et al., 2016; Ghasemiyeh et al., 2020). In this regard, the HPLC (Azura, Knauer, Germany) and C18 column (250 mm length × 4.6 mm I.D.; 5 μm pore size; Knauer, Germany) were used for sample analysis. The mobile phase was phosphate buffer (pH of 2.2, 0.03 M) and acetonitrile (86:14 %v/v ratio). The flow rate was 0.72 ml/min and the system was isocratic. The λmax was set at 205 nm and the column temperature was fixed at 25°C (Ghasemiyeh et al., 2020).
2.5 Pharmacokinetic assessments
Pharmacokinetic parameters were assessed individually for each participated patient according to Eqs 1–4.
Systemic clearance of the vancomycin was calculated using Eq. 1.
Where
Volume of drug distribution within the body was assessed using Eq. 2.
Where
Elimination constant of vancomycin was estimated according to Eq. 3.
Where
Elimination half-life of vancomycin was calculated using Eq.4.
Where
After blood sample analysis, dose adjustment was accomplished according to Eqs 5, 6.
Where
Where
2.6 Statistical analysis
The Kolmogorov-Smirnov test was performed to assess the normality of the continuous variable distribution. Continuous variables with normal and abnormal distributions are expressed as mean ± standard deviation (SD) and median with interquartile ranges, respectively. Categorical variables were reported as a percentage. For all statistical analysis, SPSS software (version 25, 2017) was used and p-values less than 0.05 were considered to be statistically significant.
2.6.1 Vancomycin-induced AKI
The association between pharmacokinetic parameters, including trough concentration, peak concentration, AUCτ, AUC24h, Vd, Cl, k, t ½ with vancomycin-induced AKI was assessed using the Independent Sample t-test and Mann-Whitney test. Also, the association between baseline renal function (including baseline serum creatinine and baseline GFR) and vancomycin-induced AKI were assessed in the same way.
The Pearson correlation test was used to assess the correlation between baseline serum creatinine as well as baseline GFR with each pharmacokinetic parameter.
2.6.1.1 AKI occurrence in different groups of patients regarding their trough and AUC values
A comparison of AKI occurrence in different groups of patients based on trough concentration and AUC values was performed using the Chi-square test. In this regard, patients were divided into four groups based on trough concentration values (trough concentration of <10, 10–15, 15–20, and ≥20 μg/ml). Also, patients were divided into three groups based on AUCτ and AUC24h values (AUCτ <200, 200–300, and ≥300 μg h/ml and AUC24h < 400, 400–600, and ≥600 μg h/ml). Then the occurrence of AKI was compared between these groups using the Chi-square test.
3.6.1.2 Trough concentration values in patients with targeted AUCτ and AUC24h values
In order to evaluate the suitability of using trough-based monitoring approach as a more practical and convenient surrogate for AUC-based monitoring approach, the distribution of trough concentration values in patients who had targeted AUC values of 200–300 μg h/ml and 400–600 μg h/ml for AUCτ and AUC24h respectively were assessed.
2.6.1.3 ROC curve and cut-off point calculation for AKI occurrence
The receiver operating characteristic (ROC) curve was exploited to determine the cut-off point of AKI occurrence regarding trough concentration, AUCτ, and AUC24h values (Han et al., 2014).
3 Results
3.1 Patient population
A total of 100 critically ill patients were screened. 53 patients, with a total of 212 blood samples, were included based on the inclusion and exclusion criteria and completed this study as shown in Figure 1. Participated patients had almost equal distribution regarding their gender, 52.8% of them were male, and the remaining were female. These critically ill patients were between 18 and 85 years old with an average of 50.25 ± 19.12 years. Among these patients, 28.3% received vancomycin as definite therapy with confirmed positive blood culture (especially MRCoNS and MRSA), and the remaining (71.7%) received vancomycin as an empiric therapy regimen. Among these included critically ill patients, 43.4% of them were septic. Demographic characteristics, clinical, and laboratory data of the included patients have been shown in Table 1.
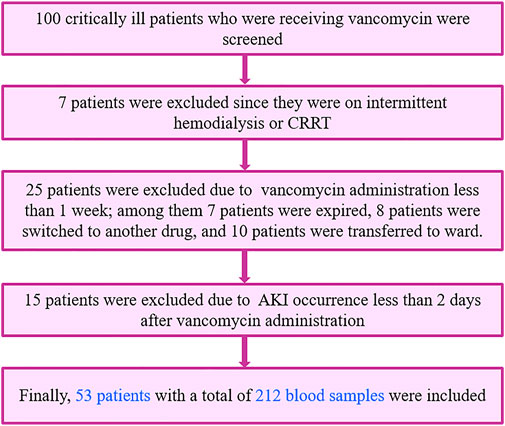
FIGURE 1. Patients’ screening and selection based on inclusion and exclusion criteria.
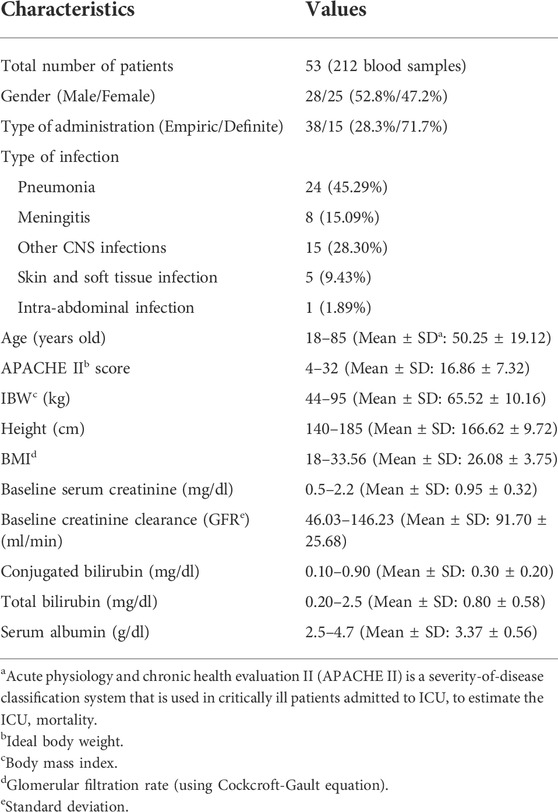
TABLE 1. Patients’ demographic characteristics and laboratory data.
3.2 Drug administration and sample analysis
Vancomycin was administered with a loading dose of 20–35 mg/kg and a maintenance dose of 15–20 mg/kg Q8-12 h. Then doses were adjusted based on pharmacokinetic parameters individually, as mentioned in Eqs 5, 6. A representative chromatogram of vancomycin analysis using the HPLC method has been presented in Figure 2. As shown in Figure 2, vancomycin and theophylline (as an internal standard) had retention times of 6.7 and 8.2 min, respectively.
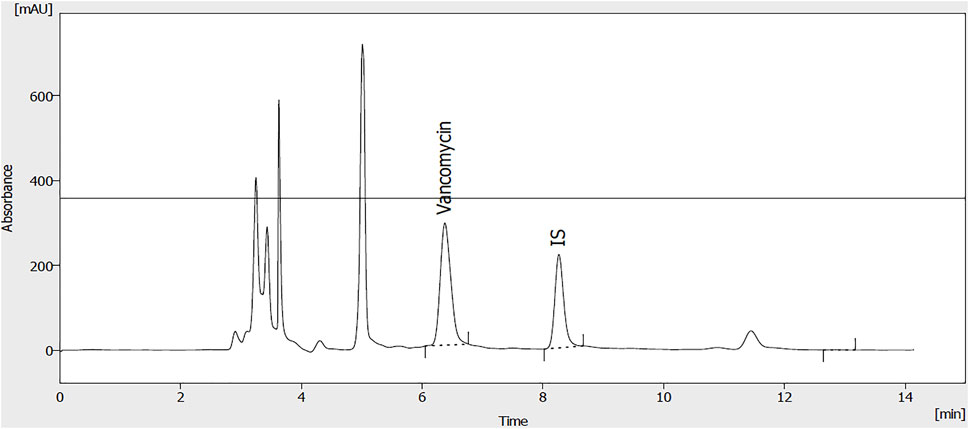
FIGURE 2. A representative chromatogram of vancomycin (50 μg/ml) and internal standard (theophylline; 20 μg/ml) extracted from plasma samples.
3.3 Pharmacokinetic assessments
According to the four samples (0, 1, 6, and 12 h) taken from each patient, different pharmacokinetic parameters including Vd, Cl, k, t ½, AUCτ, and AUC24h were assessed individually and summarized in Table 2.
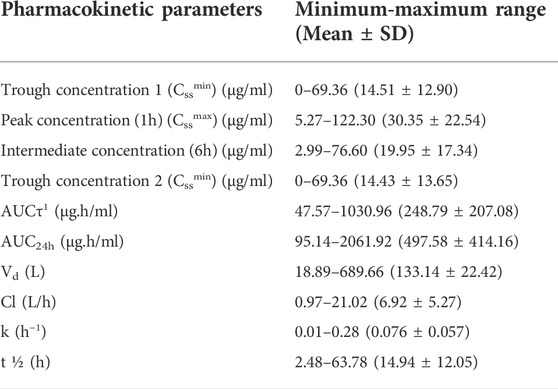
TABLE 2. Pharmacokinetic parameters after vancomycin administration at steady-state condition.
3.4 Vancomycin-induced AKI
Results of this study revealed that 17% of the present study population experienced AKI during vancomycin administration. 24.5% of the participated patients received at least one nephrotoxic agent other than vancomycin. The effect of concomitant other nephrotoxic medications administration was omitted using multivariate logistic regression. None of these included patients were co-treated with piperacillin-tazobactam. According to the latest recommendation of Uptodate®, the combination therapy with vancomycin and piperacillin-tazobactam is no longer supported and it should be avoided due to the higher incidence of acute kidney injury. Therefore, this combination is no longer used in our medical center. The association between each pharmacokinetic parameter value and vancomycin-induced AKI has been summarized in Table 3. There was a significant association between each of the trough concentration, peak concentration, AUCτ, AUC24h, Vd, and Cl and vancomycin-induced AKI. Furthermore, these results revealed that there was a significant association between baseline serum creatinine and baseline GFR with vancomycin-induced AKI.
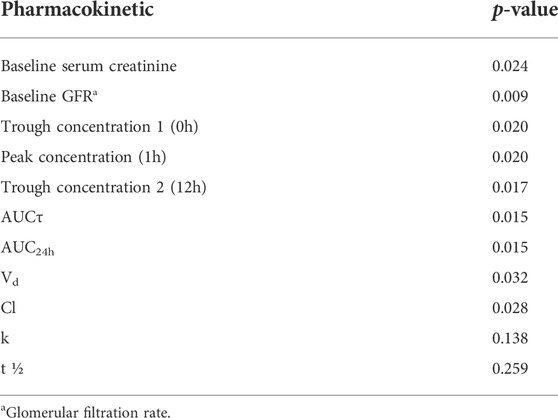
TABLE 3. The association between pharmacokinetic parameters of vancomycin and vancomycin-induced AKI.
3.5 Correlation between baseline renal function and pharmacokinetic parameters
The correlation between baseline serum creatinine and baseline GFR as indicators of baseline renal function and pharmacokinetic parameters of vancomycin are summarized in Table 4. There was a significant correlation between each of trough concentration 2 (12 h) and t ½ with baseline serum creatinine. Also, there was a significant correlation between each of trough concentration, peak concentration, AUCτ, and AUC24h and baseline GFR.
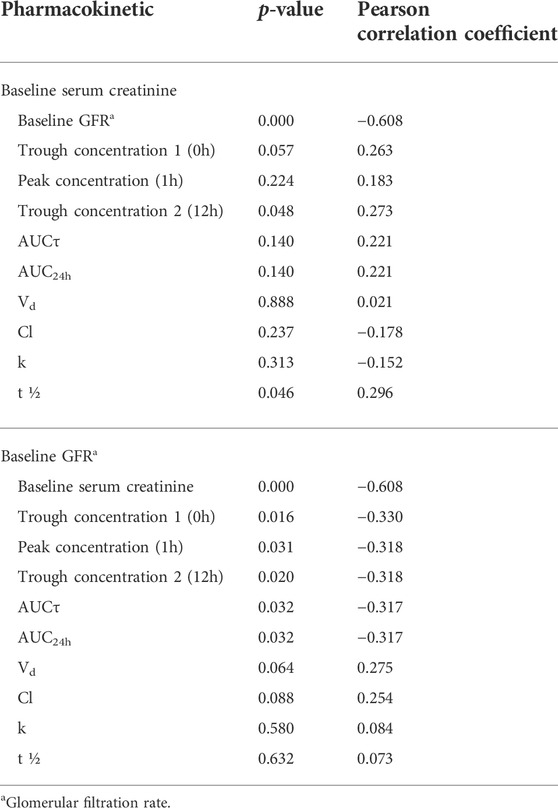
TABLE 4. The correlation between baseline serum creatinine and baseline GFR and pharmacokinetic parameters.
3.6 AKI occurrence in different groups of patients regarding their trough and AUC values
The frequency and percentage of critically ill patients in different groups based on their trough concentrations and AUC values have been shown in Table 5. Also, comparison of AKI occurrence in different groups of patients based on trough concentration and AUC values has been summarized in Table 5. There was a significant association between each of trough 1 (0 h), trough 2 (12 h), AUCτ, and AUC24h with vancomycin nephrotoxicity.
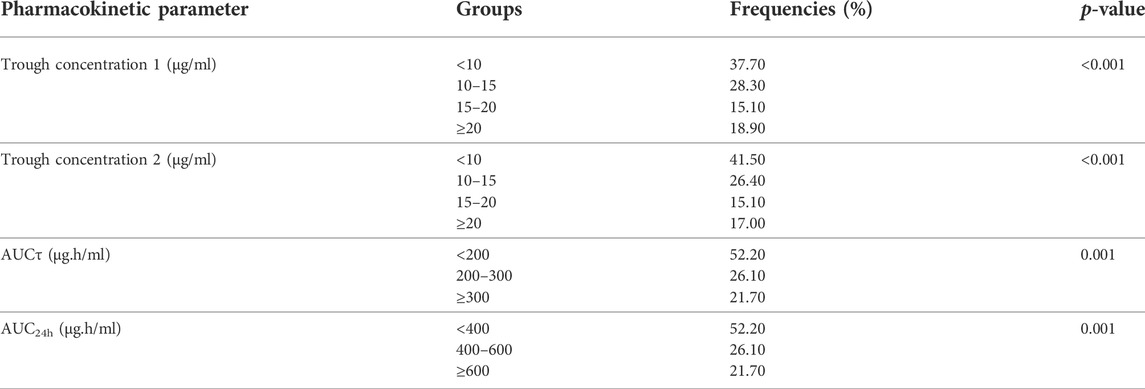
TABLE 5. Comparison of occurrence of vancomycin-induced AKI in different groups of patients based on trough concentration and AUC values using Chi-square test (N = 53).
3.7 Trough concentration values in patients with targeted AUCτ and AUC24h values
Trough concentration values in patients with targeted AUC values, including AUCτ of 200–300 μg h/ml, and AUC24 h of 400–600 μg h/ml have been summarized in Table 6.
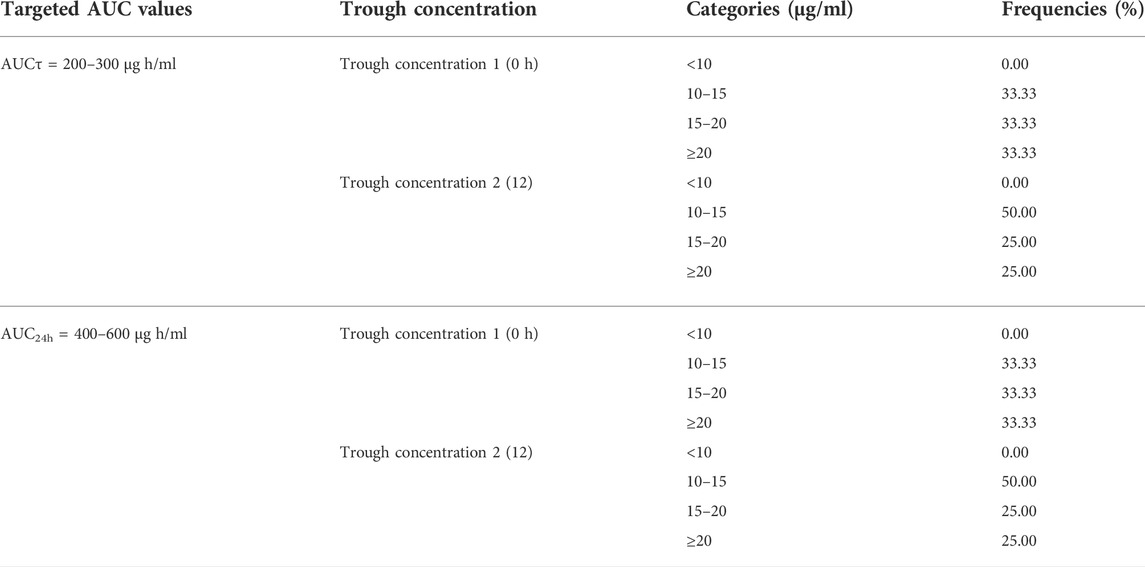
TABLE 6. Trough levels in patients with targeted AUC values (N = 12).
3.8 ROC curve and cut-off point calculation for AKI occurrence
Results of the ROC curve regarding cut-off point determination for AKI occurrence have been summarized in Table 7. Also, the area under the ROC curves that indicate the sensitivity and specificity of each parameter in the prediction of vancomycin-induced AKI (Figure 3; Table 7).
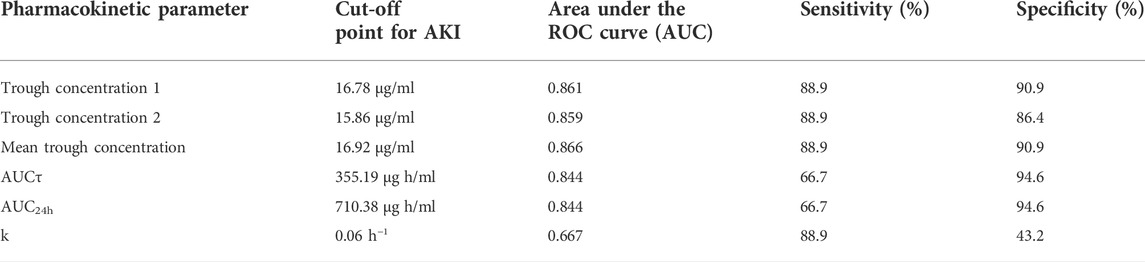
TABLE 7. Trough concentration and AUC cut-off points for AKI occurrence and the reported area under the ROC curve values.
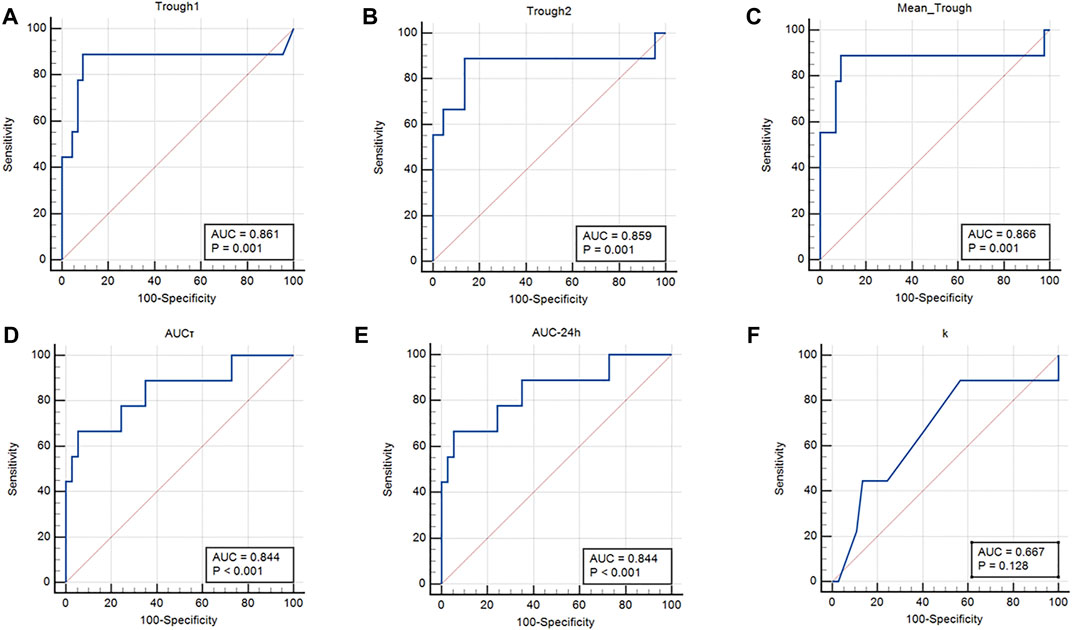
FIGURE 3. Area under the ROC curves. (A) Trough concentration 1 (0 h); (B) Trough concentration 2 (12 h); (C) Mean trough concentration; (D) AUCτ, (E) AUC24h; and (F) Elimination constant K.
4 Discussion
Most of the published papers on vancomycin pharmacokinetic and TDM studies are retrospective and observational (Póvoa et al., 2021). In this study, we designed a prospective interventional study of vancomycin pharmacokinetic assessments in critically ill patients and dose adjustments were done for all participants based on Eqs 5, 6 and individualized pharmacokinetic parameters. Results of this study revealed that there was a significant correlation between baseline GFR, baseline serum creatinine, trough and peak concentrations, AUCτ, AUC24h, Cl, and Vd values with vancomycin-induced AKI. The cut-off points for vancomycin-induced AKI were 16.92 μg/ml, 355.19 μg h/ml, and 710.38 μg h/ml for trough concentration, AUCτ, and AUC24h, respectively.
4.1 Pharmacokinetic assessments
Results of the pharmacokinetic analysis revealed that critically ill patients had average steady-state trough concentrations of 14.51 ± 12.90 and 14.43 ± 13.65 μg/ml at 0 and 12 h (for a 12-h interval dosing), respectively. The approximately same trough values indicated that steady-state conditions had been achieved during sample preparation. The mean values of AUCτ and AUC24h were 248.79 ± 207.08 and 497.58 ± 414.16 μg h/ml, respectively. These were lower than the results of the recent pharmacokinetic study in critically ill patients that reported the mean ± SD AUC24h of 604 ± 109 μg h/ml using the linear-log trapezoidal rule for AUC calculation (Turner et al., 2018b). Also, results of the another pharmacokinetic study on critically ill patients was receiving vancomycin reported mean ± SD AUC24h of 665.9 ± 136.5 μg h/ml which was higher than the results of present study and can be attributed to the heterogeneity of these critically ill patients with multiple complications (Shahrami et al., 2016). Results of a retrospective study confirmed that vancomycin AUC/MIC values of ≥400 in patients with entrococcal infection was significantly superior to AUC/MIC values of <400 in terms of clinical response and microbiological response. However, the rate of vancomycin induced-AKI was significantly higher in the former group (Katip and Oberdorfer, 2021). The wide range of pharmacokinetic parameters in these patients confirmed the altered pharmacokinetic characteristics in critically ill patients due to various physiologic and pathologic changes in patients conditions (Boucher et al., 2006; Ghasemiyeh et al., 2021a). Sepsis, a common cause of death in critically ill patients, can result in many physiologic changes, including capillary leak syndrome, cytokine release syndrome, vasodilation enhancement, and altered protein biosynthesis. These physiologic changes in septic patients can induce altered pharmacokinetic parameters (Radke et al., 2017). Also, altered plasma protein binding in critically ill patients can result in a higher volume of distribution (Vd) values that emphasize the necessity of higher dose requirements of hydrophilic drugs such as vancomycin (Zeind and Carvalho, 2018). Another altered pharmacokinetic parameter in critically ill patients would be creatinine clearance enhancement that would be due to the augmented renal clearance (ARC) phenomenon and acute kidney injury (AKI) occurrence (Zeind and Carvalho, 2018). The ARC in critically ill patients was accompanied with higher Cl values, shorter drug half-lives, and lower AUC values. Therefore, the required vancomycin dose to obtain optimum clinical response and reach to the targeted trough concentration and AUC values was enhanced accordingly (Sridharan et al., 2019). Also, augmented Vd and ClV values in septic critically ill patients emphasize the necessity of close therapeutic monitoring of vancomycin and higher dose administration, respectively (Roberts and Lipman, 2006). The enhanced Vd values of hydrophilic drugs including vancomycin, both in AKI and critically ill patients, could be attributed to the volume overload and decreased vancomycin protein binding [enhanced the fraction of unbound drug (Fu)]. Therefore, administration of higher loading dose amounts would be required (Eyler and Mueller, 2011). In addition, in patients with vancomycin-induced AKI, although the ClV and vancomycin renal elimination have been diminished, however, the residual kidney function along with the possible renal replacement therapies can enhance the net ClV values that should be considered in maintenance dose adjustment (Eyler and Mueller, 2011). Since vancomycin-induced AKI may be irreversible in many critically ill patients, vancomycin TDM using optimal pharmacokinetic parameters is essential to prevent morbidities and mortalities related to AKI occurrence in critically ill patients (Rybak et al., 2020). These results emphasized the necessity of the estimation of the individualized pharmacokinetic parameters (including Vd, Cl, k, and t ½) for each patient.
4.2 Vancomycin-induced AKI
In this study, 17% of the participated critically ill patients developed AKI during vancomycin treatment. The incidence of vancomycin-associated nephrotoxicity in our center was higher than that of a previous retrospective study in critically ill Japanese patients receiving vancomycin with AKI incidence of approximately 12% (13 out of 109 patients) (Chuma et al., 2018). In another study, the rate of vancomycin nephrotoxicity has been reported in range of 5% to 35%, respectively, (Karimzadeh et al., 2017). Results of a retrospective cohort study revealed that the rate of drug-induced AKI in the group of patients who were treated with concomitant vancomycin and piperacillin-tazobactam was significantly higher in comparison to those who were on concomitant vancomycin and cefepime regimen with AKI occurrence rate of 29% and 11%, respectively. Furthermore, the onset of AKI occurrence was significantly more rapid in the former group (Navalkele et al., 2017). Results of another study revealed that the occurrence of vancomycin-induced AKI was significantly higher in those who received concomitant vancomycin and piperacillin-tazobactam regimen in comparison to those who didn’t receive this combination. In addition, the results of this study revealed that the occurrence of vancomycin-induced AKI in both groups was significantly lower in those who received AUC-guided dosing services in comparison to those with trough-guided dosing approach. The rate of AKI incidences in AUC-guided dosing group were 13.6% and 3.8% in concomitant vancomycin and piperacillin-tazobactam group and non-concomitant group, respectively. While in trough-guided dosing group these values were 17.8% and 7.4%, respectively (Muklewicz et al., 2021). The association between baseline renal function and AKI occurrence revealed that baseline serum creatinine and GFR values were significantly associated with AKI occurrence. However, a retrospective study on non-dialysis patients revealed that the baseline renal function had no significant correlation with neither clinical efficacy nor nephrotoxicity occurrence during vancomycin vs. linezolid therapy in patients with MRSA pneumonia (Liu et al., 2017). Also, there was a highly significant association (p-value <0.0001) between each trough concentration, peak concentration, AUCτ, AUC24h, Cl, Vd with AKI occurrence, which indicates that these pharmacokinetic parameters would be considered as suitable parameters in vancomycin-induced AKI prediction. As mentioned in drug monographs including Lexi-Comp®, vancomycin administration schedule would be different between patients, varied from once a day administration to three doses per day; therefore, considering AUCτ, instead of AUC24h would be a more convenient parameter. Higher trough, peak, AUCτ, and AUC24h values, indicated the higher incidence of vancomycin-induced AKI. Results of a recent exposure-toxicity meta-analysis study revealed that the higher initial trough concentration and maximum trough concentration were significantly associated with the higher incidence of vancomycin-induced AKI (Bellos et al., 2020) which was consistent with our study results. Also, the results of a recent meta-analysis study emphasized that the AUC24h values of <650 μg h/ml could significantly reduce the incidence of vancomycin-induced AKI (Aljefri et al., 2019).
Furthermore, results of a recent retrospective study on the Veteran population revealed that the incidence of vancomycin nephrotoxicity in patients with AUC24h values of ≥550 μg h/ml was significantly higher in comparison to those with AUC24h values of <550 μg h/ml (Poston-Blahnik and Moenster, 2021). Lower Cl values showed a higher risk of vancomycin-induced AKI which could be attributed to the more accumulation of drug within the body secondary to reduced Cl. This results in higher cumulative AUC (AUCCUM) values which are significantly associated with a higher rate of vancomycin nephrotoxicity (Kloprogge et al., 2019). These findings regarding pharmacokinetic parameters were compatible with previous researches on vancomycin TDM (Pritchard et al., 2010; Finch et al., 2017a). Also, our results revealed that the lower the Vd values, the higher the incidence of vancomycin-induced AKI. There was no significant association between both t ½ and k with vancomycin-induced AKI (p-value = 0.259 and p-value = 0.138, respectively).
Results of the pharmacokinetic parameters assessments in present study revealed a significant association between each trough concentration, peak concentration, AUCτ, and AUC24h, Cl, and Vd with vancomycin-induced AKI. With higher trough, peak, AUCτ, and AUC24h values, the higher incidence of AKI. In contrast, with lower Cl values, there was higher incidence of vancomycin-induced AKI.
4.3 Correlation between baseline renal function and pharmacokinetic parameters
According to our results, there was no significant correlation between trough concentration 1, peak concentration, AUCτ, AUC24h, Vd, Cl, and k, with baseline serum creatinine. In contrast, a significant correlation was seen between trough concentration 1, trough concentration 2, peak concentration, AUCτ, and AUC24h with baseline GFR. These results once more emphasized the superiority of GFR over serum creatinine in predicting renal function status. As a classic marker of renal function, serum creatinine has several limitations in the early detection of renal dysfunction especially in critically ill patients (Sagheb et al., 2014). In present study, there was statistically significant negative correlations between baseline GFR and each of trough concentration, peak concentration, AUCτ, and AUC24h. No significant correlation was observed between Vd, Cl, k, and t½ with baseline GFR. There was a highly significant negative correlation between baseline serum creatinine and baseline GFR, which is completely compatible with the Cockcroft-Gault equation for GFR calculation (Yamaki and Nguyen, 2020). Results of a previous study on septic patients revealed that the GFR (ClCr) with higher sensitivity and higher ROC area under the curve was superior to serum creatinine in terms of prediction of insufficient vancomycin trough concentration. The sensitivity of GFR and serum creatinine in prediction were 26% and 11%, respectively. While the ROC area under the curve values for GFR and serum creatinine were 0.75 and 0.69, respectively (Ocampos-Martinez et al., 2012). Results of a previous pharmacokinetic study in patients with various stages of kidney disease including GFR>60 ml/min, GFR 10–60 ml/min, and GFR<10 ml/min revealed that there was no significant correlation between Vd and baseline GFR that was incompatible with our results. However, a significant negative correlation was seen between mean half-life and baseline GFR along with a positive correlation between Cl and baseline GFR (Matzke et al., 1984). These contradictory results from our study would be attributed to the exclusion of patients with GFR<45 ml/min in our pharmacokinetic study.
4.4 AKI occurrence in different groups of patients regarding their trough and AUC values
The rate of vancomycin-induced AKI occurrence was significantly different in groups of patients based on trough concentrations, AUCτ, and AUC24h values. Higher values of these parameters indicate a higher rate of AKI occurrence, which was in compatible with the results of previous pharmacokinetic studies (Finch et al., 2017b; Bellos et al., 2020). In addition, the results of a retrospective study on critically ill patients which categorized patients based on their trough concentration values into 4 groups of trough concentrations of <10, 10–15, 15–20, and ≥20 μg/ml, revealed that the early-onset vancomycin-induced AKI was significantly associated with trough concentrations of ≥20 μg/ml. Also, they reported that the occurrence of vancomycin-induced AKI in the group with a trough concentration of ≥20 μg/ml was significantly higher than that of the group with a trough concentration of <10 μg/ml (31.3% vs. 6.3%) (Chuma et al., 2018).
4.5 Trough concentration values in patients with targeted AUCτ and AUC24h values
According to the recently published guidelines, vancomycin TDM should be performed based on AUC24h values of 400–600 μg h/ml. Accordingly, in this study, we suggest the AUCτ values of 200–300 μg h/ml for a 12-h dosing interval regimen to reach optimal efficacy and prevent vancomycin nephrotoxicity. Results of our study revealed that 33.33% (4 out of 12) of critically ill patients with these targeted AUC values (AUC24h of 400–600 μg h/ml and AUCτ of 200–300 μg h/ml) had trough one concentration of 10–15 μg/ml, 33.33% of them had trough one values of 15–20 μg/ml, and the remaining 33.33% had trough one values of ≥20 μg/ml. These percentages were 50% (6 out of 12), 25%, and 25%, for trough two concentrations, respectively. So, these results revealed that up to 33.33–50% of patients with trough concentrations <15 μg/ml could reach the targeted AUC values. These lower trough values could prevent higher drug exposure and further unwanted nephrotoxicity. These results were compatible with the previous study on vancomycin pharmacokinetic which revealed that among patients with AUC24h ≥ 400 μg/ml, 59% had trough concentration <15 μg/ml, 18% had trough concentration of 15–20 μg/ml, and 23% had trough concentration of ≥20 μg/ml (Neely et al., 2014). So, trough concentration would not be considered as a sole suitable surrogate of AUC monitoring (Neely et al., 2014; Lodise and Drusano, 2021; Póvoa et al., 2021; Tsutsuura et al., 2021). However, still trough-based monitoring approach has been considered as the most routine practical method of vancomycin TDM in different center around the world because of the ease of blood sampling and dosing adjustment (Stewart et al., 2021). Results of a prospective study revealed that among all the enrolled patients, 19% of all measured trough concentrations were in therapeutic ranges of 15–20 μg/ml, while 70% of all calculated AUC values had adequate ranges which support the superiority of AUC-guided dosing over the trough only-based vancomycin dosing. In addition, the results of this study revealed that the vancomycin AUC-based dose adjustment was accompanied with reduced the required plasma samples preparation, shorter duration of antibiotic therapy, and reduced the risk of vancomycin-induced AKI in comparison to trough only-based monitoring approach. The clinical efficacy was equal in these monitoring approaches (Neely et al., 2018).
4.6 ROC curve and cut-off point calculation for AKI occurrence
Results of the ROC curve revealed that trough concentration, AUCτ, and AUC24h are the best pharmacokinetic parameters for vancomycin-induced AKI prediction. Also, k would be as other pharmacokinetic parameters with lower sensitivity for AKI prediction. The suggested cut-off points in which the higher values would be significantly associated with vancomycin-induced AKI occurrence were 16.92 μg/ml for mean trough concentration with the area under the ROC curve of 0.866. In addition, the suggested cut-off points for AUCτ and AUC24h were 355.19 and 710.38 μg h/ml, respectively with the area under the ROC curve of 0.844. Although the sensitivity of trough concentrations was higher (88.9%), however, the AUCτ and AUC24h had higher specificity values (94.6%) in vancomycin-induced AKI prediction. Results of a previous study on vancomycin pharmacokinetic reported that the cut-off point of 12.1 μg/ml for vancomycin trough concentration should be considered to prevent vancomycin nephrotoxicity (Han et al., 2014). According to another pharmacokinetic study on critically ill patients, vancomycin trough concentration threshold of 16.5 μg/ml is crucial to prevent vancomycin-induced AKI occurrence which was more compatible with the results of the present study (Hanrahan et al., 2015). In another study that was performed on Brazilian critically ill patients, vancomycin trough concentration threshold of 17.53 μg/ml with sensitivity, specificity, and ROC area under the curve of 79.7%, 83.3%, and 0.806, respectively was reported as predictor of vancomycin-induced AKI between the second and fourth days of vancomycin administration (Zamoner et al., 2022). Also, a recent meta-analysis study has reported that the cut-off point of 650 μg h/ml for AUC24h should be maintained to prevent vancomycin-induced AKI. According to this study, using the AUC-monitoring approach could significantly lower the incidence of nephrotoxicity compared to the trough-only-based method (Aljefri et al., 2019).
Furthermore, the suggested cut-off point of 0.06 h−1 for k with the area under the ROC curve of 0.667 and sensitivity of 88.9% would be an alternative pharmacokinetic parameter for vancomycin-induced AKI prediction with lower specificity amounts (43.2%). The k values lower than the suggested cut-off point would be associated with vancomycin accumulation and consequently AKI occurrence.
4.7 Study limitations
This study is a part of a prospective, interventional study in a single-center that included critically ill patients from the general and central ICUs of Nemazee Hospital, Shiraz, Iran. It has no matched control group that included critically ill patients from the general and central ICU of Nemazee Hospital, Shiraz, Iran. So, further larger clinical trials with the control group are required to confirm these results. In this study, vancomycin was administered with the usual dosage. The results of this study may not reproducible and cannot be extrapolated to the critically ill patients with augmented renal clearance (ARC) phenomenon. So, dose simulation and population pharmacokinetic studies are required to confirm these results. Finally, it would be better to consider the effect of pharmacogenetics and gene polymorphisms on the occurrence of vancomycin nephrotoxicity.
5 Conclusion
According to the results of this prospective study and individualized pharmacokinetic parameters, dosing justification is necessary almost in 50% of the patients. Although a significant correlation was seen between each of trough concentration, peak concentration, AUCτ, AUC24h, Vd, Cl, baseline serum creatinine, and baseline GFR values and vancomycin-induced AKI, but AUC-based monitoring approach for vancomycin TDM would be superior to trough-only monitoring approach in terms of nephrotoxicity prediction. Also, in order to avoid vancomycin-induced AKI, trough concentration, AUCτ, and AUC24h, values should be maintained below the cut-off points including 16.92 μg/ml, 355.19 μg h/ml, and 710.38 μg h/ml respectively.
The main focus of this study was on calculation and application of AUCτ along with AUC24h to assess vancomycin efficacy and also vancomycin-associated nephrotoxicity in critically ill patients that has not been reported elsewhere. The main advantage of AUCτ would be the reduction in the number of required plasma samples to calculate the time-concentration curve area in comparison to the AUC24h, especially in those who are receiving vancomycin with a dosing interval different from the daily dosing schedules (ie., 6, 8, 12, or 48 h). In addition, through the recruitment of AUCτ, faster assessments of various pharmacokinetic parameters, vancomycin dose adjusting, and decision-making about patients’ pharmacotherapy regimens would be obtained. Also, the correlation of GFR and serum creatinine values with pharmacokinetic parameters has been assessed which confirmed the superiority of GFR in terms of nephrotoxicity prediction and correlation with pharmacokinetic parameters. Furthermore, in this study, the cut-off points of AUCτ, AUC24h, and trough concentrations have been reported in critically ill patients using ROC curves to avoid vancomycin-associated nephrotoxicity which has not been reported together elsewhere.
Data availability statement
The original contributions presented in the study are included in the article/Supplementary Material, further inquiries can be directed to the corresponding authors.
Ethics statement
The studies involving human participants were reviewed and approved by the Ethics committee of Shiraz University of Medical Sciences, Shiraz, Iran. The patients/participants provided their written informed consent to participate in this study.
Author contributions
PG contributed in data collection, methodology, formal analysis, and writing—original draft, reviewing and revising. FZ, IK, AA, MM, and GS contributed in methodology and writing—reviewing and revising. EH contributed in statistical analysis and writing- reviewing and revising. AV contributed in conceptualization, supervision, methodology, and writing— reviewing and revising. SM-S contributed in conceptualization, supervision, methodology, formal analysis, project administration, and writing—reviewing and revising. All authors have approved the final version of this manuscript.
Funding
This study was financially supported by the Vice-Chancellor for Research of Shiraz University of Medical Sciences [Grant No. 97-01-36–19208].
Acknowledgments
This study was a part of the Ph.D. thesis of PG.
Conflict of interest
The authors declare that the research was conducted in the absence of any commercial or financial relationships that could be construed as a potential conflict of interest.
Publisher’s note
All claims expressed in this article are solely those of the authors and do not necessarily represent those of their affiliated organizations, or those of the publisher, the editors and the reviewers. Any product that may be evaluated in this article, or claim that may be made by its manufacturer, is not guaranteed or endorsed by the publisher.
References
Aljefri, D. M., Avedissian, S. N., Rhodes, N. J., Postelnick, M. J., Nguyen, K., Scheetz, M. H., et al. (2019). Vancomycin area under the curve and acute kidney injury: a meta-analysis. Clin. Infect. Dis. 69 (11), 1881–1887. doi:10.1093/cid/ciz051
Bellos, I., Daskalakis, G., and Pergialiotis, V. (2020). Relationship of vancomycin trough levels with acute kidney injury risk: an exposure–toxicity meta-analysis. J. Antimicrob. Chemother. 75 (10), 2725–2734. doi:10.1093/jac/dkaa184
Boucher, B. A., Wood, G. C., and Swanson, J. M. (2006). Pharmacokinetic changes in critical illness. Crit. Care Clin. 22 (2), 255–271. doi:10.1016/j.ccc.2006.02.011
Chuma, M., Makishima, M., Imai, T., Tochikura, N., Suzuki, S., Kuwana, T., et al. (2018). Relationship between initial vancomycin trough levels and early-onset vancomycin-associated nephrotoxicity in critically ill patients. Ther. Drug Monit. 40 (1), 109–114. doi:10.1097/FTD.0000000000000459
Drugbank (2022). Vancomycin. Available at: https://go.drugbank.com/drugs/DB00512. (Accessed April, 2022).
Estes, K. S., and Derendorf, H. (2010). Comparison of the pharmacokinetic properties of vancomycin, linezolid, tigecyclin, and daptomycin. Eur. J. Med. Res. 15 (12), 533–543. doi:10.1186/2047-783x-15-12-533
Eyler, R. F., and Mueller, B. A. (2011). Antibiotic dosing in critically ill patients with acute kidney injury. Nat. Rev. Nephrol. 7 (4), 226–235. doi:10.1038/nrneph.2011.12
Finch, N. A., Zasowski, E. J., Murray, K. P., Mynatt, R. P., Zhao, J. J., Yost, R., et al. (2017). A quasi-experiment to study the impact of vancomycin area under the concentration-time curve-guided dosing on vancomycin-associated nephrotoxicity. Antimicrob. Agents Chemother. 61 (12), e01293.
Finch, N. A., Zasowski, E. J., Murray, K. P., Mynatt, R. P., Zhao, J. J., Yost, R., et al. (2017). The impact of vancomycin area under the concentration-time curve-guided dosing on vancomycin-associated nephrotoxicity: a quasi-experiment. Antimicrob. Agents Chemother. 61, e01293. doi:10.1128/AAC.01293-17
Ghasemiyeh, P., Vazin, A., Zand, F., Azadi, A., Karimzadeh, I., Mohammadi-Samani, S., et al. (2020). A simple and validated HPLC method for vancomycin assay in plasma samples: the necessity of TDM center development in southern Iran. Res. Pharm. Sci. 15 (6), 529–540. doi:10.4103/1735-5362.301337
Ghasemiyeh, P., Mohammadi-Samani, S., Firouzabadi, N., Vazin, A., and Zand, F. (2021). A brief ICU residents’ guide: pharmacotherapy, pharmacokinetic aspects and dose adjustments in critically ill adult patients admitted to ICU. Trends Anaesth. Crit. Care 41, 11–31. doi:10.1016/j.tacc.2021.05.004
Ghasemiyeh, P., Vazin, A., and Mohammadi-Samani, S. (2021). Therapeutic drug monitoring of vancomycin in patients with altered pharmacokinetics: a narrative review on pharmacokinetic assessments. Authorea Prepr.. doi:10.22541/au.162430392.28668105/v1
Han, H. K., An, H., Shin, K-H., Shin, D., Lee, S. H., Kim, J. H., et al. (2014). Trough concentration over 12.1 mg/L is a major risk factor of vancomycin-related nephrotoxicity in patients with therapeutic drug monitoring. Ther. Drug Monit. 36 (5), 606–611. doi:10.1097/FTD.0000000000000061
Hanrahan, T., Kotapati, C., Roberts, M., Rowland, J., Lipman, J., Roberts, J., et al. (2015). Factors associated with vancomycin nephrotoxicity in the critically ill. Anaesth. Intensive Care 43 (5), 594–599. doi:10.1177/0310057X1504300507
He, N., Su, S., Ye, Z., Du, G., He, B., Li, D., et al. (2020). Evidence-based guideline for therapeutic drug monitoring of vancomycin: 2020 update by the division of therapeutic drug monitoring, Chinese pharmacological society. Clin. Infect. Dis. 71, S363–S371. doi:10.1093/cid/ciaa1536
Javorska, L., Krcmova, L. K., Solichova, D., Solich, P., and Kaska, M. (2016). Modern methods for vancomycin determination in biological fluids by methods based on high-performance liquid chromatography–A review. J. Sep. Sci. 39 (1), 6–20. doi:10.1002/jssc.201500600
Karimzadeh, I., Haghighati, G., Ramzi, M., Sagheb, M. M., and Zomorodian, K. (2017). Assessing the epidemiology of nephrotoxicity and the role of urinary kidney injury molecule 1 as a biomarker of renal function in hematologic-oncologic patients under vancomycin treatment in Shiraz, Iran. Iran. Red. Crescent Med. J. 19, 1–10.
Katip, W., and Oberdorfer, P. (2021). A monocentric retrospective study of AUC/MIC ratio of vancomycin associated with clinical outcomes and nephrotoxicity in patients with enterococcal infections. Pharmaceutics 13 (9), 1378. doi:10.3390/pharmaceutics13091378
Kim, J. Y., Kim, K. Y., Yee, J., and Gwak, H. S. (2022). Risk scoring system for vancomycin-associated acute kidney injury. Front. Pharmacol. 13, 815188. doi:10.3389/fphar.2022.815188
Kloprogge, F., Hill, L. F., Booth, J., Klein, N., Irwin, A. D., Dixon, G., et al. (2019). Revising pediatric vancomycin dosing accounting for nephrotoxicity in a pharmacokinetic-pharmacodynamic model. Antimicrob. Agents Chemother. 63 (5), e00067. doi:10.1128/AAC.00067-19
Liu, P., Capitano, B., Stein, A., and El-Solh, A. A. (2017). Clinical outcomes of linezolid and vancomycin in patients with nosocomial pneumonia caused by methicillin-resistant Staphylococcus aureus stratified by baseline renal function: a retrospective, cohort analysis. BMC Nephrol. 18 (1), 168. doi:10.1186/s12882-017-0581-y
Lodise, T. P., and Drusano, G. (2021). Vancomycin area under the curve–guided dosing and monitoring for adult and pediatric patients with suspected or documented serious methicillin-resistant Staphylococcus aureus infections: putting the safety of our patients first. Clin. Infect. Dis. 72 (9), 1497–1501. doi:10.1093/cid/ciaa1744
Matzke, G. R., Mcgory, R. W., Halstenson, C. E., and Keane, W. F. (1984). Pharmacokinetics of vancomycin in patients with various degrees of renal function. Antimicrob. Agents Chemother. 25 (4), 433–437. doi:10.1128/aac.25.4.433
Muklewicz, J. D., Steuber, T. D., and Edwards, J. D. (2021). Evaluation of area under the concentration–time curve-guided vancomycin dosing with or without piperacillin-tazobactam on the incidence of acute kidney injury. Int. J. Antimicrob. Agents 57 (1), 106234. doi:10.1016/j.ijantimicag.2020.106234
Navalkele, B., Pogue, J. M., Karino, S., Nishan, B., Salim, M., Solanki, S., et al. (2017). Risk of acute kidney injury in patients on concomitant vancomycin and piperacillin–tazobactam compared to those on vancomycin and cefepime. Clin. Infect. Dis. 64 (2), 116–123. doi:10.1093/cid/ciw709
Neely, M. N., Youn, G., Jones, B., Jelliffe, R. W., Drusano, G. L., Rodvold, K. A., et al. (2014). Are vancomycin trough concentrations adequate for optimal dosing? Antimicrob. Agents Chemother. 58 (1), 309–316. doi:10.1128/AAC.01653-13
Neely, M. N., Kato, L., Youn, G., Kraler, L., Bayard, D., van Guilder, M., et al. (2018). Prospective trial on the use of trough concentration versus area under the curve to determine therapeutic vancomycin dosing. Antimicrob. Agents Chemother. 62 (2), e02042. doi:10.1128/AAC.02042-17
Ocampos-Martinez, E., Penaccini, L., Scolletta, S., Abdelhadii, A., Devigili, A., Cianferoni, S., et al. (2012). Determinants of early inadequate vancomycin concentrations during continuous infusion in septic patients. Int. J. Antimicrob. Agents 39 (4), 332–337. doi:10.1016/j.ijantimicag.2011.12.008
Poston-Blahnik, A., and Moenster, R. (2021). “Association between vancomycin area under the curve and nephrotoxicity: a single center, retrospective cohort study in a veteran population,” in Open forum infectious diseases (US: Oxford University Press).
Póvoa, P., Moniz, P., Pereira, J. G., and Coelho, L. (2021). Optimizing antimicrobial drug dosing in critically ill patients. Microorganisms 9 (7), 1401. doi:10.3390/microorganisms9071401
Pritchard, L., Baker, C., Leggett, J., Sehdev, P., Brown, A., Bayley, K. B., et al. (2010). Increasing vancomycin serum trough concentrations and incidence of nephrotoxicity. Am. J. Med. 123 (12), 1143–1149. doi:10.1016/j.amjmed.2010.07.025
Radke, C., Horn, D., Lanckohr, C., Ellger, B., Meyer, M., Eissing, T., et al. (2017). Development of a physiologically based pharmacokinetic modelling approach to predict the pharmacokinetics of vancomycin in critically ill septic patients. Clin. Pharmacokinet. 56 (7), 759–779. doi:10.1007/s40262-016-0475-3
Roberts, J. A., and Lipman, J. (2006). Antibacterial dosing in intensive care: pharmacokinetics, degree of disease and pharmacodynamics of sepsis. Clin. Pharmacokinet. 45 (8), 755–773. doi:10.2165/00003088-200645080-00001
Rybak, M. J., Le, J., Lodise, T. P., Levine, D. P., Bradley, J. S., Liu, C., et al. (2020). Therapeutic monitoring of vancomycin for serious methicillin-resistant Staphylococcus aureus infections: a revised consensus guideline and review by the American society of health-system pharmacists, the infectious diseases society of America, the pediatric infectious diseases society, and the society of infectious diseases pharmacists. Clin. Infect. Dis. 71 (6), 1361–1364. doi:10.1093/cid/ciaa303
Rybak, M. J. (2006). The pharmacokinetic and pharmacodynamic properties of vancomycin. Clin. Infect. Dis. 42, S35–S39. doi:10.1086/491712
Sacristan, J., and Soto, J. (1992). Vancomycin peak concentration and ototoxicity prevention. J. Antimicrob. Chemother. 30 (6), 865–866. doi:10.1093/jac/30.6.865
Sagheb, M. M., Namazi, S., Geramizadeh, B., Karimzadeh, A., Oghazian, M. B., Karimzadeh, I., et al. (2014). Serum cystatin C as a marker of renal function in critically ill patients with normal serum creatinine. Nephrourol. Mon. 6 (2), e15224. doi:10.5812/numonthly.15224
Shahrami, B., Najmeddin, F., Mousavi, S., Ahmadi, A., Rouini, M. R., Sadeghi, K., et al. (2016). Achievement of vancomycin therapeutic goals in critically ill patients: early individualization may be beneficial. Crit. care Res. Pract. 2016, 1245815. doi:10.1155/2016/1245815
Sridharan, K., Al Daylami, A., Ajjawi, R., Al-Ajooz, H., and Veeramuthu, S. (2019). Clinical pharmacokinetics of vancomycin in critically ill children. Eur. J. Drug Metab. Pharmacokinet. 44 (6), 807–816. doi:10.1007/s13318-019-00568-6
Srisawasdi, P., Chaichanajarernkul, U., Teerakanjana, N., Vanavanan, S., and Kroll, M. (2010). Exogenous interferences with jaffe creatinine assays: addition of sodium dodecyl sulfate to reagent eliminates bilirubin and total protein interference with jaffe methods. J. Clin. Lab. Anal. 24 (3), 123–133. doi:10.1002/jcla.20350
Stewart, J. J., Jorgensen, S. C., Dresser, L., Lau, T. T., Gin, A., Thirion, D. J., et al. (2021). A Canadian perspective on the revised 2020 ASHP–IDSA–PIDS–SIDP guidelines for vancomycin AUC-based therapeutic drug monitoring for serious MRSA infections. Official J. Assoc. Med. Microbiol. Infect. Dis. Can. 6 (1), 3–9. doi:10.3138/jammi-2020-0028
Tsutsuura, M., Moriyama, H., Kojima, N., Mizukami, Y., Tashiro, S., Osa, S., et al. (2021). The monitoring of vancomycin: a systematic review and meta-analyses of area under the concentration-time curve-guided dosing and trough-guided dosing. BMC Infect. Dis. 21 (1), 153. doi:10.1186/s12879-021-05858-6
Turner, R. B., Kojiro, K., Won, R., Chang, E., Chan, D., Elbarbry, F., et al. (2018). Prospective evaluation of vancomycin pharmacokinetics in a heterogeneous critically ill population. Diagn. Microbiol. Infect. Dis. 92 (4), 346–351. doi:10.1016/j.diagmicrobio.2018.06.022
Turner, R. B., Kojiro, K., Shephard, E. A., Won, R., Chang, E., Chan, D., et al. (2018). Review and validation of Bayesian dose-optimizing software and equations for calculation of the vancomycin area under the curve in critically ill patients. Pharmacotherapy 38 (12), 1174–1183. doi:10.1002/phar.2191
Usman, M., and Hempel, G. (2016). Development and validation of an HPLC method for the determination of vancomycin in human plasma and its comparison with an immunoassay (PETINIA). Springerplus 5 (1), 124. doi:10.1186/s40064-016-1778-4
Vazin, A., Japoni, A., Shahbazi, S., and Davarpanah, M. A. (2012). Vancomycin utilization evaluation at hematology-oncology ward of a teaching hospital in Iran. Iran. J. Pharm. Res. 11 (1), 163–170. doi:10.1128/AAC.01293-17
Vazin, A., Birjand, M. M., and Darake, M. (2018). Evaluation of vancomycin therapy in the adult ICUs of a teaching hospital in southern Iran. Drug Healthc. Patient Saf. 10, 21–26. doi:10.2147/DHPS.S149451
Yamaki, J., and Nguyen, L. (2020). A brief evaluation of vancomycin loading doses and nephrotoxicity in the elderly population. Infect. Dis. 52 (10), 751–754. doi:10.1080/23744235.2020.1784998
Zamoner, W., Eid, K. Z. C., de Almeida, L. M. B., Pierri, I. G., Santos, Ad, Balbi, A. L., et al. (2022). The serum concentration of vancomycin as a diagnostic predictor of nephrotoxic acute kidney injury in critically ill patients. Antibiotics 11 (1), 112. doi:10.3390/antibiotics11010112
Zasowski, E. J., Murray, K. P., Trinh, T. D., Finch, N. A., Pogue, J. M., Mynatt, R. P., et al. (2018). Identification of vancomycin exposure-toxicity thresholds in hospitalized patients receiving intravenous vancomycin. Antimicrob. Agents Chemother. 62 (1), e01684. doi:10.1128/AAC.01684-17
Keywords: vancomycin, therapeutic drug monitoring (TDM), pharmacokinetic parameters, critically ill patients, nephrotoxicity, cut-off point, ROC curves, AUC of intervals (AUCτ)
Citation: Ghasemiyeh P, Vazin A, Zand F, Haem E, Karimzadeh I, Azadi A, Masjedi M, Sabetian G, Nikandish R and Mohammadi-Samani S (2022) Pharmacokinetic assessment of vancomycin in critically ill patients and nephrotoxicity prediction using individualized pharmacokinetic parameters. Front. Pharmacol. 13:912202. doi: 10.3389/fphar.2022.912202
Received: 17 May 2022; Accepted: 15 July 2022;
Published: 24 August 2022.
Edited by:
Takeo Nakanishi, Takasaki University of Health and Welfare, JapanCopyright © 2022 Ghasemiyeh, Vazin, Zand, Haem, Karimzadeh, Azadi, Masjedi, Sabetian, Nikandish and Mohammadi-Samani. This is an open-access article distributed under the terms of the Creative Commons Attribution License (CC BY). The use, distribution or reproduction in other forums is permitted, provided the original author(s) and the copyright owner(s) are credited and that the original publication in this journal is cited, in accordance with accepted academic practice. No use, distribution or reproduction is permitted which does not comply with these terms.
*Correspondence: Soliman Mohammadi-Samani, c21zYW1hbmlAc3Vtcy5hYy5pcg==; Afsaneh Vazin, VmF6ZWVuYUBzdW1zLmFjLmly