- 1Department of Clinical Pharmacy and Pharmacy Administration, School of Pharmacy, Fudan University, Shanghai, China
- 2Department of Pharmacy, Shanghai Children’s Medical Center, School of Medicine, Shanghai Jiao Tong University, Shanghai, China
- 3Department of Pharmacy, Shanghai Chest Hospital, Shanghai Jiao Tong University, Shanghai, China
Pharmacokinetic characterization plays a vital role in drug discovery and development. Although involving numerous laboratory animals with error-prone, labor-intensive, and time-consuming procedures, pharmacokinetic profiling is still irreplaceable in preclinical studies. With physiologically based pharmacokinetic (PBPK) modeling, the in vivo profiles of drug absorption, distribution, metabolism, and excretion can be predicted. To evaluate the application of such an approach in preclinical investigations, the plasma pharmacokinetic profiles of seven commonly used probe substrates of microsomal enzymes, including phenacetin, tolbutamide, omeprazole, metoprolol, chlorzoxazone, nifedipine, and baicalein, were predicted in rats using bottom-up PBPK models built with in vitro data alone. The prediction’s reliability was assessed by comparison with in vivo pharmacokinetic data reported in the literature. The overall predicted accuracy of PBPK models was good with most fold errors within 2, and the coefficient of determination (R2) between the predicted concentration data and the observed ones was more than 0.8. Moreover, most of the observation dots were within the prediction span of the sensitivity analysis. We conclude that PBPK modeling with acceptable accuracy may be incorporated into preclinical studies to refine in vivo investigations, and PBPK modeling is a feasible strategy to practice the principles of 3Rs.
1 Introduction
The pharmacokinetics study, including examining absorption, distribution, metabolism, and excretion (ADME) profiles of therapeutic agents, plays a vital role in drug discovery and development (Prentis et al., 1988). Because of poor extrapolation from in vitro to in vivo efficacy, pharmacokinetics profiling processes are routinely implemented in the pharmaceutical industry for early preclinical optimization (Lin and Lu, 1997). However, such processes commonly involve error-prone, labor-intensive, and time-consuming procedures. Not to mention ethics and the welfare of laboratory animals. It was estimated that more than 100 million laboratory animals were sacrificed for biomedical research annually (Taylor and Alvarez, 2019). Therefore, William Russel and Rex Burch proposed the 3Rs principle (replacement, reduction, and refinement) in 1959 (Vitale et al., 2009; Wachsmuth et al., 2021), attempting to reduce animal use. The 2010 EU Directive states that animals have intrinsic values that need to be respected and that animal experiments should be carefully evaluated in biomedical research, with animal welfare considerations a top priority. Currently, the 3Rs have evolved into basic requirements for researchers to comply with based on animal welfare legislation. Several non-animal testings, including in vitro and in silico approaches describing the ADME properties, have also been developed to achieve high-throughput screening in drug development. However, unlike understanding the all-inclusive fate of compounds in the body through animal experiments, these conventional in vitro methods generally only cover a single-ADME process (Pelkonen and Turpeinen, 2007; Cascone et al., 2016). For example, the commonly used in vitro methods for studying drug absorption (Irvine et al., 1999; Verhoeckx et al., 2015; Dargó et al., 2019) or metabolism (Raunio et al., 2004; Hariparsad et al., 2006; Pelkonen and Turpeinen, 2007; van de Kerkhof et al., 2007), such as artificial biofilm models, cell models, and microsomal experiments. Similarly, in silico approaches, including the quantitative structure–activity relationship construction model (QSAR), were generally applied to predict the individual biological activity of candidate compounds such as apparent permeability (Papp), plasma protein binding rate, and apparent volume of distribution (Vdss) in the early drug discovery process (Ekins et al., 2000; Yamashita and Hashida, 2004; Lombardo et al., 2017). Despite the abundant data sources, a key challenge remains in correlating the in vitro results of ADME features to establish in vivo models to reflect the overall disposal.
PBPK modeling was raised back in 1937 and initially applied in predicting the distribution of environmental compounds in mammalian tissues (Lindstrom et al., 1974), and further gradually used for drug exposure prediction, dose extrapolation, and safety assessment (Andersen et al., 1987; Haddad et al., 2001; Meek et al., 2013; Li et al., 2021). PBPK modeling is a mathematical method following the material balance principle to predict the time course of xenobiotic levels in plasma and tissues based on the physiochemical and pharmacokinetic parameters of compounds (Nestorov, 2003). Tremendous progress has been made in PBPK modeling during the past decade. In addition to the rapidly gained industrial recognition (Rowland et al., 2011; Miller et al., 2019), PBPK analysis has also become a routine for the regulatory authorities, especially the United States Food and Drug Administration (FDA), upon new drug applications since 2016 (Zhang et al., 2020).
Currently, the PBPK model has been widely used in various stages of drug development (Chen et al., 2012; Huang et al., 2013), such as evaluating interspecies differences, drug–drug interactions (Jin et al., 2022), targeted tissue exposure, and disease effect (Rostami-Hodjegan and Tucker, 2007; Clewell and Clewell, 2008; Hans and Ursula, 2009; Rietjens et al., 2010; Mielke et al., 2011; Ball et al., 2014). In addition to the top–down modeling, many PBPK models have adopted in vitro PK parameters for bottom–up modeling or experimental in vivo parameters for “middle-out” approaches as preliminary verification and model optimization (Rostami-Hodjegan and Tucker, 2007; Rietjens et al., 2010; Kostewicz et al., 2014; Templeton et al., 2018; Chang et al., 2019; Umehara et al., 2019). Moreover, given some mechanistic reasons (such as paracellular absorption, active absorption, and targeted transport), many bottom–up PBPK models still require animal data (Wagner, 1981; Clewell and Clewell, 2008). For example, the distribution parameters used in many PBPK models are tissue partition coefficients or steady state distribution parameters from in vivo experiments (Harrison and Gibaldi, 1977; Igari et al., 1983; S et al., 2007; T’jollyn et al., 2018). A few PBPK modelings are wholly constructed from in vitro parameters without in vivo parameters to be fitted and optimized, lacking universal application (Cheng and Ng, 2017). Therefore, constructing a universal PBPK model entirely only with in vitro data and the issue of estimating the predicted accuracy in the absence of in vivo PK data have caused widespread concern recently (Ellison, 2018; Paini et al., 2019).
To evaluate the feasibility of using PBPK modeling as an alternative for animal experiments, we developed bottom–up PBPK models solely with in vitro data using Simcyp® (Sheffield, United Kingdom) to predict the systemic disposition of seven commonly used liver microsomal enzyme probe substrates in rats. The reliability of each prediction was examined with sensitivity analysis. As a practice of 3Rs, this proof-of-concept study will shed light on the refinement of current drug development procedures and may reduce animal usage in drug development.
2 Materials and Methods
2.1 Model Inputs Collection
Typical probe substrates of cytochrome P450 (CYP) 1A2, CYP2C9, CYP2C19, CYP2D6, CYP2E1, CYP3A4/5, and UDP-glucuronosyltransferase (UGT), namely, phenacetin, tolbutamide, omeprazole, metoprolol, chlorzoxazone, nifedipine, and baicalein were used as model drugs. The in vitro parameters were divided into three categories. Physical chemistry and blood binding-related parameters include molecular weight (MW), neutral species octanol: water partition coefficient (logPo:w), compound type (base/acid/mono/diprotic/ampholyte), negative decadic logarithm of the ionization constant of an acid (pKa), blood to plasma partition ratio (B/P), and fraction unbound in plasma (fu). Distribution is affected by the free fraction and the lipid solubility of the drug, which is related to the physiological characteristics mentioned, such as logPo:w, pKa, and fu. Parameters about absorption include apparent permeability coefficients (Papp), polar surface area (PSA), and hydrogen bond donors (HBD). In vivo elimination can be extrapolated via a well-stirred liver model together with the parallel tube model (Pang and Rowland, 1977) and the dispersion model (Iwatsubo et al., 1997) using in vitro metabolic data, including Michaelis–Menten constant for metabolism (Km), maximum velocity for metabolism (Vmax), and intrinsic clearance (CLint). Various in vitro data of model drugs collected from different literature and databases (DrugBank, PubChem, HSDB, TOXNET, etc.) were compiled in Supplementary Table S1, and the units of each parameter were uniformly converted.
2.2 Physiologically Based Pharmacokinetic Modeling
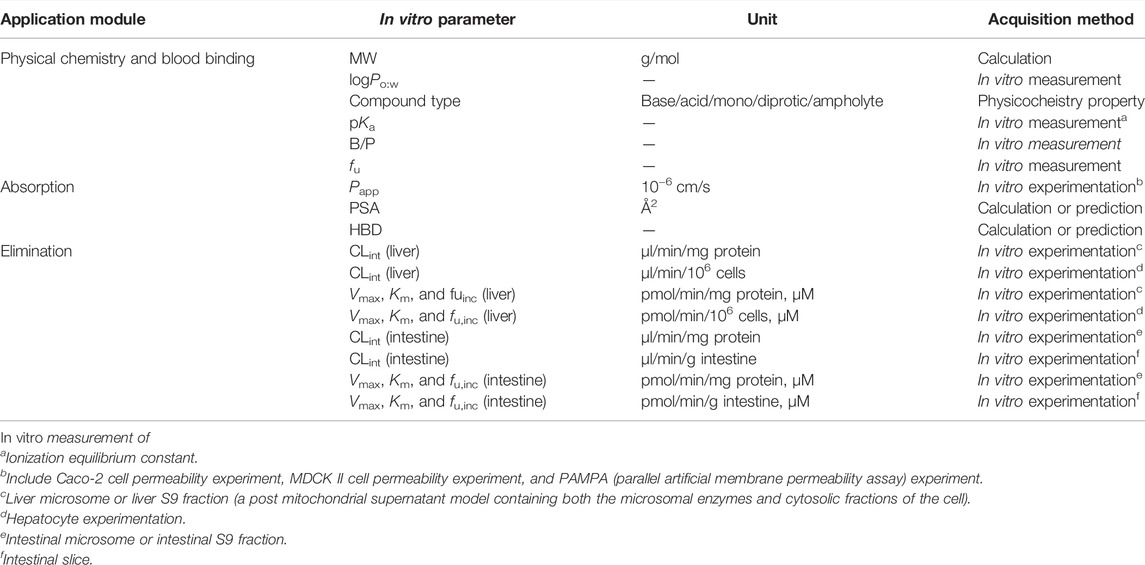
PBPK models were constructed with in vitro data alone using Simcyp® (Simcyp Rat Version 16, Certara, Sheffield, United Kingdom). The in vitro parameters used in the PBPK model are described in Table 1. The first-order one-compartment model was selected, and the gut was considered as a single compartment in this model. The permeability-limited basolateral membrane is assumed to mediate the absorption of drugs from enterocyte to the intestinal interstitial fluid, and effective permeability in rat (Peff) was calculated based on its relationship with Peff in human (Cao et al., 2006), which can be extrapolated from Papp, obtained from in vitro experiments (Sun et al., 2002; Tchaparian et al., 2008) or predicted using the PSA and HBD models (Winiwarter et al., 1998). Initially, our absorption model adopted the PSA and HBD models. A minimal PBPK model was selected to predict the volume of distribution at steady state (Vss) with in vitro parameters of logPo:w, compound type, and pKa using mechanistic model 2 (Poulin and Theil, 2002; Berezhkovskiy, 2004; Rodgers et al., 2005; Rodgers and Rowland, 2007), which is a preset model in Simcyp. The tissue distribution was predicted using Kp scalar (tissue: plasma partition coefficient) based on a perfusion-limited model. The Kp scalar was selected as 1 by default in our model. The whole organ metabolic clearance pane was selected in the elimination screen. The liver or intestinal clearance was extrapolated via in vitro metabolic data.
The drug plasma concentration–time profile and PK parameters {areas under the concentration–time curve to last time point [AUC(0–t)], peak plasma concentration (Cmax), and time to reach Cmax (Tmax)} after orally administered single-dose of model drugs were predicted. Meanwhile, the PK process of some model drugs administrated with various doses was simulated.
2.2.1 Physiologically Based Pharmacokinetic Model for Phenacetin
The in vitro properties of phenacetin collected from various literatures and databases are listed in Supplementary Table S1. The reported fu values ranged from 0.145 to 0.5. The metabolism of phenacetin by CYP1A2 is biphasic in microsome experiments (Kahn et al., 1987). Since the hepatic CLint collected from reported microsome experiments varied widely (0.086–100 μl/min/mg protein), we selected the median value of fu (0.3225) and hepatic CLint (27 μl/min/106 cells, 20.7–78 μl/min/106 cells) from hepatocyte experiments as input values in our model. The in vitro data parameterized in phenacetin PBPK model are tabulated in Table 2. The simulated results of phenacetin after oral administration of 20, 10, and 5 mg/kg in rats were evaluated.
2.2.2 Physiologically Based Pharmacokinetic Model for Tolbutamide
Tolbutamide is mainly eliminated by CYP2C9 in human liver, and by CYP2C6 and CYP2C11 in rats to produce hydroxyl tolbutamide. fu of tolbutamide varied from 0.0201 to 0.268 (listed in Supplementary Table S1), with the calculated median value to be 0.048. The CLint ranged between 2.72 and 8.10 μl/min/mg protein from various literatures and the median of 4.7 μl/min/mg protein was applied in the PBPK model. The same process was performed for other parameters in Table 2. The PK parameters of tolbutamide at 50 mg/kg in rats were predicted.
2.2.3 Physiologically Based Pharmacokinetic Model for Omeprazole
As shown in Supplementary Table S1, various in vitro data were collected and the deviation of the reported in vitro parameters from different sources was slight. Omeprazole is rapidly absorbed in rats and the elimination is almost entirely through hepatic and intestinal metabolism via CYP2C19 (Regårdh et al., 1985; Paul, 1991). The penetration of omeprazole into the red cells is low with the value of B/P at 0.6∼0.8 and the fu is about 15% in rat plasma. Similarly, the median values of parameters were calculated for model construction (Table 2). Plasma concentration over time in rats following oral administration of omeprazole at 10, 20, and 40 mg/kg was predicted, respectively.
2.2.4 Physiologically Based Pharmacokinetic Model for Metoprolol
The elimination of metoprolol in vivo is mainly through liver CYP2D6 in human, leading to extensive first-pass effect and low bioavailability. In addition to CYP2D6, CYP3A also participates in the metoprolol metabolism in rats. As shown in Supplementary Table S1, fu ranged from 0.8 to 0.925, the range of CLint [liver microsomes (LM)] was 17.1–59.9 μl/min/mg protein and the range of CLint [intestine microsomes (IM)] was 7.37–14.7 μl/min/mg protein. The median value of varied parameters was calculated as input parameters in Table 2. The disposition process of metoprolol in rats after oral administration of 2.5, 5, and 20 mg/kg was predicted.
2.2.5 Physiologically Based Pharmacokinetic Model for Chlorzoxazone
Chlorzoxazone is the probe substrate of CYP2E1. As shown in Supplementary Table S1, the value of fu ranged from 0.046 to 0.373 and the CLint was from 5.00 to 38.8 μl/min/mg protein. The value of other parameters collected from different sources was relatively consistent. Similarly, the median value was taken as the input value in Table 2. Since a dose of 50 mg/kg was frequently used in the PK studies of chlorzoxazone in rats, the PK parameters of chlorzoxazone following oral administration of 50 mg/kg were predicted.
2.2.6 Physiologically Based Pharmacokinetic Model for Nifedipine
Nifedipine is mainly metabolized by CYP 3A1/2 in human and CYP 3A4/5 in rats. As shown in Supplementary Table S1, the value of fu was 0.01–0.08, and the median value was calculated for input. The clearance of nifedipine was found related to concentration (Iwao et al., 2002). The CLint in the liver was 159 μl/min/mg protein when the concentration was 1–5 μM, which was reduced to 119 μl/min/mg protein when the concentration ranged from 5 to 100 μM and eventually dropped to 10 μl/min/mg protein with concentration higher than 100 μM. The value of CLint of small intestinal metabolism was estimated at 6.4 μl/min/mg protein when the concentration was lower than 5 μM and reduced to 2.8 μl/min/mg protein as the concentration was increased to 100 μM. Since the concentration in the liver was unlikely to be higher than 100 μM, the median of hepatic CLint was calculated to be 139 μl/min/mg protein with the ignorance of the lowest value at 10 μl/min/mg protein. The median of CLint of small intestinal metabolism was also calculated for the PBPK model (Table 2). The PK parameters of nifedipine in rats after oral administration of 3, 5, and 6 mg/kg were predicted.
2.2.7 Physiologically Based Pharmacokinetic Model for Baicalein
Baicalein, a bioactive flavonoid presented in the root of Scutellaria baicalensis, is isolated from traditional Chinese medicine “Huang Qin.” Baicalein was reported to be subjected to extensive first-pass metabolism due to the conjugated process by UGT in the liver and intestine. Few in vitro data were reported (listed in Supplementary Table S1), and the median value was calculated for model construction (shown in Table 2). The PK parameters of baicalein in rats after oral administration of 121 mg/kg were predicted.
2.3 Pharmacokinetic Data
PK parameters (AUC(0–t), Cmax, and Tmax) of model drugs in rats orally administrated with a different single-dose of the drugs were assembled from the literature. The AUC(0–t), Cmax, and Tmax units were unified as μg·h/ml, μg/ml, and h, respectively. The observed drug plasma concentration–time data were extracted from concentration–time course curves using the GetData software (version 2.24, http://getdata-graph-digitizer.com). Multiple records of PK parameters of model drugs were summarized in Supplementary Table S2, showing significant variations on PK parameters, with those of reasonable trend from different doses selected to validate prediction accuracy. For example, it was found that the PK parameters of tolbutamide from the literature varied considerably. Interestingly, the values of Cmax and AUC(0–t) at high doses were lower than low doses for some records (Cmax: 91.1–151 μg/ml at 20 mg/kg vs. 40.46 μg/ml at 30 mg/kg, AUC(0–t): 761.7217–1,393 μg·h/ml at 20 mg/kg vs. 183.88 μg·h/ml at 20 mg/kg), and Tmax also varied greatly (0.89–7.1 h). The relatively consistent PK value at a 50 mg/kg dose was finally selected for the tolbutamide PBPK model accuracy evaluation. Meanwhile, it is difficult to detect baicalein’s plasma concentration because of the complicated in vivo disposition, poor bioavailability, and extensive metabolism, leading to a considerable variation among the PK parameters. The ones after oral administration of 121 mg/kg were selected due to relatively consistent values (shown in Supplementary Table S2). Moreover, it was found to be partly due to the species, age, and gender differences of the rats and formulations. For example, it was reported that the AUC(0–t) and Cmax of metoprolol were 5–7 times higher and 2 times higher in DA (Dark Agouti) rats and Sprague–Dawley rats, respectively, than those in Wistar rats after oral administration of 5 mg/kg (Belpaire et al., 1990; Komura and Iwaki, 2005; Wang et al., 2014; Ma et al., 2015; Sun et al., 2017). The AUC(0–t) of baicalein was 11.7 times higher after oral administration of baicalein–nicotinamide nano-cocrystals than coarse powder, 7.1 times higher than that of baicalein nanocrystals, and 1.8 times higher than that of baicalein–nicotinamide cocrystals (Pi et al., 2019). As a result, our PBPK model was constructed using male Sprague–Dawley rats as the model animal with coarse powder form selected.
2.4 Sensitivity Analysis
As shown in Supplementary Table S1, physical chemistry properties such as logPo:w, compound type, pKa, and B/P and the predicted or calculated properties (MW, PSA, and HBD) were commonly consistent, while the fu and CLint (LM or hepatocytes) values obtained from the literature varied. To further explore the reliability of the PBPK model, the effect of fu and CLint (LM or hepatocytes) was investigated. The sensitivity analysis of fu and CLint (LM or hepatocytes) was determined via comparing the predicted results of PBPK models, which were constructed using the range values of fu and CLint (LM or hepatocytes) with all the other factors maintained constant. The uncertainty range of the PBPK model was defined as the predicted range of the PK parameters in the sensitivity analysis. The sensitivity results were plotted via Simcyp and showed in Figures 1–7. In order to make the 3D plots in A–C in Figures 1–7 more clearly distinguished, the predicted values were divided into 5–8 range values at the same interval, and each range was displayed as a color. Since the colors are numerous and have no special meaning, they are not specifically listed in the figures.
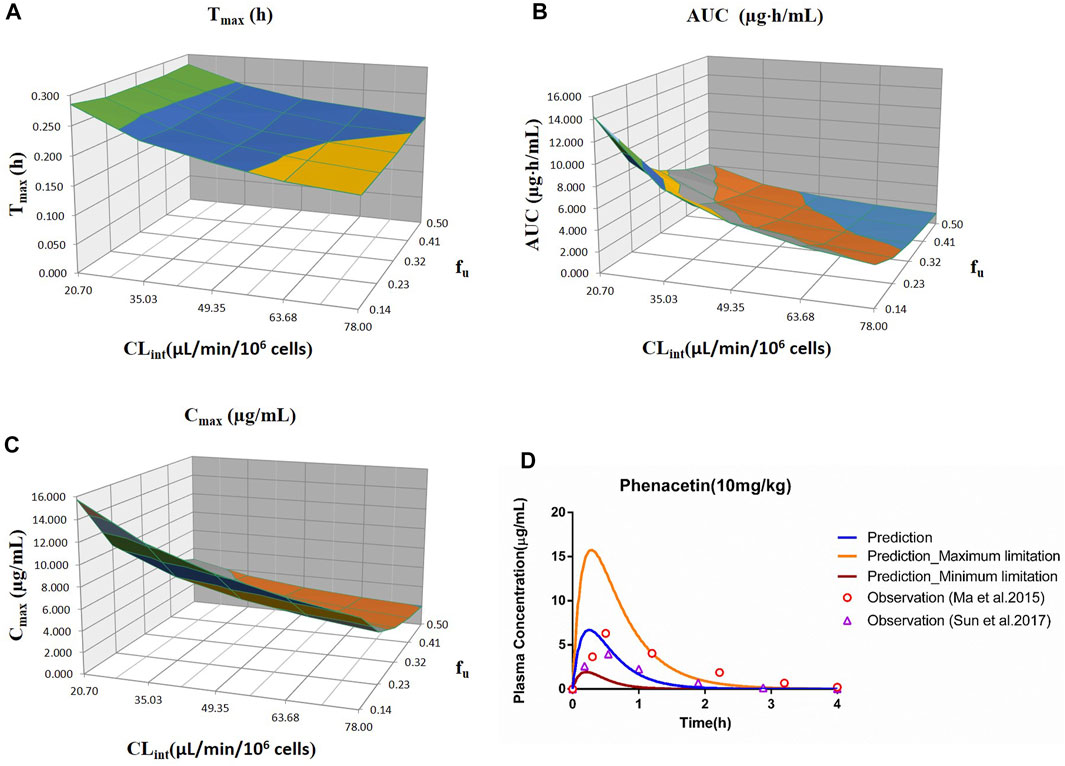
FIGURE 1. Influence of fu and CLint (hepatocytes) on the predicted Tmax (A), AUC(0–t) (B), Cmax (C), and plasma concentration–time profile (D) of the phenacetin PBPK model. Each color in the 3D plots in (A–C) represents a prediction range.
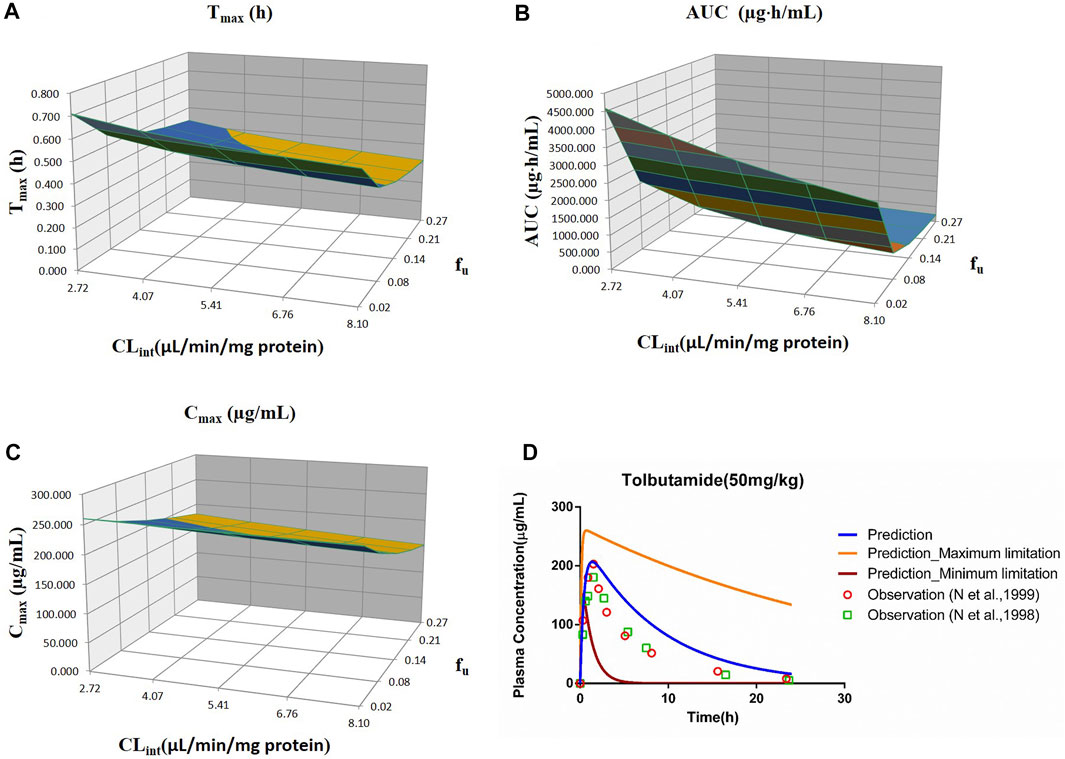
FIGURE 2. Influence of fu and CLint (LM) on the predicted Tmax (A), AUC(0–t) (B), and Cmax (C) and plasma concentration–time profile (D) of tolbutamide. Each color in the 3D plots in (A–C) represents a prediction range.
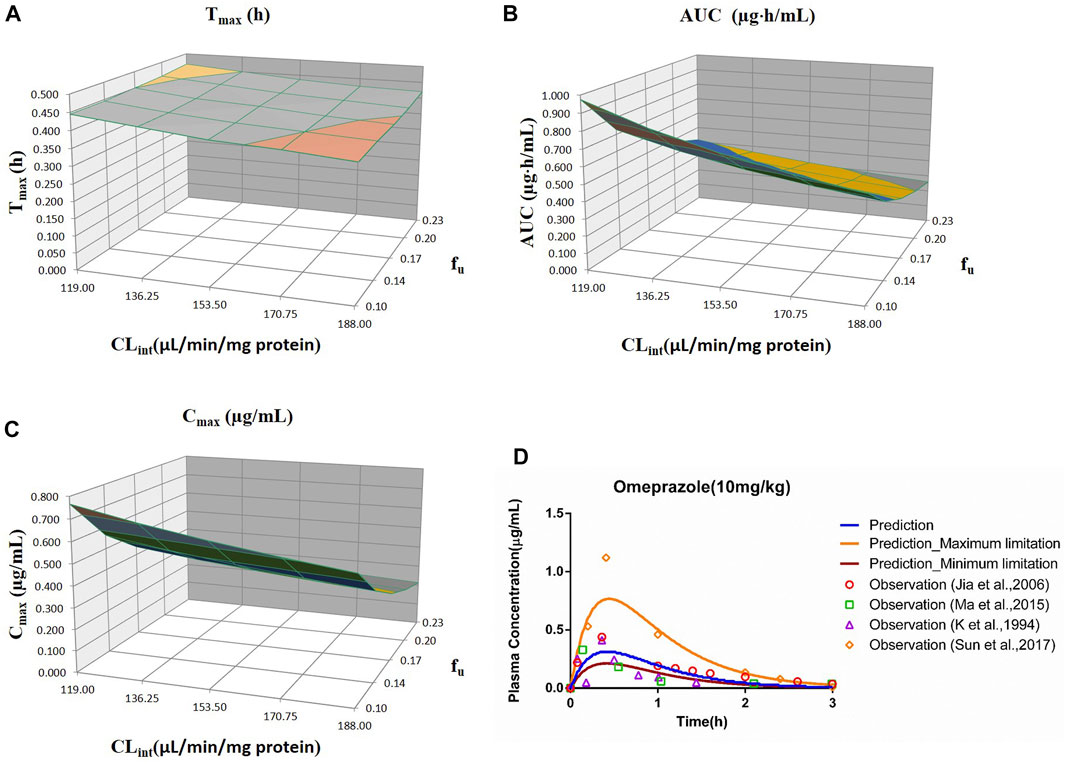
FIGURE 3. Influence of fu and CLint (LM) on the predicted Tmax (A), AUC(0–t) (B), and Cmax (C) and plasma concentration-time profile (D) of the omeprazole PBPK model. Each color in the 3D plots in (A–C) represents a prediction range.
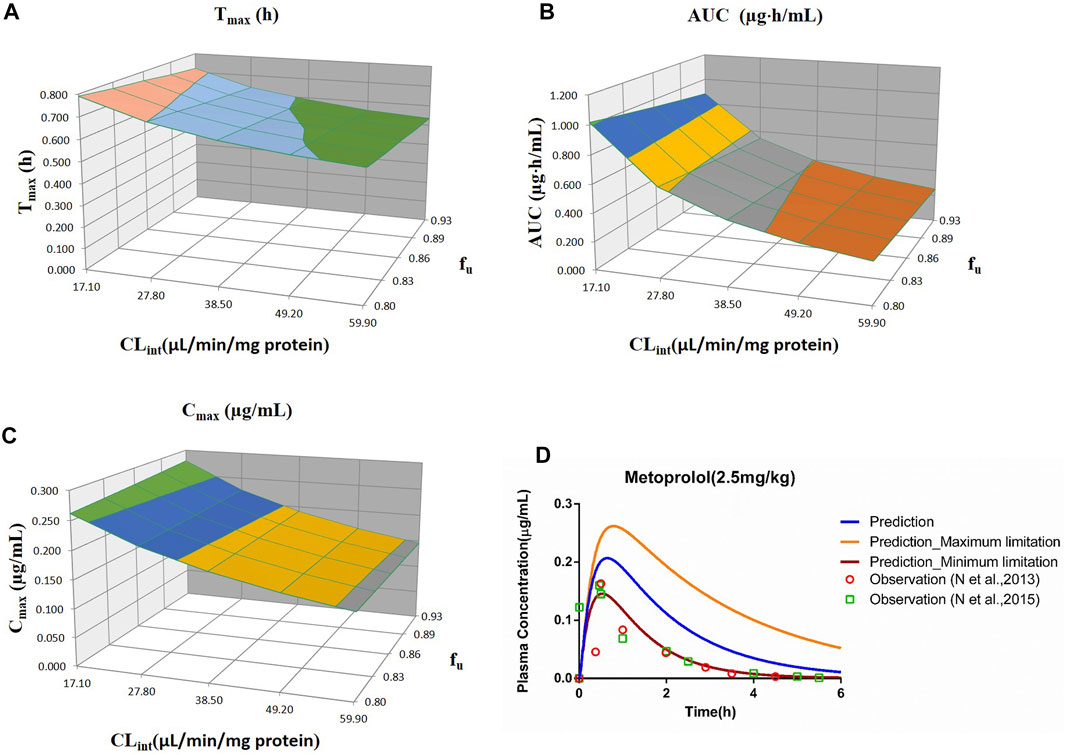
FIGURE 4. Influence of fu and CLint (LM) on the predicted Tmax (A), AUC(0–t) (B), Cmax (C), and plasma concentration–time profile (D) of the metoprolol PBPK model. Each color in the 3D plots in (A–C) represents a prediction range.
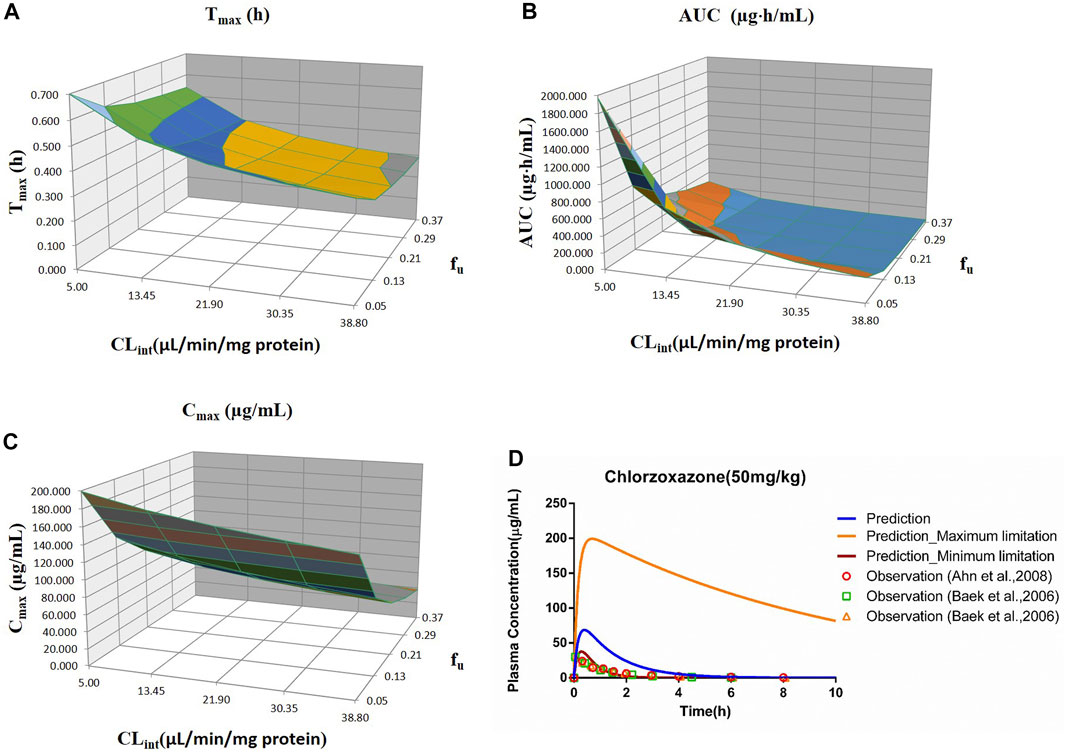
FIGURE 5. Influence of fu and CLint (LM) on the predicted Tmax (A), AUC(0–t) (B), Cmax (C), and plasma concentration–time profile (D) of the chlorzoxazone PBPK model. Each color in the 3D plots in (A–C) represents a prediction range.
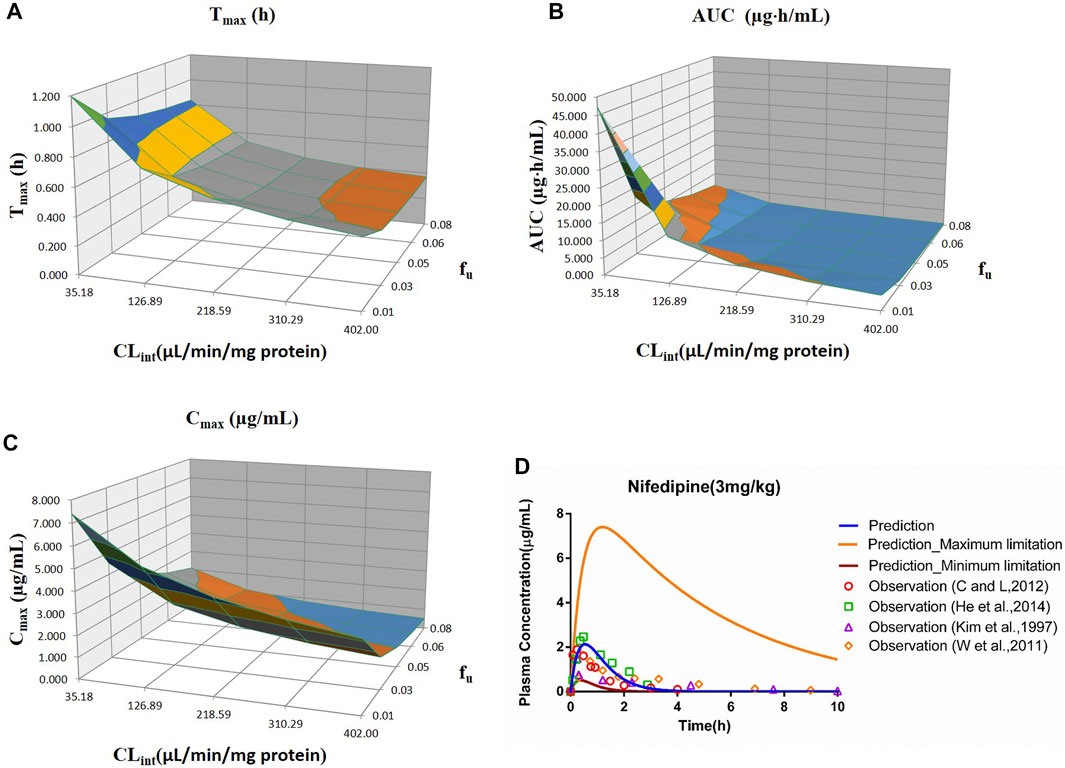
FIGURE 6. Influence of fu and CLint (LM) on the predicted Tmax (A), AUC(0–t) (B), Cmax (C), and plasma concentration–time profile (D) of the nifedipine PBPK model. Each color in the 3D plots in (A–C) represents a prediction range.
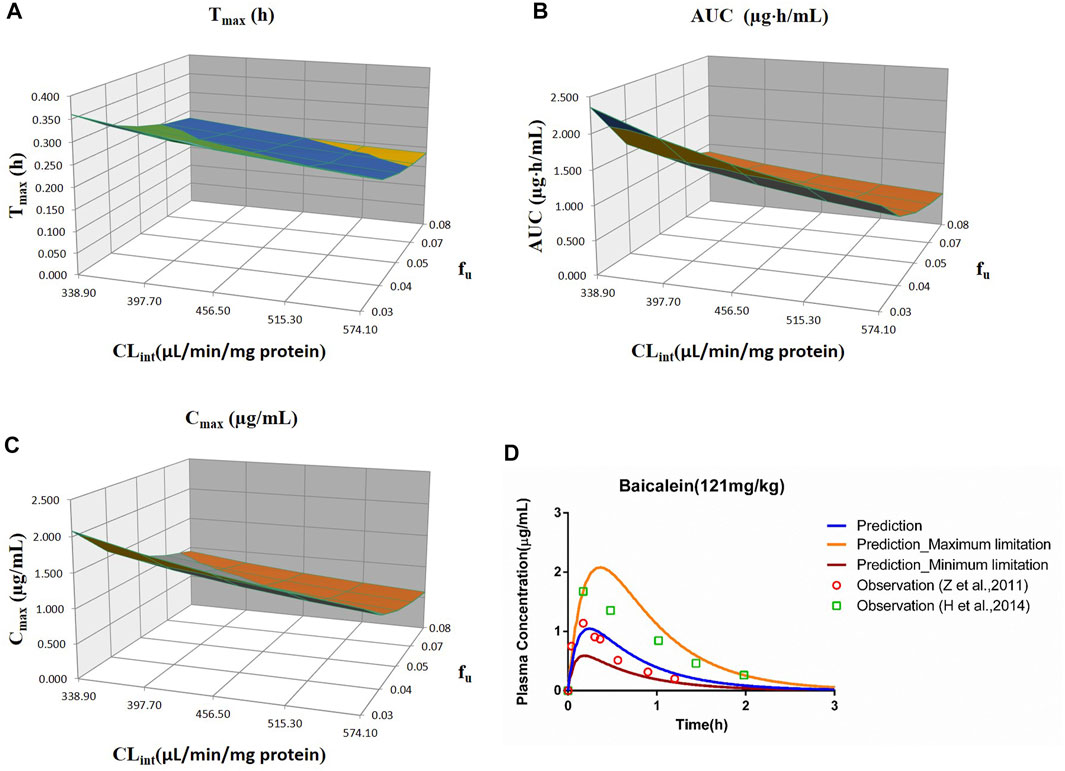
FIGURE 7. Influence of fu and CLint (LM) on the predicted Tmax (A), AUC(0–t) (B), Cmax (C), and plasma concentration–time profile (D) of the baicalein PBPK model. Each color in the 3D plots in (A–C) represents a prediction range.
2.5 Model Validation
To verify the prediction accuracy of the PBPK model, we compared the predicted parameters with the experimental data, and fold error was introduced to measure the deviation. The fold error is the ratio between the predicted PK parameters and the corresponding observed values (shown in Eqs. 1, 2). The accuracy of the prediction results increases as the fold error decreases. The simulation is considered acceptable with a fold error of less than 2 (De Buck et al., 2007; Yamazaki et al., 2011).
2.6 Model Performance
R2, mean absolute error (MAE), and root mean squared error (RMSE) were applied to evaluate the overall performance of the PBPK model. The equations are presented as follows (Eqs. 3–5). The lower the value of MAE and RMSE and the closer of R2 to 1, the better the performance of the PBPK model. The performance of the models was plotted using the GraphPad Prism software (version 6).
xi and yi are the observed and the predicted concentrations, respectively, ‾x is the average of the observed values, and ‾N is the number of data points.
3 Results
3.1 Physiologically Based Pharmacokinetic Model-Predicted Results
PBPK models for probe drugs (phenacetin, tolbutamide, omeprazole, metoprolol, chlorzoxazone, nifedipine, and baicalein) were constructed using in vitro parameters (MW, logPo:w, compound type, pKa, B/P, fu, PSA, HBD, CLint, Vmax, Km, and fu,inc). The predicted results of each drug were presented later, and the PK curves are displayed in Supplementary Figures S1–S7.
3.1.1 Phenacetin
The predicted results of the phenacetin PBPK model are shown in Table 3. Although the predicted Cmax was slightly higher than the observed one with the fold error of 1.93 at 5 mg/kg, the fold error values were all within the threshold of 2, indicating good simulation performance. Meanwhile, the predicted data were slightly higher than the observed ones at 5 mg/kg, while other observed points were around the predicted values at 10 and 20 mg/kg (Supplementary Figure S1). It could be concluded that the experimental CLint value used in the model was underestimated at 5 mg/kg.

TABLE 3. Comparison between the predicted and the observed PK parameters of the phenacetin PBPK model.
3.1.2 Tolbutamide
The prediction results are listed in Table 4. The fold error values were all less than 2 with the observed data around the predicted curve (Supplementary Figure S2), suggesting acceptable prediction accuracy.

TABLE 4. Comparison between the predicted PK parameters of the tolbutamide PBPK model and the observed PK parameters at 50 mg/kg.
3.1.3 Omeprazole
The predicted PK parameters of the omeprazole PBPK model were compared with the multiple records of experimental parameters (shown in Table 5). Although a few predicted values were slightly lower than the observed ones, most fold errors fell within 2, indicating good predicted accuracy. Supplementary Figure S3 showed that most of the predicted points were around the observed concentration–time profile.
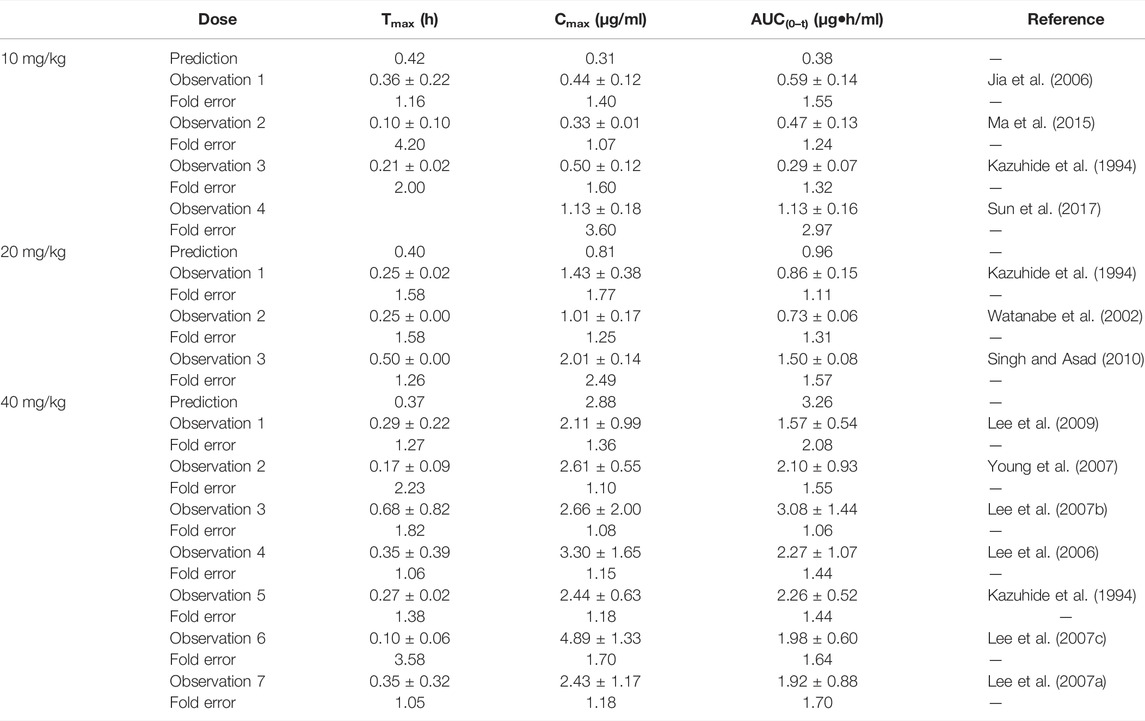
TABLE 5. Comparison between the predicted PK parameters of the omeprazole PBPK model and the observed PK parameters.
3.1.4 Metoprolol
The fold errors of the predicted parameters of the metoprolol PBPK model are evaluated in Table 6. The values of fold error in the 10 mg/kg group were less than 2, and the trend of the observed data coordinated the predicted profile (Supplementary Figure S4), indicating good simulation performance. Overall, all predicted concentration curves were slightly higher than the observation points, which is contributed by underestimating distribution and elimination.

TABLE 6. Comparison between the predicted PK parameters of metoprolol PBPK models and the observed PK parameters at different doses.
3.1.5 Chlorzoxazone
The predicted results of the chlorzoxazone PBPK model are tabulated in Table 7. Most fold errors of predicted parameters were larger than 2. The predicted curve was higher and deviated from the observed data (Supplementary Figure S5), which could be related to the underestimation of distribution and elimination. The influence of the two characteristics on the PBPK model will be further explored in the sensitivity analysis.

TABLE 7. Comparison between the predicted PK parameters of the chlorzoxazone PBPK model and the observed PK parameters at 50 mg/kg.
3.1.6 Nifedipine
The predicted results of the nifedipine PBPK model are shown in Table 8. The fold error of Cmax and AUC(0–t) mainly were within 2, indicating acceptable prediction performance. Although the difference between predicted Tmax and the observed values was more than 2 times (2.16 times), with a significant individual variation between the measured values of Tmax (0.08–1.5 h), the fold errors of Cmax and AUC(0–t) were within 2, indicating good prediction accuracy. As shown in Supplementary Figure S6, the predicted concentration curve was slightly shifted due to the difference in Tmax at 5 mg/kg, while the observed dots were close to the predicted ones at 3 and 6 mg/kg.
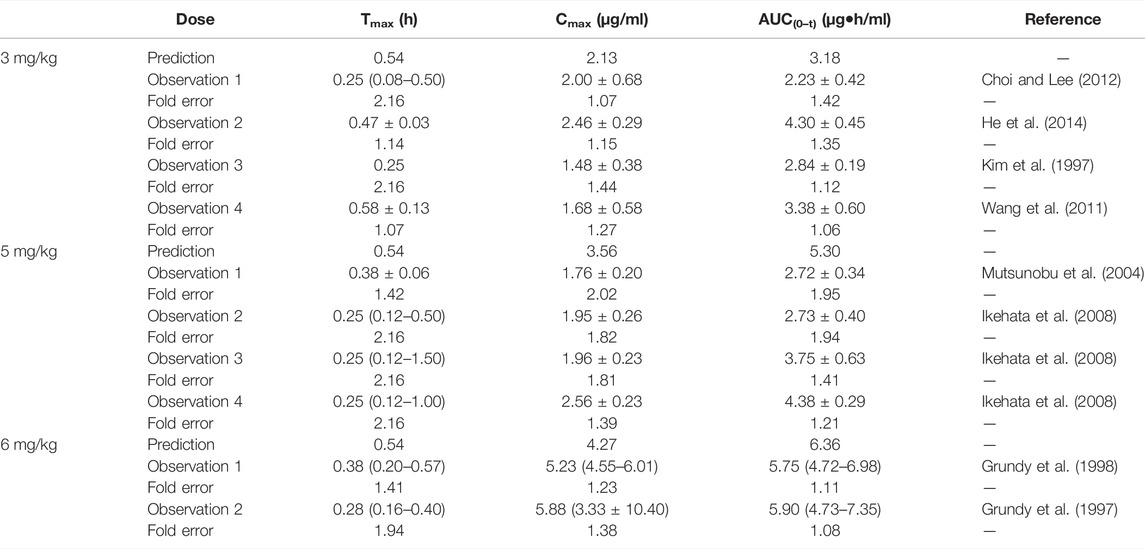
TABLE 8. Comparison between the predicted PK parameters of nifedipine PBPK models and the observed PK parameters at different doses.
3.1.7 Baicalein
The simulation results are shown in Table 9. The predicted curve is shown in Supplementary Figure S7. Although the predicted Cmax was slightly lower than the observed one, the fold errors were within 2. The observed PK data spread around the predicted profile, suggesting good prediction performance.

TABLE 9. Comparison between the predicted PK parameters of the baicalein PBPK model and the observed PK parameters at 121 mg/kg.
3.2 Sensitivity Analysis
The sensitivity analysis of fu and CLint (LM or hepatocytes) was evaluated with other factors maintained constant. The variation spans of fu and CLint (LM or hepatocytes) from various literatures are listed in Table 10. The uncertainty of the PBPK model-predicted results was estimated based on the range of fu and CLint (LM or hepatocytes) obtained from various literatures.

TABLE 10. Variation span of the experimental in vitro parameters and prediction PK parameters in the sensitivity analysis.
3.2.1 Phenacetin
The sensitivity analysis of fu (0.145–0.5) and CLint (hepatocytes: 20.7–78 μl/min/106 cells) for the phenacetin PBPK model was performed at 10 mg/kg (shown in Figure 1). The predicted value of Tmax, Cmax, and AUC(0–t) ranged from 0.18 to 0.28 h, 1.93 to 15.74 μg/ml, and 1.10 to 14.25 μg·h/ml, respectively. Most concentration points are within the uncertainty range.
3.2.2 Tolbutamide
The sensitivity analysis of fu (0.0201–0.268) and CLint (LM: 2.72–8.1 μl/min/mg protein) was investigated for the tolbutamide PBPK model at 50 mg/ml (shown in Figure 2). As a result, the predicted Tmax, Cmax, and AUC(0–t) ranged from 0.32 to 0.71 h, 152.72 to 260.15 μg/ml, and 231.67 to 4,587.60 μg·h/ml, respectively. The observed points were in the area between the median prediction curve and the lowest prediction curve (CLint = 8.1 μl/min/mg protein, fu = 0.27).
3.2.3 Omeprazole
The range of fu (0.105–0.232) and CLint (LM: 119–188 μl/min/mg protein) was applied for the sensitivity analysis of the omeprazole PBPK model at 10 mg/kg (shown in Figure 3). The results showed that the predicted Tmax, Cmax, and AUC(0–t) ranged from 0.38 to 0.46 h, 0.21 to 0.77 μg/ml, and 0.26 to 0.98 μg·h/ml, respectively. As shown in Figure 3D, most observation dots were in the sensitivity prediction range.
3.2.4 Metoprolol
The sensitivity analysis of fu (0.80–0.925) and CLint (LM: 17.1–59.9 μl/min/mg protein) was determined for the metoprolol PBPK model at 2.5 mg/kg in Figure 4. The predicted range of Tmax, Cmax, and AUC(0–t) were 0.54–0.79 h, 0.15–0.28 μg/ml, and 0.25–1.02 μg·h/ml, respectively. It is illustrated in Figure 4D that the observation data were close to the lowest predicted curve.
3.2.5 Chlorzoxazone
Sensitivity analysis of the chlorzoxazone PBPK model was performed at 50 mg/kg with the fu ranging from 0.046 to 0.373 and CLint (LM) from 5 to 38.8 μl/min/mg protein (shown in Figure 5). The results showed the predicted Tmax, Cmax, and AUC(0–t) ranged from 0.29 to 0.70 h, 37.69 to 199.27 μg/ml, and 34.69 to 1970.18 μg·h/ml, respectively. The observation dots were around the lowest prediction curve (Prediction_Minimum limitation curve), as shown in Figure 5D.
3.2.6 Nifedipine
The sensitivity analysis of fu (0.01–0.08) and CLint (LM: 35.18–402 μl/min/mg protein) was investigated for the nifedipine PBPK model at 3 mg/kg (shown in Figure 6). The predicted Tmax, Cmax, and AUC(0–t) ranged from 0.36 to 1.20 h, 0.51 to 7.40 μg/ml, and 0.52 to 47.27 μg·h/ml, respectively. The observation points were centered on the median prediction curve, as shown in Figure 6D.
3.2.7 Baicalein
The sensitivity analysis of fu and CLint (LM) was performed with the range from 0.029 to 0.0791 and 338.9 to 574.11 μl/min/mg protein for the baicalein PBPK model at 121 mg/kg (shown in Figure 7). The results showed the predicted Tmax, Cmax, and AUC(0–t) ranged from 0.19 to 0.36 h, 0.59 to 2.08 μg/ml, and 0.51 to 2.36 μg·h/ml, respectively. As illustrated in Figure 7D, observation dots were within the sensitivity prediction range.
3.3 Physiologically Based Pharmacokinetic Model Performance
The fold errors are summarized in Figure 8. Furthermore, to evaluate the overall performance of the PBPK model, we compared the prediction concentration data with the observed ones (n = 390, shown in Figure 9). Moreover, the prediction performance of the PBPK model with absorption module using PSA and HBD was compared with that using Papp from in vitro experiments (Caco-2 experimentation). The input of Papp was also applied to the median data of the various values. As shown in Table 11, the model performance using PSA and HBD, with a lower value of MAE and RMSE and higher value of R2, was better than using Papp from Caco-2 experimentation. As displayed in Figure 9B, prediction 1 was closer to the correlation line with most dots within the ±20% of the observed concentration, indicating the overall good performance of PBPK model construction using the PSA and HBD methods.
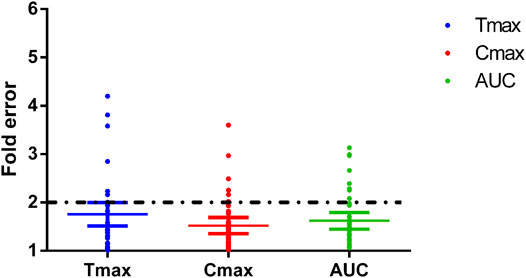
FIGURE 8. Fold errors of the PK parameters from the PBPK models of phenacetin, tolbutamide, omeprazole, metoprolol, chlorzoxazone, nifedipine, and baicalein. The three lines in each parameter represent mean with 95% confidence interval and the black dotted line across the fold error = 2 represent evaluation criteria.
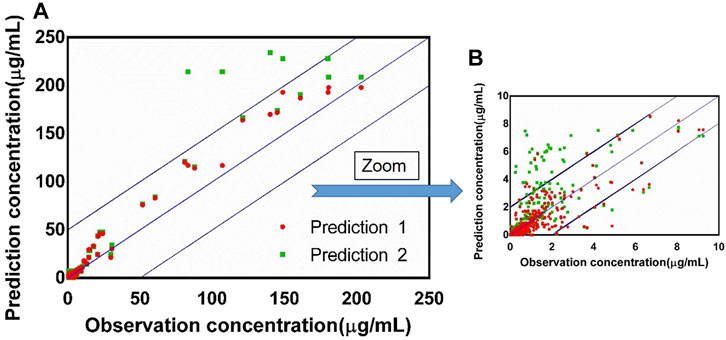
FIGURE 9. (A) Observed concentration vs. predicted concentration (n = 390) based on the PBPK model with the absorption module using the PSA and HBD models (prediction 1) and the PBPK model using Papp from Caco-2 experimentation (prediction 2), blue box: ±20% of the observation concentration; (B) graph zoomed at 0–10 μg/ml.

TABLE 11. Performance of the PBPK model with absorption module using PSA and HBD (prediction 1) and PBPK model using Papp from Caco-2 experimentation (prediction 2).
4 Discussion
While collecting in vitro parameters, we noticed the fu and CLint from different sources varied; therefore, the median values were applied to construct the model. A sensitivity analysis was performed to further explore the impact of these two parameters on the model prediction accuracy. The overall predicted accuracy of PBPK models using the median value was good with most fold errors within 2, and the R2 between the predicted concentration data and the observed data was more than 0.8 (Figures 8, 9). However, there was an exception that the chlorzoxazone PBPK model using median data was not satisfying with the prediction results, which is 2 times higher than the observed ones. It could be related to the underestimated distribution and clearance. In terms of the sensitivity analysis, the observed points were closest to the lowest prediction curve with the highest CLint (38.8 μl/min/mg protein) and fu 0.373 (Moon et al., 2003; Baek et al., 2006). The lowest prediction parameters of Tmax, Cmax, and AUC(0–t) were 0.29 h, 37.69 μg/ml, and 34.69 μg·h/ml, respectively. Moreover, most of the fold errors were within 2 (observation 1–3), indicating good prediction accuracy. Similarly, the prediction result of metoprolol using the median PBPK model was also slightly higher at 2.5 mg/kg, and the observed data was close to the lowest predicted curve. The prediction Tmax, Cmax, and AUC(0–t) of the metoprolol PBPK model using highest experimental CLint (59.9 μl/min/mg) and fu (0.93) at 2.5 mg/kg were 0.53 h, 0.15 μg/ml, and 0.25 μg·h/ml, respectively and the fold errors were within 2 (Belpaire et al., 1989; Yoon et al., 2011). These results suggest that applying the PBPK model using in vitro parameters in the early screening of candidate compounds is feasible and helpful, and the prediction accuracy of the model is related to the in vitro parameters, especially fu and CLint. It is worth noting that there is a potential correlation between fu and CLint under physiological conditions, which likewise may unnaturally increase the variability in predicted values. Furthermore, since the effect of fu on CLint might be poorly investigated and difficult to obtain from previous studies, the impact of such correlation on the variability of predicted values remains to be further explored.
In the sensitivity analysis, we summarized the variation span of the experimental in vitro parameters and prediction PK parameters in Table 10. Except for nifedipine (fold error of the observed Tmax was 3.3), the variation of prediction Tmax in the sensitivity analysis of other drugs was slight, meaning that the experimental difference of fu and CLint had little impact on Tmax compared with Cmax and AUC(0–t). Compared with phenacetin, omeprazole, metoprolol, and baicalein, the experimental variation of fu or CLint of nifedipine, chlorzoxazone, and tolbutamide is relatively large (fold errors of fu or CLint > 8), which led to a large variation span in the sensitivity analysis with the fold errors of Cmax or AUC(0–t) more than 10. Meanwhile, the variation of both fu and CLint was higher than 3, resulting in significant fold errors of Cmax and AUC(0–t) (>8.0). Moreover, inflection points were noted in the change trend graph of fu and CLint of phenacetin, nifedipine, chlorzoxazone, and tolbutamide shown in the figure of sensitivity analysis, with the prediction value significantly fluctuating around. Therefore, sensitivity analysis is necessary for model construction. That is to say, when the in vitro parameters are close to the inflection point, extra attention should be paid to the PBPK model construction.
In addition to using the PSA and HBD methods to predict the absorption of model drugs in the PBPK model, we also explored the prediction accuracy of the PBPK model using Papp from in vitro experiments such as Caco-2 experimentation. Interestingly, the results showed that the overall prediction performance of PBPK models using the PSA and HBD methods was better. It could be related to defects in the in vitro absorption experiments, such as the inability to simulate the dynamic flow of fluids in the body, the lack of mucus layer, the more minor tight junctions, and the thicker unstirred water layer. These may cause the Papp to not to truly simulate the diffusion of drugs in vivo and thus cannot truly predict the drug absorption degree in the body.
It is worth mentioning that the PBPK model using in vitro parameters is beneficial to drug development, and the more accurate the value of in vitro parameters, the better fit the model. However, the model compounds we applied were BCS (biopharmaceutics classification system) class II drugs, exhibited linear absorption and primarily cleared via metabolism. Therefore, our models were appropriate to the PK prediction of chemicals not affected by transporters such as P-gp (p-glycoprotein) efflux transporter. For other compounds with complex drug metabolism characteristics, using in vitro parameters alone to construct a PBPK model and the prediction accuracy still require further research and validation. Moreover, in recent years, with the development of computer technology and in vitro experiments, the contribution of PBPK models to advancing 3Rs in new drug development is undoubtedly a hot topic of discussion. Since rodents were widely used in preclinical pharmacological experiments, this study used rats as the model animal when constructing PBPK models based on in vitro parameters. It is expected that animal experiments can be reduced in the early stage of drug development with the validation of the feasibility and reliability of the models. However, due to the differences in physiological parameters of other species, the construction of their PBPK models needs further exploration and optimization, and due to the complexity of the human body, whether this method can be directly applied to predict the pharmacokinetic characteristics of candidate compounds in the humans and the reliability of the predicted results still need further exploration.
5 Conclusion
In our study, bottom–up PBPK models constructed with in vitro data were developed, and popular probe substrates were used as model drugs. Most of the fold errors between the observed PK data with the predicted ones were within the threshold of 2, indicating good prediction accuracy. The influence of in vitro data was comprehensively analyzed, and results supported that the model accuracy is related to the precision of the in vitro data. Moreover, most of the observed PK data is within the uncertainty range, and R2 is more than 0.8, indicating the applicability of the PBPK model in the absence of in vivo data in the early drug development. In conclusion, a strategy of the bottom–up PBPK model with the quantity of an uncertainty range is constructed, which helps reduce animal experiments and is a good practice of 3Rs in the early screening of candidate compounds.
Data Availability Statement
The original contributions presented in the study are included in the article/Supplementary Material, further inquiries can be directed to the corresponding authors.
Author Contributions
XX and WC are responsible for this manuscript.
Funding
This work was supported by the Shanghai Science and Technology Innovation Fund (18140900900). Certara UK (Simcyp Division) granted free access to the Simcyp® Simulators through an academic license.
Conflict of Interest
The authors declare that the research was conducted in the absence of any commercial or financial relationships that could be construed as a potential conflict of interest.
Publisher’s Note
All claims expressed in this article are solely those of the authors and do not necessarily represent those of their affiliated organizations, or those of the publisher, the editors, and the reviewers. Any product that may be evaluated in this article, or claim that may be made by its manufacturer, is not guaranteed or endorsed by the publisher.
Supplementary Material
The Supplementary Material for this article can be found online at: https://www.frontiersin.org/articles/10.3389/fphar.2022.895556/full#supplementary-material
References
Ahn, C. Y., Bae, S. K., Jung, Y. S., Lee, I., Kim, Y. C., Lee, M. G., et al. (2008). Pharmacokinetic Parameters of Chlorzoxazone and its Main Metabolite, 6-hydroxychlorzoxazone, after Intravenous and Oral Administration of Chlorzoxazone to Liver Cirrhotic Rats with Diabetes Mellitus. Drug Metab. Dispos 36 (7), 1233–1241. doi:10.1124/dmd.107.017442
Andersen, M. E., Clewell, H. J., Gargas, M. L., Smith, F. A., and Reitz, R. H. (1987). Physiologically Based Pharmacokinetics and the Risk Assessment Process for Methylene Chloride. Toxicol. Appl. Pharmacol. 87 (2), 185–205. doi:10.1016/0041-008x(87)90281-x
Baek, H. W., Bae, S. K., Lee, M. G., and Sohn, Y. T. (2006). Pharmacokinetics of Chlorzoxazone in Rats with Diabetes: Induction of CYP2E1 on 6-hydroxychlorzoxazone Formation. J. Pharm. Sci. 95 (11), 2452–2462. doi:10.1002/jps.20698
Ball, K., Bouzom, F., Scherrmann, J. M., Walther, B., and Declèves, X. (2014). Comparing Translational Population-PBPK Modelling of Brain Microdialysis with Bottom-Up Prediction of Brain-To-Plasma Distribution in Rat and Human. Biopharm. Drug Dispos 35 (8), 485–499. doi:10.1002/bdd.1908
Belpaire, F. M., De Smet, F., Chindavijak, B., Fraeyman, N., and Bogaert, M. G. (1989). Effect of Turpentine-Induced Inflammation on the Disposition Kinetics of Propranolol, Metoprolol, and Antipyrine in the Rat. Fundam. Clin. Pharmacol. 3 (2), 79–88. doi:10.1111/j.1472-8206.1989.tb00667.x
Belpaire, F. M., de Smet, F., Vynckier, L. J., Vermeulen, A. M., Rosseel, M. T., Bogaert, M. G., et al. (1990). Effect of Aging on the Pharmcokinetics of Atenolol, Metoprolol and Propranolol in the Rat. J. Pharmacol. Exp. Ther. 254 (1), 116–122.
Berezhkovskiy, L. M. (2004). Volume of Distribution at Steady State for a Linear Pharmacokinetic System with Peripheral Elimination. J. Pharm. Sci. 93 (6), 1628–1640. doi:10.1002/jps.20073
Cao, X., Gibbs, S. T., Fang, L., Miller, H. A., Landowski, C. P., Shin, H. C., et al. (2006). Why Is it Challenging to Predict Intestinal Drug Absorption and Oral Bioavailability in Human Using Rat Model. Pharm. Res. 23 (8), 1675–1686. doi:10.1007/s11095-006-9041-2
Cascone, S., Lamberti, G., Marra, F., Titomanlio, G., d'Amore, M., and Barba, A. A. (2016). Gastrointestinal Behavior and ADME Phenomena: I. In Vitro Simulation. J. Drug Deliv. Sci. Techn. 35, 272–283. doi:10.1016/j.jddst.2016.08.002
Chang, H. Y., Wu, S., Meno-Tetang, G., and Shah, D. K. (2019). A Translational Platform PBPK Model for Antibody Disposition in the Brain. J. Pharmacokinet. Pharmacodyn 46 (4), 319–338. doi:10.1007/s10928-019-09641-8
Chen, Y., Jin, J. Y., Mukadam, S., Malhi, V., and Kenny, J. R. (2012). Application of IVIVE and PBPK Modeling in Prospective Prediction of Clinical Pharmacokinetics: Strategy and Approach during the Drug Discovery Phase with Four Case Studies. Biopharm. Drug Dispos 33 (2), 85–98. doi:10.1002/bdd.1769
Cheng, W., and Ng, C. A. (2017). A Permeability-Limited Physiologically Based Pharmacokinetic (PBPK) Model for Perfluorooctanoic Acid (PFOA) in Male Rats. Environ. Sci. Technol. 51 (17), 9930–9939. doi:10.1021/acs.est.7b02602
Choi, Y. H., and Lee, M. G. (2012). Pharmacokinetic and Pharmacodynamic Interaction between Nifedipine and Metformin in Rats: Competitive Inhibition for Metabolism of Nifedipine and Metformin by Each Other via CYP Isozymes. Xenobiotica 42 (5), 483–495. doi:10.3109/00498254.2011.633177
Clewell, R. A., and Clewell, H. J. (2008). Development and Specification of Physiologically Based Pharmacokinetic Models for Use in Risk Assessment. Regul. Toxicol. Pharmacol. 50 (1), 129–143. doi:10.1016/j.yrtph.2007.10.012
Dargó, G., Vincze, A., Müller, J., Kiss, H. J., Nagy, Z. Z., and Balogh, G. T. (2019). Corneal-PAMPA: A Novel, Non-cell-based Assay for Prediction of Corneal Drug Permeability. Eur. J. Pharm. Sci. 128, 232–239. doi:10.1016/j.ejps.2018.12.012
De Buck, S. S., Sinha, V. K., Fenu, L. A., Nijsen, M. J., Mackie, C. E., and Gilissen, R. A. (2007). Prediction of Human Pharmacokinetics Using Physiologically Based Modeling: A Retrospective Analysis of 26 Clinically Tested Drugs. Drug Metab. Dispos 35 (10), 1766–1780. doi:10.1124/dmd.107.015644
Ekins, S., Waller, C. L., Swaan, P. W., Cruciani, G., Wrighton, S. A., and Wikel, J. H. (2000). Progress in Predicting Human ADME Parameters In Silico. J. Pharmacol. Toxicol. Methods 44 (1), 251–272. doi:10.1016/s1056-8719(00)00109-x
Ellison, C. A. (2018). Structural and Functional Pharmacokinetic Analogs for Physiologically Based Pharmacokinetic (PBPK) Model Evaluation. Regul. Toxicol. Pharmacol. 99, 61–77. doi:10.1016/j.yrtph.2018.09.008
Grundy, J. S., Eliot, L. A., and Foster, R. T. (1997). Extrahepatic First-Pass Metabolism of Nifedipine in the Rat. Biopharmaceutics & drug disposition 18 (6), 509–522. doi:10.1002/(sici)1099-081x(199708)18:6<509::aid-bdd38>3.0.co;2-5
Grundy, J. S., Eliot, L. A., Kulmatycki, K. M., and Foster, R. T. (1998). Grapefruit Juice and orange Juice Effects on the Bioavailability of Nifedipine in the Rat. Biopharmaceutics & drug disposition 19 (3), 175–183. doi:10.1002/(sici)1099-081x(199804)19:3<175::aid-bdd85>3.0.co;2-7
Haddad, S., Béliveau, M., Tardif, R., and Krishnan, K. (2001). A PBPK Modeling-Based Approach to Account for Interactions in the Health Risk Assessment of Chemical Mixtures. Toxicol. Sci. 63 (1), 125–131. doi:10.1093/toxsci/63.1.125
Hariparsad, N., Sane, R. S., Strom, S. C., and Desai, P. B. (2006). In Vitro methods in Human Drug Biotransformation Research: Implications for Cancer Chemotherapy. Toxicol. Vitro 20 (2), 135–153. doi:10.1016/j.tiv.2005.06.049
Harrison, L. I., and Gibaldi, M. (1977). Physiologically Based Pharmacokinetic Model for Digoxin Disposition in Dogs and its Preliminary Application to Humans. J. Pharm. Sci. 66 (12), 1679–1683. doi:10.1002/jps.2600661206
He, J. X., Ohno, K., Tang, J., Hattori, M., Tani, T., and Akao, T. (2014). Da-Chaihu-Tang Alters the Pharmacokinetics of Nifedipine in Rats and a Treatment Regimen to Avoid This. J. Pharm. Pharmacol. 66 (11), 1623–1630. doi:10.1111/jphp.12285
Huang, S. M., Abernethy, D. R., Wang, Y., Zhao, P., and Zineh, I. (2013). The Utility of Modeling and Simulation in Drug Development and Regulatory Review. J. Pharm. Sci. 102 (9), 2912–2923. doi:10.1002/jps.23570
Huang, Y., Zhang, B., Gao, Y., Zhang, J., and Shi, L. (2014). Baicalein-nicotinamide Cocrystal with Enhanced Solubility, Dissolution, and Oral Bioavailability. J. Pharm. Sci. 103 (8), 2330–2337. doi:10.1002/jps.24048
Igari, Y., Sugiyama, Y., Sawada, Y., Iga, T., and Hanano, M. (1983). Prediction of Diazepam Disposition in the Rat and Man by a Physiologically Based Pharmacokinetic Model. J. Pharmacokinet. biopharmaceutics 11 (6), 577–593. doi:10.1007/BF01059058
Ikehata, M., Ohnishi, N., Matsumoto, T., Kiyohara, Y., Maeda, A., Kawakita, T., et al. (2008). Effects of Sairei-To on the Pharmacokinetics of Nifedipine in Rats. Phytother Res. 22 (1), 12–17. doi:10.1002/ptr.2234
Irvine, J. D., Takahashi, L., Lockhart, K., Cheong, J., Tolan, J. W., Selick, H. E., et al. (1999). MDCK (Madin-Darby Canine Kidney) Cells: A Tool for Membrane Permeability Screening. J. Pharm. Sci. 88 (1), 28–33. doi:10.1021/js9803205
Iwao, T., Inoue, K., Hayashi, Y., Yuasa, H., and Watanabe, J. (2002). Metabolic Extraction of Nifedipine during Absorption from the Rat Small Intestine. Drug Metab. Pharmacokinet. 17 (6), 546–553. doi:10.2133/dmpk.17.546
Iwatsubo, T., Hirota, N., Ooie, T., Suzuki, H., Shimada, N., Chiba, K., et al. (1997). Prediction of In Vivo Drug Metabolism in the Human Liver from In Vitro Metabolism Data. Pharmacol. Ther. 73 (2), 147–171. doi:10.1016/s0163-7258(96)00184-2
Jia, H., Li, W., and Zhao, K. (2006). Determination of Omeprazole in Rat Plasma by High-Performance Liquid Chromatography without Solvent Extraction. J. Chromatogr. B Analyt Technol. Biomed. Life Sci. 837 (1-2), 112–115. doi:10.1016/j.jchromb.2006.04.007
Jin, Z., He, Q., Zhu, X., Zhu, M., Wang, Y., Wu, X. A., et al. (2022). Application of Physiologically Based Pharmacokinetic Modelling for the Prediction of Drug-Drug Interactions Involving Anlotinib as a Perpetrator of Cytochrome P450 Enzymes. Basic Clin. Pharmacol. Toxicol. 130, 592. doi:10.1111/bcpt.13721
Kahn, G. C., Rubenfield, M., Davies, D. S., and Boobis, A. R. (1987). Phenacetin O-Deethylase Activity of the Rat: Strain Differences and the Effects of Enzyme-Inducing Compounds. Xenobiotica 17 (2), 179–187. doi:10.3109/00498258709043927
Kazuhide, W., Katsushi, F., Kohei, E., Ryozo, O., and Yutaka, G. (1994). First-Pass Metabolism of Omeprazole in Rats. J. Pharm. Sci. 83 (8), 1131. doi:10.1002/jps.2600830812
Kim, Y. I., Fluckiger, L., Hoffman, M., Lartaud-Idjouadiene, I., Atkinson, J., and Maincent, P. (1997). The Antihypertensive Effect of Orally Administered Nifedipine-Loaded Nanoparticles in Spontaneously Hypertensive Rats. Br. J. Pharmacol. 120 (3), 399–404. doi:10.1038/sj.bjp.0700910
Komura, H., and Iwaki, M. (2005). Pharmacokinetics and Metabolism of Metoprolol and Propranolol in the Female DA and Female Wistar Rat: the Female DA Rat Is Not Always an Animal Model for Poor Metabolizers of CYP2D6. J. Pharm. Sci. 94 (2), 397–408. doi:10.1002/jps.20255
Kostewicz, E. S., Aarons, L., Bergstrand, M., Bolger, M. B., Galetin, A., Hatley, O., et al. (2014). PBPK Models for the Prediction of In Vivo Performance of Oral Dosage Forms. Eur. J. Pharm. Sci. 57, 300–321. doi:10.1016/j.ejps.2013.09.008
Lee, D. Y., Kim, J. W., and Lee, M. G. (2007c). Pharmacokinetic Interaction between Oltipraz and Omeprazole in Rats: Competitive Inhibition of Metabolism of Oltipraz by Omeprazole via CYP1A1 and 3A2, and of Omeprazole by Oltipraz via CYP1A1/2, 2D1/2, and 3A1/2. Eur. J. Pharm. Sci. 32 (4-5), 328–339. doi:10.1016/j.ejps.2007.08.008
Lee, D. Y., Jung, Y. S., Kim, Y. C., Kim, S. Y., and Lee, M. G. (2009). Faster Clearance of Omeprazole in Mutant Nagase Analbuminemic Rats: Possible Roles of Increased Protein Expression of Hepatic CYP1A2 and Lower Plasma Protein Binding. Biopharm. Drug Dispos 30 (3), 107–116. doi:10.1002/bdd.651
Lee, D. Y., Lee, I., and Lee, M. G. (2007a). Effects of Cysteine on the Pharmacokinetic Parameters of Omeprazole in Rats with Protein-Calorie Malnutrition: Partial Restoration of Some Parameters to Control Levels by Oral Cysteine Supplementation. J. Parenter. Enteral Nutr. 31 (1), 37–46. doi:10.1177/014860710703100137
Lee, D. Y., Lee, I., and Lee, M. G. (2007b). Pharmacokinetics of Omeprazole after Intravenous and Oral Administration to Rats with Liver Cirrhosis Induced by Dimethylnitrosamine. Int. J. Pharm. 330 (1-2), 37–44. doi:10.1016/j.ijpharm.2006.08.037
Lee, D. Y., Shin, H. S., Lee, I., and Lee, M. G. (2006). Pharmacokinetics of Omeprazole in Rats with Water Deprivation for 72 hours. Biopharm. Drug Dispos 27 (8), 361–370. doi:10.1002/bdd.516
Li, S., Yu, Y., Bian, X., Yao, L., Li, M., Lou, Y. R., et al. (2021). Prediction of Oral Hepatotoxic Dose of Natural Products Derived from Traditional Chinese Medicines Based on SVM Classifier and PBPK Modeling. Arch. Toxicol. 95 (5), 1683–1701. doi:10.1007/s00204-021-03023-1
Lin, J. H., and Lu, A. Y. (1997). Role of Pharmacokinetics and Metabolism in Drug Discovery and Development. Pharmacol. Rev. 49 (4), 403–449.
Lindstrom, F. T., Gillett, J. W., and Rodecap, S. E. (1974). Distribution of HEOD (Dieldrin) in Mammals. I. Preliminary Model. Arch. Environ. Contam. Toxicol. 2 (1), 9–42. doi:10.1007/bf01985798
Lombardo, F., Desai, P. V., Arimoto, R., Desino, K. E., Fischer, H., Keefer, C. E., et al. (2017). In Silico Absorption, Distribution, Metabolism, Excretion, and Pharmacokinetics (ADME-PK): Utility and Best Practices. An Industry Perspective from the International Consortium for Innovation through Quality in Pharmaceutical Development. J. Med. Chem. 60 (22), 9097–9113. doi:10.1021/acs.jmedchem.7b00487
Ma, J., Wang, S., Zhang, M., Zhang, Q., Zhou, Y., Lin, C., et al. (2015). Simultaneous Determination of Bupropion, Metroprolol, Midazolam, Phenacetin, Omeprazole and Tolbutamide in Rat Plasma by UPLC-MS/MS and its Application to Cytochrome P450 Activity Study in Rats. Biomed. Chromatogr. 29 (8), 1203–1212. doi:10.1002/bmc.3409
Meek, M. E., Barton, H. A., Bessems, J. G., Lipscomb, J. C., and Krishnan, K. (2013). Case Study Illustrating the WHO IPCS Guidance on Characterization and Application of Physiologically Based Pharmacokinetic Models in Risk Assessment. Regul. Toxicol. Pharmacol. 66 (1), 116–129. doi:10.1016/j.yrtph.2013.03.005
Mielke, H., and Gundert-Remy, U. (2009). Bisphenol A Levels in Blood Depend on Age and Exposure. Toxicol. Lett. 190 (1), 32–40. doi:10.1016/j.toxlet.2009.06.861
Mielke, H., Partosch, F., and Gundert-Remy, U. (2011). The Contribution of Dermal Exposure to the Internal Exposure of Bisphenol A in Man. Toxicol. Lett. 204 (2-3), 190–198. doi:10.1016/j.toxlet.2011.04.032
Miller, N. A., Reddy, M. B., Heikkinen, A. T., Lukacova, V., and Parrott, N. (2019). Physiologically Based Pharmacokinetic Modelling for First-In-Human Predictions: An Updated Model Building Strategy Illustrated with Challenging Industry Case Studies. Clin. Pharmacokinet. 58 (6), 727–746. doi:10.1007/s40262-019-00741-9
Mutsunobu, Y., Noriaki, O., Noriko, S., Suguru, E., Koji, T., Teruyoshi, Y., et al. (2004). Studies on Interactions between Functional Foods or Dietary Supplements and Medicines. III. Effects of Ginkgo Biloba Leaf Extract on the Pharmacokinetics of Nifedipine in Rats. Biol. Pharm. Bull. 27 (12), 1315–1320. doi:10.1248/bpb.26.1315
Nandi, U., Dan, S., and Pal, T. K. (2015). Development and Validation of a Liquid Chromatography–Mass Spectrometry Method for Simultaneous Determination of Metoprolol and Telmisartan in Rat Plasma and its Application to Pharmacokinetic Study. J. Pharm. Invest. 45 (3), 329–340. doi:10.1007/s40005-015-0180-5
Nandi, U., Karmakar, S., Das, A. K., Ghosh, B., Padman, A., Chatterjee, N., et al. (2013). Pharmacokinetics, Pharmacodynamics and Toxicity of a Combination of Metoprolol Succinate and Telmisartan in Wistar Albino Rats: Safety Profiling. Regul. Toxicol. Pharmacol. 65 (1), 68–78. doi:10.1016/j.yrtph.2012.11.001
Nestorov, I. (2003). Whole Body Pharmacokinetic Models. Clin. Pharmacokinet. 42 (10), 883–908. doi:10.2165/00003088-200342100-00002
Nishimura, N., Naora, K., Hirano, H., and Iwamoto, K. (1999). A Chinese Traditional Medicine, Sho-Saiko-To (Xiao-chaihu-tang), Reduces the Bioavailability of Tolbutamide after Oral Administration in Rats. Am. J. Chin. Med. 27 (3-4), 355–363. doi:10.1142/S0192415X99000409
Nishimura, N., Naora, K., Hirano, H., and Iwamoto, K. (1998). Effects of Sho-Saiko-To on the Pharmacokinetics and Pharmacodynamics of Tolbutamide in Rats. J. Pharm. Pharmacol. 50 (2), 231–236. doi:10.1111/j.2042-7158.1998.tb06181.x
Paini, A., Leonard, J. A., Joossens, E., Bessems, J. G. M., Desalegn, A., Dorne, J. L., et al. (2019). Next Generation Physiologically Based Kinetic (NG-PBK) Models in Support of Regulatory Decision Making. Comput. Toxicol. 9, 61–72. doi:10.1016/j.comtox.2018.11.002
Pang, K. S., and Rowland, M. (1977). Hepatic Clearance of Drugs. I. Theoretical Considerations of a "Well-Stirred" Model and a "parallel Tube" Model. Influence of Hepatic Blood Flow, Plasma and Blood Cell Binding, and the Hepatocellular Enzymatic Activity on Hepatic Drug Clearance. J. Pharmacokinet. Biopharm. 5 (6), 625–653. doi:10.1007/bf01059688
Pelkonen, O., and Turpeinen, M. (2007). In Vitro-In Vivo Extrapolation of Hepatic Clearance: Biological Tools, Scaling Factors, Model Assumptions and Correct Concentrations. Xenobiotica 37 (10-11), 1066–1089. doi:10.1080/00498250701620726
Pi, J., Wang, S., Li, W., Kebebe, D., Zhang, Y., Zhang, B., et al. (2019). A Nano-Cocrystal Strategy to Improve the Dissolution Rate and Oral Bioavailability of Baicalein. Asian J. Pharm. Sci. 14 (2), 154–164. doi:10.1016/j.ajps.2018.04.009
Poulin, P., and Theil, F. P. (2002). Prediction of Pharmacokinetics Prior to In Vivo Studies. 1. Mechanism-Based Prediction of Volume of Distribution. J. Pharm. Sci. 91 (1), 129–156. doi:10.1002/jps.10005
Prentis, R. A., Lis, Y., and Walker, S. R. (1988). Pharmaceutical Innovation by the Seven UK-owned Pharmaceutical Companies (1964-1985). Br. J. Clin. Pharmacol. 25 (3), 387–396. doi:10.1111/j.1365-2125.1988.tb03318.x
Raunio, H., Taavitsainen, P., Honkakoski, P., Juvonen, R., and Pelkonen, O. (2004). In Vitro methods in the Prediction of Kinetics of Drugs: Focus on Drug Metabolism. Altern. Lab. Anim. 32 (4), 425–430. doi:10.1177/026119290403200415
Regårdh, C. G., Gabrielsson, M., Hoffman, K. J., Löfberg, I., and Skånberg, I. (1985). Pharmacokinetics and Metabolism of Omeprazole in Animals and Man - an Overview. Scand. J. Gastroenterol. 20 (Suppl. 108), 79–94. doi:10.3109/00365528509095821
Rietjens, I. M. C. M., Punt, A., Schilter, B., Scholz, G., Delatour, T., and van Bladeren, P. J. (2010). In Silico methods for Physiologically Based Biokinetic Models Describing Bioactivation and Detoxification of Coumarin and Estragole: Implications for Risk Assessment. Mol. Nutr. Food Res. 54 (2), 195–207. doi:10.1002/mnfr.200900211
Rodgers, T., Leahy, D., and Rowland, M. (2005). Tissue Distribution of Basic Drugs: Accounting for Enantiomeric, Compound and Regional Differences Amongst Beta-Blocking Drugs in Rat. J. Pharm. Sci. 94 (6), 1237–1248. doi:10.1002/jps.20323
Rodgers, T., and Rowland, M. (2007). Mechanistic Approaches to Volume of Distribution Predictions: Understanding the Processes. Pharm. Res. 24 (5), 918–933. doi:10.1007/s11095-006-9210-3
Rostami-Hodjegan, A., and Tucker, G. T. (2007). Simulation and Prediction of In Vivo Drug Metabolism in Human Populations from In Vitro Data. Nat. Rev. Drug Discov. 6 (2), 140–148. doi:10.1038/nrd2173
Rowland, M., Peck, C., and Tucker, G. (2011). Physiologically-based Pharmacokinetics in Drug Development and Regulatory Science. Annu. Rev. Pharmacol. Toxicol. 51, 45–73. doi:10.1146/annurev-pharmtox-010510-100540
Singh, D., and Asad, M. (2010). Effect of Soybean Administration on the Pharmacokinetics of Carbamazepine and Omeprazole in Rats. Fundam. Clin. Pharmacol. 24 (3), 351–355. doi:10.1111/j.1472-8206.2009.00762.x
Sun, D., Lennernas, H., Welage, L. S., Barnett, J. L., Landowski, C. P., Foster, D., et al. (2002). Comparison of Human Duodenum and Caco-2 Gene Expression Profiles for 12,000 Gene Sequences Tags and Correlation with Permeability of 26 Drugs. Pharm. Res. 19 (10), 1400–1416. doi:10.1023/a:1020483911355
Sun, W., Wang, Z., Chen, R., Huang, C., Sun, R., Hu, X., et al. (2017). Influences of Anlotinib on Cytochrome P450 Enzymes in Rats Using a Cocktail Method. Biomed. Res. Int. 2017, 3619723. doi:10.1155/2017/3619723
Taylor, K., and Alvarez, L. R. (2019). An Estimate of the Number of Animals Used for Scientific Purposes Worldwide in 2015. Altern. Lab. Anim. 47 (5-6), 196–213. doi:10.1177/0261192919899853
Tchaparian, E., Xu, G., Huang, T., and Jin, L. (2008). “Cell Based Experimental Models as Tools for the Prediction of Human Intestinal Absorption,” in Poster Presentation, 15th North American Regional International Society for the Study of Xenobiotics Meeting.
Templeton, I. E., Jones, N. S., and Musib, L. (2018). Pediatric Dose Selection and Utility of PBPK in Determining Dose. Aaps j 20 (2), 31. doi:10.1208/s12248-018-0187-8
T’jollyn, H., Vermeulen, A., and Van Bocxlaer, J. (2018). PBPK and its Virtual Populations: the Impact of Physiology on Pediatric Pharmacokinetic Predictions of Tramadol. AAPS J. 21 (1), 8. doi:10.1208/s12248-018-0277-7
Umehara, K., Huth, F., Jin, Y., Schiller, H., Aslanis, V., Heimbach, T., et al. (2019). Drug-drug Interaction (DDI) Assessments of Ruxolitinib, a Dual Substrate of CYP3A4 and CYP2C9, Using a Verified Physiologically Based Pharmacokinetic (PBPK) Model to Support Regulatory Submissions. Drug Metab. Pers Ther. 34 (2). doi:10.1515/dmpt-2018-0042
van de Kerkhof, E. G., de Graaf, I. A., and Groothuis, G. M. (2007). In Vitro methods to Study Intestinal Drug Metabolism. Curr. Drug Metab. 8 (7), 658–675. doi:10.2174/138920007782109742
Verhoeckx, K., Cotter, P., López-Expósito, I., Kleiveland, C., Lea, T., Mackie, A., et al. (2015). The Impact of Food Bioactives on Health: In Vitro and Ex Vivo Models. Cham (CH): Springer. doi:10.1007/978-3-319-16104-4_10
Vitale, A., Manciocco, A., and Alleva, E. (2009). The 3R Principle and the Use of Non-human Primates in the Study of Neurodegenerative Diseases: the Case of Parkinson's Disease. Neurosci. Biobehav Rev. 33 (1), 33–47. doi:10.1016/j.neubiorev.2008.08.006
Wachsmuth, L., Mensen, A., Barca, C., Wiart, M., Tristão-Pereira, C., Busato, A., et al. (2021). Contribution of Preclinical MRI to Responsible Animal Research: Living up to the 3R Principle. Magn. Reson. Mater. Phys. Biol. Med. 34 (4), 469–474. doi:10.1007/s10334-021-00929-w
Wagner, J. G. (1981). History of Pharmacokinetics. Pharmacol. Ther. 12 (3), 537–562. doi:10.1016/0163-7258(81)90097-8
Wang, X., Chen, M., Chen, X., Ma, J., Wen, C., Pan, J., et al. (2014). The Effects of Acute Hydrogen Sulfide Poisoning on Cytochrome P450 Isoforms Activity in Rats. Biomed. Res. Int. 2014, 209393. doi:10.1155/2014/209393
Wang, Y., Zou, M. J., Zhao, N., Ren, J. G., Zhou, H., and Cheng, G. (2011). Effect of Diallyl Trisulfide on the Pharmacokinetics of Nifedipine in Rats. J. Food Sci. 76 (1), T30–T34. doi:10.1111/j.1750-3841.2010.01960.x
Watanabe, K., Matsuka, N., Okazaki, M., Hashimoto, Y., Araki, H., and Gomita, Y. (2002). The Effect of Immobilization Stress on the Pharmacokinetics of Omeprazole in Rats. Acta Med. Okayama 56 (1), 19–23. doi:10.14712/18059694.2019.52
Welch, R. M., Hughes, C. R., and Deangelis, R. L. (1976). Effect of 3-methylcholanthrene Pretreatment on the Bioavailability of Phenacetin in the Rat. Drug Metab. disposition: Biol. fate chemicals 4 (4), 402–406.
Winiwarter, S., Bonham, N. M., Ax, F., Hallberg, A., Lennernäs, H., and Karlén, A. (1998). Correlation of Human Jejunal Permeability (In Vivo) of Drugs with Experimentally and Theoretically Derived Parameters. A Multivariate Data Analysis Approach. J. Med. Chem. 41 (25), 4939–4949. doi:10.1021/jm9810102
Yamashita, F., and Hashida, M. (2004). In Silico approaches for Predicting ADME Properties of Drugs. Drug Metab. Pharmacokinet. 19 (5), 327–338. doi:10.2133/dmpk.19.327
Yamazaki, S., Skaptason, J., Romero, D., Vekich, S., Jones, H. M., Tan, W., et al. (2011). Prediction of Oral Pharmacokinetics of cMet Kinase Inhibitors in Humans: Physiologically Based Pharmacokinetic Model versus Traditional One-Compartment Model. Drug Metab. Disposition 39 (3), 383. doi:10.1124/dmd.110.035857
Yoon, I. S., Choi, M. K., Kim, J. S., Shim, C. K., Chung, S. J., and Kim, D. D. (2011). Pharmacokinetics and First-Pass Elimination of Metoprolol in Rats: Contribution of Intestinal First-Pass Extraction to Low Bioavailability of Metoprolol. Xenobiotica 41 (3), 243–251. doi:10.3109/00498254.2010.538090
Young, L. D., Lee, MG, Sook, S. H., and Inchul, L. (2007). Changes in Omeprazole Pharmacokinetics in Rats with Diabetes Induced by Alloxan or Streptozotocin: Faster Clearance of Omeprazole Due to Induction of Hepatic CYP1A2 and 3A1. J. Pharm. Pharm. Sci. 10 (4), 420–433. doi:10.18433/j3wc7g
Zhang, J., Lv, H., Jiang, K., and Gao, Y. (2011). Enhanced Bioavailability after Oral and Pulmonary Administration of Baicalein Nanocrystal. Int. J. Pharm. 420 (1), 180–188. doi:10.1016/j.ijpharm.2011.08.023
Zhang, X., Yang, Y., Grimstein, M., Fan, J., Grillo, J. A., Huang, S. M., et al. (2020). Application of PBPK Modeling and Simulation for Regulatory Decision Making and its Impact on US Prescribing Information: An Update on the 2018-2019 Submissions to the US FDA's Office of Clinical Pharmacology. J. Clin. Pharmacol. 60 (Suppl. 1), S160–s178. doi:10.1002/jcph.1767
Keywords: physiologically based pharmacokinetic modeling, 3Rs, preclinical studies, alternative for animal experiments, bottom-up model
Citation: Yuan Y, He Q, Zhang S, Li M, Tang Z, Zhu X, Jiao Z, Cai W and Xiang X (2022) Application of Physiologically Based Pharmacokinetic Modeling in Preclinical Studies: A Feasible Strategy to Practice the Principles of 3Rs. Front. Pharmacol. 13:895556. doi: 10.3389/fphar.2022.895556
Received: 14 March 2022; Accepted: 14 April 2022;
Published: 12 May 2022.
Edited by:
Shuiying Hu, The Ohio State University, United StatesReviewed by:
Yang Lu, China Pharmaceutical University, ChinaYizhen Guo, The Ohio State University, United States
Copyright © 2022 Yuan, He, Zhang, Li, Tang, Zhu, Jiao, Cai and Xiang. This is an open-access article distributed under the terms of the Creative Commons Attribution License (CC BY). The use, distribution or reproduction in other forums is permitted, provided the original author(s) and the copyright owner(s) are credited and that the original publication in this journal is cited, in accordance with accepted academic practice. No use, distribution or reproduction is permitted which does not comply with these terms.
*Correspondence: Weimin Cai, d2VpbWluY2FpQGZ1ZGFuLmVkdS5jbg==; Xiaoqiang Xiang, eGlhbmd4cUBmdWRhbi5lZHUuY24=
†These authors have contributed equally to this work
 Yawen Yuan
 Qingfeng He
 Shunguo Zhang2
 Zhijia Tang
 Zheng Jiao
 Weimin Cai
 Xiaoqiang Xiang