- 1School of Public Health, Shaanxi University of Chinese medicine, Xi’an, China
- 2School of Pharmaceutical Science, Shanxi Medical University, Taiyuan, China
Flavonoids were the major phytochemicals against hepatic peroxidative injury in Scleromitron diffusum (Willd.) R. J. Wang with an inventive bio-enzymatic method by our group (LU500041). Firstly, the total flavonoids from Scleromitron diffusum (Willd.) R. J. Wang were extracted by reflux, ultrasonic, ultrasound-assisted enzymatic methods (TFH), and the bio-enzymatic method (Ey-TFH). Then 24 flavonoid compounds were isolated and quantified in the extracts by UPLC-MS/MS. Next, six representative differential compounds in Ey-TFH were further screened out by multivariate statistical analysis compared with those in TFH. In a further step, Ey-TFH presented a higher protective rate (59.30 ± 0.81%) against H2O2-damaged HL-02 hepatocytes than TFH. And six representative differential compounds at 8 and 16 μmol/L all exerted significant hepatoprotective effects (p < 0.05 or p < 0.01). Finally, the therapeutic action of Ey-TFH for nonalcoholic fatty liver disease (NAFLD) was processed by a rat’s model induced with a high-fat diet. Ey-TFH (90, 120 mg/kg) significantly ameliorated the lipid accumulation in the rat model (p < 0.05). Meanwhile, Ey-TFH relieved liver damage. The levels of ALT, ALP, AST, LDH, and γ-GT in rats’ serum were also significantly reduced (p < 0.05 or p < 0.01). In addition to this, the body’s antioxidant capacity was improved with elevated SOD and GSH levels (p < 0.05) and down-regulated MDA content (p < 0.01) after Ey-TFH administration. Histopathological observations of staining confirmed the hepatic-protective effect of Ey-TFH.
1 Introduction
Nonalcoholic fatty liver disease (NAFLD) is a metabolic stress liver injury related to insulin resistance (IR) and genetic susceptibility. NAFLD is the most prevalent chronic liver disease worldwide, and its prevalence in adults is estimated at 6.7%–45%. NAFLD is a metabolic syndrome that results in impaired multi-systems (Buzzetti et al., 2016). NAFLD, metabolic syndrome (Mets), and type 2 diabetes mellitus (T2DM) coexist and contribute to cirrhosis, hepatocarcinogenesis, chronic kidney disease (CKD), and colorectal tumors. Clinically, statins have been widely used to treat elevated lipid levels of patients with NAFLD. However, no clear evidence of improving liver fibrosis due to statins has been reported. Obeticholic acid attenuates NAFLD-induced liver fibrosis, but lipid metabolism’s adverse impact limits its application. Beyond these, drugs against liver damage, such as silydianin and bicyclol, have been studied, although the therapeutic effects still need validation in further clinical trials (Friedman et al., 2018; Bessone et al., 2019). Due to the lack of clearly identified treatment targets and regulatory dysfunctions of an organism in NAFLD pathological processes, natural products, which exert therapeutic function by the interaction of multi-targets and multi-ingredients, are potential treatment strategies for NAFLD.
Scleromitron diffusum (Willd.) R. J. Wang (syn. Hedyotis diffusa Willd., HD, Bai-Hua-She-She-Cao, White-patterned snake’s tongue herb, Oldenlandia diffusa (Willd.) Roxd), an herb belonging to the Rubiaceae family, has been clinically used in China for a long time. It has various active phytochemicals such as flavonoids, anthraquinones, terpenoids, sterols, and polysaccharides. The flavonoids as the main bioactive substances of Scleromitron diffusum (Willd.) R. J. Wang, exhibit a wide spectrum of pharmacological activities, including hepatoprotective, anti-inflammatory (Zhao et al., 2020), anti-oxidant, anti-viral (Ninfali et al., 2020), anti-diabetic (Mechchate et al., 2020), and anti-peptic ulcer (Serafim et al., 2020) activities. In 2019, the project “Standard of Traditional Chinese Medicinal Materials and Prepared Pieces about Scleromitron diffusum (Willd.) R. J. Wang of Shanxi Province” was undertaken by our research team. Upon request, we found the total flavonoids of Scleromitron diffusum (Willd.) R. J. Wang extracted by bio-enzymatic method possessed more different active components, lower toxicity, and higher hepatic-protective properties than traditional reflux, ultrasonic, ultrasound-assisted enzymatic methods. In particular, its total flavonoids extracted by intensive bio-enzymatic method received a Luxembourg International Invention patent (LU500041) due to getting more flavonoid types through cellulase. So, this plant was selected to further explore its competitive hepatoprotective activity, material basis, and mechanism of action. In our previous study, Chen et al. have reported the total flavonoids from Scleromitron diffusum (Willd.) R. J. Wang protected the liver from oxidative stress injury by inhibiting ASK1/p38 (Li YL. et al., 2020). Tsai et al. have demonstrated that quercetin, a flavonoids compound, could inhibit the M1 macrophage polarization and enhance the M2 macrophage polarization to exhibit anti-inflammatory effects. Moreover, quercetin could be a potential drug to treat neuroinflammation diseases (Tsai et al., 2021). Zhao Y et al. have reported that the total flavonoids from Nakai, a dietary supplement, could significantly remit renal fibrosis in a chronic renal failure animal model (Zhao et al., 2022). With the in-depth studies, many researchers are interested in new flavonoids compounds and their pharmacological activities. In this study, the role of the total flavonoids of Scleromitron diffusum (Willd.) R. J. Wang extracted by the bio-enzymatic method (Ey-TFH) in the treatment of NAFLD had been confirmed. Ey-TFH showed a hepatoprotective effect by improving ectopic lipid deposition and antioxidants and alleviating liver impairments.
The total flavonoids of Scleromitron diffusum (Willd.) R. J. Wang are gradually becoming a hot spot in research frontiers and extraction methods have attracted more attention. Traditional methods proposed for extracting the total flavonoids include reflux extraction (Zhang R. et al., 2021) and ultrasonic-assisted extraction (Liu et al., 2021; Martín-García et al., 2021; Rezende re al., 2021; Shi et al., 2021). In the last decade, the bio-enzymatic extraction method has been introduced. It is an efficient green technique with several benefits over the conventional methods (Nadar et al., 2018). Enzymes are a kind of bio-catalyst, and proteins are the primary constituents. Because enzymes are usually synthesized in biological cells, they are called bio-enzymes. The bio-enzymatic method is the extraction technique that utilizes bio-enzymes, causing the destruction of plant cell walls and resulting in the outflow of intracellular active ingredients (Zhang X. et al., 2021). Under specific conditions, including the enzyme-substrate concentration, temperature, pH, and reaction time, the higher extraction yields and compounds with more pharmacological activity will be reaped by the bio-enzymatic method. In this work, the total flavonoids of Scleromitron diffusum (Willd.) R. J. Wang were extracted by intensive bio-enzymatic method (LU500041). Subsequently, an analytical method combining UPLC-MS/MS and multivariate statistical methods was established to isolate, quantify, and screen the total flavonoids. On the one hand, UPLC-MS/MS, coupling liquid chromatography to mass spectrometry (Li et al., 2011), contributed significantly to the study of TCM over the past few decades (Wiley et al., 2021). Therefore, our research team had used it to simultaneously isolate and quantify flavonoids complex from diverse extracts of TCM, such as Scleromitron diffusum (Willd.) R. J. Wang (Chen et al., 2020) and Shuangren-Anshen capsule (Liu et al., 2016). On the other hand, our research group found that the bio-enzymatic method harvests more flavonoids and higher hepatic-protective properties (Li et al., 2016; Li C. et al., 2020) by thoroughly dissolving the cell walls of plants compared with other extraction methods. It is feasible to more competitive total flavonoids using the bio-enzymatic method, and then isolate and quantify them by UPLC-MS/MS. Results showed that compared with the total flavonoids extracted by three common methods (TFH), there are more differential compounds in Ey-TFH. In addition, in vitro experiments demonstrated that these differential compounds played vital roles in maintaining the optimal hepatoprotective effect of Ey-TFH.
In summary, the total flavonoids of Scleromitron diffusum (Willd.) R. J. Wang had been extracted by the inventive bio-enzymatic method. Next, the bioactivities of Ey-TFH and TFH were compared in vitro. Ey-TFH showed a superior effect against NAFLD in vivo due to their various pharmacological activities. Our work had further essential implications for flavonoids development.
2 Materials and Methods
2.1 Herbal Samples and Reagents
Scleromitron diffusum (Willd.) R. J. Wang (10 batches) were purchased from Jiangxi and identified by Prof. Tianai Gao from Shanxi Provincial Food and Drug Inspection Institute. Cellulase was obtained from Zhejiang Yinuo Biotechnology Co., Ltd (Zhejiang, China). The 36 flavonoid standards (seen in Table 3) were purchased from Sigma-Aldrich and Steraloids. Fenofibrate, formic acid, methanol, isopropanol, and acetonitrile were HPLC grade from Sigma. Macroporous adsorbent resin AB-8 was obtained from Chengdu Grecia Chemical Technology Co., Ltd. 3-(4,5-dimethyl-2-thiazolyl)-2,5-diphenyl-2-H-tetrazolium bromide (MTT), RMPI 1640 medium, fetal bovine serum (FBS), and trypsin were purchased from Wuhan Servicebio Biological Technology Co., Ltd (Wuhan, China). Triglyceride (TG), total cholesterol (TC), aspartate transaminase (AST), alanine transaminase (ALT), γ-Glutamyltranspeptidase (γ-GT), superoxide dismutase (SOD), glutathione (GSH), lactate dehydrogenase (LDH), alkaline phosphatase (ALP), and malondialdehyde (MDA) assay kits were supplied by Nanjing Jiancheng Bio-engineering Institute (Nanjing, China). Ethanol, methanol, formic acid, and acetonitrile were of chromatographic grade.
2.2 Preparation of TFH and Ey-TFH
Dried whole Scleromitron diffusum (Willd.) R. J. Wang powders were sieved through a 60 mesh sieve (0.25 mm), degreased by ultrasonic for 30 min, and dried to obtain defatted powders. The conditions of the four extraction methods are shown in Table 1.
TFH and Ey-TFH were purified by macroporous adsorption resin AB-8 with ethanol (95%, v/v). Next, eluates from AB-8 resin were concentrated at 45°C under reduced pressure and dried. The resulting dry powders were dissolved in a methanol-water solution (7:3, v/v). After vortexing and centrifugation, the supernatants were collected and analyzed by UPLC-MS/MS.
2.3 Determination of the Total Flavonoids Yields
The method described by Li YL. et al. (2020) was used to determine the yields of the total flavonoids. First, 0.6 ml of the total flavonoids purified solution was transferred to a 10 ml volumetric flask and mixed with 0.3 ml sodium nitrite (5%, w/v), 0.3 ml aluminum nitrate (10%, w/v), and 4 ml sodium hydroxide (4%, w/v). The final volume of the mixture was adjusted to 10 ml with methanol. Then, the absorbance of the mixture at 500 nm was determined by a UV-vis spectrophotometer (MAPADA instruments Co., Ltd., Shanghai, China). The contents of the total flavonoids were expressed as rutin equivalents through the standard calibration curve (y = 14.07x+0.0116, r = 0.9990). The total flavonoids yields were calculated as follows:
2.4 UPLC—MS/MS Analysis
2.4.1 Chromatographic Conditions
Waters ACQUITY UPLC I-Class system was used to analyze flavonoids from Scleromitron diffusum (Willd.) R. J. Wang quantitatively. The column was HSS T3 (2.5 µm, 2.1 mm × 150 mm) from Waters. The mobile phases consisted of eluent A (0.1% formic acid in water, v/v) and eluent B (0.1% formic acid in acetonitrile, v/v) with a flow rate of 400 μl/min following gradient program shown as follows: 0–3 min, A-B (95:5, v/v); 3–4.3 min, A-B (80:20, v/v); 4.3–9 min, A-B (55:45, v/v); 9–11 min, A-B (2:98, v/v); 11–13 min, A-B (2:98, v/v); 13–15 min, A-B (95:5, v/v). The temperature of the system was set at 4°C. The sample input volume was 5 μl.
2.4.2 Mass Spectrometric Conditions
AB SCIEX 5500 QTRAP was used. Selected/multiple reaction monitoring with positive and negative ion switching mode was performed. The ion source parameters of positive ion mode were as follows: Source temperature, 550°C; Gas 1, 55; Gas 2, 50; CRU, 30; ISVF, 5500 V. The ion source parameters of negative mode were as follows: Source temperature, 550°C; Gas 1, 55; Gas 2, 50; CRU, 30; ISVF, -4500V. The data were analyzed using MultQuant and Analyst software.
2.4.3 Precision
Equal amounts of all standards were mixed to prepare quality control (QC) samples which were used to ensure the precision of the analytical method.
2.4.4 Linear Range
A serial dilution was used to prepare calibration solutions from 125 ng/ml stock solutions of 36 flavonoid standards. Regression lines were calculated by the Least Squares Method. The X-axis showed concentrations (pg/ml) of different solution standards, and Y-axis denoted corresponding peak areas. Correlation coefficient values (R) and linear range were obtained.
2.4.5 Determination of Flavonoids Contents
The TFH and Ey-TFH samples were used for UPLC-MS/MS analysis and repeated three times.
2.4.6 Multivariate Analysis
The data were imported into SIMCA 14.1 software to analyze differential components of TFH and Ey-TFH. Hierarchical Clustering Analysis (HCA) was used to analyze the difference between each method. Principal component analysis (PCA) was a multivariate statistic method to investigate the correlation of multiple variables. Orthogonal partial least squares discrimination analysis (OPLS-DA) was a supervised multivariate pattern recognition method that was used to screen out potential differential components.
2.5 Cell Culture
HL-02 cells (obtained from BOSTER Biological Technology Co., Ltd.) were cultured in RMPI 1640 with 10% FBS, penicillin (100 U/mL), and streptomycin (100 μg/ml) under 5% CO2 at 37°C. When cells were in a logarithmic growth phase, they were treated separately with different concentrations of TFH and Ey-TFH (0, 31.3, 62.5, 125 μg/ml) for 12 h and then exposed to H2O2 (200 μmol/L). The six flavonoid compounds, including apigenin, chrysin, genistein, isovitexin, naringin, and vitexin (1, 2, 4, 8, 16, 32, 64 μmol/L), were added in the same way as Ey-TFH. The non-treated HL-02 cells were used as the control group.
2.6 Protective Rates of Flavonoids
The protective rates for HL-02 cells were determined by the MTT method. The OD was measured, and the protection rates were calculated according to the following equation:
2.7 Animal Experiment
For the experiment, 60 rats (provided by the Experimental Animal Center of Shanxi Medical University, No. 22829) were fed adaptively for one week and randomly divided into six groups. Animals were given either a standard chow diet (control group, n = 10) or a high-fat diet (HFD, 45% calories from fat, Jiangsu Synergy Medical Bioengineering Co., Ltd., n = 50) for three weeks. After successfully modeling, positive control fenofibrate (83 μmol/kg) or Ey-TFH (low-dose, 60 mg/kg; medium-dose, 90 mg/kg; high-dose, 120 mg/kg) solved in distilled water were administrated intragastrically to the assigned HFD groups once every day for two weeks. Meanwhile, the control and model groups were administered the same distilled water (vehicle). Orbital blood and liver tissue of rats were collected and frozen at −80°C for further analysis. According to the manufacturer’s protocols, TG, TC, γ-GT, GSH, SOD, MDA, LDH, AST, ALT, and ALP were investigated in rats’ serum. Rats were killed by decapitation. The livers were quickly separated, washed with saline, and weighed for liver index evaluation. The liver index was calculated according to the following equation:
Finally, liver tissues were fixed in 4% neutral formalin solution, embedded in paraffin, and were stained with hematoxylin and eosin (H&E). Subsequently, the liver sections were observed under an Olympus iX-51light microscopy (×100).
2.8 Statistical Analysis
The data were expressed as means ± standard deviation (SD). Statistical analysis was performed using GraphPad Prism 8.4.0 software (San Diego, CA, United States). A T-test was used to compare the differences between groups. p < 0.05 was considered significant.
3 Result
3.1 The Yields of the Total Flavonoids Extracted by Different Methods
The yields of the total flavonoids of Scleromitron diffusum (Willd.) R. J. Wang separately extracted by bio-enzymatic, reflux, ultrasonic, and ultrasound-assisted enzymatic methods were shown in Table 2. The yield of total flavonoids from bio-enzymatic was higher than yields obtained by reflux and ultrasonic. The bio-enzymatic method extracted the yield of total flavonoids comparable to the ultrasound-assisted enzymatic method. The results indicated that enzymes played a major role in harvesting more flavonoids.
3.2 Establishment of UPLC-MS/MS Method
The contemporaneous quantification of 36 flavonoid compounds was validated. The extracted ion chromatograms (XIC) of 24 representative flavonoid standards are shown in Figure 1A. The retention time, mass information, standard curves, and concentration range of 36 flavonoids standards are shown in Table 3. As seen in Figure 1A and Table 3, each component could be well separated, and the peak shape was sharp and symmetrical. High correlation coefficient values (R2 > 0.99) were obtained, indicating strong linearity at a relatively wide range of concentrations. The relative standard deviation (RSD) of 24 representative QC samples is shown in Figure 1B. The precisions were < 30%. The obtained results demonstrated that this UPLC-MS/MS method met the methodological requirements.
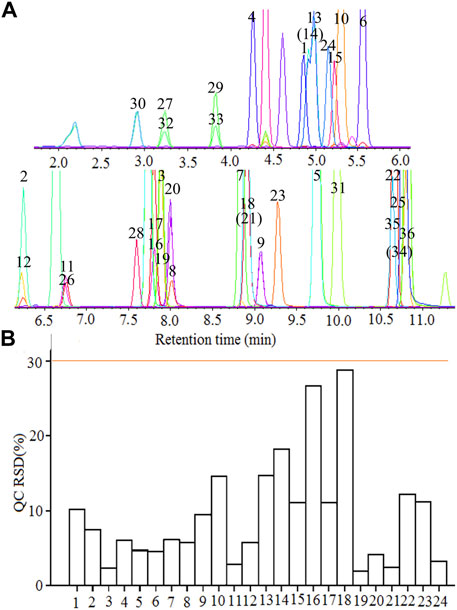
FIGURE 1. UPLC-MS/MS determination of flavonoid compounds. (A) The extracted ion chromatograms (XIC) of 36 flavonoid standards; (B) The relative standard deviation (RSD) of 24 representative quality control (QC). 1 Rutin, 2 Naringin, 3 Glycetein, 4 Daidzin, 5 Isoliquiritigenin, 6 Genistin, 7 Naringenin, 8 Luteolin, 9 kaempferol, 10 Taxifolin, 11 Myricetin, 12 Quercitrin, 13 Vitexin, 14 Isovitexin, 15 Isoquercetin, 16 Liquiritigenin, 17 Daidzein, 18 Genistein, 19 Eriodictyol, 20 Quercetin, 21 Apigenin, 22 Chrysin, 23 Isorhamnetin, 24 Luteolin-7-O-glucoside, 25 Biochanin A, 26 Butin, 27 Catechin, 28 Dihydrokaempferol, 29 Epicatechin, 30 (-)-Epigallocatechin, 31 Formononetin, 32 (+)-Gallocatechin, 33 Glycitin, 34 Sakuranetin, 35 Kaempferide, 36 Puerarin.
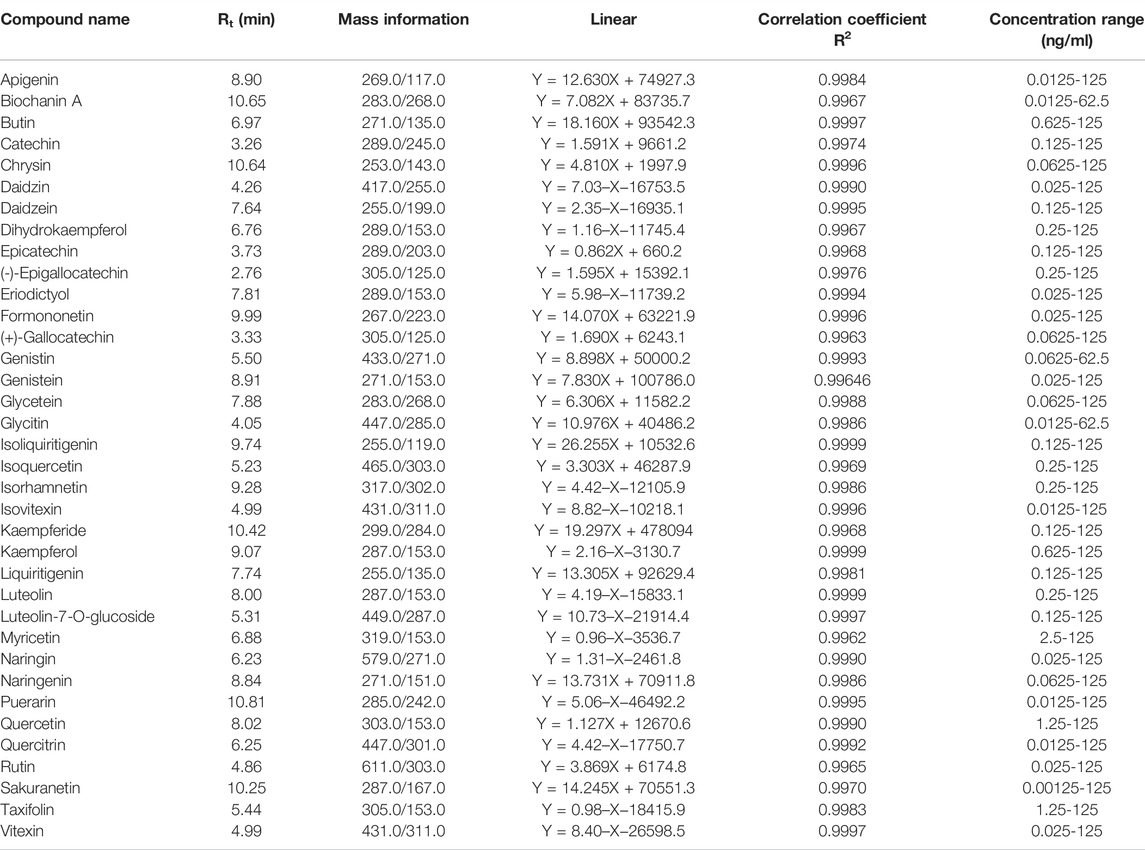
TABLE 3. The retention times, mass information, standard curves, and concentration range of 36 flavonoid standards.
3.3 Determination of the Content of Flavonoids
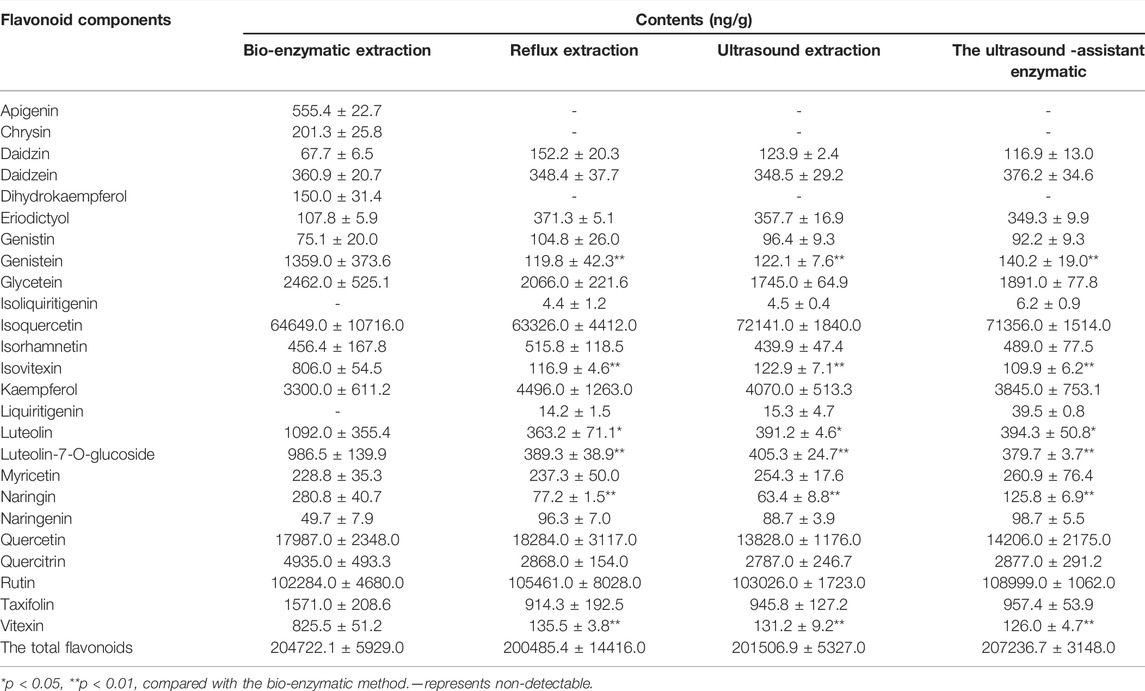
The quantitative determination of 24 representative flavonoids components in TFH and Ey-TFH are shown in Table 4 (Supplementary Sheet S1). The total levels of flavonoids in the studied extracts ranged from 201 to 207 ng/g. There was no difference between TFH and Ey-TFH in contents. In sharp contrast, compared with TFH, the contents of six flavonoids components (genistein, isovitexin, luteolin, luteolin-7-O-glucoside, naringin, and vitexin) were higher in Ey-TFH (p < 0.05 or p < 0.01). Furthermore, Ey-TFH contained these three components (apigenin, chrysin, and dihydrokaempferol), which were not detected in TFH.
3.4 Differential Components Analysis
3.4.1 HCA Analysis
Multivariate statistical analysis was performed to screen the differential components among TFH and Ey-TFH. HCA was a process of dividing data into different classes or clusters. When the analysis was reasonable and accurate, similar samples of the same group could appear in the same cluster through clustering, while samples of different clusters had specific differences. As shown in Figure 2A, assuming that a suitable level of distance was selected, extracts prepared by four methods could be divided into two main clusters: bio-enzymatic extracts were cluster 1; the other three extracts (reflux, ultrasonic, and ultrasound-assisted enzymatic methods) were cluster 2. Namely, Ey-TFH were cluster 1 and TFH were cluster 2. The differences could be intuitively seen from the distance of samples in the cluster analysis diagram. There was a significant difference between the bio-enzymatic method and the other three extraction methods.
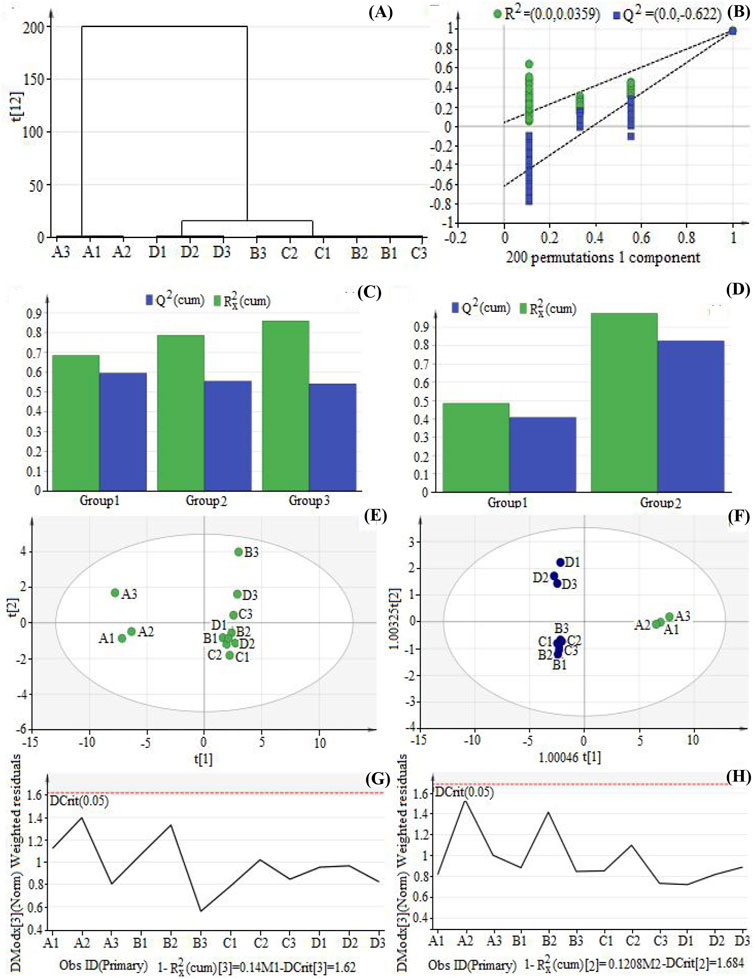
FIGURE 2. Hierarchical clustering analysis (HCA) analysis, Principal component analysis (PCA) analysis, and Orthogonal partial least squares discrimination analysis (OPLS-DA) analysis. (A) The diagram of HCA; (B) The result of permutation text of OPLS-DA; (C) The fitting result of PCA; (D) The fitting result of OPLS-DA; (E) Score plot of PCA; (F) Score plot of OPLS-DA; (G) Distance to model (DModx) plot of PCA; (H) DModX Plot of OPLS-DA. A1, A2, A3 represent bio-enzymatic method; B1, B2, B3 represent reflux method; C1, C2, C3 represent ultrasonic method; D1, D2, D3 represent ultrasound-assisted enzymatic method.
3.4.2 PCA Analysis
In order to investigate the differences among the four preparation methods, a widely used tool, PCA, was applied. The results were shown in Figures 2C,E,G. According to PCA relevant results (Figure 2E), three principal components were included as the optimal number of latent variables. R2X and Q2 were important parameters of the PCA model. The quality of the model was described by the Q2 and R2 (R2X or R2y) parameters. Q2 denoted the predictability, and R2 indicated the goodness of fit. In this study, R2X = 0.86, Q2 = 0.543. Both parameters were greater than 0.5, and all the samples fell within the 95% confidence interval, suggesting that the model was reliable. The samples could be classified into two separate categories based on the PCA scores plot (Figure 2E). Samples of bio-enzymatic method (A1, A2, A3) belonged to category 1, while samples of reflux method (B1, B2, B3), ultrasonic method (C1, C2, C3), and ultrasound-assisted enzymatic method (D1, D2, D3) belonged to category 2. That is to say, Ey-TFH belonged to category 1, while TFH belonged to category 2. That implied dissimilarity between Ey-TFH and TFH. According to Figure 2C, the overlaps among the samples of reflux method (B1, B2, B3), ultrasonic method (C1, C2, C3), and ultrasound-assisted enzymatic method (D1, D2, D3) were apparent. In other words, there was no significant difference between these three methods. Distance to model (DModX) was applied to measure mismatch with normal. As shown in Figure 2G, the DmodX values of all samples were within the control limits, indicating that all samples had reliable quality.
3.4.3 OPLS-DA Analysis
OPLS-DA was also conducted to explore differential components contributing to the group separation. OPLS-DA was a kind of supervised pattern recognition method. It was designed to remove the variation not associated with the response being studied. An improved level of group classification and a better understanding of the variations responsible for classification was constructed. A permutation test was adopted to reveal overfitting (Figure 2B). All the left points of R2 and Q2 were lower than the rightmost original ones. The vertical axis intercept by the regression curve of Q2 points was less than zero. These indicated that this OPLS-DA model was reliable and free from overfitting. There were two principal components, as shown in the OPLS-DA fitting results (Figure 2D). The R2 and Q2 values were nearly close to 1 (R2X = 0.88, R2Y = 0.98, Q2 = 0.87), suggesting the model was validated and considered highly relevant. Greater R2 and Q2 values indicated that OPLS-DA analysis could better reflect between-group differences. Figure 2F shows that the samples of the bio-enzymatic method (A1, A2, A3) were distributed into a cluster distinct from those of the reflux method (B1, B2, B3), ultrasonic method (C1, C2, C3), and ultrasound-assisted enzymatic method (D1, D2, D3). Namely, Ey-TFH was distributed into a cluster distinct from TFH. Similar to the PCA loading plot, the separated distributions implied discrimination between TFH and Ey-TFH. Also, OPLS-DA was able to separate the samples of reflux, ultrasonic, and ultrasound-assisted enzymatic methods, which were overlapped completely in the PCA loading plot. The DmodX value of all samples (Figure 2H) showed that there were no abnormal points, demonstrating that the data were reliable.
3.5 Screening for Differential Compounds of TFH and Ey-TFH
Table 5 illustrates the variable importance in projection (VIP) values of the OPLS-DA model. The greater VIP value, the stronger contribution to the model explaining. VIP score >1 was usually used as a threshold. VIP value confirmed the assessment results of differential components, as shown in section 3.3. For three compounds only found in Ey-TFH, contents shown in Table 4 and VIP values of apigenin and chrysin were higher than those of ihydrokaempferol. Taking both aspects into consideration, apigenin and chrysin, but not ihydrokaempferol, were selected for the subsequent in vitro experiments.
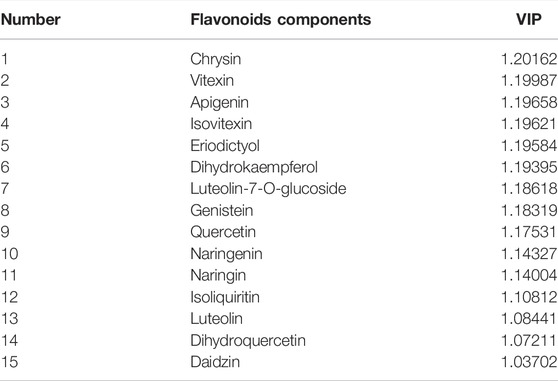
TABLE 5. The components with variable importance in projection (VIP) values greater than one as threshold.
A volcanic map was drawn to present the individual components that contributed to group classification in the next step. The results are depicted in Figure 3. The x-axis was the logarithm (base 2) of fold changes (FC). The y axis was the negative logarithm (base 10) of p-values (as it has been calculated in Table 4). Two vertical dashed lines represented FC < 2 or FC > 2, respectively. The horizontal dashed lines indicated p = 0.05. The upper layer of Figure 4 shows a comparison between TFH and Ey-TFH. Green or red represented significantly decreased or increased components in terms of FC and p-value, respectively. Red triangles represented components (genistein, isovitexin, naringin, and vitexin) that met the filtering criteria (FC > 3.5 and p < 0.01). The lower layer of Figure 3 compared extracts prepared by reflux, ultrasonic, or ultrasound-assisted enzymatic method. There was no significant difference in components among them.
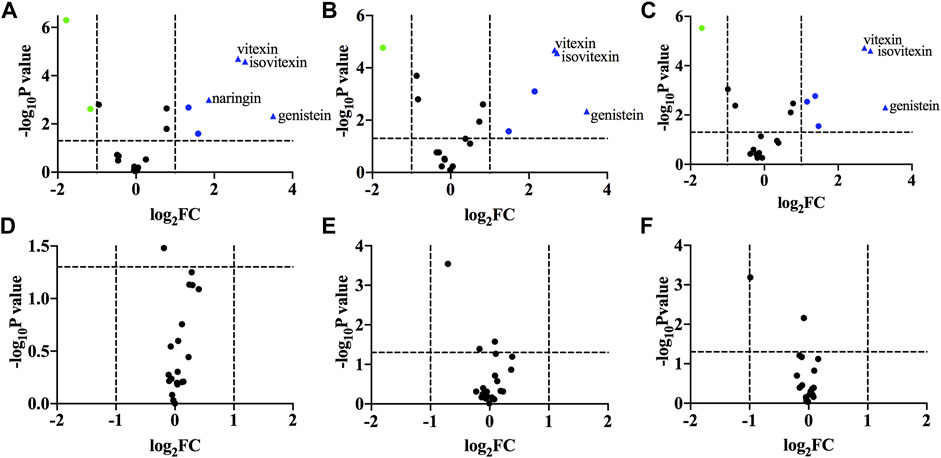
FIGURE 3. Volcano plot. (A) a vs. b; (B) a vs. c; (C) a vs. d; (D) b vs. c; (E) b vs. d; (F) c vs. (D) (A) represents bio-enzymatic method; (B) represents reflux method; (C) represents ultrasonic method; (D) represents ultrasound-assisted enzymatic method.
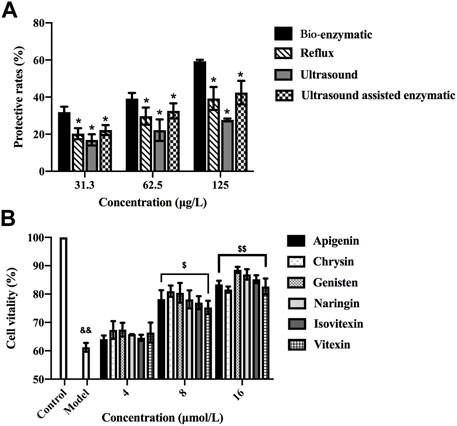
FIGURE 4. (A) Hepatoprotective effects of the total flavonoids extracted by reflux, ultrasonic, ultrasound-assisted enzymatic method (TFH) and bio-enzymatic method (Ey-TFH). *p < 0.05, compared with Ey-TFH. Data of Figure 4A were submitted simultaneously to Fourth International Scientific Conference” Alternative Energy Sources, Materials and Technologies (AESMT′21)"14th June 15th June 2021, Ruse, Bulgaria. (B) Cell viability after exposure to various concentrations of six differential components. && p < 0.01, compared with the control group; $ p < 0.05, $$ p < 0.01, compared with the model group.
After the comprehensive screening process, six representative differential components (vitexin, isovitexin, naringin, genistein, apigenin, and chrysin) were filtered for the subsequent cellular tests.
3.6 Hepatoprotective Effects of Ey-TFH, TFH and Six Differential Compounds in vitro
This part explored the hepatoprotective activities of TFH, Ey-TFH, and six further screened difference components. The hepatoprotective properties against H2O2 (200 μmol/L, 4 h) induced damage on HL-02 hepatocytes were studied. As shown in Figure 4A, the protective rates of TFH and Ey-TFH increased dose-dependently. Ey-TFH possessed the highest protection rate of all the tested concentrations compared with TFH (p < 0.05). According to Figure 4B, six differential components (vitexin, isovitexin, naringin, genistein, apigenin, and chrysin) all exerted significant protective effects on HL-02 hepatocytes at 8 and 16 μmol/L. In this light, it can be speculated that the hepatoprotective effect of six differential components might contribute to the superior protection of hepatocytes of Ey-TFH.
3.7 Ey-TFH Inhibited Hepatic Lipid Accumulation
Excess hepatic fat accumulates continuously at the early stage of NAFLD. This condition makes the liver extremely vulnerable to other damaging factors such as a plethora of oxidative stress, dysregulated hepatocyte apoptosis, and inflammation. These factors act together or separately, which would drive the progress from simple steatosis to nonalcoholic steatohepatitis. The therapeutic effect of Ey-TFH on NAFLD was investigated with a rat model of high-fat diet-induced obesity. We firstly investigated the weight gain and liver indexes. As shown in Figures 5C,D, Ey-TFH could reduce the risk of excessive weight gain and liver indexes. Next, we measured liver fat accumulation markers, serum TG and TC, after being treated with Ey-TFH. TC and TG contents ameliorated significantly after medium-dose and high-dose Ey-TFH treatment (Figures 5E,F). Taken together, Ey-TFH suppressed hepatic lipid accumulation.
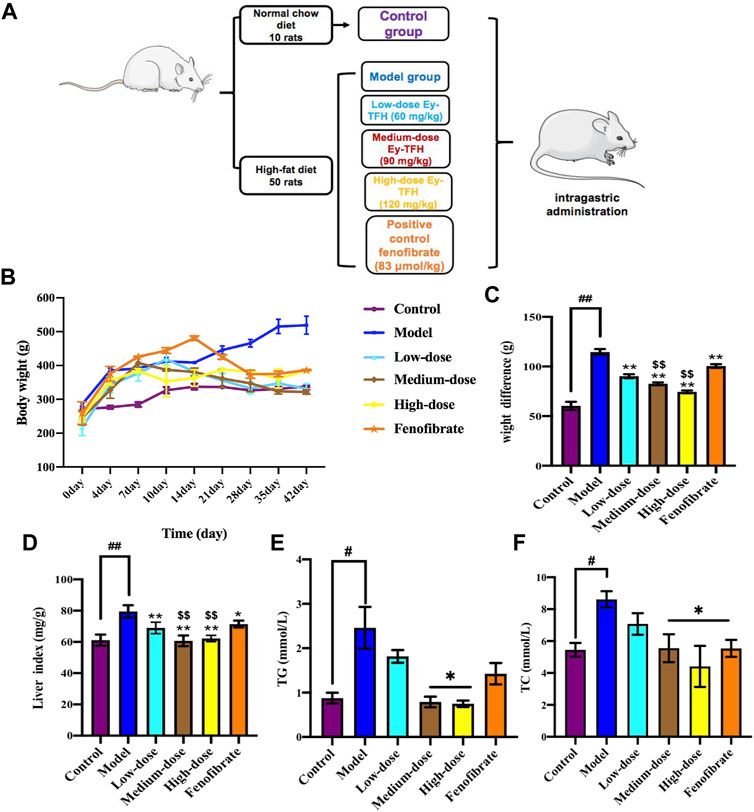
FIGURE 5. Effect of Ey-TFH on lipid accumulation. (A) The scheme of HFD - induced NAFLD model and Ey-TFH treatment. (B) Growth curve. (C) Weight difference. (D) Liver index. (E) TG contents. (F) TC contents. #p < 0.05, compared with the control group; *p < 0.05, compared with the model group; $$ p < 0.01, compared with the position control group.
3.8 Ey-TFH Protects the Liver in HFD—Induced NAFLD
We tried to learn more about the improvement effect of Ey-TFH for NAFLD. Therefore, HE staining was used to assess the injury in liver sections. The result showed that Ey-TFH significantly reduced hepatic injury (Figure 6A). The liver injury markers such as ALT, AST, and LDH were measured. Large amounts of ALT, AST, and LDH were released from the damaged hepatocyte. The ALT, AST, and LDH sharply decreased after administration of Ey-TFH (Figures 6B–D). This showed that Ey-TFH significantly inhibited the elevation of liver injury markers. In addition, ALP and γ-GT, which were recognized markers of chronic inflammation, dramatically decreased in Ey-TFH groups (Figures 6E,F). These dates suggested that Ey-TFH protected the liver and blocked inflammation progress at the onset of NAFLD.
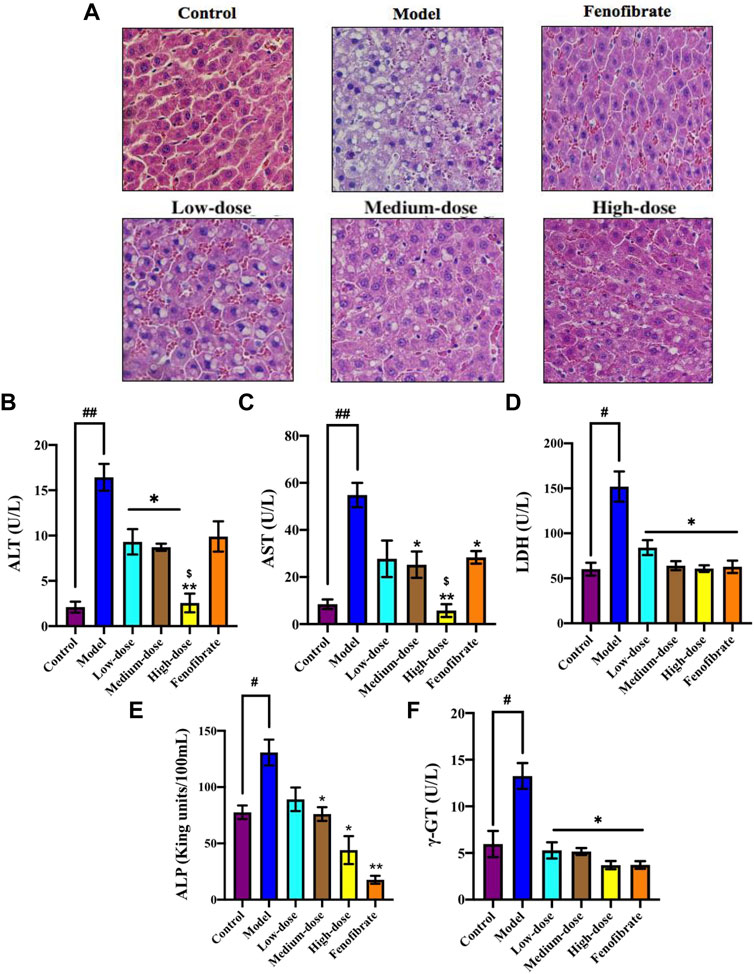
FIGURE 6. The protective effect of Ey-TFH on the liver. (A) HE staining. (B) ALT; (C) AST; (D) LDH; (E) ALP; (F) γ-GT. #p < 0.05, ##p < 0.01, compared with the control group; *p < 0.05, **p < 0.01, compared with the model group; $ p < 0.05, compared with the positive control group.
3.9 Ey-TFH Inhibit Lipid Peroxidation
After high-dose Ey-TFH administration, as shown in Figure 7, the activities of antioxidant enzymes, SOD, and GSH increased significantly. MDA contents, which represented the peroxidation levels of the membrane lipid, were reduced significantly by Ey-TFH intervention. The results clarified that Ey-TFH treatment could attenuate oxidative stress by reducing oxidative levels and promoting antioxidative processes.
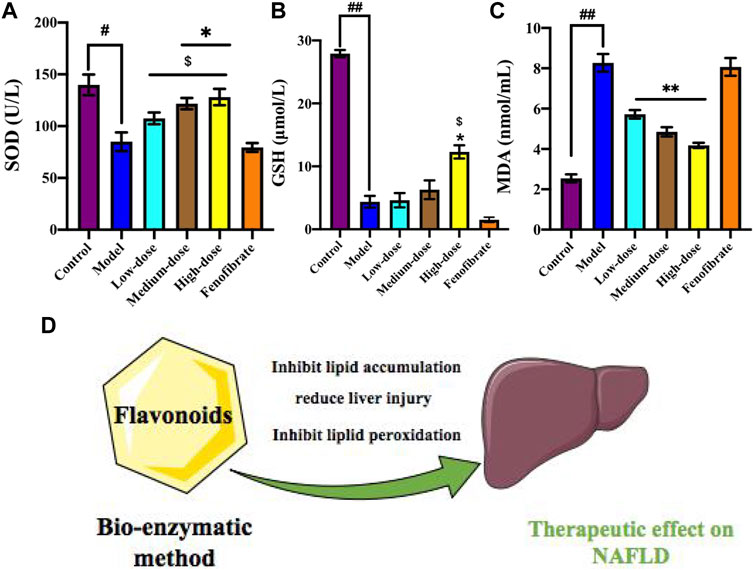
FIGURE 7. Ey-TFH inhibit lipid peroxidation. (A) SOD; (B) GSH; (C) MDA. (D) The therapeutic effect of Ey-TFH on NAFLD. #p < 0.05, ##p < 0.01, compared with the control group; *p < 0.05, **p < 0.01, compared with the model group; $ p < 0.05 compared with the positive control group.
4 Discussion
The total flavonoids, as important bio-active agents of Scleromitron diffusum (Willd.) R. J. Wang, possess high clinical medicinal value. The plant Scleromitron diffusum (Willd.) R. J.Wang belongs to the Rubiaceae family, so the total flavonoid yield of the plant was compared with other TCM plants from the Rubiaceae family, e.g., Uncaria rhynchophylla and Gardenia jasminoides Ellis. Our results in Table 2 found that Scleromitron diffusum (Willd.) R. J.Wang has a higher content of flavonoids than the other two plants, Uncaria rhynchophylla and Gardenia jasminoides Ellis (Lim and Lee, 2022 ; Shang et al., 2019). Moreover, flavonoids extracted by the bio-enzymatic method showed significant hepatoprotective activity both in vitro and in vivo. All these indicated that Scleromitron diffusum (Willd.) R. J.Wang may be a promising resource of flavonoids. It is also the reason why we chose Scleromitron diffusum (Willd.) R. J.Wang to study flavonoids. Thus it is necessary to explore the efficient extraction methods of flavonoids from Scleromitron diffusum (Willd.) R. J.Wang and more bio-actives should be detected. Various typical extraction processes such as water, microwave, and ultrasonic processed the total flavonoids. However, different extraction methods result in different contents and components of the total flavonoids. Research about the extraction methods mainly focuses on the extraction rate. Few studies focus on the differential flavonoid components obtained by different extraction methods. Research about the relationship between the differential components and bio-activity is also lacking. Therefore, a comprehensive method must be established to quantify the flavonoid content and screen out potential differential components. UPLC-MS/MS is a highly efficient and preferred technique for TCM (Nandan et al., 2021; Verma et al., 2021) and pharmacokinetics study (Chen et al., 2021; Zhang Z. et al., 2021; Lee et al., 2021; Wang et al., 2021; Zhang et al., 2022). In our study, the application combining UPLC-MS/MS and multivariate statistical methods was used to isolate and quantify flavonoids prepared by different methods, followed by differential components screened.
Compared with the traditional methods, using the bio-enzymatic method, cell walls were more gently and thoroughly destroyed by cellulase to promote the out-flow of intracellular flavonoids so that higher yields and more types of flavonoids could be harvested. That was consistent with our in vitro results. The cell results indicated that although Ey-TFH had no significant difference in total contents compared with TFH, Ey-TFH contained more active ingredients with good hepatoprotective effects, such as naringin (Li C. et al., 2020; Mu et al., 2020; Zhang R. et al., 2021; Zhao and Liu, 2021), vitexin (Inamdar et al., 2019; Duan et al., 2020; Yuan et al., 2020), and isovitexin (Hu et al., 2018). Thus, the flavonoids prepared by enzymatic extraction were more effective phytochemicals at protecting against H2O2-induced cellular injury. Furthermore, we found that Ey-TFH was efficient in rats. Ey-TFH treatment could inhibit HFD-induced weight gains and liver indexes, reduce lipid deposition, and improve the body’s antioxidant capacity. Collectively, we demonstrated that the total flavonoids extracted by the bio-enzymatic method could exert a beneficial effect on NAFLD. Improvement of antioxidant capacity may be the primary mechanism of NAFLD prevention by the total flavonoids. Hepatic steatosis is frequently accompanied by overwhelmed oxidative stress, a critical etiologic process of NAFLD. However, the underlying molecular mechanism of Ey-TFH hepatoprotective action is poorly understood, which will hopefully provide ideas for consecutive research.
In all, the combined application of UPLC-MS/MS and multivariate statistical methods guides the exploration of efficient and green extraction methods and offers valuable information on screening the bio-active compounds from TCM.
5 Conclusion
In the present work, a systematic method combining UPLC-MS/MS and multivariate statistical analyses was established to isolate and quantify the components of the total flavonoids from Scleromitron diffusum (Willd.) R. J. Wang, which were extracted by Luxembourg inventive bio-enzymatic method, reflux method, ultrasonic, and ultrasonic-assisted enzymatic method. Meanwhile, the differential components were also screened out. Compared with the other three methods, bio-enzymatic extraction could be more conducive to significantly increasing the contents of six flavonoids components (genistein, luteolin, luteolin-7-O-glucoside, naringin, isovitexin, vitexin) (p < 0.05 or p < 0.01) and only three active components (apigenin, chrysin, kaempferol) were obtained. In vitro experiment showed that the six differential components (apigenin, chrysin, genistein, isovitexin, naringin, vitexin) all had hepatoprotection. The protective rate of Ey-TFH on HL-02 cells was significantly higher than those of TFH at the same concentration (p < 0.05 or p < 0.01). At last, in vivo studies illustrated that Ey-TFH was an effective agent in NAFLD treatment. In conclusion, this study puts forward new ideas for extracting herb medicine and provides preliminary foundations for developing the total flavonoids prepared by Luxembourg inventive bio-enzymatic method as a promising agent for NAFLD treatment.
Data Availability Statement
The raw data supporting the conclusions of this article will be made available by the authors, without undue reservation.
Ethics Statement
The animal study was reviewed and approved by Experimental Animal Center of Shanxi Medical University, Taiyuan, China.
Author Contributions
YQ: Writing—original draft, conceptualization. YQ: writing—original draft, conceptualization. MZ and QL: resources, software, analysis. YL and CS: writing—review and editing, supervision. BZ: resources. HD: resources.
Funding
This work was supported by the National Natural Science Foundation of China (No. 81973411), Research Project Supported by Shanxi Scholarship Council of China (No. 2020-084), the Drug Innovation Major Project (No. 2018ZX09101003001-017), Shanxi Province Key Research and Development Project (No. 201703D 111033), the Project of Shanxi Key Laboratory for Innovative Drugs on Inflammation-based Major Disease “Anti-inflammatory Mechanism of Baihuadexhuangcao Flavone Baogan Capsule” (No. SXIDL-2018-05), Project of Center of Comprehensive Development, Utilization and Innovation of Shanxi Medicine (No. 2017-JYXT-18), Postgraduate Education Innovation Project of Shanxi Province (No. 2020SY235), Social Development Project of Science and Technology Department of Shaaxi Province (No. 2020SF-206), Project of Administration of Traditional Chinese Medicine of Shaaxi Province (No. 2021-ZZ-JC005), and the High Education Reform Project of Shanxi Province (No. J2020110).
Conflict of Interest
The authors declare that the research was conducted in the absence of any commercial or financial relationships that could be construed as a potential conflict of interest.
Publisher’s Note
All claims expressed in this article are solely those of the authors and do not necessarily represent those of their affiliated organizations, or those of the publisher, the editors and the reviewers. Any product that may be evaluated in this article, or claim that may be made by its manufacturer, is not guaranteed or endorsed by the publisher.
Supplementary Material
The Supplementary Material for this article can be found online at: https://www.frontiersin.org/articles/10.3389/fphar.2022.890148/full#supplementary-material
References
Bessone, F., Razori, M. V., and Roma, M. G. (2019). Molecular Pathways of Nonalcoholic Fatty Liver Disease Development and Progression. Cell. Mol. Life Sci. 76 (1), 99–128. doi:10.1007/s00018-018-2947-0
Buzzetti, E., Pinzani, M., and Tsochatzis, E. A. (2016). The Multiple-Hit Pathogenesis of Non-alcoholic Fatty Liver Disease (NAFLD). Metabolism 65 (8), 1038–1048. doi:10.1016/j.metabol.2015.12.012
Chen, C.-Y., Tsai, T.-Y., and Chen, B.-H. (2021). Effects of Black Garlic Extract and Nanoemulsion on the Deoxy Corticosterone Acetate-Salt Induced Hypertension and its Associated Mild Cognitive Impairment in Rats. Antioxidants 10 (10), 1611. doi:10.3390/antiox10101611
Chen, X., Zhao, B., Zhang, M., Dong, M., Li, Y., and Li, Q. (2020). Application of HPLC-Q/orbitrap MS in the Detection and Identification of Anticancer Constituents in Ethyl Acetate Components from Hedyotis Diffusa. Anal. Methods 12 (32), 4037–4047. doi:10.1039/d0ay00531b
Duan, S., Du, X., Chen, S., Liang, J., Huang, S., Hou, S., et al. (2020). Effect of Vitexin on Alleviating Liver Inflammation in a Dextran Sulfate Sodium (DSS)-induced Colitis Model. Biomed. Pharmacother. 121, 109683. doi:10.1016/j.biopha.2019.109683
Friedman, S. L., Neuschwander-Tetri, B. A., Rinella, M., and Sanyal, A. J. (2018). Mechanisms of NAFLD Development and Therapeutic Strategies. Nat. Med. 24 (7), 908–922. doi:10.1038/s41591-018-0104-9
Hu, J. J., Wang, H., Pan, C. W., and Lin, M. X. (2018). Isovitexin Alleviates Liver Injury Induced by Lipopolysaccharide/d-Galactosamine by Activating Nrf2 and Inhibiting NF-Κb Activation. Microb. Pathog. 119, 86–92. doi:10.1016/j.micpath.2018.03.053
Inamdar, S., Joshi, A., Malik, S., Boppana, R., and Ghaskadbi, S. (2019). Vitexin Alleviates Non-alcoholic Fatty Liver Disease by Activating AMPK in High Fat Diet Fed Mice. Biochem. Biophys. Res. Commun. 519 (1), 106–112. doi:10.1016/j.bbrc.2019.08.139
Lee, A., Yang, H., Kim, T., Ha, H., and Hwang, Y.-H. (2021). Identification and Pharmacokinetics of Bioavailable Anti-resorptive Phytochemicals after Oral Administration of Psoralea Corylifolia L. Biomed. Pharmacother. 144, 112300. doi:10.1016/j.biopha.2021.112300
Li, C., Chen, Y., Yuan, X., He, L., Li, X., Huang, S., et al. (2020b). Vitexin Ameliorates Chronic Stress Plub High Fat Diet-Induced Nonalcoholic Fatty Liver Disease by Inhibiting Inflammation. Eur. J. Pharmacol. 882, 173264. doi:10.1016/j.ejphar.2020.173264
Li, M., Hou, X. F., Zhang, J., Wang, S. C., Fu, Q., and He, L. C. (2011). Applications of HPLC/MS in the Analysis of Traditional Chinese Medicines. J. Pharm. Anal. 1 (2), 81–91. doi:10.1016/S2095-1779(11)70015-6
Li, Y. L., Chen, X., Niu, S. Q., Zhou, H. Y., and Li, Q. S. (2020a). Protective Antioxidant Effects of Amentoflavone and Total Flavonoids from Hedyotis Diffusa on H2 O2 -Induced HL-O2 Cells through ASK1/p38 MAPK Pathway. Chem. Biodivers. 17 (7), e2000251. doi:10.1002/cbdv.202000251
Li, Y. L., Zhang, J., Min, D., Hongyan, Z., Lin, N., Li, Q. S., et al. (2016). Anticancer Effects of 1,3-Dihydroxy-2-Methylanthraquinone and the Ethyl Acetate Fraction of Hedyotis Diffusa Willd against HepG2 Carcinoma Cells Mediated via ApoptosisSafety and Biological Activity Evaluation of Uncaria Rhynchophylla Ethanolic Extract. PloS oneDrug Chem. Toxicol. 1145 (42), e0151502907–918. doi:10.1371/journal.pone.0151502
Lim, H. B., and Lee, H. R. (2022). Safety and Biological Activity Evaluation of Uncaria rhynchophylla Ethanolic Extract. Drug Chem. Toxicol. 45 (2), 907–918. doi:10.1080/01480545.2020.1786581
Liu, J., Li, C., Ding, G., and Quan, W. (2021). Artificial Intelligence Assisted Ultrasonic Extraction of Total Flavonoids from Rosa Sterilis. Molecules 26 (13), 3835. doi:10.3390/molecules26133835
Liu, X. X., Agudamu, A., Zhang, X., Wei, Y., Song, X., and Li, Y. L. (2016). Pharmacology of a Traditional Chinese Herb, Shuangren-Anshen Capsule, in a Hemorrhage Mouse Model by Using an Orthogonal Array Design. Genet. Mol. Res. 15 (3), undefined. doi:10.4238/gmr.1503880610.4238/gmr.15038806
Martín-García, B., Razola-Díaz, M. d. C., Gómez-Caravaca, A. M., Benítez, G., and Verardo, V. (2021). Setup of an Ultrasonic-Assisted Extraction to Obtain High Phenolic Recovery in Crataegus Monogyna Leaves. Molecules 26 (15), 4536. doi:10.3390/molecules26154536
Mechchate, H., Es-Safi, I., Bourhia, M., Kyrylchuk, A., El Moussaoui, A., Conte, R., et al. (2020). In-Vivo Antidiabetic Activity and In-Silico Mode of Action of LC/MS-MS Identified Flavonoids in Oleaster Leaves. Molecules 25 (21), 5073. doi:10.3390/molecules25215073
Mu, H., Zhou, Q., Yang, R., Zeng, J., Li, X., Zhang, R., et al. (2020). Naringin Attenuates High Fat Diet Induced Non-alcoholic Fatty Liver Disease and Gut Bacterial Dysbiosis in Mice. Front. Microbiol. 11, 585066. doi:10.3389/fmicb.2020.585066
Nadar, S. S., Rao, P., and Rathod, V. K. (2018). Enzyme Assisted Extraction of Biomolecules as an Approach to Novel Extraction Technology: A Review. Food Res. Int. 108, 309–330. doi:10.1016/j.foodres.2018.03.006
Nandan, S., Singh, S. K., Singh, P., Bajpai, V., Mishra, A. K., Joshi, T., et al. (2021). Quantitative Analysis of Bioactive Carbazole Alkaloids in Murraya Koenigii (L.) from Six Different Climatic Zones of India Using UPLC/MS/MS and Their Principal Component Analysis. Chem. Biodivers. 18 (12), e2100557. doi:10.1002/cbdv.202100557
Ninfali, P., Antonelli, A., Magnani, M., and Scarpa, E. S. (2020). Antiviral Properties of Flavonoids and Delivery Strategies. Nutrients 12 (9), 2534. doi:10.3390/nu12092534
Rezende, Y. R. R. S., Nogueira, J. P., Silva, T. O. M., Barros, R. G. C., Oliveira, C. S. d., Cunha, G. C., et al. (2021). Enzymatic and Ultrasonic-Assisted Pretreatment in the Extraction of Bioactive Compounds from Monguba (Pachira Aquatic Aubl) Leaf, Bark and Seed. Food Res. Int. 140, 109869. doi:10.1016/j.foodres.2020.109869
Serafim, C., Araruna, M. E., Júnior, E. A., Diniz, M., Hiruma-Lima, C., and Batista, L. (2020). A Review of the Role of Flavonoids in Peptic Ulcer (2010-2020). Molecules 25 (22), 5431. doi:10.3390/molecules25225431
Shang, Y. F., Zhang, Y. G., Cao, H., Ma, Y. L., and Wei, Z. J. (2019). Comparative Study of Chemical Compositions and Antioxidant Activities of Zhizi Fruit Extracts from Different Regions. Heliyon 5 (12), e02853. doi:10.1016/j.heliyon.2019.e02853
Shi, G., Shen, J., Wei, T., Ren, F., Guo, F., and Zhou, Y. (2021). UPLC-ESI-MS/MS Analysis and Evaluation of Antioxidant Activity of Total Flavonoid Extract from Paeonia Lactiflora Seed Peel and Optimization by Response Surface Methodology (RSM). Biomed. Res. Int. 2021, 7304107. doi:10.1155/2021/7304107
Tsai, C. F., Chen, G. W., Chen, Y. C., Shen, C. K., Lu, D. Y., Yang, L. Y., et al. (2021). Regulatory Effects of Quercetin on M1/M2 Macrophage Polarization and Oxidative/Antioxidative Balance. Nutrients 14 (1), 67. doi:10.3390/nu14010067
Verma, S., Salminen, J. P., Taube, F., and Malisch, C. S. (2021). Large Inter- and Intraspecies Variability of Polyphenols and Proanthocyanidins in Eight Temperate Forage Species Indicates Potential for Their Exploitation as Nutraceuticals. J. Agric. Food Chem. 69 (42), 12445–12455. doi:10.1021/acs.jafc.1c03898
Wang, M. J., Zhao, Y. H., Fan, C., Wang, Y. J., Wang, X. Q., Qiu, X. J., et al. (2021). Development of an UPLC-MS/MS Method for the Quantitative Analysis of Upadacitinib in Beagle Dog Plasma and Pharmacokinetics Study. Drug Des. Devel Ther. 15, 4167–4175. doi:10.2147/DDDT.S332282
Wiley, M. B., Perez, P. A., Argueta, D. A., Avalos, B., Wood, C. P., and DiPatrizio, N. V. (2021). UPLC-MS/MS Method for Analysis of Endocannabinoid and Related Lipid Metabolism in Mouse Mucosal Tissue. Front. Physiol. 12, 699712. doi:10.3389/fphys.2021.699712
Yuan, H., Duan, S., Guan, T., Yuan, X., Lin, J., Hou, S., et al. (2020). Vitexin Protects against Ethanol-Induced Liver Injury through Sirt1/p53 Signaling Pathway. Eur. J. Pharmacol. 873, 173007. doi:10.1016/j.ejphar.2020.173007
Zhang, C., Wang, Z., Liu, S., Tan, H., Zeng, D., and Li, X. (2022). Analytical Method for Sequential Determination of Persistent Herbicides and Their Metabolites in Fish Tissues by UPLC-MS/MS. Chemosphere 288 (Pt 2), 132591. doi:10.1016/j.chemosphere.2021.132591
Zhang, R., Ma, C., Wei, Y., Wang, X., Jia, J., Li, J., et al. (2021a). Isolation, Purification, Structural Characteristics, Pharmacological Activities, and Combined Action of Hedyotis Diffusa Polysaccharides: A Review. Int. J. Biol. Macromol. 183, 119–131. doi:10.1016/j.ijbiomac.2021.04.139
Zhang, X., Zhang, Y., Gao, W., Guo, Z., Wang, K., Liu, S., et al. (2021b). Naringin Improves Lipid Metabolism in a Tissue-Engineered Liver Model of NAFLD and the Underlying Mechanisms. Life Sci. 277, 119487. doi:10.1016/j.lfs.2021.119487
Zhang, Z., Guo, S., Chen, C., Lin, J., Chen, L., Wang, D., et al. (2021c). Optimization of Extraction and Bioactivity Detection of Celery Leaf Flavonoids Using BP Neural Network Combined with Genetic Algorithm and Response. Prep. Biochem. Biotechnol. 1–9, 1–9. doi:10.1080/10826068.2021.1983832
Zhao, X., Chen, R., Shi, Y., Zhang, X., Tian, C., and Xia, D. (2020). Antioxidant and Anti-inflammatory Activities of Six Flavonoids from Smilax Glabra Roxb. Molecules 25 (22), 5295. doi:10.3390/molecules25225295
Zhao, Y., and Liu, S. (2021). Bioactivity of Naringin and Related Mechanisms. Pharmazie 76 (8), 359–363. doi:10.1691/ph.2021.1504
Keywords: Scleromitron diffusum (Willd.) R. J. Wang, flavonoids, the bio-enzymatic method, UPLC-MS/MS, multivariate statistical analysis, hepatoprotective
Citation: Qin Y, Zhao B, Deng H, Zhang M, Qiao Y, Liu Q, Shi C and Li Y (2022) Isolation and Quantification of the Hepatoprotective Flavonoids From Scleromitron diffusum (Willd.) R. J. Wang With Bio-Enzymatic Method Against NAFLD by UPLC–MS/MS. Front. Pharmacol. 13:890148. doi: 10.3389/fphar.2022.890148
Received: 05 March 2022; Accepted: 25 April 2022;
Published: 13 June 2022.
Edited by:
Francislaine Aparecida Dos Reis Lívero, Universidade Paranaense, BrazilReviewed by:
Mohamed L. Ashour, Ain Shams University, EgyptXu-Dong Zhou, Hunan University of Chinese Medicine, China
Copyright © 2022 Qin, Zhao, Deng, Zhang, Qiao, Liu, Shi and Li. This is an open-access article distributed under the terms of the Creative Commons Attribution License (CC BY). The use, distribution or reproduction in other forums is permitted, provided the original author(s) and the copyright owner(s) are credited and that the original publication in this journal is cited, in accordance with accepted academic practice. No use, distribution or reproduction is permitted which does not comply with these terms.
*Correspondence: Chuandao Shi, c2NkMTIxNUBzbnRjbS5lZHUuY24=; Yunlan Li, bGl5dW5sYW5yckAxNjMuY29t
†These authors have contributed equally to this work and share first authorship
 Yuxi Qin
 Baojin Zhao2

