 Meisha Mandal1Josh Levy2Cataia Ives1Stephen Hwang1Yi-Hui Zhou3,4Alison Motsinger-Reif5Huaqin Pan1Wayne Huggins1Carol Hamilton1Fred Wright3,4Stephen Edwards1*
- 1GenOmics, Bioinformatics, and Translational Research Center, RTI International, Research Triangle Park, NC, United States.
- 2Levy Informatics, Chapel Hill, NC, United States
- 3Department of Statistics, North Carolina State University, Raleigh, NC, United States
- 4Bioinformatics Research Center and Department of Biological Sciences, North Carolina State University, Raleigh, NC, United States
- 5Biostatistics and Computational Biology Branch, National Institute of Environmental Health Sciences, Durham, NC, United States
The need to test chemicals in a timely and cost-effective manner has driven the development of new alternative methods (NAMs) that utilize in silico and in vitro approaches for toxicity prediction. There is a wealth of existing data from human studies that can aid in understanding the ability of NAMs to support chemical safety assessment. This study aims to streamline the integration of data from existing human cohorts by programmatically identifying related variables within each study. Study variables from the Atherosclerosis Risk in Communities (ARIC) study were clustered based on their correlation within the study. The quality of the clusters was evaluated via a combination of manual review and natural language processing (NLP). We identified 391 clusters including 3,285 variables. Manual review of the clusters containing more than one variable determined that human reviewers considered 95% of the clusters related to some degree. To evaluate potential bias in the human reviewers, clusters were also scored via NLP, which showed a high concordance with the human classification. Clusters were further consolidated into cluster groups using the Louvain community finding algorithm. Manual review of the cluster groups confirmed that clusters within a group were more related than clusters from different groups. Our data-driven approach can facilitate data harmonization and curation efforts by providing human annotators with groups of related variables reflecting the themes present in the data. Reviewing groups of related variables should increase efficiency of the human review, and the number of variables reviewed can be reduced by focusing curator attention on variable groups whose theme is relevant for the topic being studied.
1 Introduction
The past 2 decades have seen a transition away from toxicity testing using laboratory animals to new alternative methods (NAMs) that rely on computational predictions or in vitro assays. These new methods have the advantage of being able to screen many more chemicals at a highly reduced cost while simultaneously reducing animal suffering. When being used to support human health risk assessment, these approaches can have the added benefit of using human cells or computational models built using human parameters to avoid the need for species extrapolation (Krewski et al., 2010). However, these advantages are lost if the NAMs are evaluated using the traditional animal toxicity predictions as the gold standard (Interagency Coordinating Committee on the Validation of Alternative Methods, 2018; Piersma et al., 2018; Ly Pham et al., 2020). There is a need to pivot towards an evaluation paradigm that uses data on adverse outcomes in humans for evaluating toxicity predictions in order to fully realize the vision of toxicity testing in the twenty first century (Krewski et al., 2010).
In 2010, the adverse outcome pathway (AOP) was proposed as a framework for interpreting the outputs from NAMs (Ankley et al., 2010). With support from the Organisation for Economic Co-operation and Development (OECD), this framework has supported a wide array of applications for integrating and translating toxicity predictions from NAMs (Cote et al., 2016; Schultz et al., 2016; Wittwehr et al., 2017; Ankley and Edwards, 2018a; Watford et al., 2019a; Spinu et al., 2020; Goyak and Lewis, 2021). While most applications to date have focused on integrating data from in vitro assays and laboratory animals, the process for incorporating human data would be equivalent. By incorporating the human data into the AOP framework, we can then use the human data as our gold standard. This avoids potential complications that arise from using data from laboratory animals as the gold standard when those endpoints are an imperfect indicator of the actual outcome of interest in the target population.
Over the last few decades, vast amounts of human data have been collected for clinical and research purposes. Resources such as the database of Genotypes and Phenotypes (dbGaP) (Mailman et al., 2007), United Kingdom Biobank (Sudlow et al., 2015), All of Us (All of Us Research Program Investigators et al., 2019), and CHEAR/HHEAR databases (Balshaw et al., 2017) have been developed to archive and facilitate sharing/distribution of these data. The combination of large cohorts from these studies offers the potential of data pooling and meta-analysis possessing sizable statistical power. Meta-analysis and pooling of data from multiple studies create value well beyond that of the original research by increasing data reproducibility and robustness. Additionally, data pooling increases the sample size, which has a multitude of benefits including increased statistical power and potential to support increasingly complex analysis models. However, this requires significant data harmonization, which can be labor intensive. Curation of data to adhere to FAIR principles (Findable, Accessible, Interoperable, Reusable) (Wilkinson et al., 2016) is also a labor-intensive process which requires each variable to be reviewed and curated.
Previous harmonization efforts, such as the mapping of PhenX variables to the dbGaP and LOINC vocabulary (Pan et al., 2012), the establishment of a shared measurement framework for ECHO (Blackwell et al., 2018), the development of the Semantic Data Dictionary (Rashid et al., 2020), the phenotype harmonization system developed by the TOPMed program (Stilp et al., 2021), and the HHEAR resource model (Viet et al., 2021) have been successful and increased the potential for cross-study and transdisciplinary analysis. However, as acknowledged by the authors of many of these studies, manual data harmonization is a laborious, time-consuming, and not easily scalable process. As this is a problem common to many data harmonization and curation efforts, developing an automated method to assist in this process would reduce the amount of labor involved and thereby encourage researchers to undertake these valuable efforts. For example, consider the impact of automation on the Cure Sickle Cell Initiative (CureSCi) MetaData Catalog (MDC) (Pan et al., 2021). The CureSCi MDC is an effort to make Sickle Cell Disease (SCD) study datasets more Findable in accordance with FAIR principles. The development of the CureSCi MDC involved manual curation of data into a three-tiered conceptual framework consisting of category, subcategory, and data elements. Having variables programmatically grouped into multiple tiers of related variables would significantly expedite this manual curation process.
The objective of this study is to develop a data-driven method to cluster related variables and further assemble those clusters into higher-order groups and topics, which can support data harmonization and curation efforts. This would provide a tiered organizational structure analogous to the one used in development of the CureSCi MDC with variables serving as potential data elements, clusters as potential subcategories, and cluster groups as potential categories, which could then be used as the starting point for the manual curation. To accomplish this, we performed a large-scale correlation analysis and arranged variables into a multi-tier organizational structure consisting of variables, variable clusters, cluster groups and topics. Our analysis focused on assembling the variables from a single study to demonstrate that biologically meaningful groups of variables can be assembled programmatically. The next logical step would be to apply this method across multiple studies and demonstrate the value for supporting data harmonization.
2 Materials and Methods
2.1 ARIC Variable Correlation, Filtering, and Clustering
2.1.1 Correlation Analysis
The Atherosclerosis Risk in Communities (ARIC) Study (N = 15,792) (The Atherosclerosis Risk in Communities Study, 1989) is a large-scale, prospective study investigating cardiovascular health in African Americans that has been tracking participants since 1987 and is still ongoing. The goal of the ARIC study is to investigate the causes and risk factors of cardiovascular disease (CVD), atherosclerosis, and stroke as well as the connections between cardiovascular and cognitive health. Data from the ARIC study were obtained through the BioLINCC data repository (Giffen et al., 2015).
A correlation analysis was done on 14,425 phenotype-associated variables from the ARIC study (Figure 1). For this proof-of-concept study, the Pearson correlation was used for all variables. Future work will evaluate additional correlation methods and goodness of fit tests to account for variables with skewed distributions and non-linear relationships between variables. The analysis included the following: 1) calculating pairwise partial correlations using age and sex as covariates; 2) removing pairs where the absolute value of correlation was less than 0.5 3) merging redundant variables (e.g., equivalent variables measured at different time points); 4) employing a simple empirical Bayes shrinkage model to account for varying effect sizes and to estimate the “true” trait-trait correlations (see Section 2.1.2); 5) removing variables with prolific correlations (mean number of correlations per variable = 164) and age-related variables; 7) limiting correlations to those based on a sample size of at least 500 subjects. We removed variables with prolific correlations, such as age, because they are not useful for extracting meaningful relationships among variables due to their high number of correlations. This process resulted in 19,174 correlations including 3,285 variables. The resulting filtered correlation matrix was converted to a network graph with edge weights between two variables given by the absolute value of the partial correlation between the variables. Clusters of variables were defined by removing edges with a weight of less than 0.7 and identifying the connected subgraphs within the resulting network. This resulted in 391 variable clusters. Clusters corresponding to the connected subgraphs within the network were then evaluated as described below.
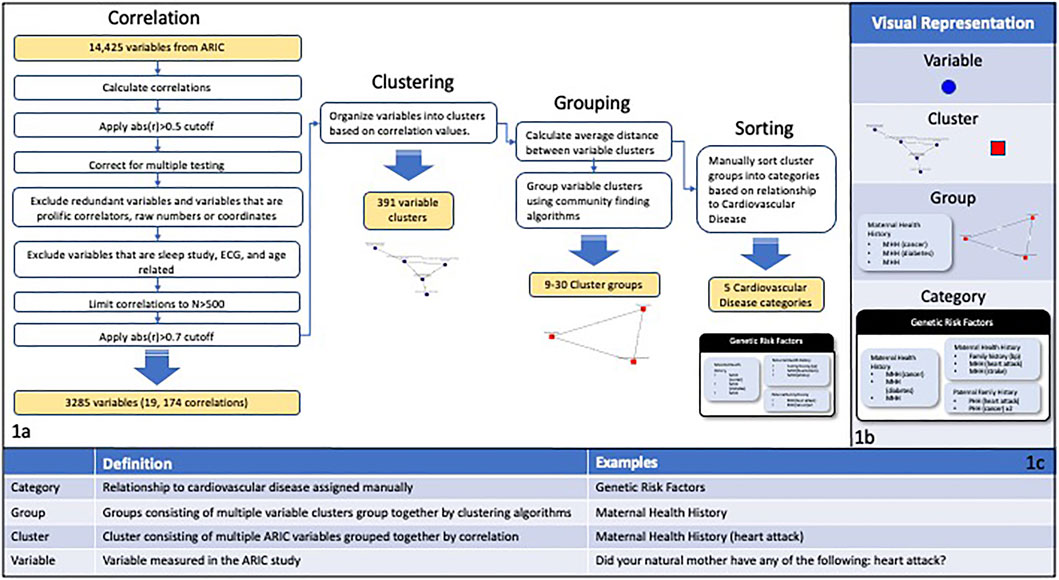
FIGURE 1. (A) Depicts the correlation, filtering, and clustering process applied to the 14,425 variables in the ARIC study. The variable correlations were calculated and then multiple filtering steps were performed including filtering by cutoff and N values, correcting for multiple testing, and excluding specific categories of variables. The variables were organized into clusters of interconnected nodes based on the filtered correlation values, resulting in 391 variable clusters. The average distance between variable clusters was calculated and clusters were grouped using community finding algorithms. The cluster groups were manually sorted into categories based on the main goals of the ARIC study. (B) Visual representations of the different levels of organization used in this study. (C) A chart showing definitions and examples for the different levels of organization used in this study.
2.1.2 An Empirical Bayes Shrinkage Correlation Estimate
A common feature in the data is that correlation estimates for different pairs of variables may be based on substantially different sample sizes, creating difficulties in comparisons across variable pairs. One solution is to use the variability in estimated correlations to devise appropriate shrinkage factors, which would aggressively shrink correlations based on few observations. For the ith Pearson correlation ri based on an observed (non-missing) sample size ni, an estimate of the sampling variance is vi=(1-ri2)2/ ni, and r and v the vectors of these values across all variable pairs. The quantity τ2 = max (0,var(r)-mean(v)) is an estimate of the underlying variance of true correlations ρ, and μ = mean(r) an estimate of the true average ρ. For each pairwise correlation, the quantity rshrunk,i=(τ2/(τ2 + vi))(ri-μ)+μ is the best linear predictor (McCulloch and Searle, 2004) for the true correlation ρi, shrinking correlations based on small samples more than those based on large samples.
2.2 Cluster Evaluation
Clusters were manually evaluated by a team of 3 reviewers and categorized as “exact,” “highly related,” “related,” and “unrelated”. Following the initial review, a single independent reviewer evaluated all clusters and adjusted categories in consultation with the initial reviewers to increase consistency. Ratings were based on the degree of correlation expected among the variables, as determined by the human reviewers (Table 1).
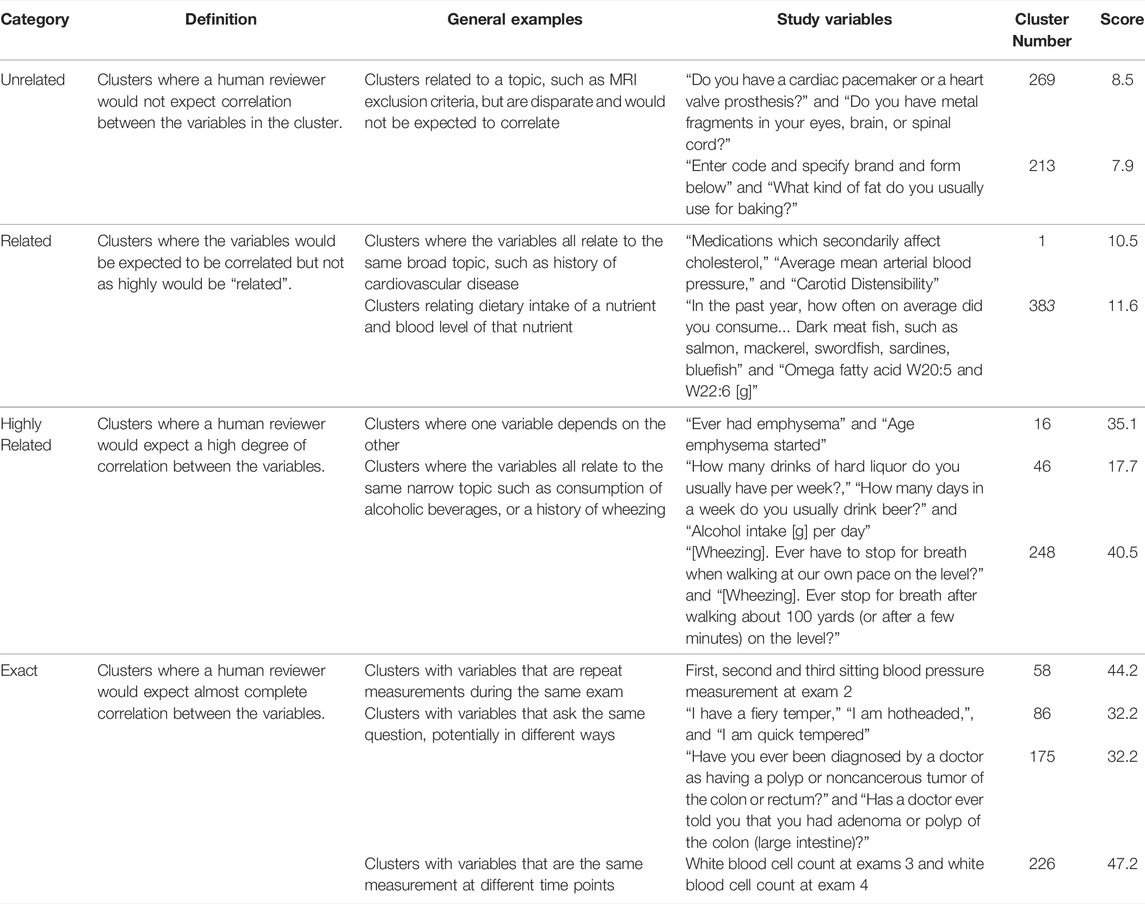
TABLE 1. Examples of human and programmatic evaluation of variable clusters. The table includes the relatedness category from manual review (Category), working definition of the category used by reviewers (Definition), examples of types of relationships in the category (General Examples), examples of ARIC variables that fit each relationship type (Study Variables), a cluster identifier (Cluster Number), and calculated relatedness score from the NLP analysis (Score). The scoring process is described in further detail in the methods section. Examples were selected to demonstrate different types of variable relationships that exist among ARIC variables and the associated relatedness category. See Supplemental Table S1 for all clusters.
Clusters were also scored programmatically for relatedness using Natural language processing (NLP) tools available in the Python Natural Language Toolkit package (Bird et al., 2009). We processed the variable text using lemmatization, customized stop word removal, and regular expression (regex) substitution to increase standardization. We then mapped the processed variables to the MESH (Coletti and Bleich, 2001), STO (Habibi-Koolaee et al., 2021), and SNOMED (Stearns et al., 2001) biomedical ontologies and controlled vocabularies using Bioportal (Whetzel et al., 2011). The mapping included obtaining direct annotations and ancestors up to 3 levels above. Next, we processed the variable text and annotation results using NLP tokenization and stemming to facilitate comparison between variables. This resulted in a list of processed variable terms (variable term list) and a list of processed annotation terms (annotation term list) for each variable. We performed a pairwise comparison of variables, calculating the percentage overlap (number of common words/total number of words) between terms on the variable term list and terms on the annotation term list for each pair of variables. The overall score for a cluster was the mean overlap of variable terms and annotation terms for all variable pairs in the cluster.
2.3 Cluster Grouping and Sorting
A graphical representation considering variable clusters as nodes and inter-cluster distances as edges was used to group clusters. The overall distance between two clusters was defined as the mean value of the inter-cluster edges between all variables in the two clusters. When feasible, each cluster was labeled with a common theme, such as “cough” or “maternal health history.”
Variable clusters were then split into cluster groups using community finding algorithms. In order to select the algorithm that best fit our task, we tried several different community-finding algorithms from Python 3.9’s python-louvain package (v0.14) and NetworkX package (v2.4) using default parameters except when it is stated. This includes the Louvain, Asynchronous label-propagation (LPA), Asynchronous Fluid Communities (number of communities = 15), Greedy Modularity Communities, Girvan-Newman, and K-clique (minimum clique size = 3) algorithms. Prior to running the algorithm, the graph edges connecting clusters were pruned based on the edge weights to a threshold of 0.08–0.25 to facilitate the community finding process. Clusters related to retinal exams or sleep studies, as well as Minnesota code data, administrative data, insurance data, specimen collection and processing data, and quality data were excluded from the community finding process as they were unlikely to be informative regarding mechanisms of disease and were prolific correlators due to the nature of the variables. We ultimately selected the Louvain algorithm as our community-finding algorithm because it formed the largest number of highly coherent cluster groups. The final cluster groups in Supplemental Table S2 were defined based on python-louvain’s best_partition () function (default parameters) which uses the Louvain community finding algorithm. Given the proof-of-concept nature of this work, we only tested a limited subset of existing community finding algorithms. Future work could focus on fine-tuning the community finding component of our workflow.
When plotting a single cluster group, edges below a set viewing threshold value ranging from 0.03–0.15 were removed to enhance the plot’s readability (Figure 4). When plotting multiple cluster groups together such as in Figure 5, the threshold used to create the cluster groups (ranging from 0.08–0.25) became the lower-limit for intra-cluster edges and the threshold for inter-cluster edges was set at 0.05 (Figure 5). Edges with weights below the relevant threshold were removed prior to plotting.
Lastly, to summarize the study data, we manually assigned theme-based labels and organized cluster groups into topics based on the ARIC study goals (lifestyle/environmental risk factors, genetic risk factors, medical care, clinical outcomes, and co-morbidities).
3 Results
3.1 Atherosclerosis Risk in Communities Variable Clusters
Clustering ARIC variables based on the partial correlations resulted in 3,285 variables organized into 391 clusters, referred to as variable clusters, containing between 2 and 634 ARIC variables with 385/391 (98.5%) containing <100 variables (Figure 1). Out of the original 3,285 variables, 28 (0.85%) did not cluster with any other variables. We were able to ascribe a central topic to 384/391 (98.2%) clusters. The degree of relatedness varied widely as discussed below; however, reviewers ascribed some degree of relatedness to 95.1% of applicable clusters in a manual scoring process.
The correlation analysis successfully grouped variables with common themes together. Variable cluster themes included varying aspects of personal health history, family health history, substance use history, dietary intake, and clinical test results. Health history clusters often pertained to specific symptoms or disorders such as history of asthma, history of cardiac surgery, history of high blood pressure. Family health history had similar topics focused on maternal or paternal history (e.g., paternal history of high blood pressure, maternal history of heart attack, and family history of diabetes). Clinical clusters included blood pressure, lipid panel results, and cardiac ultrasound. The cluster themes had varying degrees of breadth. Some were narrow, such as multiple variables capturing marital status, and some were broader, such as a cardiovascular theme that included stroke, heart attack and coronary heart disease.
Inspection of the correlations within the identified clusters reaffirmed known relationships. For example, cluster 7 linked education level, occupation, and level of physical activity at work, and cluster 59 linked a history of stroke with quintessential stroke symptoms (speech/vision problems, dizziness) (Supplemental Table S1). The clustering also matched survey questions focused on human behavior with the corresponding clinical measurements from the subjects. For example, cluster 33 included dietary intake and measured nutrient levels such as variables related to carrot consumption, Vitamin A levels, and carotenoid levels (Supplemental Table S1). While the connection is driven by an underlying biological process (uptake of vitamin A and carotenoids), the variables themselves are dissimilar. Two are measurements of the blood level of nutrients and the third is a dietary intake survey. This was also observed with fish consumption combined with omega3 fatty acid levels and calcium consumption, selenium consumption, and vitamin C consumption linked to their respective blood level measurements.
In Figure 2A, a strong positive correlation (0.99) was observed between “Did your natural mother ever have any of the following diseases? Heart attack?” and “New maternal history of heart disease,” as anticipated. Respondents answering yes to having a maternal history of heart disease have a considerably higher chance of having a mother who has had a heart attack than respondents answering no. A strong negative correlation between the former variables (−0.86 and −0.78 respectively) and “How old was she [your mother] when she was first told she had: heart attack” was also observed as expected. In fact, this was the case for all categorical variables connected to the continuous age variable in Figure 2A. This is likely because a heart attack at a young age is more prevalent in families with a history of heart disease. This example highlights why the absolute value of the correlation was used during the correlation and clustering process. Strong negative correlations are equally likely to show a meaningful association between two variables as are strong positive correlations.
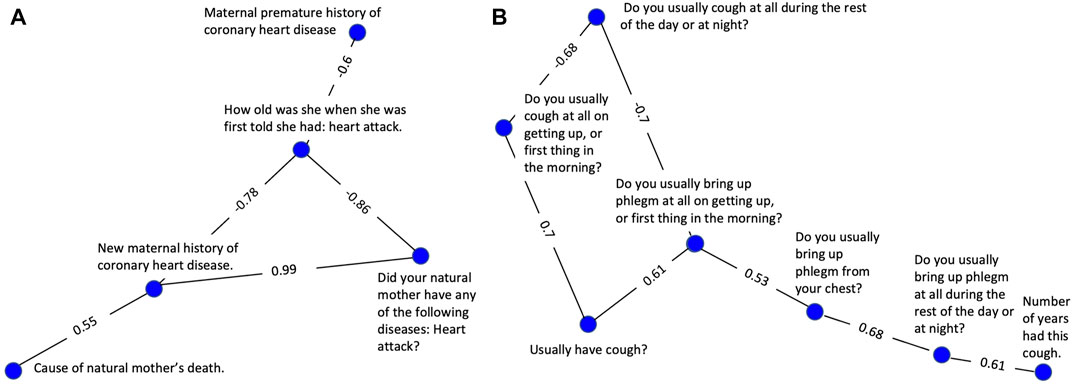
FIGURE 2. Clusters selected to demonstrate successful clustering by the variable correlation analysis. (A) A cluster of variables related to maternal history of heart disease. (B) A cluster of variables related to coughing symptoms, frequency, and duration.
The cluster represented in Figure 2B consists of 7 highly correlated variables related to the nature and severity of the subject’s cough. A set of 3 variables related to frequency are tightly linked, having edge values from 0.68–0.70. A second set of 3 variables evaluating cough-associated phlegm production were also tightly linked with edge values from 0.53—0.68. An additional variable related to duration was also tightly connected to the group with an edge value of 0.61.
3.2 Evaluation of Variable Clusters
We evaluated the clusters using both manual review and NLP of the variable text. Both metrics indicated that the correlation analysis was successful at clustering related variables (Figure 3). The manual evaluation process involved human reviewers categorizing the clusters as Exact, Highly Related, Related, Unrelated or NA (Table 1). In addition to the 391 clusters, 28 out of the 3,285 ARIC variables didn’t cluster with any other variables. Of the 391 clusters, 95.1% were determined by the reviewer to have some degree of relatedness and were classified as Exact, Highly Related, or Related. Only 4.6% were classified as Unrelated (Figure 3B). Examples of clusters in the different relatedness categories can be seen in Table 1. Related clusters contained variables that are loosely related such as variables related to cholesterol, blood pressure, and atherosclerosis. Highly related clusters typically contain orthogonal assays or survey questions that focus on a single endpoint such as how many drinks a person consumes per day or per week combined with how many days a week does the person drink. Exact clusters contain variables such as the same measurement at different time points or survey questions that differ mainly in the terminology used such as being hotheaded vs. having a fiery temper.
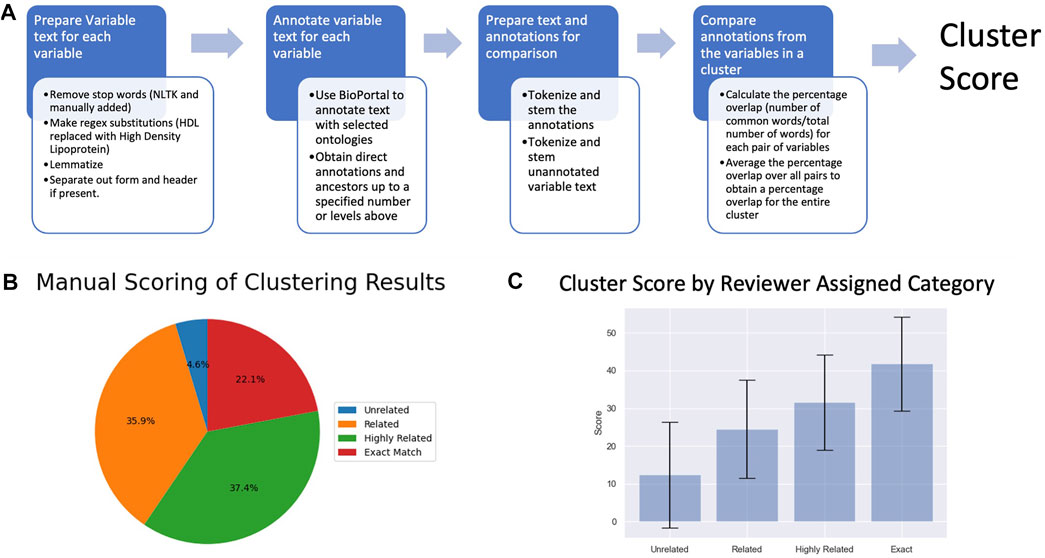
FIGURE 3. (A) A depiction of the NLP-based cluster scoring process. (B) Pie chart of the manual scoring of the 391 variable clusters (C) Plot of cluster scores for clusters in the different relatedness categories.
Clusters were scored programmatically for relatedness using NLP to compare the text description of the variables. The average score for each category increased by approximately 10 points with increasing relatedness (Figure 3C), corroborating the results from the manual evaluation. A Kruskal-Wallis test found a significant difference in mean between scores for clusters in the different relatedness categories (pvalue = 1.80e-18) further supporting the hypothesis that the calculated relatedness scores reflect the reviewer-assigned categories. Most major discrepancies between the automated scores and human categories occur due to variation in the terminology or phrasing used to convey the same concept. Subtle differences in terminology between variable descriptions which don’t impact a human reviewer’s interpretation (e.g, the presence of a hyphen) can lead to disparate ontology annotations in certain cases.
Clusters 67, 14, and 341 (Table 2) which are related to chronic lung diseases, asthma, and coughing/wheezing respectively, have scores which are congruous with their manual classification. Cluster 67 variables are the same question on different intake forms, cluster 14 variables pertain to different aspects (ever had, age started/stopped, etc.) of the same diagnosis (asthma). Cluster 341 variables encompass symptoms (wheezing/coughing) which are clearly, albeit more loosely, related. Cluster 213 variables are related to diet, specifically baking, but would not be expected to correlate, and thus the cluster was ranked as unrelated.
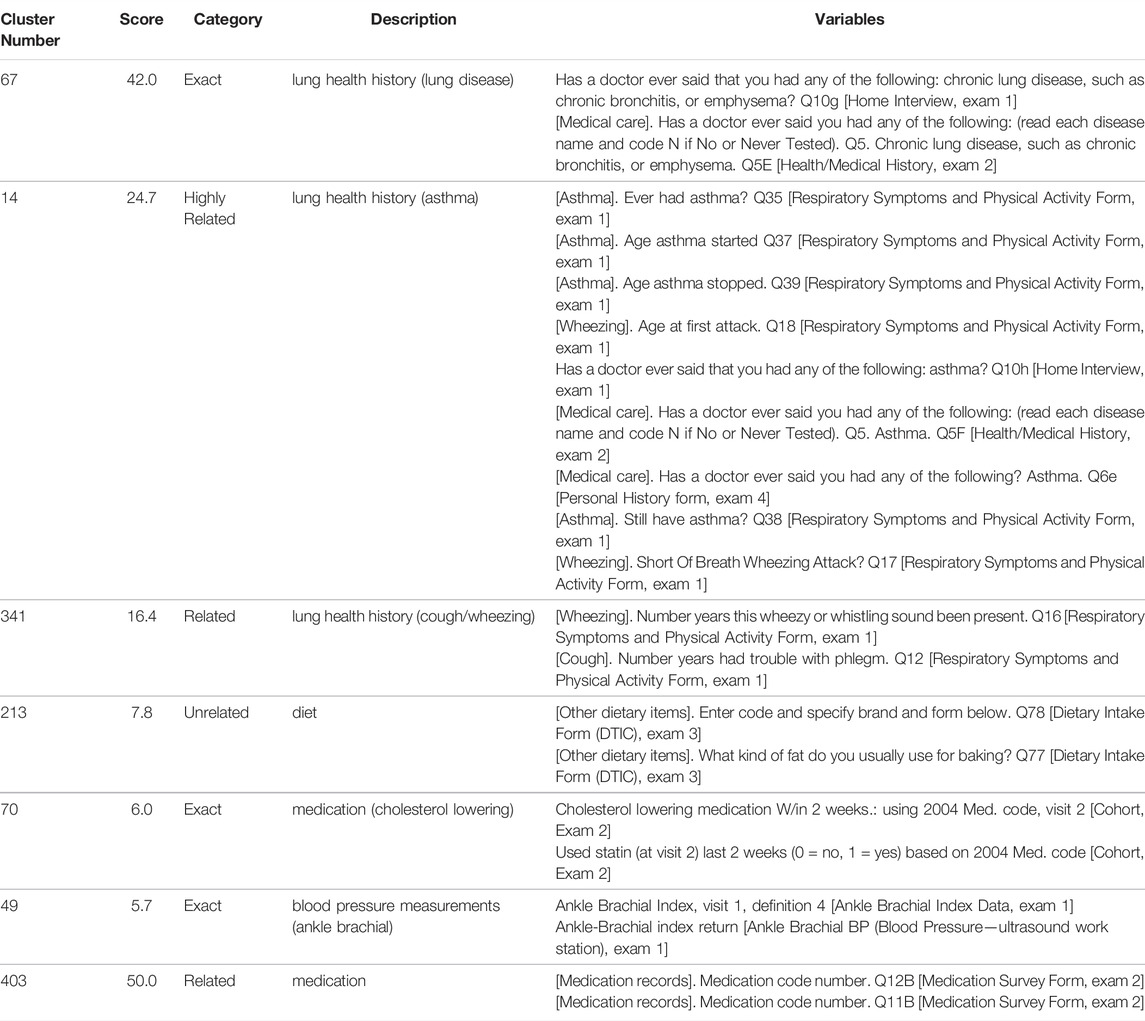
TABLE 2. Examples of clusters which both reflect (67, 14, 341, 213) and do not reflect (70, 49, 403) their programmatically generated scores. The table includes a cluster identifier (Cluster Number), calculated relatedness score from the NLP analysis (Score), relatedness category from manual review (Category), description of the overarching theme of the cluster (Description), and the ARIC variables in the cluster (Variables). Clusters were selected to highlight cases of agreement and disagreement between programmatic scoring and reviewer category assignment. See Supplemental Table S1 for all clusters.
There are also instances where a cluster’s classification and score are incongruous (Table 2). For example, although the cluster 70 variables ask the same question, the scoring algorithm does not recognize the close relationship as the specific wording differs. The phrase “cholesterol lowering medication” does not annotate as a single concept, it is split up into 3 separate concepts whereas “statin” encompasses the entire concept and annotates as “antihyperlipidemic agent” with a parent concept of “Treatment of ischemic stroke” resulting in minimal overlap in the ontology annotations, even including ancestors. Similarly, the discordance between the score (low) and category (Exact) for cluster 49 is likely also due to wording as “ankle brachial index” and “ankle-brachial index” annotate differently. There are also cases where the wording is similar, but the answers would not necessarily be highly related. For example, cluster 403 contains codes for different medications taken by the subject and is ranked as Related. Although the medications may be prescribed for the same or related health issues, they may also be completely unrelated. The wording of the variable, however, is identical except for the question number (“Medication code number. Q12B” and “Medication code number. Q11B”), resulting in a high score.
3.3 Grouping Clusters
Communities within the network of clusters were identified and defined as cluster groups. The Louvain algorithm was run after removing edges with weights below a threshold ranging from 0.08 to 0.25. Depending on the threshold, a total of 9–30 cluster groups containing 2 or more clusters were assembled. In addition to these cluster groups the algorithm result in 3–175 clusters that did not group with any other clusters (Supplemental Table S2). The cluster groups ranged in size from 2–44 clusters and the average group size for each pruning threshold ranged from 1.2 to 5.5. This difference in size and number of clusters is expected. Pruning at a lower threshold increases the interconnectivity of the graph, which leads to larger communities. As the threshold goes up, small groups of clusters and single clusters break off from the larger groups, resulting in smaller cluster groups and increasing the number of singleton clusters. The grouping algorithm organized clusters into related groups in many cases although not with the same degree of success as the variable clustering process. There was a mix of cohesive groups with a single overarching theme, larger more disparate groups, and groups consisting of a single cluster. Examples of cluster group themes included general paternal health history, lung health (including emphysema, bronchitis, lung disease clusters), and mental well-being (including clusters related to intrapersonal support and life satisfaction).
Figure 4 highlights two cases of the successful grouping of variable clusters into cluster groups. The cluster group shown in Figure 4A consists of 7 clusters all of which are related to maternal health history. Of these, 4 pertain to maternal history of heart disease or health conditions directly related to cardiovascular disease (stroke, heart attack, and blood pressure). One cluster pertains to diabetes which is associated with an increased risk of heart disease. The remaining two clusters are more generic, containing variables related to general maternal health history and mother’s age at death. This cluster group exemplifies a cohesive group of clusters that is unified by an overarching theme, maternal health history.
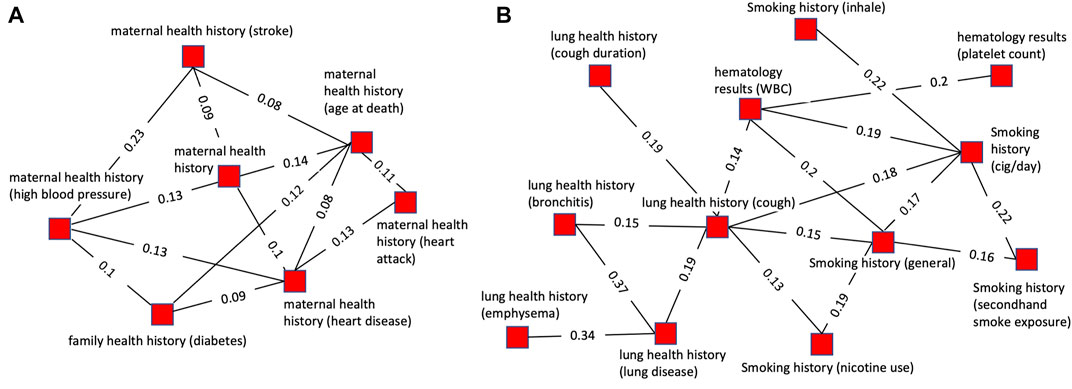
FIGURE 4. Plots of single cluster groups demonstrating cluster cohesiveness around a central theme. Each node is a variable cluster that is a member of the cluster group, and the group of interconnected nodes is one cluster group. (A) An example of a cluster group with clusters relating to maternal health history using a threshold of 0.12 for pruning prior to community finding and 0.07 for viewing. (B) An example of a cluster group with clusters relating to cigarette smoking and lung health using a threshold of 0.18 for pruning prior to community finding and 0.12 for viewing.
The cluster group shown in Figure 4B is composed of 12 variables. Of these, 5 variables were related to smoking history, with some specific to certain aspects of smoking history such as secondhand smoke exposure or cigarettes per day. All the other clusters were related to health conditions caused by smoking (lung diseases, emphysema, bronchitis, cough) or factors impacted by smoking (platelets, hematology). This illustrates a grouping of clusters based on underlying biology. The clusters are related to several biologically interdependent themes (smoking, lung health, hematology) as opposed to a single theme as in most of the cluster groups.
Cluster groups with related themes were more tightly linked and had more inter-group connections than more disparate groups. The interconnectivity of related cluster groups can be seen by plotting multiple cluster groups simultaneously (Figure 5). Figure 5A illustrates the high level of connectivity between nodes in cluster groups related to paternal health history, maternal health history, and family health history. This is driven by connections between family health history and maternal health history as well as family health history and paternal health history. Paternal and maternal health history have a much lower level of interconnectivity and are linked together primarily through each of their close connections with family health history.

FIGURE 5. Plots of multiple cluster groups demonstrating interconnectivity between cluster groups. Each node is a variable cluster with cluster groups being identified by node color. Black lines are intra-cluster edges and red lines are inter-cluster edges. The threshold for intra-cluster edges is 0.12 and for inter-cluster edges is 0.05. (A) Three interconnected cluster groups related to health history. The green (paternal health history-PHH) and blue (maternal health history-MHH) clusters are linked through the red clusters (family health history-FHH). (B) Three interconnected cluster groups. The green (physical activity) and blue (history of lung diseases), cluster groups are linked through the red cluster group (history of wheezing and breathlessness) but not directly connected to each other.
Figure 5B illustrates how lung health history and physical ability are connected through three cluster groups with numerous inter-group connections. Similar to the cluster shown in Figure 5A it shows the high level of interconnectivity between cluster groups with themes that are biologically interdependent. Lung health and physical ability are closely linked with each having a direct and robust impact on the other. Notably, the physical ability cluster groups are connected to the lung disease health cluster groups through wheezing and breathlessness, two symptoms of lung disease expected to strongly impact physical ability.
4 Discussion
In this study we distilled 14,425 variables from the ARIC study into 391 clusters representing 3,285 variables using a network built from partial correlations among the variables. The clusters were then grouped by calculating inter-cluster distances and using a community finding algorithm on the resultant graph. Hence, the original 14,425 variables were reduced to 9–30 cluster groups (depending on the pruning threshold applied). Whereas 14,425 unordered variables are too numerous for a human reviewer, 3,285 variables grouped into biologically meaningful subsets make human curation feasible. In fact, the manual curation of the 3,285 variables in this study was performed before the programmatic grouping of the clusters suggesting that future iterations of this procedure could be more efficient.
Manual curation of the data-driven cluster groups across thresholds identified 5 major topics related to the central goals of the ARIC study, creating a succinct set of topics and cluster groups that captures the fundamental goals of the study (Figure 6). For example, the 3 clusters shown in Figure 5A, would be grouped together in the “Genetic Risk Factors” category. The maternal health history, paternal health history, and family health history cluster groups are all related to family health history and represent the role genetics plays in an individual’s risk of developing cardiovascular disease. If this is the nature component of CVD risk, the nurture component would be the Lifestyle/Environmental Risk Factors topic containing physical activity, smoking, and diet related cluster groups among others. There is some structure to study variables inherent in the study design, so a human curator would never be faced with tens of thousands of unstructured variables. However, many topics are addressed on different surveys, and the laboratory measurements that correspond to certain survey topics are necessarily captured in a different segment of the study data. Our data-driven approach consolidates these variables to make it feasible for a human reviewer to easily capture the key concepts from an epidemiological study. In our proof-of-concept study, fewer than 30 cluster groups with less than 400 clusters were considered. Providing descriptive labels for these groups and clusters can be done by a subject matter expert in a matter of hours compared with weeks to assemble over 10,000 variables de novo.
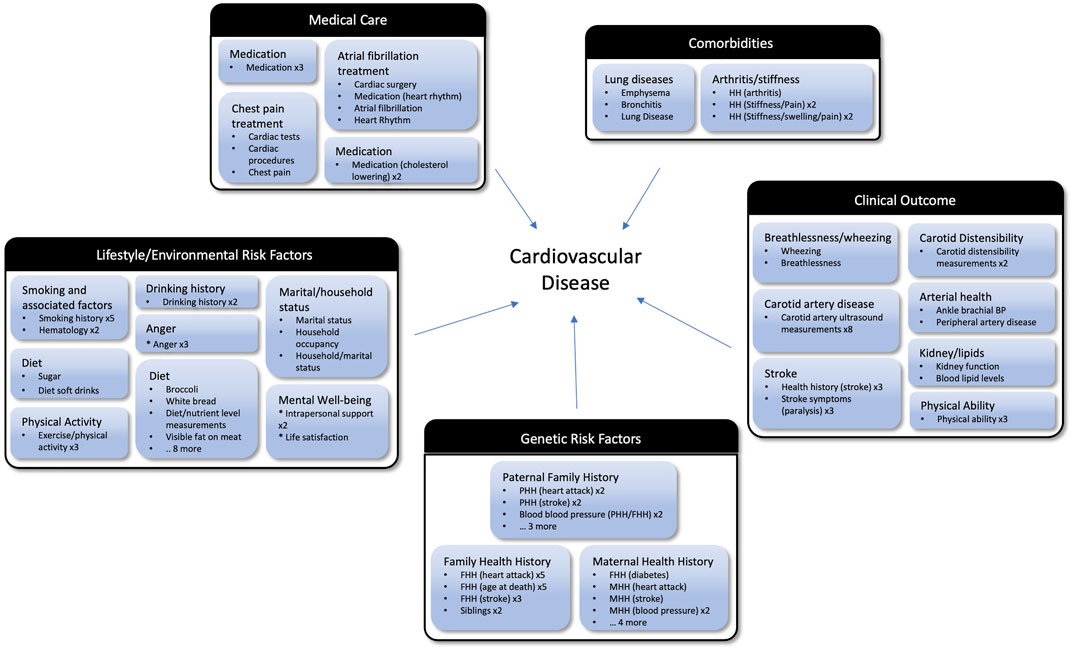
FIGURE 6. Cluster groups organized into topics based on the goals of the ARIC study. The outer black and white boxes are topics (e.g., Clinical Outcome and Medical Care) and each topic contains multiple cluster groups (e.g., Stroke and Lung Diseases) which are the blue boxes. Listed under the manually assigned label for each cluster groups are bullets representing the clusters which are members of that group. If there are multiple clusters within a group with the same name, after the cluster name they have an “x” and the number of times that cluster appears. For example, Anger x3 means there are three clusters in that group with the name Anger. Abbreviations: MMH, Maternal Health History; PHH, Paternal Health History; MH, Medical History.
While many important variables are lost when focusing on the 3,285 variables matching our stringent filtering criteria, the themes from the cluster groups support the conclusion that our selection criteria is enriching for highly relevant variables. In fact, the data-driven approach is extracting the variables that are empirically related and may even improve performance by eliminating variables that aren’t performing as expected. In the case where a key variable is missed by our approach, that variable can easily be reincorporated during the human review stage. As shown in Figure 6, the high-level categories identified when reviewing the cluster groups are consistent with the focus of the ARIC study. We see lifestyle, environmental and genetic factors that influence cardiovascular disease. When focusing on the clinical outcomes, we see both phenotypes that lead to atherosclerosis such as high cholesterol as well as diseases resulting from atherosclerosis such as heart failure and stroke. This suggests our approach can facilitate human curation efforts to map variables from one study to another by extracting and organizing the most relevant variables from each study.
Although the variable clusters were cohesive, indicating successful clustering, we did not note any novel correlations among the clusters. This is not surprising because the variables used for this analysis were all selected for a specific purpose as part of the experimental design of the original study in contrast with a more discovery-oriented omics study. The fact that both the original clusters and the subsequent groups of those clusters revealed known associations could be considered a strength of this approach as highlighted above. By grouping similar variables and thereby facilitating the mapping of those variables between studies, our work can enable pooled analyses of larger datasets thereby increasing the power to detect novel GWAS associations. In this manner, the work can indirectly impact novel discoveries. For cohorts that include an omics component such as RNAseq, the correlations between the omics measurements and clusters of related phenotypic variables could be used to guide discovery efforts within a single cohort as well.
This workflow could easily be incorporated into variable mapping efforts like Pan et al. (2012). Each study could be pre-processed to extract the most relevant variables and group those variables thematically. This could also be done in combination with text-based, machine learning approaches that cluster variables based on the similarities in the description of those variables. Text-based approaches have an added advantage of being applicable across studies whereas our workflow is restricted to the measured variables within a single study. However, the two sources of information are orthogonal, as seen when comparing the manual review and NLP scoring of our results, which should make the combination of the two approaches more accurate than either approach individually. In addition, knowledge of the correlation between two variables in one or more studies, could be informative when attempting to estimate a missing variable based on other related variables within a new study.
Limitations with the correlation-based approach are mainly due to the underlying data quality and challenges associated with performing a uniform analysis of all variables from a single study. Data quality issues will also be a problem for downstream analyses, and they are most likely to manifest as unrelated clusters or the presence of an unrelated variable within an otherwise coherent cluster. In both cases, the variables in question can probably be safely discarded from future analyses. Future improvements of our workflow would focus on addressing the latter issue. For example, the distribution of data for certain variables violates the assumptions of the Pearson correlation as do non-linear relationships among the variables. Ideally, each edge weight would be based upon the appropriate association metric, but establishing a fully automated workflow to determine the appropriate metric for each variable pair is a non-trivial exercise. Similarly, a comprehensive review of community finding algorithms for defining the cluster groups was beyond the scope of the current study, but this could potentially improve performance in the future.
Limitations with the NLP methods are primarily driven by the imprecision inherent in written language. The representation of biological concepts via ontologies is maturing, which will greatly improve the results from NLP approaches. In fact, several recent efforts at using NLP and machine learning to predict variable relationships have shown great promise. For example, earlier this year a semantic search tool designed to query biomedical datasets on the variable level using NLP and ontological knowledge graphs (Waldrop et al., 2022), was successfully deployed in the NHLBI’s BioData Catalyst Ecosystem (National Heart, 2020). NLP approaches are also more appropriate to support data harmonization than for applications like AOPs where separate variables related to a common biological event are jointly considered. For example, cluster 33 included both carrot consumption along with Vitamin A and carotenoid levels. While these would never be combined as a pooled study variable, they could all be used a surrogate measures for a key event that includes Vitamin A levels as either a measurable phenotype or a modulating factor.
Using these methods, we have been able to identify biologically meaningful relationships using the underlying data. The resulting variable clusters can then be mapped into knowledge-based systems that model the biological processes underlying disease (Wittwehr et al., 2015; Ankley and Edwards, 2018b; Martens et al., 2018; Slenter et al., 2018; Biomedical Data Translator Consortium, 2019; Watford et al., 2019b; Davis et al., 2019, 2020; Morton et al., 2019; Mortensen et al., 2021). Once mapped to potential disease mechanisms, the data from these existing studies can be modeled in novel ways to create new insights. In cases where the original studies contain an omics component, the variable clusters could be used to assist in discovery-driven analyses of the omics data. As new systems-based models of human disease are developed, these variable clusters should be easily mapped onto those models creating a wealth of data to support those analyses.
Finally, the variable clusters can be mapped onto key events within AOPs describing mechanisms of toxicity. The variables captured in this study would correspond to later events within the AOPs and would include adverse outcomes directly measured in human populations. By mapping NAMs to early key events within the same AOPs, the human data could be used to evaluate the ability of those NAMs to predict toxicity in order to support human health risk assessment decisions. Traditional toxicity data from laboratory animals can be incorporated into the same AOP-based model and help inform the toxicity predictions, but the animal data in this scenario is not intended to take the place of the real-world adverse outcomes that are the target of the risk assessment.
5 Conclusion
In conclusion, we present a novel workflow for extracting key variables from a large clinical study and summarizing those variables to enable reuse. This workflow could be incorporated into data harmonization efforts to reduce the human effort required for the initial variable mapping and provide important quantitative information to assist with the harmonization itself. It can also be incorporated into projects focused on organizing knowledge about human disease and the systems biology models built upon those knowledgebases. AOP-based systems models can, in turn, be used to evaluate the predictive value of individual NAMs and to develop integrated models that incorporate data from multiple NAMs as well as traditional animal studies to improve the toxicity predictions.
Data Availability Statement
Publicly available datasets were analyzed in this study. Data availability and detailed policies for requesting Atherosclerosis Risk in Communities (ARIC) data can be found at https://sites.cscc.unc.edu/aric/pubs-policies-and-forms-pg. Select ARIC data can also be obtained from the NHLBI BioLINCC repository (https://biolincc.nhlbi.nih.gov/home/).
Author Contributions
WH, CH, SE, FW, YZ, and AM-R designed the study. MM, JL, and SE performed the analyses. CI, SH, MM, HP, and SE evaluated the clusters. MM and SE wrote the original draft of the paper. All authors contributed to the final version and agree with the conclusions.
Funding
The authors thank the Office of Research and Innovation at NC State, RTI International, and the Kenan Institute for Engineering, Technology, and Science, for providing financial support for this work in the context of the Game-Changing Research Incentive Program (GRIP). MM, CI, HP, SE, and CH were funded, in part, by National Institute of Environmental Health Sciences (NIEHS) of the National Institutes of Health (NIH) award 1R24ES028479-01. AM-R was supported via intramural funds from NIEHS.
Conflict of Interest
Author JL was employed by the company Levy Informatics
The remaining authors declare that the research was conducted in the absence of any commercial or financial relationships that could be construed as a potential conflict of interest.
Publisher’s Note
All claims expressed in this article are solely those of the authors and do not necessarily represent those of their affiliated organizations, or those of the publisher, the editors and the reviewers. Any product that may be evaluated in this article, or claim that may be made by its manufacturer, is not guaranteed or endorsed by the publisher.
Acknowledgments
This manuscript was prepared using ARIC Research Materials obtained from the National Heart, Lung, and Blood Institute. The authors appreciate the thoughtful feedback from the reviewers of this manuscript. Their suggestions made this a much stronger manuscript.
Supplementary Material
The Supplementary Material for this article can be found online at: https://www.frontiersin.org/articles/10.3389/fphar.2022.883433/full#supplementary-material
References
Ankley, G. T., Bennett, R. S., Erickson, R. J., Hoff, D. J., Hornung, M. W., Johnson, R. D., et al. (2010). Adverse Outcome Pathways: a Conceptual Framework to Support Ecotoxicology Research and Risk Assessment. Environ. Toxicol. Chem. 29, 730–741. doi:10.1002/etc.34
Ankley, G. T., and Edwards, S. W. (2018a). The Adverse Outcome Pathway: A Multifaceted Framework Supporting 21st Century Toxicology. Curr. Opin. Toxicol. 9, 1–7. doi:10.1016/j.cotox.2018.03.004
Ankley, G. T., and Edwards, S. W. (2018b). The Adverse Outcome Pathway: A Multifaceted Framework Supporting 21st Century Toxicology. Curr. Opin. Toxicol. 9, 1–7. doi:10.1016/j.cotox.2018.03.004
Balshaw, D. M., Collman, G. W., Gray, K. A., and Thompson, C. L. (2017). The Children’s Health Exposure Analysis Resource: Enabling Research into the Environmental Influences on Children’s Health Outcomes. Curr. Opin. Pediatr. 29, 385–389. doi:10.1097/MOP.0000000000000491
Biomedical Data Translator Consortium (2019). Toward A Universal Biomedical Data Translator. Clin. Transl. Sci. 12, 86–90. doi:10.1111/cts.12591
Bird, S., Klein, E., and Looper, E. (2009). Natural Language Processing with Python. Sebastopol: O’Reilly Media, Inc.
Blackwell, C. K., Wakschlag, L. S., and Gershon, R. C. (2018). Cella, D., and with the ECHO PRO CoreMeasurement Framework for the Environmental Influences on Child Health Outcomes Research Program. Curr. Opin. Pediatr. 30, 276–284. doi:10.1097/MOP.0000000000000606
Coletti, M. H., and Bleich, H. L. (2001). Medical Subject Headings Used to Search the Biomedical Literature. J. Am. Med. Inf. Assoc. 8, 317–323. doi:10.1136/jamia.2001.0080317
Cote, I., Andersen, M. E., Ankley, G. T., Barone, S., Birnbaum, L. S., Boekelheide, K., et al. (2016). The Next Generation of Risk Assessment Multi-Year Study-Highlights of Findings, Applications to Risk Assessment, and Future Directions. Environ. Health Perspect. 124, 1671–1682. doi:10.1289/EHP233
Davis, A. P., Wiegers, J., Wiegers, T. C., and Mattingly, C. J. (2019). Public Data Sources to Support Systems Toxicology Applications. Curr. Opin. Toxicol. 16, 17–24. doi:10.1016/j.cotox.2019.03.002
Davis, A. P., Wiegers, T., Grondin, C., Johnson, R., Sciaky, D., Wiegers, J., et al. (2020). Leveraging the Comparative Toxicogenomics Database to Fill in Knowledge Gaps for Environmental Health: A Test Case for Air Pollution-Induced Cardiovascular Disease. Toxicol. Sci. official J. Soc. Toxicol. 177. doi:10.1093/toxsci/kfaa113
All of Us Research Program Investigators Denny, J. C., Denny, J. C., Rutter, J. L., Goldstein, D. B., and Philippakis, A. (2019). The “All of Us” Research Program. N. Engl. J. Med. 381, 668–676. doi:10.1056/NEJMsr1809937
Giffen, C. A., Carroll, L. E., Adams, J. T., Brennan, S. P., Coady, S. A., and Wagner, E. L. (2015). Providing Contemporary Access to Historical Biospecimen Collections: Development of the NHLBI Biologic Specimen and Data Repository Information Coordinating Center (BioLINCC). Biopreserv Biobank 13, 271–279. doi:10.1089/bio.2014.0050
Goyak, K. O., and Lewis, R. J. (2021). Application of Adverse Outcome Pathway Networks to Integrate Mechanistic Data Informing the Choice of a Point of Departure for Hydrogen Sulfide Exposure Limits. Crit. Rev. Toxicol. 51, 193–208. doi:10.1080/10408444.2021.1897085
Habibi-Koolaee, M., Shahmoradi, L., Niakan Kalhori, S. R., Ghannadan, H., and Younesi, E. (2021). STO: Stroke Ontology for Accelerating Translational Stroke Research. Neurol. Ther. 10, 321–333. doi:10.1007/s40120-021-00248-1
Interagency Coordinating Committee on the Validation of Alternative Methods (2018). A Strategic Roadmap for Establishing New Approaches to Evaluate the Safety of Chemicals and Medical Products in the United States. Available at: https://ntp.niehs.nih.gov/iccvam/docs/roadmap/iccvam_strategicroadmap_january2018_document_508.pdf.
Krewski, D., Acosta, D., Andersen, M., Anderson, H., Bailar, J. C., Boekelheide, K., et al. (2010). Toxicity Testing in the 21st Century: a Vision and a Strategy. J. Toxicol. Environ. Health B Crit. Rev. 13, 51–138. doi:10.1080/10937404.2010.483176
Ly Pham, L., Watford, S., Pradeep, P., Martin, M. T., Thomas, R., Judson, R., et al. (2020). Variability in In Vivo Studies: Defining the Upper Limit of Performance for Predictions of Systemic Effect Levels. Comput. Toxicol. 15, 1–100126. doi:10.1016/j.comtox.2020.100126
Mailman, M. D., Feolo, M., Jin, Y., Kimura, M., Tryka, K., Bagoutdinov, R., et al. (2007). The NCBI dbGaP Database of Genotypes and Phenotypes. Nat. Genet. 39, 1181–1186. doi:10.1038/ng1007-1181
Martens, M., Verbruggen, T., Nymark, P., Grafström, R., Burgoon, L. D., Aladjov, H., et al. (2018). Introducing WikiPathways as a Data-Source to Support Adverse Outcome Pathways for Regulatory Risk Assessment of Chemicals and Nanomaterials. Front. Genet. 9, 661. doi:10.3389/fgene.2018.00661
Mortensen, H. M., Senn, J., Levey, T., Langley, P., and Williams, A. J. (2021). The 2021 Update of the EPA’s Adverse Outcome Pathway Database. Sci. Data 8, 169. doi:10.1038/s41597-021-00962-3
Morton, K., Wang, P., Bizon, C., Cox, S., Balhoff, J., Kebede, Y., et al. (2019). ROBOKOP: an Abstraction Layer and User Interface for Knowledge Graphs to Support Question Answering. Bioinformatics 35, 5382–5384. doi:10.1093/bioinformatics/btz604
National Library of Medicine (2021). dbGaP/Database of Genotypes and Phenotypes/ National Center for Biotechnology Information. National Library of Medicine (NCBI/NLM)/. Available at: https://www.ncbi.nlm.nih.gov/gap.
Pan, H., Ives, C., Mandal, M., Qin, Y., Hendershot, T., Popvic, J. R., et al. (2021). CureSCi Metadata Catalog – Making Sickle Cell Studies Findable. Manuscript submitted for publication.
Pan, H., Tryka, K. A., Vreeman, D. J., Huggins, W., Phillips, M. J., Mehta, J. P., et al. (2012). Using PhenX Measures to Identify Opportunities for Cross-Study Analysis. Hum. Mutat. 33, 849–857. doi:10.1002/humu.22074
Piersma, A. H., Burgdorf, T., Louekari, K., Desprez, B., Taalman, R., Landsiedel, R., et al. (2018). Workshop on Acceleration of the Validation and Regulatory Acceptance of Alternative Methods and Implementation of Testing Strategies. Toxicol Vitro 50, 62–74. doi:10.1016/j.tiv.2018.02.018
Rashid, S. M., McCusker, J. P., Pinheiro, P., Bax, M. P., Santos, H., Stingone, J. A., et al. (2020). The Semantic Data Dictionary - an Approach for Describing and Annotating Data. Data Intell. 2, 443–486. doi:10.1162/dint_a_00058
Schultz, T. W., Dimitrova, G., Dimitrov, S., and Mekenyan, O. G. (2016). The Adverse Outcome Pathway for Skin Sensitisation: Moving Closer to Replacing Animal Testing. Altern. Lab. Anim. 44, 453–460. doi:10.1177/026119291604400515
Slenter, D. N., Kutmon, M., Hanspers, K., Riutta, A., Windsor, J., Nunes, N., et al. (2018). WikiPathways: a Multifaceted Pathway Database Bridging Metabolomics to Other Omics Research. Nucleic Acids Res. 46, D661–D667. doi:10.1093/nar/gkx1064
Spinu, N., Cronin, M. T. D., Enoch, S. J., Madden, J. C., and Worth, A. P. (2020). Quantitative Adverse Outcome Pathway (qAOP) Models for Toxicity Prediction. Arch. Toxicol. 94, 1497–1510. doi:10.1007/s00204-020-02774-7
Stearns, M. Q., Price, C., Spackman, K. A., and Wang, A. Y. (2001). SNOMED Clinical Terms: Overview of the Development Process and Project Status. Proc. AMIA Symp., 662–666.
Stilp, A. M., Emery, L. S., Broome, J. G., Buth, E. J., Khan, A. T., Laurie, C. A., et al. (2021). A System for Phenotype Harmonization in the National Heart, Lung, and Blood Institute Trans-omics for Precision Medicine (TOPMed) Program. Am. J. Epidemiol. 190, 1977–1992. doi:10.1093/aje/kwab115
Sudlow, C., Gallacher, J., Allen, N., Beral, V., Burton, P., Danesh, J., et al. (2015). UK Biobank: An Open Access Resource for Identifying the Causes of a Wide Range of Complex Diseases of Middle and Old Age. PLOS Med. 12, e1001779. doi:10.1371/journal.pmed.1001779
The Atherosclerosis Risk in Communities Study (1989). design and objectives. The ARIC investigators. Am. J. Epidemiol. 129, 687–702.
Viet, S. M., Falman, J. C., Merrill, L. S., Faustman, E. M., Savitz, D. A., Mervish, N., et al. (2021). Human Health Exposure Analysis Resource (HHEAR): A model for incorporating the exposome into health studies. Int. J. Hyg. Environ. Health 235, 113768. doi:10.1016/j.ijheh.2021.113768
Watford, S., Edwards, S., Angrish, M., Judson, R. S., and Paul Friedman, K. (2019a). Progress in data interoperability to support computational toxicology and chemical safety evaluation. Toxicol. Appl. Pharmacol. 380, 114707. doi:10.1016/j.taap.2019.114707
Watford, S., Edwards, S., Angrish, M., Judson, R. S., and Paul Friedman, K. (2019b). Progress in data interoperability to support computational toxicology and chemical safety evaluation. Toxicol. Appl. Pharmacol. 380, 114707. doi:10.1016/j.taap.2019.114707
Whetzel, P. L., Noy, N. F., Shah, N. H., Alexander, P. R., Nyulas, C., Tudorache, T., et al. (2011). BioPortal: enhanced functionality via new Web services from the National Center for Biomedical Ontology to access and use ontologies in software applications. Nucleic Acids Res. 39, W541–W545. doi:10.1093/nar/gkr469
Wilkinson, M. D., Dumontier, M., Aalbersberg, I. J. J., Appleton, G., Axton, M., Baak, A., et al. (2016). The FAIR Guiding Principles for scientific data management and stewardship. Sci. Data 3, 160018. doi:10.1038/sdata.2016.18
Wittwehr, C., Aladjov, H., Ankley, G., Byrne, H. J., de Knecht, J., Heinzle, E., et al. (2017). How Adverse Outcome Pathways Can Aid the Development and Use of Computational Prediction Models for Regulatory Toxicology. Toxicol. Sci. 155, 326–336. doi:10.1093/toxsci/kfw207
Wittwehr, C., Munn, S., Landesmann, B., and Whelan, M. (2015). Adverse Outcome Pathways Knowledge Base (AOP-KB). Toxicol. Lett. 238, S309. doi:10.1016/j.toxlet.2015.08.884
Keywords: cluster analysis, systems biology, meta-analysis as topic, ARIC, cardiovascular disease
Citation: Mandal M, Levy J, Ives C, Hwang S, Zhou Y-H, Motsinger-Reif A, Pan H, Huggins W, Hamilton C, Wright F and Edwards S (2022) Correlation Analysis of Variables From the Atherosclerosis Risk in Communities Study. Front. Pharmacol. 13:883433. doi: 10.3389/fphar.2022.883433
Received: 25 February 2022; Accepted: 21 June 2022;
Published: 11 July 2022.
Edited by:
Patricia Ruiz, Agency for Toxic Substances and Disease Registry, United StatesReviewed by:
Julio Augusto Freyre-Gonzalez, National Autonomous University of Mexico, MexicoJeanette Stingone, Columbia University, United States
Copyright © 2022 Mandal, Levy, Ives, Hwang, Zhou, Motsinger-Reif, Pan, Huggins, Hamilton, Wright and Edwards. This is an open-access article distributed under the terms of the Creative Commons Attribution License (CC BY). The use, distribution or reproduction in other forums is permitted, provided the original author(s) and the copyright owner(s) are credited and that the original publication in this journal is cited, in accordance with accepted academic practice. No use, distribution or reproduction is permitted which does not comply with these terms.
*Correspondence: Stephen Edwards, swedwards@rti.org