Inhibition of Gasdermin D-Mediated Pyroptosis Attenuates the Severity of Seizures and Astroglial Damage in Kainic Acid-Induced Epileptic Mice
 Frontiers Production Office
by Xia, L., Liu, L., Cai, Y., Zhang, Y., Tong, F., Wang, Q., Ding, J., and Wang, X. (2022). Front. Pharmacol. 12:751644. doi:10.3389/fphar.2021.751644
Due to a production error, there was a mistake in Figure 1, Figure 2 and Figure 3 as published. The images for Figure 1, Figure 2 and Figure 3 were replaced with the images for Supplementary Figure S1, Supplementary Figure S2, and Supplementary Figure S3, respectively. The correct images for Figure 1, Figure 2 and Figure 3 appear below.
FIGURE 1
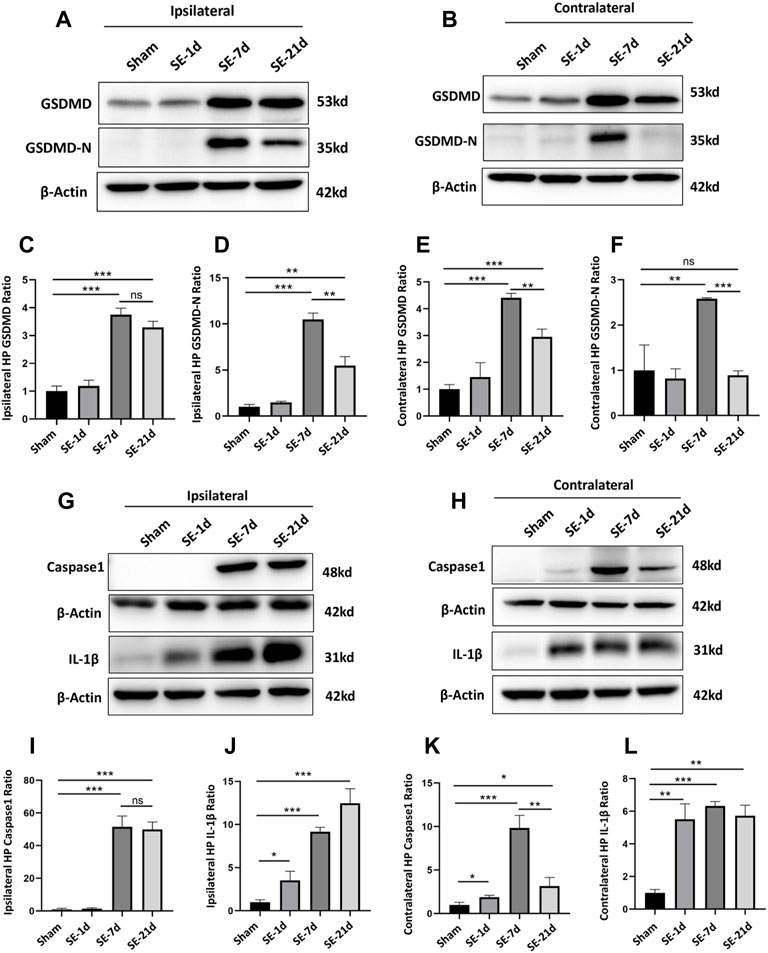
FIGURE 1. Expression of GSDMD and pyroptosis-related molecules was significantly increased after kainic acid-induced SE. (A,B) WB bands of GSDMD, GSDMD-N, and β-actin proteins in the ipsilateral and contralateral hippocampus. (C–F) Statistical analyses of GSDMD, GSDMD-N, and β-actin proteins in the ipsilateral and contralateral hippocampus. (G,H) WB bands of caspase-1, IL-1β, and β-actin proteins in the ipsilateral and contralateral hippocampus. (I–L) Statistical analyses of caspase-1, IL-1β, and β-actin proteins in the ipsilateral and contralateral hippocampus (n = 3 in each group, *p < 0.05, **p < 0.01, and ***p < 0.001).
FIGURE 2
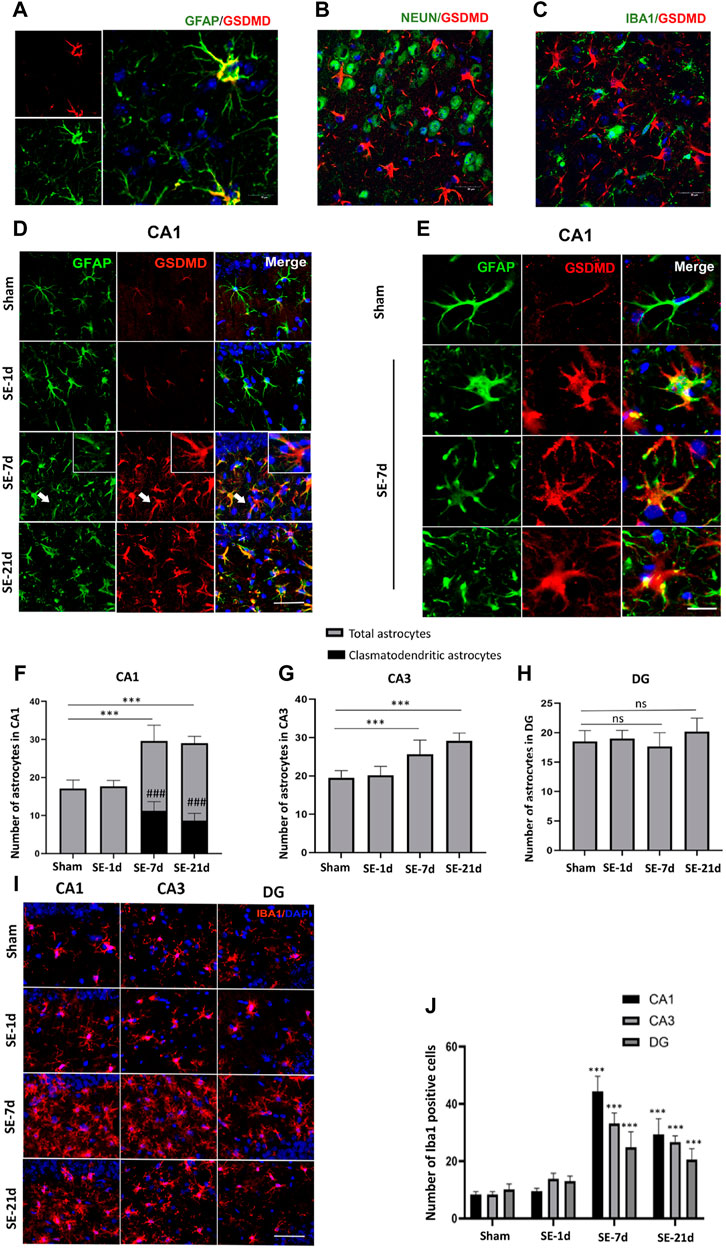
FIGURE 2. Clasmatodendritic astrocytes co-labeled with GSDMD after SE. (A–C) Representative images of GSDMD (red)/GFAP (green), GSDMD (red)/NeuN (green), and GSDMD (red)/Iba-1 (green) staining in hippocampal slices from mice at day 7 after kainic acid injection. (D) Microphotographs of GSDMD (red) and GFAP (green) staining in the CA1 region of the hippocampus in the sham, SE-1d, SE-7d, and SE-21d groups (bar = 50 µm). (E) Typical GSDMD-positive clasmatodendritic astrocytes in the CA1 region of the hippocampus at 7 days after SE (bar = 12.5 µm). (F–H) Statistical analyses of the number of GSDMD-positive clasmatodendritic astrocytes and total astrocytes in the CA1, CA3, and DG regions (n = 3 in each group, asterisks represent the total astrocytes in comparison with the sham group, *p < 0.05, **p < 0.01, and ***p < 0.001; well number represents the clasmatodendritic astrocytes in comparison with the sham group, ###p < 0.001). (I) Microphotographs of Iba1 (red) staining in the CA1, CA3, and DG regions of the hippocampus in the sham, SE-1d, SE-7d, and SE-21d groups. (J) Statistical analyses of the number of Iba1-positive cells in the CA1, CA3, and DG regions (n = 3 in each group, asterisks represent the comparison with the sham group, *p < 0.05, **p < 0.01, and ***p < 0.001).
FIGURE 3
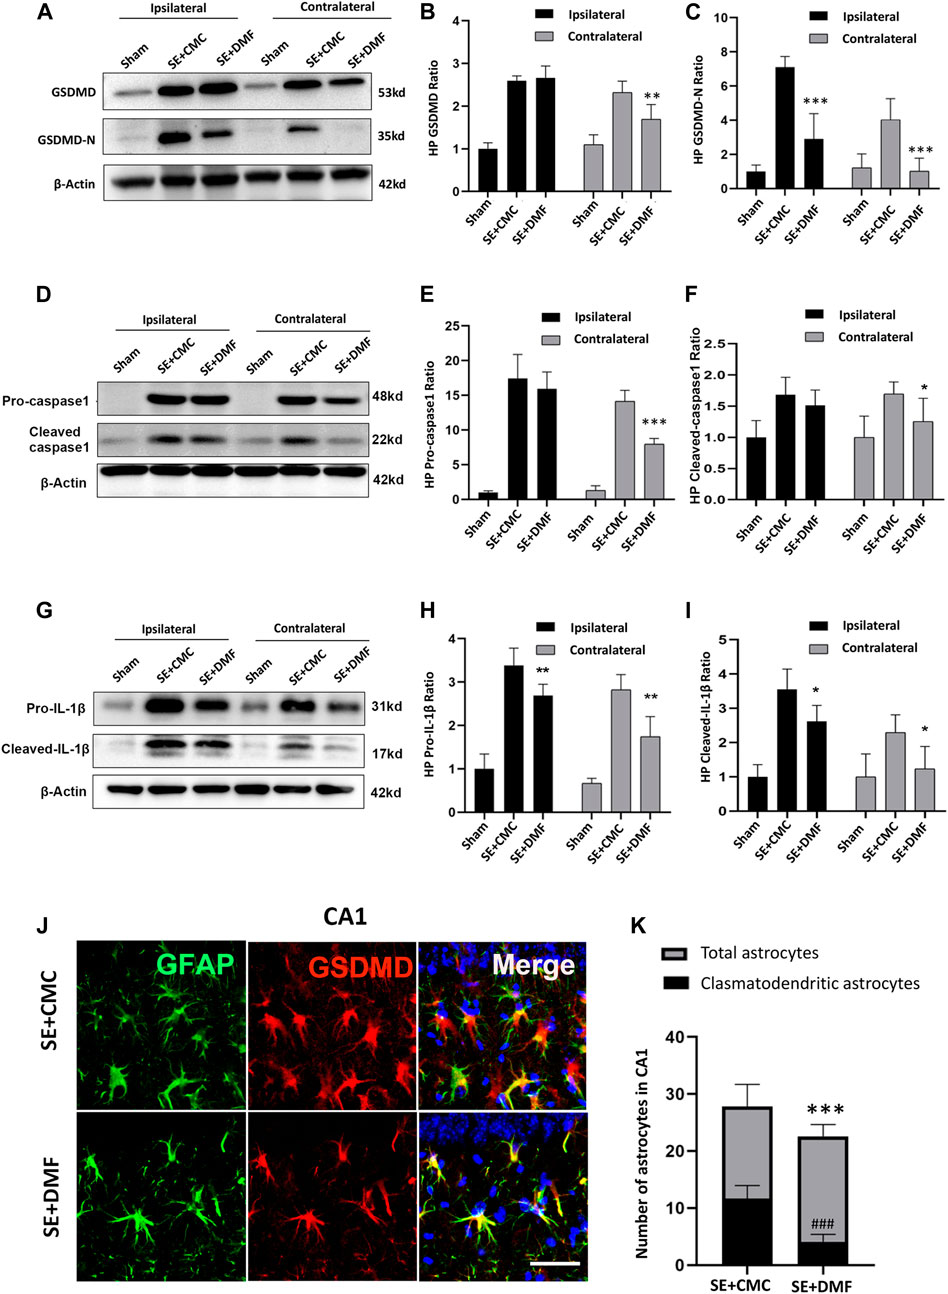
FIGURE 3. DMF intervention inhibited the expression of GSDMD-N and attenuated astrocytic clasmatodendrosis. (A–C) WB bands and statistical analyses of GSDMD, GSDMD-N, and β-actin proteins in the ipsilateral and contralateral hippocampus in the SE + CMC and SE + DMF groups (n = 6 in each group, asterisks represent the comparison with the SE + CMC group, *p < 0.05, **p < 0.01, and ***p < 0.001). (D–F) WB bands and statistical analyses of pro-caspase-1, cleaved-caspase1, and β-actin proteins in the ipsilateral and contralateral hippocampus (n = 6 in each group, asterisks indicate the comparison with the SE + CMC group, *p < 0.05, **p < 0.01, and ***p < 0.001). (G–I) WB bands and statistical analyses of pro-IL-1β, cleaved–IL-1β, and β-actin proteins in the ipsilateral and contralateral hippocampus (n = 6 in each group, asterisks indicate the comparison with the SE + CMC group, *p < 0.05, **p < 0.01, and ***p < 0.001). (J) Microphotographs of GSDMD (red) and GFAP (green) staining in the CA1 region of the hippocampus in the SE + CMC and SE + DMF groups. (K) Statistical analyses of the number of GSDMD-positive clasmatodendritic astrocytes and total astrocytes in the CA1 region in the SE + CMC and SE + DMF groups (n = 3 in each group, asterisks represents the total astrocytes in comparison with the sham group, ***p < 0.001; well number represents the clasmatodendritic astrocytes in comparison with the sham group, ###p < 0.001).
The publisher apologizes for this mistake. The original version of this article has been updated.
Keywords: epilepsy, GSDMD, pyroptosis, astrocyte, inflammation
Citation: (2022) Erratum: Inhibition of Gasdermin D-Mediated Pyroptosis Attenuates the Severity of Seizures and Astroglial Damage in Kainic Acid-Induced Epileptic Mice. Front. Pharmacol. 13:873984. doi: 10.3389/fphar.2022.873984
Received: 11 February 2022; Accepted: 11 February 2022;
Published: 03 March 2022.
Approved by:
Frontiers Editorial Office, Frontiers Media SA, SwitzerlandCopyright © 2022 Frontiers Production Office. This is an open-access article distributed under the terms of the Creative Commons Attribution License (CC BY). The use, distribution or reproduction in other forums is permitted, provided the original author(s) and the copyright owner(s) are credited and that the original publication in this journal is cited, in accordance with accepted academic practice. No use, distribution or reproduction is permitted which does not comply with these terms.
*Correspondence: Frontiers Production Office, production.office@frontiersin.org