 Wei Liu
 Jian Zhang
 Tao Xie
 Xiaoting Huang
 Baiyao Wang
 Yunhong Tian
 Yawei Yuan
94% of researchers rate our articles as excellent or good
Learn more about the work of our research integrity team to safeguard the quality of each article we publish.
Find out more
ORIGINAL RESEARCH article
Front. Pharmacol., 23 March 2022
Sec. Pharmacology of Anti-Cancer Drugs
Volume 13 - 2022 | https://doi.org/10.3389/fphar.2022.855485
This article is part of the Research TopicMulti-omics in Studying the Mechanisms of Anti-cancer Drugs Resistance and ToxicityView all 13 articles
Background: The discovery of reliable cancer biomarkers could tune a diagnosis and improve the way patients are treated. However, many cancers lack robust biomarkers. C1QTNF6 has been preliminarily elucidated for its role in some tumors. However, no pan-cancer analysis has been performed to comprehensively explore the value of C1QTNF6.
Methods: Data from the TCGA database, GTEx database stored in the USUC Xena were used for analyzing the profiles of C1QTNF6 expression in normal and tumor tissues in pan-cancer. Subsequently, the gene alteration rates of C1QTNF6 were acquired on the online web cBioportal. With the aid of the TCGA data, the association between C1QTNF6 mRNA expression and copy number alterations (CNA) and methylation was determined. Survival analyses of C1QTNF6 were carried out. Moreover, the tumor biological and immunological characteristics of C1QTNF6 were clarified in the forms of the correlation between C1QTNF6 expression and hallmark Pathway scores in MsigDB database, immune cell infiltration, immune-related genes. We conducted a GSEA of C1QTNF6 to illustrate its potential biological functions. In addition, GDSC2 data with 198 drugs were adopted to explore drug sensitivity with the change of C1QTNF6 expression.
Result: C1QTNF6 was overexpressed in many types of cancer, Survival analysis showed that C1QTNF6 independently served as a prognostic indicator for poor survival in many tumors. Besides, we also identified a positive correlation between C1QTNF6 and cancer hallmark pathway score, tumor microenvironment related pathways score (TMEp score), and immune characteristic. In terms of drug sensitivity analysis, we found higher expression level of C1QTNF6 predicts a high IC50 value for most of 198 drugs which predicts drug resistance.
Conclusions: Our study provides a new biological marker for pan-cancer, which is beneficial to the diagnosis and treatment of cancer, which bring a new therapeutic target for tumors.
At present, cancer remains a hindrance in the field of medicine (Hausman, 2019). Compared to normal cells, cancer cells have several unique hallmarks, including unlimited replication, overactivation of growth signals, resistance to cell death, immune re-editing, and metabolic reprogramming (Hanahan and Weinberg, 2011; Macheret and Halazonetis, 2015). These changes are the result of mutations in a variety of genes, including proto-oncogenes and suppressor genes (Kroemer and Pouyssegur, 2008; Park et al., 2020). We hypothesized that these genes may serve as viable therapeutic targets in cancer treatment. Targeted therapies such as BRAF inhibitors and VEGF inhibitors have achieved initial efficacy in the treatment of diverse solid tumors (Davies et al., 2002; Carmeliet, 2005). Besides, immunotherapy based on PD-1/PD-L1 or CTLA-4 mutations offers hope for advanced tumors (Ai et al., 2020; Han et al., 2020). However, unfortunately, a significant proportion of patients are less sensitive to targeted therapy or immunotherapy (Qin et al., 2019). Therefore, there is an urgent need for new biomarkers to guide cancer treatment.
Complement C1q Tumor Necrosis factor-related Protein 6 (C1QTNF6) is an inflammation-related gene, which has been preliminarily described to be related to the biological characteristics of tumors (Wang et al., 2020). Zhang et al. found that C1QTNF6 regulates proliferation and apoptosis of non-small cell lung cancer (NSCLC) (Zhang and Feng, 2021). Takeuchi et al. found that C1QTNF6 regulates angiogenesis and apoptosis in hepatocellular carcinoma through the Akt pathway (Takeuchi et al., 2011). Therefore, C1QTNF6 might perform an integral function in tumor progression. Nevertheless, no pan-cancer analysis has been performed to comprehensively demonstrate the value of C1QTNF6 in multiple cancers.
In recent years, the establishment of several large public databases has greatly promoted the development of bioinformatics. TCGA and GTEx databases are among the most used databases (Blum et al., 2018). By analyzing cancer transcriptome data and clinical data, we can screen for meaningful biomarkers to assess patient prognosis or guide treatment.
Here, bioinformatics analysis was conducted for the purpose of comprehensively examining the significance of C1QTNF6 in pan-cancer by combining GTEx and TCGA data. Our results can provide a robust prognostic marker for multiple cancers. The expression level of C1QTNF6, as well as its prognostic significance in pan-cancer, was explored. We further found the role of C1QTNF6 in the tumor microenvironment (TME), including the correlation between C1QTNF6 and the immunosuppressive genes, immune cell infiltration score, chemokines, and chemokine receptors. It is worth noting that increased C1QTNF6 expression indicates greater drug resistance. Taken together, our research can also provide a reference for the understanding of the cancer-immune microenvironment and cancer therapies.
RNA-sequencing samples of the Genotype-Tissue Expression (GTEx) and The Cancer Genome Atlas (TCGA) were acquired through UCSC Xena in TCGA TARGET GTEx columns (https://xena.ucsc.edu). We downloaded the methylation data and DNA copy number data from cBioportal dataset (https://www/cbioportal/org/). The differences in the expression levels between tumors and normal tissues were assessed by means of the T-test, and a p-value of less than 0.05 denoted a significance. The analysis was conducted with the help of R software.
First, mutation analysis was performed on the cBioportal online web. On the website, the gene was selected as C1QTNF6, and the object of analysis was set as “TCGAPan-Cancer Atlas”. The frequency analysis of C1QTNF6 alteration in each cancer was obtained. The cBioPortal database was utilized for the purpose of acquiring Copy number alterations (CNA) and methylation data, while methylation data are from the HM450 types, both the association between the C1QTNF6 expression and the CNA and methylation were calculated the Pearson’s correlation coefficients.
Next, a univariate Cox regression was performed to explore the prognostic significance of C1QTNF6 in pan-cancer. We also analyzed the progression-free interval (PFI), disease-free interval (DFI), disease-specific survival (DSS), and overall survival (OS). Meanwhile, univariate cox regression and multivariate Cox regression analysis of C1QTNF6 and other cliniacal features were carried out in tumors where C1QTNF6 was an independent prognostic indicator. The R package “Survminer” was used for analysis (Biecek, 2020).
The MsigDB database contains 50 hallmark Pathway datasets. First, Combining the RNA-seq data of 33 cancers and a single-sample gene set enrichment analysis (ssGSEA) algorithm utilizing GSVA packages (Hänzelmann et al., 2013), we quantified the score of each cancer hallmark. The immune characteristic parameters including ImmuneScore, StromalScore, and ESTIMATEScore of each cancer were calculated by the “ESTIMATE” R package (Verhaak, 2016). We adopted the algorithm that is published in Nature journal and “prcomp” packages to calculate the tumor microenvironment pathways score (TMEp score). The immueCellAI database was utilized for the purpose of acquiring the scores of infiltrating immune cells from the TCGA pan-cancer (http://bioinfo.life.hust.edu.cn). A total of 33 cancers were studied for their gene expression levels of chemokines, chemokine receptors, and immunosuppressive genes. After obtaining the above scores as well as the immune-associated genes expression level (chemokines, chemokine receptors, and immunosuppressive genes) of each tumor, we used the “corrplot” R package (Simko, 2021) to calculate the correlation between C1QTNF6 and above scores and immune-related genes expression, and used the “ggplot2” package to draw the correlation heat map (Wickham, 2016).
GSEA was launched to explore the potential biological functions of C1QTNF6 in the tumor process by using “clusterProfiler” (Yu et al., 2012), The top 20 significant pathways of C1QTNF6 were obtained in each cancer, we showed GSEA plots of the 8 cancers with the largest proportion of immune pathways with the help of “ggridges” packages (Wilke, 2021).
We explored the relationship between gene expression and drug sensitivity from the GDSC2 database (https://www.cancerrxgene.org/). Subsequently, Spearman- correlation analysis was employed for the purpose of investigating the correlation between drugs and C1QTNF6 expression level, and the drugs with the top 6 strongest positive correlation and the top 6 strongest (only 6) negative correlation were displayed respectively. Next, we analyzed the difference in sensitivity between the low- and high-expression group (according to the median value of C1QTNF6) to 9 commonly used anticancer drugs, we assessed the sensitivity difference by the Kruskal-Wallis rank-sum test (p < 0.05).
C1QTNF6 was differentially expressed in 26 cancers in the TCGA cohort. The C1QTNF6 expression level was remarkably up-regulated in 22 distinct types of tumors, including UCS, CHOL, STAD, DLBC, SARC, GBM, PAAD, HNSC, LUSC, KIRC, LUAD, KIRP, LIHC, LGG, LAML, ESCA, READ, COAD, SKCM, BRCA, THYM, BLCA. C1QTNF6 was significantly down-regulated in 4 tumors, including ACC, KICH, PRAD, and THCA; The cancers in the gray box had significant differences between tumor and normal tissues, whereas cancers in the white box had no differences (Figure 1A) Subsequently, paired expression analysis showed C1QTNF6 was significantly up-regulated in the 13 kinds of tumors, notably, KIRP, HNSC, LIHC, ESCA, LUAD, COAD, KIRC, LUSC, CHOL, STAD, BRCA, THCA, BLCA. Paired expression analysis showed that C1QTNF6 was solely significantly down-regulated in KICH (Figure 1B).
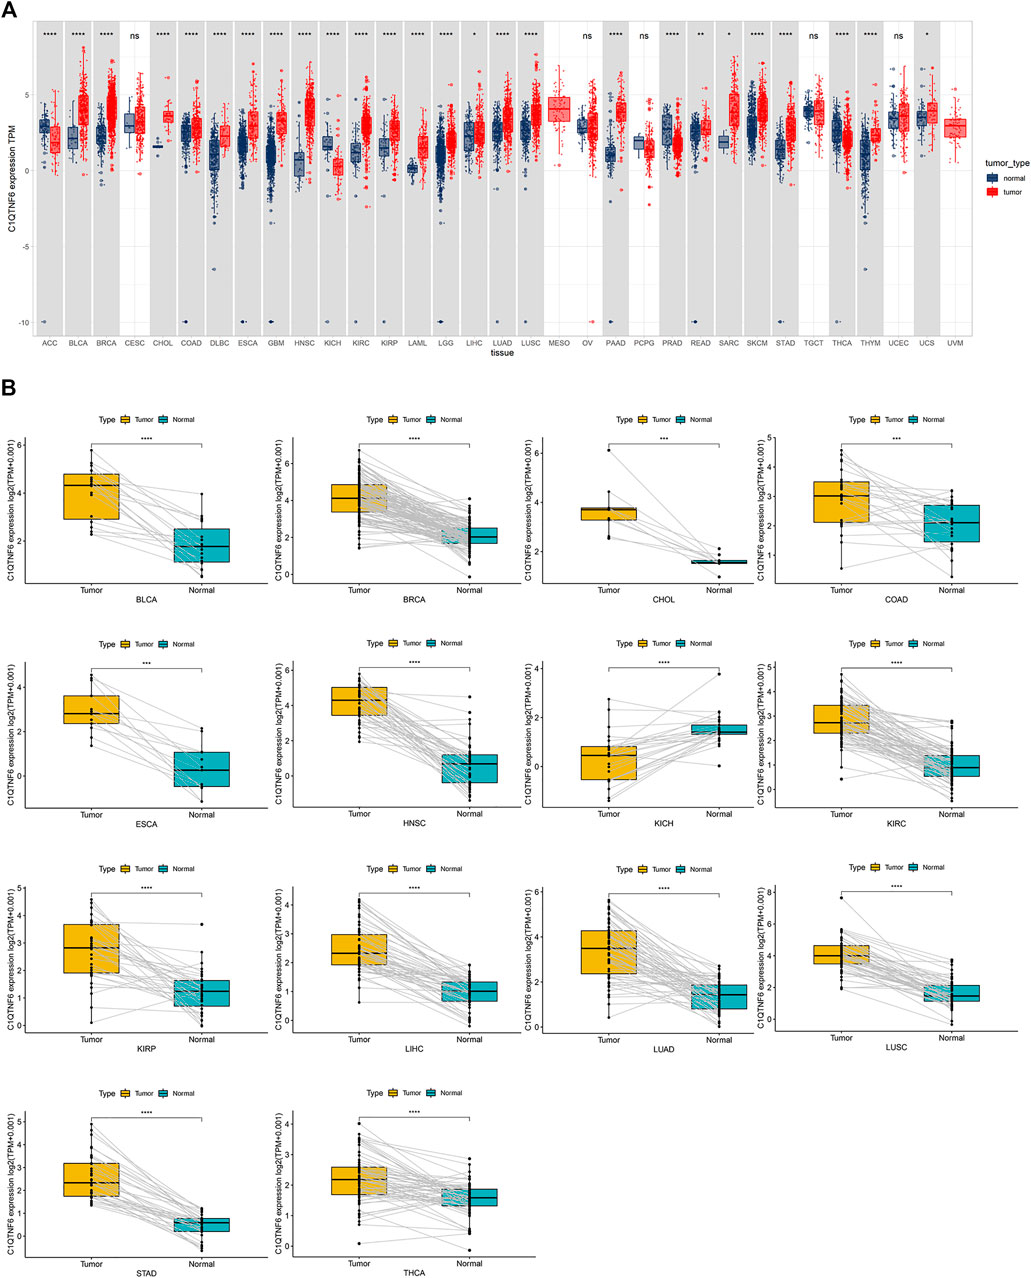
FIGURE 1. C1QTNF6 profile in pan-cancer. (A) Integrated GTEx database and TCGA database revelation of C1QTNF6 expression across normal and tumor tissues. (B) According to the TCGA data, the levels of C1QTNF6 in corresponding tumors and normal tissues varied across various cancers. *p < 0.05, **p < 0.01, ***p < 0.001, ****p < 0.0001.
First, analysis in the cBioportal database showed the alteration frequency of C1QTNF6 in Pan-cancer. The results showed that the alteration frequency of C1QTNF6 in uterine carcinosarcoma was the highest, and the main type is the amplification mutation (Figure 2A). Subsequently, we explored the association between C1QTNF6 and copy number mutation (CNA) in pan-cancer. The results showed that C1QTNF6 had a strong positive correlation with CNA in CHOL, UCS, PCPG (Figure 2B). Then, we explored the correlation between C1QTNF6 and methylation in pan-cancer. The findings demonstrated that C1QTNF6 exhibited a positive correlation with methylation in LAML, and a strong negative correlation with ACC and UVM, etc. (Figure 2C).
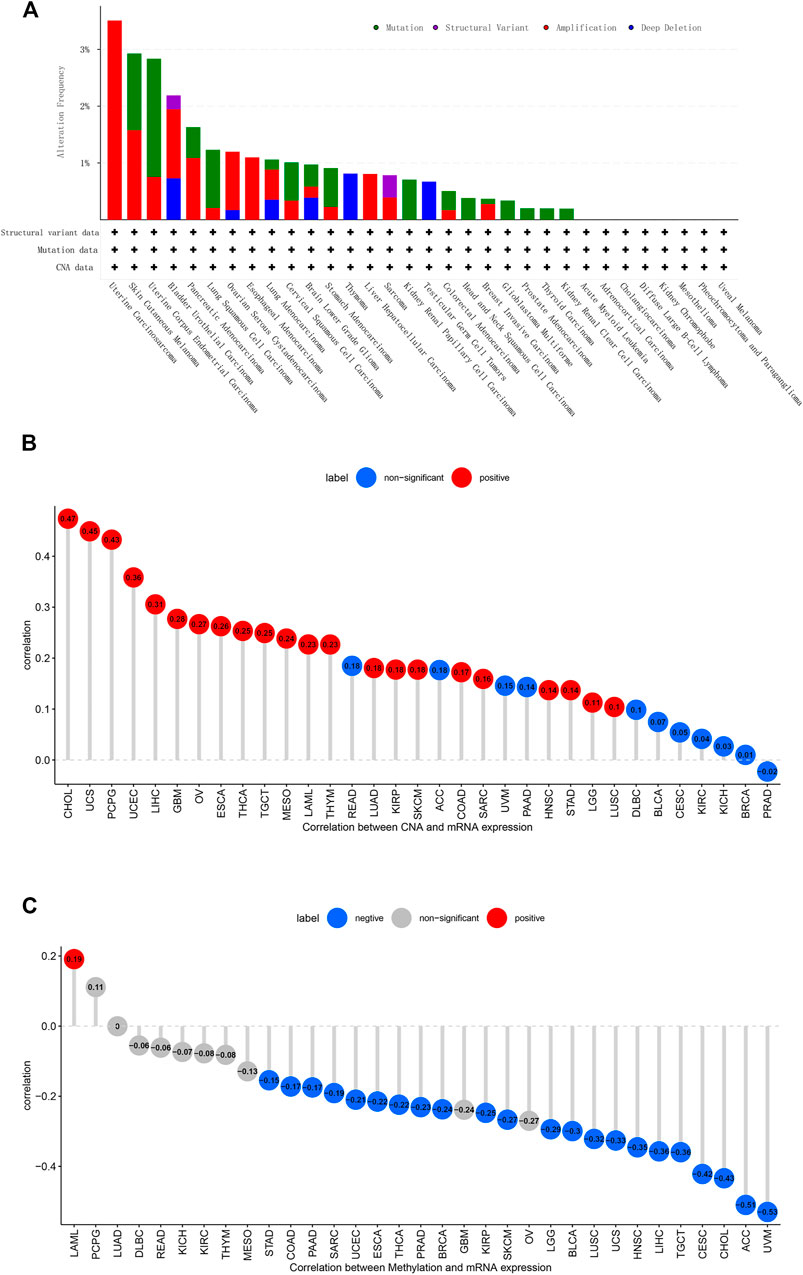
FIGURE 2. CNA and DNA methylation of C1QTNF6 in pan-cancer. (A) alteration frequency of C1QTNF6 in each cancer of TCGA. (B) C1QTNF6 expression and DNA copy number correlation profile in each cancer of TCGA. The deeper red color means significant cancer types (p < 0.05). (C) correlations between C1QTNF6 expression and DNA methylation, the blue represented negatively correlated, and the red represented positively correlated.
Subsequently, we investigated the prognostic significance of C1QTNF6 in pan-cancer. We also evaluated the overall survival (OS, Figure 3A), disease-specific survival (DSS, Figure 3B), disease-free interval (DFI, Figure 3C), and Progression-free interval (PFI, Figure 3D), respectively. Univariate Cox regression was used to eliminate the confounding bias. First, in overall survival, C1QTNF6 was an independent prognostic gene in KIRC, LUAD, LGG, KIRP, ACC, UVM, MESO, LIHC, HNSC, KICH, BLCA, THCA, and UCEC. Then, in the analysis of disease-specific survival, C1QTNF6 was an independent prognostic gene in KIRC, LGG, LUAD, MESO, KIRP, THCA, UVM, ACC, KICH, HNSC, LUSC, and LIHC. Subsequent analysis of disease-free survival showed that C1QTNF6 was an independent prognostic gene in UCEC, KIRP, LUAD, PAAD, and PRAD. Finally, PFS analysis showed that C1QTNF6 was an independent prognostic gene in KIRC, PRAD, LGG, UVM, LUAD, KICH, ACC, MESO, KIRP, UCEC, THCA, HNSC, and CESC. A value of Hazard ratio greater than 1 indicates a risk prognostic factor, it is found that C1QTNF6 predicts poor survival in most cancers. At the same time, univariate cox regression and multivariate cox regression analysis of C1QTNF6 and clinical features were carried out in tumors which suggest C1QTNF6 is independent prognostic factor in OS analysis, the multicox result demonstrate that C1QTNF6 is an independent factors associated with patients overall survival time in KIRC, LUAD, LGG, KIRP, ACC, UVM, MESO, LIHC, HNSC, which is generally consistent with the unicox results (Supplementary Figures S1A–M). For instance, Univariate Cox regression analysis showed that age,stage, C1QTNF6 were significantely associated with the prognosis of ACC, Multivariate Cox regression analysis showed that C1QTNF6 was an independent factor after adjusted for other clinical characteristic in ACC patients.
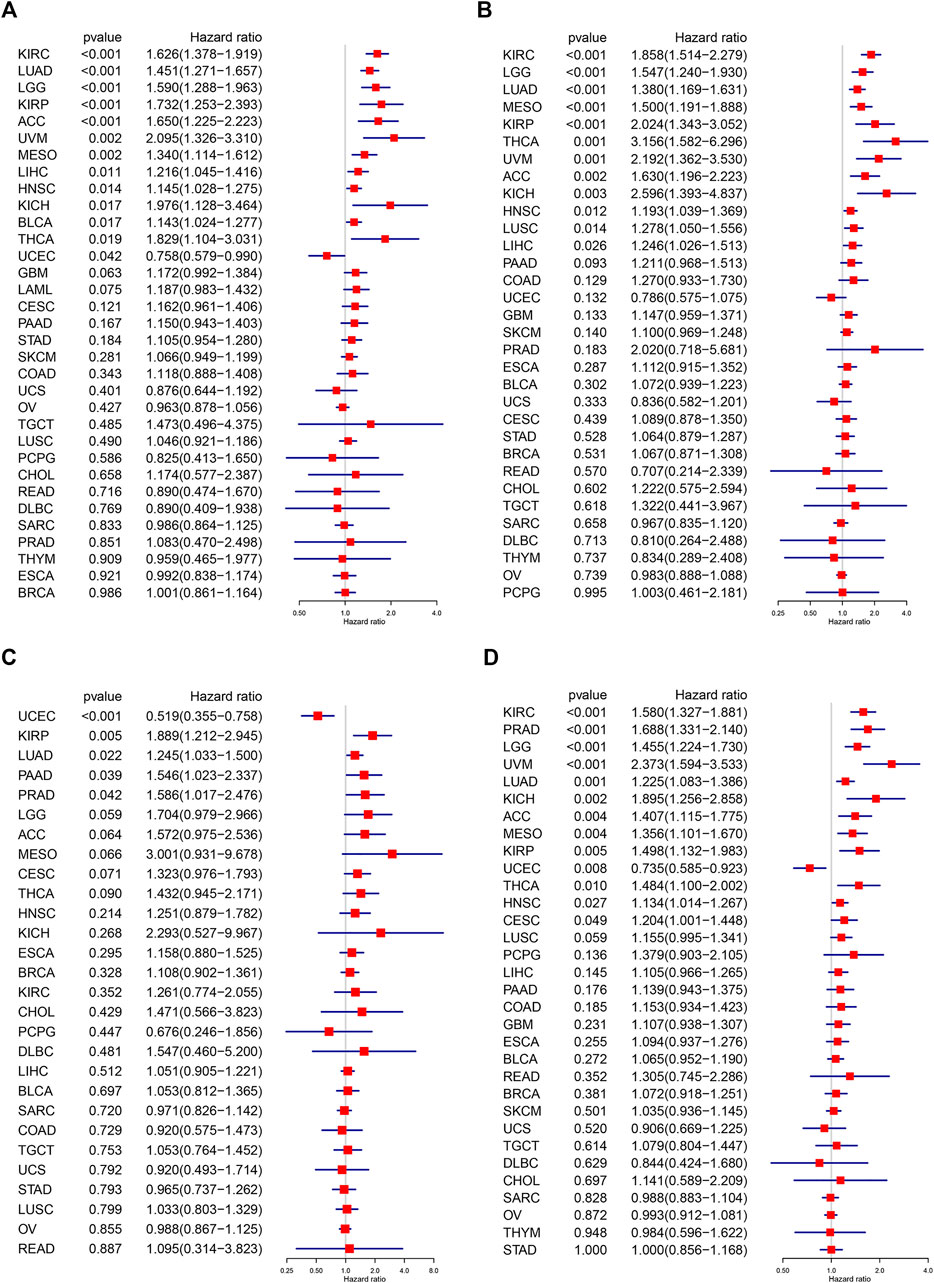
FIGURE 3. Univariate Cox regression analysis of C1QTNF6. The results were shown with a forest map for (A) OS; (B) DSS; (C) DFI; (D) PFI.
The correlation between the expression level of C1QTNF6 and the tumor pathway score was shown in Figure 4. We found that C1QTNF6 is positively correlated with most cancer super-pathways. Among these pathways, oncogenic pathways such as angiogenesis and hypoxia showed a strong correlation with our C1QTNF6 gene. A few pathways are negatively correlated with C1QTNF6 expressions, such as Oxidative phosphorylation, fatty acid metabolism, and bile acid metabolism pathways.
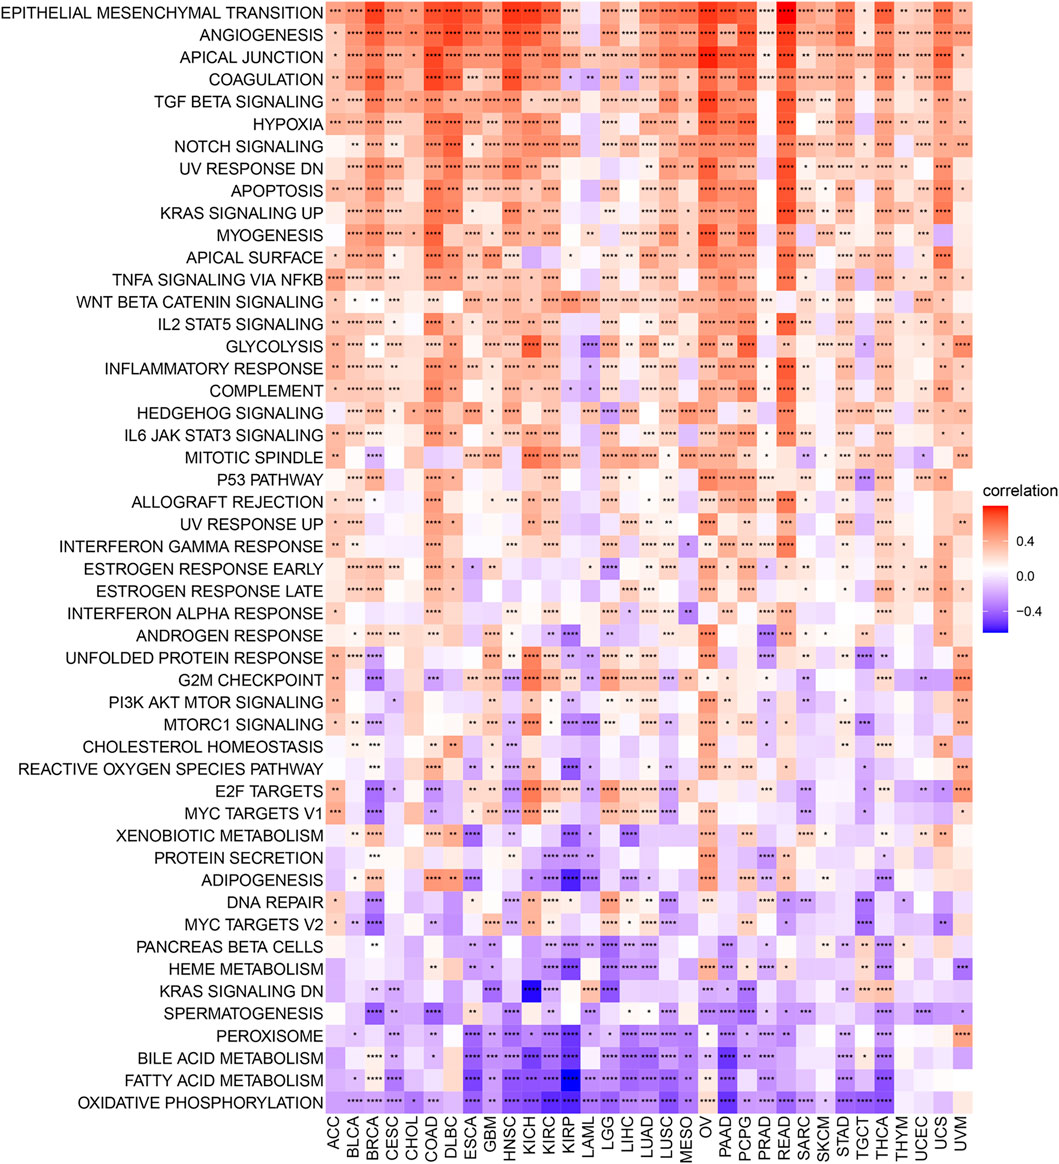
FIGURE 4. Heatmap for different hallmark pathway enrichment scores with C1QTNF6 expression level. *p < 0.05, **p < 0.01, ***p < 0.001, ****p < 0.0001.
We found that C1QTNF6 was strongly correlated with TME related pathways, such as EMT1, base excision, and mismatch repair pathways correlated with the onset and progression of cancer (Figure 5A). Additionally, the activation of these pathways was highly correlated with the onset and progression of cancer, and this was highly consistent with our results in Figure 4. C1QTNF6 gene expression was also significantly correlated with the immune checkpoint and CD8 T effector pathways (Figure 5A). The correlation between C1QTNF6 and the immune score is shown in Figure 5B. StromalScore, Estimatescore, and immuneScore were all associated with C1QTNF6. C1QTNF6 was found negatively correlated with These findings show that C1QTNF6 could play a critical function in the control of biological activity in the immune milieu. Meanwhile, we explored the association between the infiltration of immune cells and C1QTNF6 expression, and the findings were demonstrated in Supplementary Figure S2. We found the expression of C1QTNF6 was negatively correlated with most immune cells, including B cell, Neutrophil, and CD8_T, and positively correlated with Monocyte and Macrophage. Next, GSEA was performed for the purpose of further examining the association of various pathways, especially immune-related pathways, with C1QTNF6 in pan-cancer. The first 20 related pathways of GSEA are presented in the form of a mountain map, and immune-related pathways are marked in red (Figures 6A–H). For instance, in UCS, C1QTNF6 was associated with the immune system, cytokine pathways, antigen processing-presentation, neutrophil degranulation, and interleukin immunomodulatory responses. These results further illustrate the important role of C1QTNF6 in immune regulation.
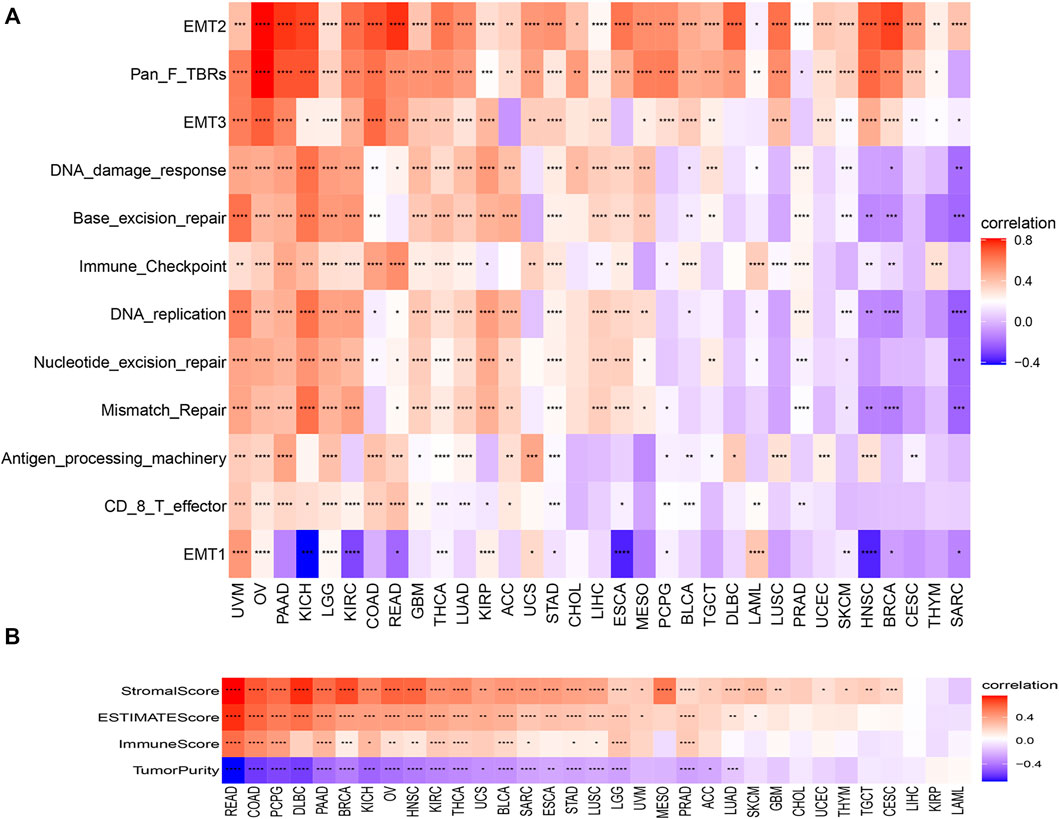
FIGURE 5. Tumor microenvironment role of C1QTNF6. (A) The correlations between the C1QTNF6 expression level and TMEp scores. (B) the correlations between the C1QTNF6 express level and ImmuneScore, StromalScore, and ESTIMATEscore. *p < 0.05, **p < 0.01, ***p < 0.001, ****p < 0.0001.
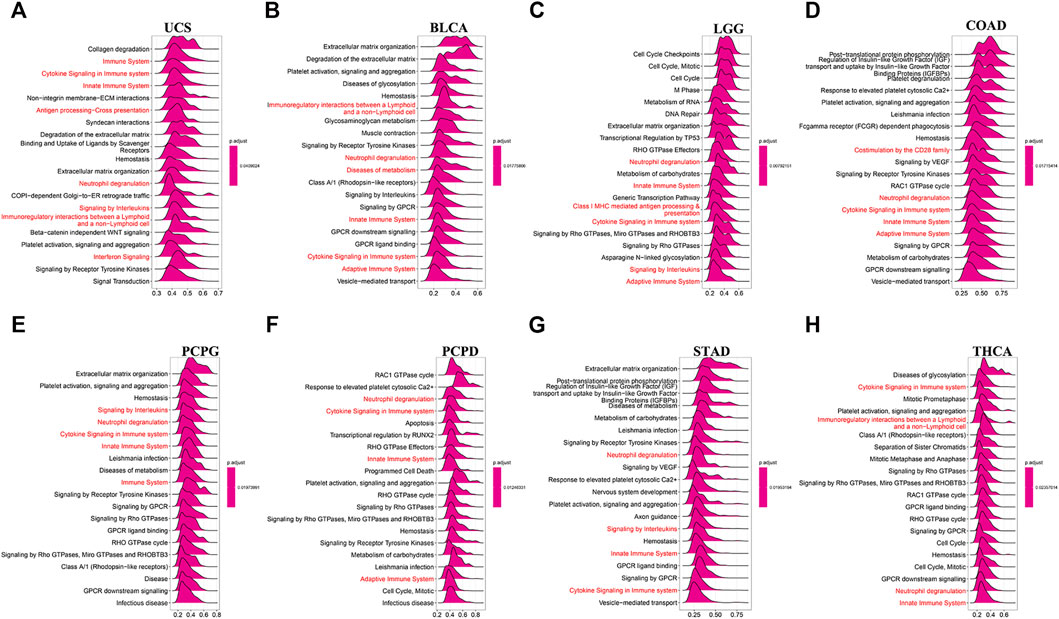
FIGURE 6. C1QTNF6’s GSEA results in TCGA pan-cancer. (A–H) The most 20 related pathways of GSEA are presented in the form of a mountain map, and immune-related pathways are marked in red.
We further explored the correlation between the C1QTNF6 gene and genes associated with immune cells in pan-cancer. The results showed that C1QTNF6 exhibited a positive association with most immunosuppressive genes, chemokines, and chemokine receptor genes (Figures 7A–C). Among the immunosuppressive genes, we found that the immune checkpoints including LAG3, PDCD1, CTLA4, and TIGIT, among the chemokines, there are CXCL12, CCL2, CCL26, and in chemokine receptors, we exhibited the CCR1, CCR10, CXCR4, etc.
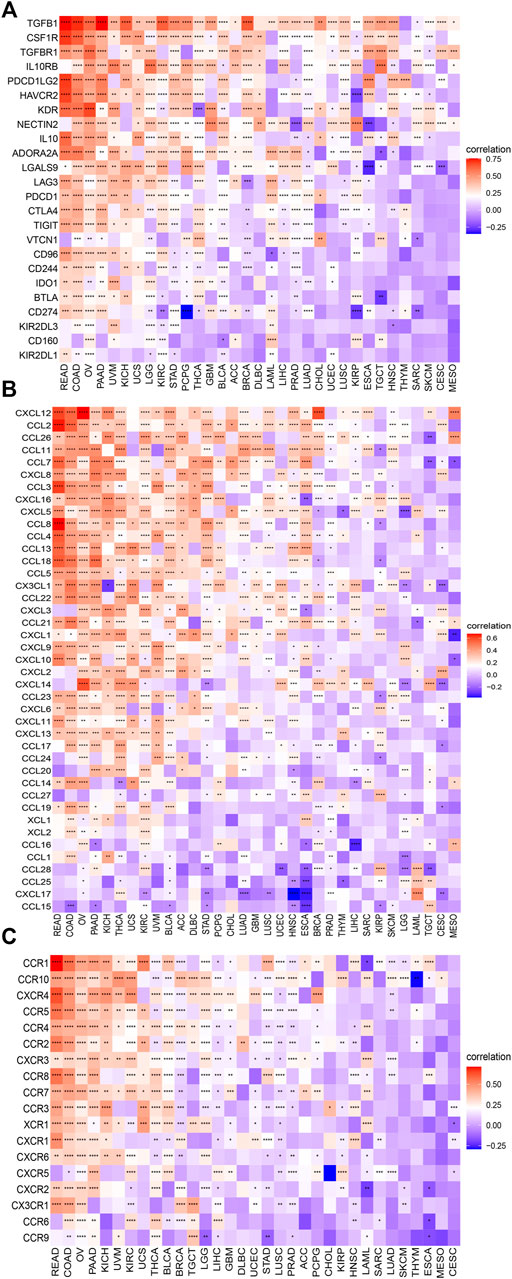
FIGURE 7. C1QTNF6 is correlated with immune-associated genes. The heatmap demonstrating the correlation between the C1QTNF6 expression level and (A) immunosuppressive genes. (B) chemokine genes. (C) chemokine receptors. *p < 0.05, **p < 0.01, ***p < 0.001, ****p < 0.0001.
A total of 198 drugs were identified as being associated with C1QTNF6. We showed the 6 drugs (Figure 8A) with the strongest positive correlation and the 6 drugs with the strongest negative correlation (only 6 negative, Figure 8B). The drugs that were identified to have positive correlation with C1QTNF6 were namely AZD1208 (R = 0.21, p = 5.91E-09), Daprinad (R = 0.21, p = 4.09E-05), crizotinib (R = 0.2, p = 2.38E-08), Vorinostat (R = 0.2, p = 2.17E-08), PD173074 (R = 0.19, p = 1.69E-07), and MK-8776 (R = 0.19, p = 1.30E-07). In addition, six drugs were identified to be negatively correlated with C1QTNF6, namely Sapitinib (R = -0.17, p = 1.85E-06), Dasatinib e-05 (R = -0.15, p = 4.22), Trametinib (R = 0.1, p = 0.0042), Osimertinib (R = -0.09, p = 0.015), AZD8186 (R = -0.09, p = 0.017), and Selumetinib (R = -0.07, p = 0.0495). The results of the complete drug sensitivity analysis were presented in Supplementary Table S1. The commonly used anticancer drug in clinical treatment including Oxaliplatin, Cyclophosphamide, Cytarabine, Cisplatin, Cytarabine, Vinorelbine, Sorafenib, Docetaxel, and Fluorouracil were all less effective (higher IC50 value) in High expression of C1QTNF6 groups (Supplementary Figure S3).
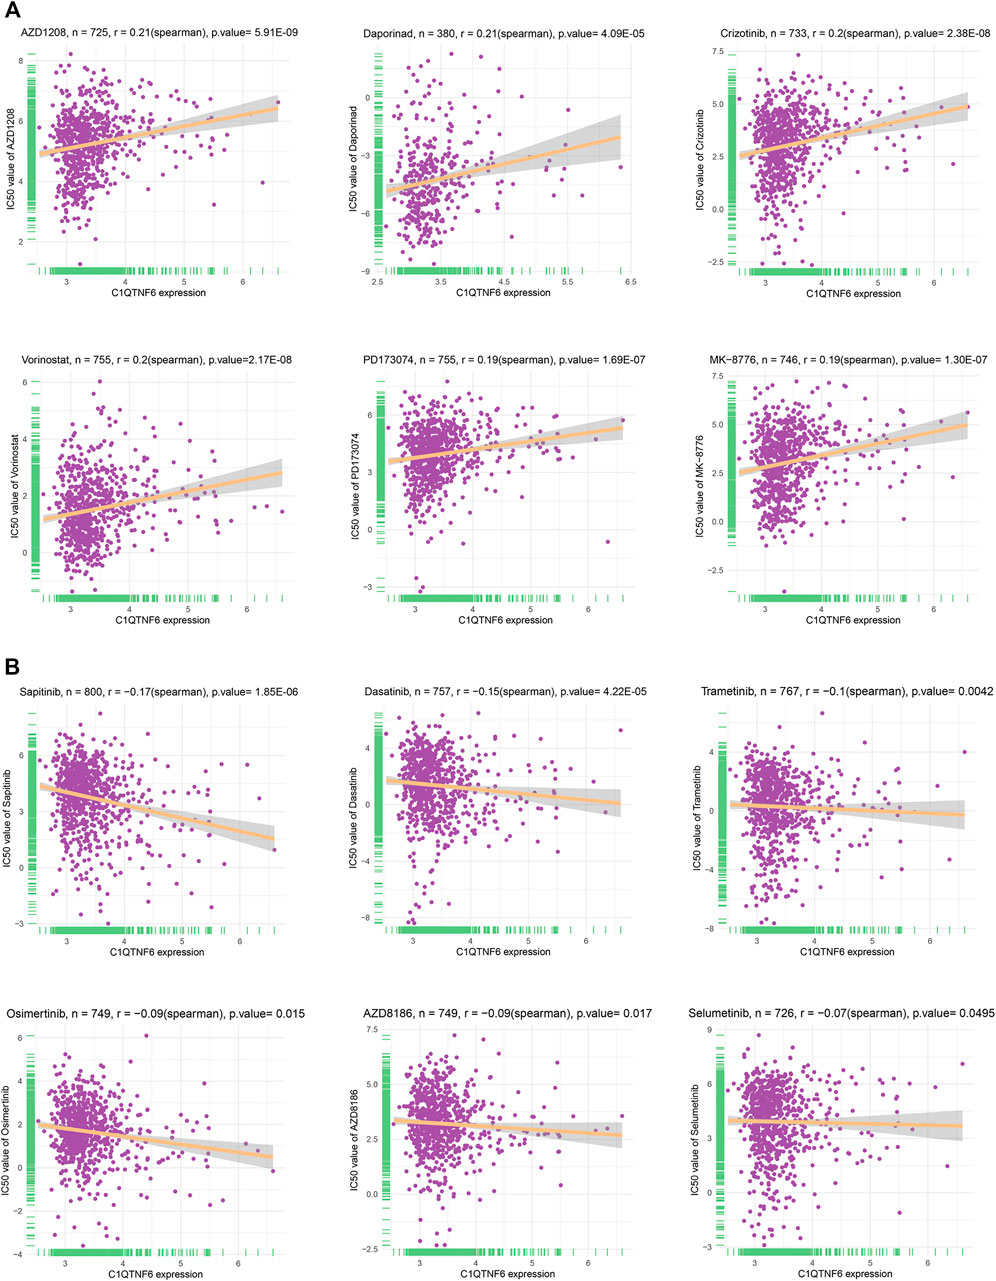
FIGURE 8. Drug sensitivity analysis in the form of correlation chart calculated by online tool GDSC2. (A) The top 6 positively correlated. (B) The only 6 negatively correlated.
With the development of high-throughput bioinformatics, people’s understanding of genes or genomes has reached a new level. Exploration of molecular characterization of disease and individual genetic composition can facilitate clinical scientists to diagnose and treat the disease, which also facilitates the development of drug research and development, especially in cancer research. The discovery of a few genetic biomarkers has limited aid in the diagnosis and treatment of cancer, and identifying more biomarkers or combinations of biomarkers is increasingly important. In this study, we explore the role of C1QTNF6 with comprehensive means using TCGA pan-cancer data.
Many studies have preliminarily elucidated the role of C1QTNF6 in cancer. Qu et al. found that C1QTNF6 is involved in promoting the proliferation and migration of gastric cancer cells and reducing apoptosis of gastric cancer cells (Qu et al., 2019). Han et al. found that C1QTNF6 may be an independent prognostic factor for lung adenocarcinoma (Han et al., 2019). Song et al. discovered that C1QTNF6 stimulates proliferation and attenuated apoptosis in oral squamous cell carcinoma (Song et al., 2021). Therefore, C1QTNF6 might serve an instrumental function in the occurrence and progression of cancer. However, there has not been a comprehensive analysis of the significance of C1QTNF6 in cancer.
We evaluated the C1QTNF6 expression level in pan-cancer data and discovered that C1QTNF6 is overexpressed in many types of cancer, such as LGG, LAML, LIHC, KIRP, LUAD, KIRC, LUSC, HNSC, PAAD, GBM, READ, ESCA, SARC, DLBC, SKCM, COAD, STAD, CHOL, THYM, BRCA, UCS, BLCA. Therefore, monitoring the expression level of C1QTNF6 may be an effective diagnostic method for these cancers. Subsequently, the mutation analysis found that the alteration frequency of C1QTNF6 in uterine carcinosarcoma was the highest. C1QTNF6 had a strong positive correlation with CNA in CHOL, UCS, and PCPG. This enriched our understanding of the functionality of C1QTNF6. Survival analysis showed that C1QTNF6 was an independent prognostic indicator for many tumors. Patient prognosis could be improved to a great extent as a result of this discovery. Analysis of the immune microenvironment revealed the role of C1QTNF6 in the immune environment including immune-related gene and immune cells infiltration. The final drug sensitivity analysis provided the strongest association with C1QTNF6. This provides an idea for targeting C1QTNF6 therapy.
Our study found that C1QTNF6 is associated with a variety of classical pathways in many tumors, including epithelial-mesenchymal transformation (EMT), angiogenesis, apical junction, TGF-β signaling pathway, hypoxia, and Notch pathway. For instance, C1QTNF6 had a significant correlation with EMT and angiogenesis. EMT has been widely recognized as a pathway through which cancer cells acquire malignant biological functions (Lamouille et al., 2014; Dongre and Weinberg, 2019). Through EMT, the potential of cancer cells to proliferate, invade and migrate is activated (Owusu-Akyaw et al., 2019; Pastushenko and Blanpain, 2019). In addition, EMT has been linked to drug resistance in many tumors (Du and Shim, 2016). Therefore, our study found a strong correlation between C1QTNF6 and EMT, which could explain the poor prognosis after overexpression of C1QTNF6 in many tumors. Angiogenesis which is one of the hallmarks of tumors is also necessary for tumor proliferation and invasion (Ramjiawan et al., 2017; Li et al., 2019). At present, antiangiogenic drugs have achieved preliminary results in the treatment of diverse solid tumors, but a considerable number of patients lack the persistent response of antiangiogenic drugs. Besides, our study found a significant positive correlation between C1QTNF6 and angiogenesis, which is of reference value for us to further explore the mechanism of tumor angiogenesis and develop new therapeutic methods. In addition, TFN-ɑ SIGNALING VIA NFK-β and IL2 STAT5 SIGNALING also showed a strong relationship with the C1QTNF6 gene. The biological activity of IL2 is related to T cell activation, CD8+ cytotoxicity, B cell activation, and the antitumor effects of enhanced macrophages, which all have been widely reported (Abbas et al., 2018).
Immune reprogramming is one of the hallmarks of cancer. Several therapies based on cancer immunity have been used clinically, such as immune checkpoints (Zhou et al., 2021). For instance, results of the bladder cancer clinical trial BLASST-1 showed that Nivolumab (Opdivo) in combination with gemcitabine and cisplatin neoadjuvant therapy in patients with muscle-infiltrating bladder cancer (MIBC) achieved a significant effect: a pathology complete response rate (pCR) of 49% (Gupta et al., 2020). Therefore, identifying the changes in the cancer-immune microenvironment not only helps us understand the pathogenesis of cancer but also promotes the development of cancer immunotherapy (Huang et al., 2018). According to the findings of the present research, C1QTNF6 serves a prominent function in the immune milieu of cancer cells. It is significantly linked to diverse immune pathways and immune components. In the TME, stromal and immune cells are the two most crucial kinds of non-tumor constituents, and both have been considered to play a crucial role in the diagnosis and prognostic evaluation of cancers. In tumors, immune and stromal scores can be used to aid in the quantification of immunological and stromal components that are present (Bruni et al., 2020). C1QTNF6 shows a great correlation with the ESTIMATEscore, StromalScore, and ImmuneScore. Besides, C1QTNF6 is obviously correlated with many immune checkpoints including LAG3, PDCD1, CTLA4, which suggested that C1QTNF6 may act as a new immune checkpoint for tumor immunity. Meanwhile, our results show that C1QTNF6 also have markable relation with chemokines and chemokines receptor such as CCL22, CCL5, etc. CCL22 secreted by the M2 macrophages may recruit Treg T cells, which suppressed the immune response (Atri et al., 2018). CCL5 is a key chemokine for CD8+ T cells to enter tumor cells (Dangaj et al., 2019). C1QTNF6 shows a significant association with the infiltration of monocyte, Macrophage, B cells, Monitoring the C1QTNF6 expression may reflect the degree of infiltration of these immune cells, it is noteworthy that C1QTNF6 is not manifest a strong correlation to all the immune cells because the activation, chemotaxis, and infiltration of immune cells are regulated by gene networks, especially in pan-cancer analysis. The above results indicate that C1QTNF6 has significance for further exploration in immune regulation in the tumor microenvironment. These findings were further validated by the GSEA and correlation exploration between C1QTNF6 and immune cells. In the drug sensitivity analysis, we found higher C1QTNF6 expression in tumors indicates a higher IC50 value for most drugs in the GDSC2 database, which shows the measurement of C1QTNF6 expression level may act as a reliable indicator for clinical therapy. P-gp, a well-known multidrug resistance protein, encoded by MDR1, it serve as medicine pump by reverse the concentration of lipophilic drugs with positive charge inside the cell to the outside of the cell, so that the intracellular chemotherapy drugs can not reach the effective concentration and develop drug resistance (Robey et al., 2018). In non-small-cell-lung cancer, MET amplification is thought to be responsible for resistance to targeted drugs in EGFR-mutation-positive patients, which results in malignant biological behavior of tumors, such as invasion, metastasis, escape from apoptosis (Coleman et al., 2021). Combining with the C1QTNF6 expression and its drug sensitivity analysis (positively correlated and negatively correlated), we may establish risk stratification for cancer patients, which optimize the development and application of anti-cancer drugs. These findings suggest that C1QTNF6 may be a potential target for cancer therapy, which make contribution to study the mechanisms of anti-cancer drugs resistance.
Cancer immunotherapy has recently been in full swing. Effective identification of potential tumor antigens has contributed to the development of immunotherapy. These tumor antigens are often associated with more copy number mutations or methylation changes. Our study provides the mutation landscape of C1QTNF6 in pan-cancer and the correlation landscape with copy number variation and methylation. Furthermore, we identified a correlation between C1QTNF6 and chemokine receptors. All these results provide a reference that C1QTNF6 can be used not only as an indicator of the TME, but also as a highly effective indicator of immune indicators.
Overall, our study is the first pan-cancer analysis of C1QTNF6. Compared with other studies, our study provided a landscape of the prognosis and immunity correlation of C1QTNF6 in a variety of cancers, which is conducive to the precise treatment of cancer. However, there are also limitations in our study. We lack experiments to verify our conclusions, which we will improve in the future.
Overall, we identified the value of C1QTNF6 in pan-cancer by multiple analyses. C1QTNF6, as a promising prognostic biomarker, manifests its promising prospect in immunoregulation and a potential target for tumor therapy.
Publicly available datasets were analyzed in this study. This data can be found here: This study used online resources, which are available from the TCGA database, GTEx through USUC Xena at https://xena.ucsc.edu, the cBioportal database at http://www.cbioportal.org/, and GDSC2 at https://www.cancerrxgene.org/.
WL, JZ, and TX conceived the study. WL wrote the paper and drew the figures. The data were evaluated by BW and XH. YT and YY edited and reviewed the manuscript. YY and XH were in charge of sourcing the necessary funds. All the authors made significant contributions to the present research and gave their approval to the final version of the manuscript submitted for publication.
This work was supported by the Guangzhou Science and Technology Plan Project (grant number 202102020034) and the National Natural Science Foundation of China (grant number 81773354).
The authors declare that the research was conducted in the absence of any commercial or financial relationships that could be construed as a potential conflict of interest.
All claims expressed in this article are solely those of the authors and do not necessarily represent those of their affiliated organizations, or those of the publisher, the editors and the reviewers. Any product that may be evaluated in this article, or claim that may be made by its manufacturer, is not guaranteed or endorsed by the publisher.
We would like to thank the Cancer Genome Atlas (TCGA) working groups for kindly sharing data. We also thank R Development Core Team and the R community (http://www.r-project.org) for the time and effort they put into creating and optimizing R.
The Supplementary Material for this article can be found online at: https://www.frontiersin.org/articles/10.3389/fphar.2022.855485/full#supplementary-material
Supplementary Figure S1 | Univariate cox regression and multivariate cox regression analysis of C1QTNF6 and other clinical features in KIRC, LUAD, LGG, KIRP, ACC, UVM, MESO, LIHC, HNSC, KICH, BLCA, THCA, UCEC.
Supplementary Figure S2 | Correlation between the expression of C1QTNF6 and the infiltrating levels of immune cell. *p < 0.05, **p < 0.01, ***p < 0.001, ****p < 0.0001.
Supplementary Figure S3 | Drug sensitivity of commonly used anti-cancer drugs in clinical use in the forms of boxplot charts calculated by online tool GDSC2. (A–I) Oxaliplatin, Cyclophosphamide, Cytarabine, Cisplatin, Cytarabine, Vinorelbine, Sorafenib, Docetaxel, Fluorouracil.
Supplementary Table S1 | Drug sensitivity differences according to the C1QTNF6 expression of all the 198 drugs in the GDSC2 database.
Abbas, A. K., Trotta, E., R Simeonov, D., Marson, A., and Bluestone, J. A. (2018). Revisiting IL-2: Biology and Therapeutic Prospects. Sci. Immunol. 3, 3. doi:10.1126/sciimmunol.aat1482
Ai, L., Xu, A., and Xu, J. (2020). Roles of PD-1/pd-L1 Pathway: Signaling, Cancer, and beyond. ADV. EXP. MED. BIOL. 1248, 33–59. doi:10.1007/978-981-15-3266-5_3
Atri, C., Guerfali, F. Z., and Laouini, D. (2018). Role of Human Macrophage Polarization in Inflammation during Infectious Diseases. INT. J. MOL. SCI. 19, 19. doi:10.3390/ijms19061801
Biecek, A. K. A. M. (2020). Survminer: Drawing Survival Curves Using ‘ggplot2'. Available at: https://CRAN.R-project.org/package=survminer.
Blum, A., Wang, P., and Zenklusen, J. C. (2018). SnapShot: TCGA-Analyzed Tumors. CELL 173, 530. doi:10.1016/j.cell.2018.03.059
Bruni, D., Angell, H. K., and Galon, J. (2020). The Immune Contexture and Immunoscore in Cancer Prognosis and Therapeutic Efficacy. NAT. REV. CANCER 20, 662–680. doi:10.1038/s41568-020-0285-7
Carmeliet, P. (2005). VEGF as a Key Mediator of Angiogenesis in Cancer. Oncology 69, 4–10. doi:10.1159/000088478
Coleman, N., Hong, L., Zhang, J., Heymach, J., Hong, D., and Le, X. (2021). Beyond Epidermal Growth Factor Receptor: MET Amplification as a General Resistance Driver to Targeted Therapy in Oncogene-Driven Non-small-cell Lung Cancer. ESMO Open 6, 100319. doi:10.1016/j.esmoop.2021.100319
Dangaj, D., Bruand, M., Grimm, A. J., Ronet, C., Barras, D., Duttagupta, P. A., et al. (2019). Cooperation between Constitutive and Inducible Chemokines Enables T Cell Engraftment and Immune Attack in Solid Tumors. CANCER CELL 35, 885–e10. doi:10.1016/j.ccell.2019.05.004
Davies, H., Bignell, G. R., Cox, C., Stephens, P., Edkins, S., Clegg, S., et al. (2002). Mutations of the BRAF Gene in Human Cancer. NATURE 417, 949–954. doi:10.1038/nature00766
Dongre, A., and Weinberg, R. A. (2019). New Insights into the Mechanisms of Epithelial-Mesenchymal Transition and Implications for Cancer. Nat. Rev. Mol. Cell Biol. 20, 69–84. doi:10.1038/s41580-018-0080-4
Du, B., and Shim, J. S. (2016). Targeting Epithelial-Mesenchymal Transition (EMT) to Overcome Drug Resistance in Cancer. MOLECULES 21, 21. doi:10.3390/molecules21070965
Gupta, S., Sonpavde, G., Christopher, J. W., McGregor, B. A., Gupta, S., and Maughan, B. L. (2020). Results from BLASST-1 (Bladder Cancer Signal Seeking Trial) of Nivolumab, Gemcitabine, and Cisplatin in Muscle Invasive Bladder Cancer Undergoing Cystectomy. J. Clin. Oncol. 38. ASCO GU.
Han, M., Wang, B., Zhu, M., and Zhang, Y. (2019). C1QTNF6 as a Novel Biomarker Regulates Cellular Behaviors in A549 Cells and Exacerbates the Outcome of Lung Adenocarcinoma Patients. In Vitro Cell Dev. Biol. Anim. 55, 614–621. doi:10.1007/s11626-019-00377-w
Han, Y., Liu, D., and Li, L. (2020). PD-1/PD-L1 Pathway: Current Researches in Cancer. AM. J. CANCER RES. 10, 727–742.
Hanahan, D., and Weinberg, R. A. (2011). Hallmarks of Cancer: the Next Generation. CELL 144, 646–674. doi:10.1016/j.cell.2011.02.013
Hänzelmann, S., Castelo, R., and Guinney, J. (2013). GSVA: Gene Set Variation Analysis for Microarray and RNA-Seq Data. BMC BIOINFORMATICS 14, 7. doi:10.1186/1471-2105-14-7
Huang, Y., Kim, B. Y. S., Chan, C. K., Hahn, S. M., Weissman, I. L., and Jiang, W. (2018). Improving Immune-Vascular Crosstalk for Cancer Immunotherapy. NAT. REV. IMMUNOL. 18, 195–203. doi:10.1038/nri.2017.145
Kroemer, G., and Pouyssegur, J. (2008). Tumor Cell Metabolism: Cancer's Achilles' Heel. CANCER CELL 13, 472–482. doi:10.1016/j.ccr.2008.05.005
Lamouille, S., Xu, J., and Derynck, R. (2014). Molecular Mechanisms of Epithelial-Mesenchymal Transition. Nat. Rev. Mol. Cell Biol. 15, 178–196. doi:10.1038/nrm3758
Li, S., Xu, H. X., Wu, C. T., Wang, W. Q., Jin, W., Gao, H. L., et al. (2019). Angiogenesis in Pancreatic Cancer: Current Research Status and Clinical Implications. ANGIOGENESIS 22, 15–36. doi:10.1007/s10456-018-9645-2
Macheret, M., and Halazonetis, T. D. (2015). DNA Replication Stress as a Hallmark of Cancer. Annu. Rev. Pathol. 10, 425–448. doi:10.1146/annurev-pathol-012414-040424
Owusu-Akyaw, A., Krishnamoorthy, K., Goldsmith, L. T., and Morelli, S. S. (2019). The Role of Mesenchymal-Epithelial Transition in Endometrial Function. HUM. REPROD. UPDATE 25, 114–133. doi:10.1093/humupd/dmy035
Park, J. H., Pyun, W. Y., and Park, H. W. (2020). Cancer Metabolism: Phenotype, Signaling and Therapeutic Targets. CELLS 9, 2308. doi:10.3390/cells9102308
Pastushenko, I., and Blanpain, C. (2019). EMT Transition States during Tumor Progression and Metastasis. Trends. CELL BIOL. 29, 212–226. doi:10.1016/j.tcb.2018.12.001
Qin, W., Hu, L., Zhang, X., Jiang, S., Li, J., Zhang, Z., et al. (2019). The Diverse Function of PD-1/PD-L Pathway beyond Cancer. FRONT. IMMUNOL. 10, 2298. doi:10.3389/fimmu.2019.02298
Qu, H. X., Cui, L., Meng, X. Y., Wang, Z. J., Cui, Y. X., Yu, Y. P., et al. (2019). C1QTNF6 Is Overexpressed in Gastric Carcinoma and Contributes to the Proliferation and Migration of Gastric Carcinoma Cells. INT. J. MOL. MED. 43, 621–629. doi:10.3892/ijmm.2018.3978
Ramjiawan, R. R., Griffioen, A. W., and Duda, D. G. (2017). Anti-angiogenesis for Cancer Revisited: Is There a Role for Combinations with Immunotherapy? ANGIOGENESIS 20, 185–204. doi:10.1007/s10456-017-9552-y
Robey, R. W., Pluchino, K. M., Hall, M. D., Fojo, A. T., Bates, S. E., and Gottesman, M. M. (2018). Revisiting the Role of ABC Transporters in Multidrug-Resistant Cancer. NAT. REV. CANCER 18, 452–464. doi:10.1038/s41568-018-0005-8
Simko, T. W. A. V. (2021). R Package ‘corrplot': Visualization of a Correlation Matrix (Version 0.90). Available at: https://github.com/taiyun/corrplot.
Song, X., Li, L., Shi, L., Liu, X., Qu, X., Wei, F., et al. (2021). C1QTNF6 Promotes Oral Squamous Cell Carcinoma by Enhancing Proliferation and Inhibiting Apoptosis. CANCER CELL INT. 21, 666. doi:10.1186/s12935-021-02377-x
Takeuchi, T., Adachi, Y., and Nagayama, T. (2011). Expression of a Secretory Protein C1qTNF6, a C1qTNF Family Member, in Hepatocellular Carcinoma. Anal. Cell Pathol (Amst) 34, 113–121. doi:10.3233/ACP-2011-009
Verhaak, K. Y. A. H. (2016). Estimate: Estimate of Stromal and Immune Cells in Malignant Tumor Tissue from Expression Data. Available at: https://R-Forge.R-project.org/projects/estimate/.
Wang, J., Zhu, M., Ye, L., Chen, C., She, J., and Song, Y. (2020). MiR-29b-3p Promotes Particulate Matter-Induced Inflammatory Responses by Regulating the C1QTNF6/AMPK Pathway. Aging (Albany NY) 12, 1141–1158. doi:10.18632/aging.102672
Yu, G., Wang, L. G., Han, Y., and He, Q. Y. (2012). clusterProfiler: an R Package for Comparing Biological Themes Among Gene Clusters. OMICS 16, 284–287. doi:10.1089/omi.2011.0118
Zhang, W., and Feng, G. (2021). C1QTNF6 Regulates Cell Proliferation and Apoptosis of NSCLC In Vitro and In Vivo. Biosci. Rep. 41, 41. doi:10.1042/BSR20201541
Keywords: pan-cancer analysis, C1QTNF6, prognosis, immune infiltration, tumor microenvironment, drug sensitivity
Citation: Liu W, Zhang J, Xie T, Huang X, Wang B, Tian Y and Yuan Y (2022) C1QTNF6 is a Prognostic Biomarker and Related to Immune Infiltration and Drug Sensitivity: A Pan-Cancer Analysis. Front. Pharmacol. 13:855485. doi: 10.3389/fphar.2022.855485
Received: 15 January 2022; Accepted: 17 February 2022;
Published: 23 March 2022.
Edited by:
Jian Zhang, Southern Medical University, ChinaReviewed by:
Qichun Wei, Zhejiang University, ChinaCopyright © 2022 Liu, Zhang, Xie, Huang, Wang, Tian and Yuan. This is an open-access article distributed under the terms of the Creative Commons Attribution License (CC BY). The use, distribution or reproduction in other forums is permitted, provided the original author(s) and the copyright owner(s) are credited and that the original publication in this journal is cited, in accordance with accepted academic practice. No use, distribution or reproduction is permitted which does not comply with these terms.
*Correspondence: Yawei Yuan, eXVhbnlhd2VpQGd6aG11LmVkdS5jbg==; Yunhong Tian, dGlhbnl1bmhvbmcyMDIwQGd6aG11LmVkdS5jbg==
†These authors have contributed equally to this work
Disclaimer: All claims expressed in this article are solely those of the authors and do not necessarily represent those of their affiliated organizations, or those of the publisher, the editors and the reviewers. Any product that may be evaluated in this article or claim that may be made by its manufacturer is not guaranteed or endorsed by the publisher.
Research integrity at Frontiers
Learn more about the work of our research integrity team to safeguard the quality of each article we publish.