
95% of researchers rate our articles as excellent or good
Learn more about the work of our research integrity team to safeguard the quality of each article we publish.
Find out more
ORIGINAL RESEARCH article
Front. Pharmacol. , 11 April 2022
Sec. Drug Metabolism and Transport
Volume 13 - 2022 | https://doi.org/10.3389/fphar.2022.844567
 Fan Wu1†Xiao-Shan Zhang2†Ying Dai1
 Zi-Ye Zhou1Chun-Hong Zhang1Lu Han2Fang-Min Xu2Ye-Xuan Wang2
 Da-Wei Shi1Guan-Yang Lin1
 Xu-Ben Yu1*Fang Chen3*
Background: Linezolid is associated with myelosuppression, which may cause failure in optimally treating bacterial infections. The study aimed to define the pharmacokinetic/toxicodynamic (PK/TD) threshold for critically ill patients and to identify a dosing strategy for critically ill patients with renal insufficiency.
Methods: The population pharmacokinetic (PK) model was developed using the NONMEM program. Logistic regression modeling was conducted to determine the toxicodynamic (TD) threshold of linezolid-induced myelosuppression. The dosing regimen was optimized based on the Monte Carlo simulation of the final model.
Results: PK analysis included 127 linezolid concentrations from 83 critically ill patients at a range of 0.25–21.61 mg/L. Creatinine clearance (CrCL) was identified as the only covariate of linezolid clearance that significantly explained interindividual variability. Thirty-four (40.97%) of the 83 patients developed linezolid-associated myelosuppression. Logistic regression analysis showed that the trough concentration (Cmin) was a significant predictor of myelosuppression in critically patients, and the threshold for Cmin in predicting myelosuppression with 50% probability was 7.8 mg/L. The Kaplan–Meier plot revealed that the overall median time from the initiation of therapy to the development of myelosuppression was 12 days. Monte Carlo simulation indicated an empirical dose reduction to 600 mg every 24 h was optimal to balance the safety and efficacy in critically ill patients with CrCL of 30–60 ml/min, 450 mg every 24 h was the alternative for patients with CrCL <30 ml/min, and 600 mg every 12 h was recommended for patients with CrCL ≥60 ml/min.
Conclusion: Renal function plays a significant role in linezolid PKs for critically ill patients. A dose of 600 mg every 24 h was recommended for patients with CrCL <60 ml/min to minimize linezolid-induced myelosuppression.
Critical infection is recognized as an important determinant of outcome for patients in intensive care units (ICUs). Initial appropriate anti-infective therapy is associated with significantly improved clinical outcomes (Kollef et al., 1999; MacArthur et al., 2004; Kumar et al., 2006). However, achieving adequate exposure is challenging for critically ill patients because a variety of pathophysiological changes may significantly influence serum drug concentration.
Linezolid is predominantly metabolized through the oxidation of its morpholine ring to an inactive form by nonenzymatic oxidative reactions (Zurenko et al., 1996). According to the label sheet, the pharmacokinetics (PKs) of linezolid is insignificantly altered by patients’ age, gender, or by the presence of renal or hepatic insufficiency. Consequently, no dose adjustments are recommended for patients at any stage of renal dysfunction, including hemodialysis. However, the clearance (CL) of linezolid was found to increase by 50% during hemodialysis (Brier et al., 2003). Similarly, linezolid concentrations were significantly higher in patients with renal insufficiency than in those without (Wu et al., 2006; Matsumoto et al., 2009; Tsuji et al., 2011; Pea et al., 2012; Tsuji et al., 2013; Cossu et al., 2014; Matsumoto et al., 2014; Crass et al., 2019).
Myelosuppression, which can result in thrombocytopenia and anemia, is the most frequent adverse effect in patients receiving linezolid. Thrombocytopenia exhibits the highest incidence, occurring in >30% of patients undergoing linezolid therapy (Lin et al., 2006; Wu et al., 2006; Ikuta et al., 2011; Takahashi et al., 2011; Nukui et al., 2013; Dong et al., 2014; Hirano et al., 2014). The incidence of anemia among such patients is 2.8–47.3% (Senneville et al., 2004; Lin et al., 2006; Takahashi et al., 2011; Pea et al., 2012). Risk factors for the development of thrombocytopenia during linezolid therapy include renal insufficiency (Lin et al., 2006; Ikuta et al., 2011; Takahashi et al., 2011; Hirano et al., 2014), long-term linezolid administration (Gerson et al., 2002; Takahashi et al., 2011), low baseline platelet count (Niwa et al., 2009; Cattaneo et al., 2013; Dong et al., 2014), and low body weight (Niwa et al., 2009; Dong et al., 2014). Similarly, the risk factors for linezolid-induced anemia include renal insufficiency, age, and low baseline hemoglobin count (Wu et al., 2006; Tsuji et al., 2011). In addition, renal impairment has been identified as a significant factor for elevated linezolid exposure, which was the main cause of myelosuppression (Morata et al., 2016; Pea et al., 2017). A recent study pointed out that the linezolid dosing in renal impairment patients should be reappraised to improve safety (Crass et al., 2019). However, this study was conducted in a population that did not include critically ill patients. Besides, the recommended dosage in patients with renal impairment only achieved approximately 65% of the therapeutic target. Therefore, a dose modification and more frequent monitoring of linezolid exposure are necessary for critically ill patients.
The present study aimed to define the therapeutic range based on linezolid trough concentration in critically ill patients. The application of drug therapeutic monitoring based on single blood sampling is much more convenient in clinics than monitoring AUC. We also determined a dosage modification for critically ill patients with renal impairment.
This was a retrospective, observational study of hospitalized critically ill patients receiving linezolid for confirmed or suspected multiresistant Gram-positive bacterial infections from January 2018 to December 2019 at the First Affiliated Hospital of Wenzhou Medical University. The inclusion criteria were as follows: 1) patients receiving intensive care aged ≥18 years with confirmed or suspected Gram-positive bacterial infections; 2) patients who received intravenous linezolid for at least 3 days; and 3) patients for whom at least one steady-state concentration of linezolid was collected. The exclusion criteria were as follows: 1) patients who received renal replacement therapy or extracorporeal membrane oxygenation; 2) patients who died within 24 h after being treated with linezolid; 3) patients with baseline PLT <75 × 109 cells//L; 4) patients with baseline hemoglobin <6.8 g/dl for males or <6 g/dl for females; 5) patients with baseline absolute neutrophil count <500 cells/μl; and 6) patients with baseline TBIL > 5 times the upper limit of normal. The baseline was defined at the initiation of linezolid therapy.
The study was designed in accordance with legal requirements and the Declaration of Helsinki and was approved by the Ethical Committees of the First Affiliated Hospital of Wenzhou Medical University, China [(2021)034], registered at the Chinese Clinical Trial Registry (ChiCTR2100047882). The informed consent was free passed by the Ethics Committee in Clinical Research (ECCR) of the First Affiliated Hospital of Wenzhou Medical University.
Routine therapeutic drug monitoring (TDM) data of linezolid were retrospectively obtained from a database maintained at the Department of Pharmacy. The decision to administer linezolid and its dosing regimens (dose amount, dosing interval, duration of intravenous administration, and duration of therapy) were made by the attending physician. An opportunistic sampling strategy was performed when a steady-state concentration of linezolid has been achieved (at least 3 days from the start of treatment). Most of the TDM samples collected were peak or trough concentrations. The concentration–time profile of linezolid for the included patients is shown in Supplementary Figure S1. The exact time of linezolid treatment and TDM sampling were able to be indexed.
Plasma samples were separated by centrifugation for 5 min at 15,000 rpm and were determined within 24 h after sampling. Quantification of the plasma concentration of linezolid was performed using a validated high-performance liquid chromatography–tandem mass spectrometry (LC-MS/MS) assay (Phillips et al., 2001). Intra- and inter-day assay coefficients of variation were <10%, and the lower limit of quantification was 0.1 mg/L. Individual laboratory parameters and demographic data of patients, including gender, age, height, body weight (WT), white blood cell count (WBC), hemoglobin (Hb), platelet count (PLT), total bilirubin (TBIL), serum albumin (ALB), alanine aminotransferase (ALT), aspartate aminotransferase (AST), and serum creatinine (SCr), were collected. CrCL was calculated using the Cockcroft–Gault equation. Data organization and visualization were performed using R (version 3.6.1) and R Studio (version 1.3.1093).
Myelosuppression was defined as follows: 1) thrombocytopenia: PLT <125 × 109 cells/L and a decrease of ≥25% PLT in comparison with the baseline levels; 2) anemia: a reduction of ≥25% of Hb compared with the baseline. The baseline levels were defined as the hematological parameters at the initiation of linezolid therapy.
Population PK analysis was performed using the nonlinear mixed effects modeling program NONMEM (version 7.4, Icon Development Solutions, Ellicott City, MD, United States) and Pirana (version 2.9.7). R (version 3.6.0) and Xpose (version 4.3.2) software packages were applied to generate diagnostic plots. The first-order conditional estimation method with inter- and intra-subject variability was used throughout the model development procedure. One- and two-compartment structural models with first-order elimination were explored for the linezolid plasma concentration–time profiles. Between-subject variability (BSV) was modeled using exponential function. Residual variability was assessed using additive, proportional, and combined (additive plus proportional) error models. The base model was selected based on the visual inspection of diagnostic plots and various goodness-of-fit criteria, including precision and plausibility of parameter estimation, improvement of the objective function value (OFV), Akaike information criteria (AIC), and Bayesian information criterion (BIC).
Covariates were included using a stepwise forward selection process with a threshold decrease in OFV of 3.84 (p < 0.05, 1 degree of freedom [df]) until no further decrease in OFV was observed. All of the significant covariates were then incorporated into the basic model to construct a full model. In backward elimination, the covariate was retained in the final model with a threshold increase in OFV of 6.63 (p < 0.01, 1 df); otherwise, it was eliminated from the model. The additional criteria for retaining the covariate in the final model were a decrease in the unexplained BSV and an increase in PK parameter estimate precision.
For internal validation of the final model, goodness-of-fit plots, including observed concentrations (DV) versus individual prediction (IPRED), DV versus population prediction (PRED), conditional weighted residuals (CWRES) versus PRED, and CWRES versus time after last dose (TAD), were performed. A nonparametric bootstrap procedure was conducted to assess the performance and stability of the final model (Ette and Onyiah, 2002; Ette et al., 2003). Random sampling with replacement was utilized to generate 1,000 replicate datasets using the individual as the sampling unit. The median and 95% confidence intervals (CIs) of the resulting parameters were calculated and compared with the final parameter estimates obtained using the NONMEM program. To evaluate the predictive performance, the statistics of the observed and simulated time–concentration profiles were compared using prediction- and variability-corrected visual predictive check (pvcVPC) (Bergstrand et al., 2011). The dataset was simulated 1,000 times using the $SIMULATION block in NONMEM® for pvcVPC. The 90% CIs for the 5th, 50th, and 95th percentiles of the simulated concentrations were calculated, plotted against time after the last dose, and compared with the observed concentrations.
Monte Carlo simulations were performed using the final model to identify the pragmatic dose adjustment of linezolid. Simulations were performed with the covariate sets from individual patients included in model building, serving as a template for 1,000 simulated subjects. The probability of target attainment (PTA) of the Cmin target was calculated for each dose (daily doses of 300–1,800 mg/day with increments between 150 and 300 mg) among simulated subjects with CrCL values of <30 ml/min, 30–59 ml/min, 60–89 ml/min, and ≥90 ml/min.
Statistical analyses were performed using SPSS version 21.0 (IBM Corp). All study variables were summarized by descriptive statistics. The Cmin and AUC0-24 at steady state of each patient were predicted via the maximum a posteriori probability (MAP) Bayesian function of NONMEM using the final PK model as the Bayesian prior. AUC0-24 was calculated by the linear-log trapezoidal rule using the concentrations at continuous time (10 min-interval) predicted via Bayesian estimation. Specifically, the linear trapezoidal approach was used during the ascending phase and the log-linear method was used during the descending phase. Logistic regression modeling for the toxicity of linezolid was conducted to determine whether the trough concentration or AUC0-24 of linezolid was a significant predictor of myelosuppression during treatment. The time from the initiation of linezolid treatment to the development of myelosuppression was estimated using the Kaplan–Meier curve analysis. All statistical tests were two-sided. p values <0.05 were considered statistically significant.
In total, 83 critically ill patients with a mean ± S.D. age of 60.57 ± 14.64 years and body weight of 64.11 ± 11.21 kg were included in the present study. The demographic data of the included patients are summarized in Table 1. The overall rate of myelosuppression occurrence, including thrombocytopenia and anemia, in this study was 40.97%. The incidence rates of thrombocytopenia and anemia were 36.14 and 16.87%, respectively. The median daily dose of linezolid selected by the physician was 20.17 mg/kg/d, and most patients received the drug every 12 h.
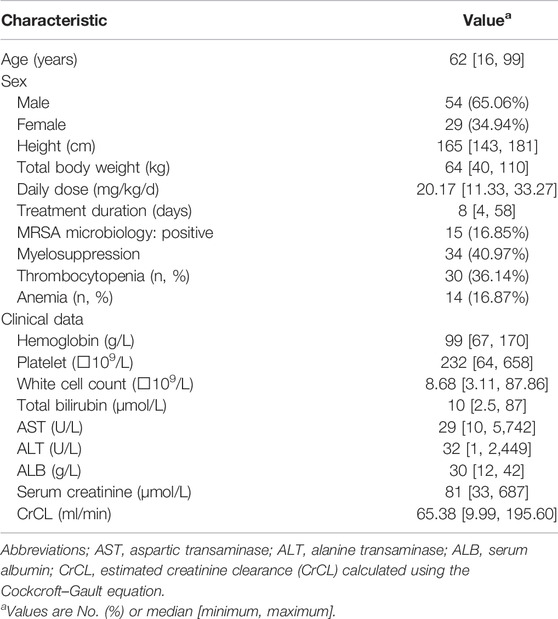
TABLE 1. Baseline characteristics of patients included for pharmacokinetic analysis set or hematological toxicity analysis set.
A total of 127 linezolid concentrations derived from 83 patients at a range of 0.25–21.61 mg/L were obtained for population PK modeling. The PK characteristics of linezolid illustrated by a 1-compartment model with linear elimination showed the best fit of the observed concentration–time data based on reduction in OFV and residual variability. The intra-individual variability for V was fixed as 0 because it was very small (ŋ<0.0025); it might be because of the limited data of peak concentrations. The proportional error model was used to evaluate the residual variability. Parameter estimates and diagnostic plots of the base model are provided in Supplementary Table S1 and Supplementary Figure S2. Covariate model building identified CrCL as the only covariate on linezolid CL that significantly explained interindividual variability. The final PK model is represented as follows:
where CL is the individual clearance, V is the individual volume of distribution, and CrCL is the estimated creatinine clearance. The parameter estimates of the final model are displayed in Table 2.
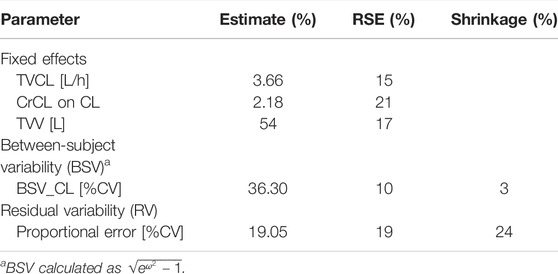
TABLE 2. Population pharmacokinetic parameter estimates from the final model.
The mean ± SD individual empirical Bayesian estimate of CL was 6.35 ± 2.32 L/h, across all patients with V estimated at 54 L. Furthermore, dividing the included patients into the group with linezolid-induced myelosuppression and the group without, the estimated CL was significantly lower in patients with linezolid-induced myelosuppression compared with that in the patients without (4.91 ± 1.51 L/h vs. 7.57 ± 2.35 L/h, p = 0.027).
The diagnostic goodness-of-fit plots of the final model are shown in Figure 1. The CWRES versus PRED of the final model showed a stochastic distribution around zero, and most residuals were within an acceptable range (−2 to 2). The median with 95% CI parameter estimates obtained from a 1,000-run bootstrap analysis is given in Supplementary Table S2. The parameter estimates of the final PK model lay within the 95% CIs from the nonparametric bootstrap procedure, and the biases between the final model estimates and the bootstrapped median parameter estimates were within ±10% for all parameters, which demonstrated the good stability of the final model. The pvcVPC of concentrations versus time after the last dose reflected a good fit between the observations and simulations (Supplementary Figure S3). Overall, the linezolid population PK model evaluation results revealed that the final model provided an adequate description of the data and a good prediction of individual PK parameters.
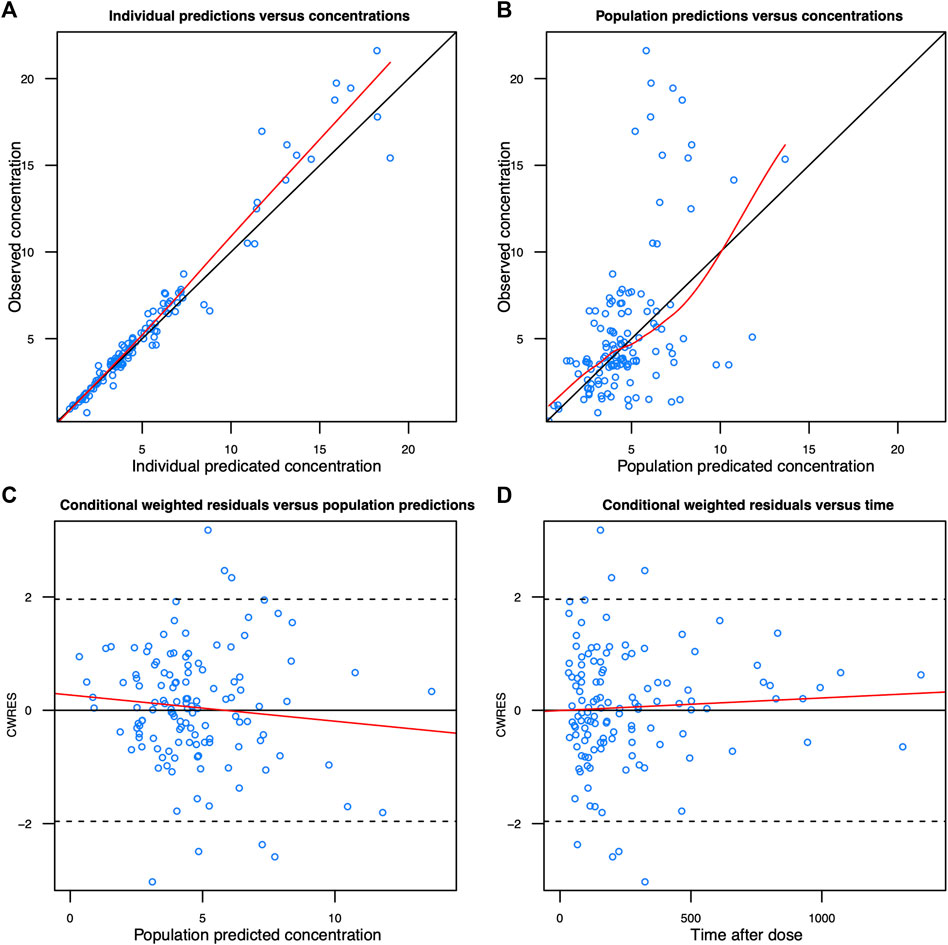
FIGURE 1. Diagnostic goodness-of-fit plots of the final model. (A) Observed concentration (DV) vs. individual predicted concentration (IPRED); (B) DV vs. population-predicted concentration (PRED); (C) conditional weighted residuals (CWRES) vs. PRED; and (D) CWRES vs. time. The red lines in the upper panel represent loess smooth lines and linear fit lines, respectively.
A strong correlation (r2 = 0.9969) was found between the Cmin and AUC0-24. The linear regression line was AUC0-24 = 26.354×Cmin+91.607. The ratio of the AUC to MIC was determined to be the most important PK/PD index for linezolid against strains of S. aureus and strains of S. pneumoniae with varying antibacterial susceptibilities, and the antibacterial activity of linezolid may be maximized when AUC0-24/MIC ratio ≥80, which was derived from a study conducted in critically ill patients (Rayner et al., 2003). Given the MIC90 of linezolid for most staphylococci is 2 mg/L (Jones et al., 2007), to achieve the PK/PD index (AUC0-24/MIC ≥80) for the efficacy of linezolid, an AUC0-24 of 160 mg h/L was required when the MIC was 2 mg/L. Using the linear regression equation, the Cmin for AUC0-24 = 160 mg h/L was 2.6 mg/L. Thus, the Cmin required for sufficient efficacy was ≥2.6 mg/L.
Linezolid-induced myelosuppression was observed in 34 (40.97%) of the 83 patients. Figure 2 shows the relationship between the Cmin and the myelosuppression (absence, 0; presence, 1). The Cmin of linezolid was a significant predictor of myelosuppression in critically patients according to the following equation: probability of myelosuppression = 1/[1 + exp (3.767–0.481*Cmin)]. The threshold for the Cmin of linezolid that caused myelosuppression with 50% probability was 7.8 mg/L. In general, the target Cmin range based on the aforementioned results was considered to be 2.6–7.8 mg/L. In addition, the Kaplan–Meier plot revealed that the overall median time from the initiation of therapy to the development of myelosuppression was 12 days (Figure 3).
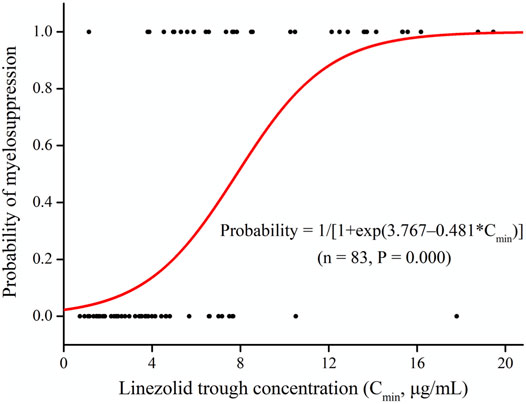
FIGURE 2. Linezolid trough plasma concentrations (Cmin) and logistic regression model for myelosuppression (absence, 0; presence, 1).
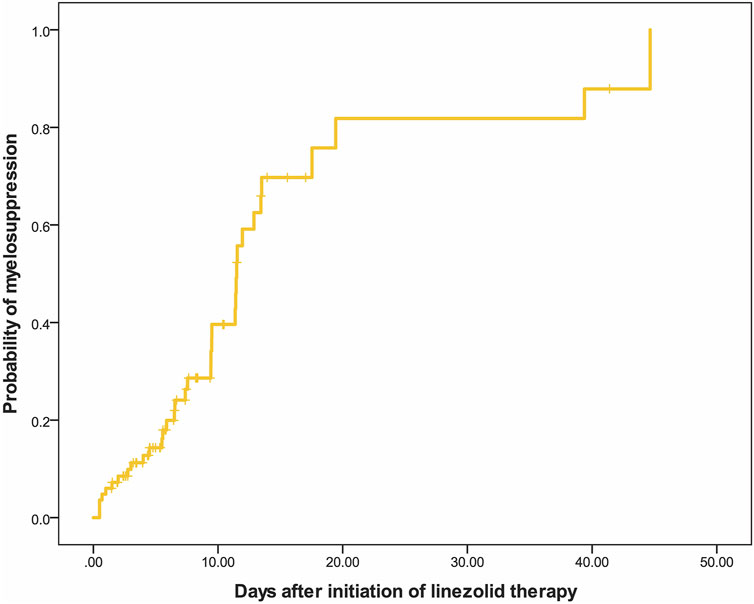
FIGURE 3. Kaplan–Meier plot showing the time from the initiation of linezolid therapy to the development of myelosuppression (n = 83).
The simulated PTA of linezolid therapeutic range (Cmin 2.6–7.8 mg/L) with various dosage regimens in patients with various CrCLs were quantified in Table 3 and Figure 4. The target for PTA was defined as > 80%. The low probability of attaining therapeutic Cmin values in patients with renal impairment (CrCL <60 ml/min) with a standard linezolid dose of 600 mg every 12 h is primarily due to an increase in the probability of attaining supratherapeutic Cmin (>7.8 mg/L). An empirical dose reduction to 600 mg every 24 h was the optimal to balance safety and efficacy in patients with CrCL of 30–59 ml/min, whereas 450 mg every 24 h was the alternative for patients with CrCL <30 ml/min.
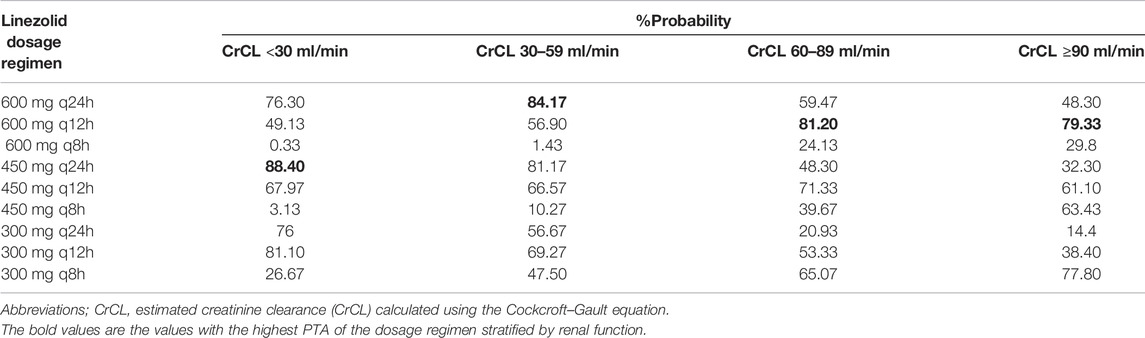
TABLE 3. Simulated probability of attaining linezolid trough concentrations associated with efficacy and toxicity stratified by renal function.
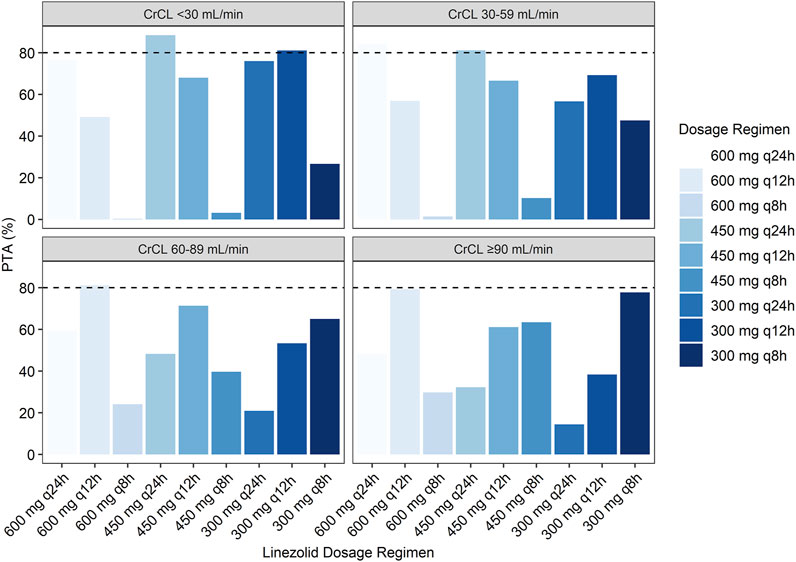
FIGURE 4. Simulated probability of achieving target attainment of linezolid (Cmin: 2.6–7.8 mg/L) stratified by renal function.
This is the first study focused on critically ill patients aimed at drawing the therapeutic target of linezolid as well as dosage modification for critically ill patients with renal impairment. The therapeutic range of Cmin was considered to be 2.6–7.8 mg/L to balance the efficacy and safety of linezolid, and linezolid treatment for ≥12 days was associated with the risk of myelosuppression. This study also developed a population PK model, which showed a significant relationship between CrCL and the total clearance of linezolid, and dose reduction to 600 mg every 24 h was the alternative for critically ill patients with CrCL of 30–59 ml/min, whereas 450 mg every 24 h was the alternative for patients with CrCL <30 ml/min.
The results of the PK analysis indicated that the one-compartment model with first-order elimination along with CrCL as a significant covariate on CL was optimal for the PK data modeling. The typical value of CL in the final PK model of this study was 6.35 L/h, which is consistent with other PK studies of linezolid performed in critically ill patients (Taubert et al., 2016; Soraluce et al., 2020). A comparison of our estimates of PK parameters with those reported in the literature is presented in Supplementary Table S3 (Whitehouse et al., 2005; Plock et al., 2007; Abe et al., 2009; Keel et al., 2011; Sasaki et al., 2011; Tsuji et al., 2013; Luque et al., 2014; Matsumoto et al., 2014; Taubert et al., 2016; Töpper et al., 2016; Zhang et al., 2016; Tsuji et al., 2017; Crass et al., 2019; Garcia-Prats et al., 2019; Li et al., 2019; Wang et al., 2019; Xie et al., 2019; Soraluce et al., 2020). According to the label of linezolid, its clearance occurs by both renal and hepatic mechanisms (approximately 30 and 65%, respectively). Thus, the covariates associated with renal and hepatic functionality were analyzed in the population PK analysis. However, only CrCL was included in the final model. Despite using the available bilirubin and transaminases data as candidate covariates, none of them improved the PK model. It might be due to the lack of reliable, economical, and untroublesome parameters of liver function that account for the drug clearance (Watkins et al., 2014; Wicha et al., 2017). Linezolid is currently administered at a fixed dose of 600 mg every 12 h despite the high between-subject variability in exposure and reduced CL in patients with renal insufficiency. It has been reported that renal impairment and end-stage renal disease have been associated with an increased risk of developing thrombocytopenia in patients receiving linezolid (Wu et al., 2006; Matsumoto et al., 2009; Takahashi et al., 2011; Hanai et al., 2016; Rabon et al., 2018). In addition, a clear exposure–toxicity relationship has been identified for myelosuppression (Matsumoto et al., 2010; Tsuji et al., 2011; Cattaneo et al., 2013; Dong et al., 2014). Thus, it is likely that increased linezolid exposure is the underlying reason for the higher risk of linezolid-related toxicity in patients with renal impairment. In addition, while renal function also plays a critical role in the clearance of the major metabolites of linezolid (Souza et al., 2020), linezolid and its major metabolites share a chemical feature (aniline functional group) which medicinal chemistry has demonstrated to be a risk factor for myelosuppression (Crivori et al., 2011; Stepan et al., 2011).
Previous studies have assessed the association between the Cmin, AUC0-24 of linezolid and thrombocytopenia. The first report was published by Matsumoto et al. in 2010 (Matsumoto et al., 2010), who found that patients developing thrombocytopenia had linezolid trough concentrations ranging from 14.4 to 35.6 mg/L, and they developed a logit model equation identifying a trough concentration of 22.1 mg/L as the upper threshold for risk of thrombocytopenia (Hiraki et al., 2012). However, this proposed target was challenged by the findings from Pea et al. and Matsumoto et al. who identified a much lower threshold of trough concentration (6.5 and 8.1 mg/L, respectively) associated with 50% probability of risking thrombocytopenia (Pea et al., 2012; Matsumoto et al., 2014). The present study showed that the Cmin threshold of linezolid that caused myelosuppression with 50% probability was 7.8 mg/L in critically ill patients. Using the linear regression equation, the AUC0-24 for Cmin of 7.8 mg/L was estimated to be 297.2 mg h/L, which was consistent with previous findings (Pea et al., 2012; Cattaneo et al., 2013; Nukui et al., 2013). In addition, we showed that administration of linezolid for ≥12 days was associated with a high risk of myelosuppression. Therefore, critically ill patients receiving linezolid for ≥12 days should be monitored carefully. Individualized dosing and monitoring of linezolid trough concentration could potentially help overcome the limitation of linezolid toxicity, especially in renal insufficiency patients. The previous studies suggested that a CrCL of <30 ml/min should be used as a threshold for predicting the risk of linezolid-induced thrombocytopenia (Sasaki et al., 2011; Hirano et al., 2014), whereas YuKi et al. pointed out that patients with CrCL of <60 ml/min and those on hemodialysis are at high risk of thrombocytopenia, which is consistent with our result (Hanai et al., 2016). However, the dose adjustment recommendation was not provided by the study. In the present study, according to the simulated probability of attaining linezolid target trough concentrations, a dose reduction to 600 mg every 24 h was the alternative for patients with CrCL of 30–59 ml/min, whereas 450 mg every 24 h was the alternative for patients with CrCL <30 ml/min. However, it should be mentioned that dosage adjusted according to CrCL could not always achieve the target trough concentration in all patients because inter-individual variability still exists. In addition, it should also be noted that the dosage regimen should be subsequently adjusted following the change in the renal function, especially for critically ill patients whose initial renal impairment is caused by severe infection, because their renal impairment will soon be improved after alleviating the severe infection. TDM has been suggested by some authors to optimize linezolid therapy in critically ill patients (Pea et al., 2010; Cattaneo et al., 2013). Therefore, the combination of using the recommended initial dose and subsequently adjusting the dose guided by TDM could enable effective linezolid therapies while avoiding adverse events.
There are some limitations to this study. First, PK analysis was performed using the data obtained from linezolid TDM retrospectively, even though the dosing time and sampling time were precisely recorded. Second, we did not investigate the effects of concomitant medications that are capable of causing myelosuppression. Third, the effect of renal replacement therapy on linezolid clearance was not clarified in the study, since patients who had renal replacement therapy were excluded from this study. Fourth, the distribution of plasma concentrations collected in this study was mainly trough concentrations, and only a small part of peak concentrations was included. Thus, we admitted that the estimated apparent volume and prediction of peak concentrations in the population PK model may not fit well because of the limited data of peak concentrations.
In conclusion, the population PK analysis revealed that renal function significantly affects the PKs of linezolid. The therapeutic target for linezolid was considered to be Cmin of 2.6–7.8 mg/L to minimize linezolid-induced myelosuppression while maintaining treatment efficacy in critically ill patients. Furthermore, a simulation based on the constructed PK model suggested a reduced dose of 600 mg every 24 h was recommended for patients with CrCL of 30–59 ml/min, whereas 450 mg every 24 h was the alternative for patients with CrCL <30 ml/min. Given the high between-subject variability of linezolid PKs, TDM is necessary to ensure optimal therapy across patient population.
The original contributions presented in the study are included in the article/Supplementary Material, further inquiries can be directed to the corresponding authors.
The studies involving human participants were reviewed and approved by the Ethical Committees of the First Affiliated Hospital of Wenzhou Medical University, China [(2021)034]. Written informed consent for participation was not required for this study in accordance with the national legislation and the institutional requirements.
X-BY, FC, and FW conceptualized and planned the work that led to the manuscript. X-SZ, YD, LH, F-MX, Y-XW, G-YL, and D-WS collected and analyzed the data. X-BY, FC, FW, Z-YZ, and C-HZ drafted the manuscript. The final submitted version of the manuscript was reviewed and approved by all the authors.
This work was supported by grants from the National Natural Science Foundation of China (8190358), the Natural Science Foundation of Zhejiang Province (LQ20H310003) and Science Research Incubation Program of the First Affiliated Hospital of Wenzhou Medical University (FHY2019081).
The authors declare that the research was conducted in the absence of any commercial or financial relationships that could be construed as a potential conflict of interest.
All claims expressed in this article are solely those of the authors and do not necessarily represent those of their affiliated organizations, or those of the publisher, the editors, and the reviewers. Any product that may be evaluated in this article, or claim that may be made by its manufacturer, is not guaranteed or endorsed by the publisher.
The Supplementary Material for this article can be found online at: https://www.frontiersin.org/articles/10.3389/fphar.2022.844567/full#supplementary-material
Abe, S., Chiba, K., Cirincione, B., Grasela, T. H., Ito, K., and Suwa, T. (2009). Population Pharmacokinetic Analysis of Linezolid in Patients with Infectious Disease: Application to Lower Body Weight and Elderly Patients. J. Clin. Pharmacol. 49 (9), 1071–1078. doi:10.1177/0091270009337947
Bergstrand, M., Hooker, A. C., Wallin, J. E., and Karlsson, M. O. (2011). Prediction-Corrected Visual Predictive Checks for Diagnosing Nonlinear Mixed-Effects Models. AAPS J. 13, 143–151. doi:10.1208/s12248-011-9255-z
Brier, M. E., Stalker, D. J., Aronoff, G. R., Batts, D. H., Ryan, K. K., O'Grady, M., et al. (2003). Pharmacokinetics of Linezolid in Subjects with Renal Dysfunction. Antimicrob. Agents Chemother. 47, 2775–2780. doi:10.1128/aac.47.9.2775-2780.2003
Cattaneo, D., Orlando, G., Cozzi, V., Cordier, L., Baldelli, S., Merli, S., et al. (2013). Linezolid Plasma Concentrations and Occurrence of Drug-Related Haematological Toxicity in Patients with Gram-Positive Infections. Int. J. Antimicrob. Agents 41, 586–589. doi:10.1016/j.ijantimicag.2013.02.020
Cossu, A. P., Musu, M., Mura, P., De Giudici, L. M., and Finco, G. (2014). Linezolid-Induced Thrombocytopenia in Impaired Renal Function: Is it Time for a Dose Adjustment? A Case Report and Review of Literature. Eur. J. Clin. Pharmacol. 70, 23–28. doi:10.1007/s00228-013-1585-6
Crass, R. L., Cojutti, P. G., Pai, M. P., and Pea, F. (2019). Reappraisal of Linezolid Dosing in Renal Impairment to Improve Safety. Antimicrob. Agents Chemother. 63 (8), e00605–19. doi:10.1128/AAC.00605-19
Crivori, P., Pennella, G., Magistrelli, M., Grossi, P., and Giusti, A. M. (2011). Predicting Myelosuppression of Drugs from In Silico Models. J. Chem. Inf. Model. 51 (2), 434–445. doi:10.1021/ci1003834
Dong, H. Y., Xie, J., Chen, L. H., Wang, T. T., Zhao, Y. R., and Dong, Y. L. (2014). Therapeutic Drug Monitoring and Receiver Operating Characteristic Curve Prediction May Reduce the Development of Linezolid-Associated Thrombocytopenia in Critically Ill Patients. Eur. J. Clin. Microbiol. Infect. Dis. 33, 1029–1035. doi:10.1007/s10096-013-2041-3
Ette, E. I., and Onyiah, L. C. (2002). Estimating Inestimable Standard Errors in Population Pharmacokinetic Studies: The Bootstrap with Winsorization. Eur. J. Drug Metab. Pharmcokinetic 27, 213–214. doi:10.1007/BF03190460
Ette, E. I., Williams, P. J., Kim, Y. H., Lane, J. R., Liu, M. J., and Capparelli, E. V. (2003). Model Appropriateness and Population Pharmacokinetic Modeling. J. Clin. Pharmacol. 43, 610–623. doi:10.1177/0091270003253624
Garcia-Prats, A. J., Schaaf, H. S., Draper, H. R., Garcia-Cremades, M., Winckler, J., Wiesner, L., et al. (2019). Pharmacokinetics, Optimal Dosing, and Safety of Linezolid in Children with Multidrug-Resistant Tuberculosis: Combined Data from Two Prospective Observational Studies. Plos Med. 16 (4), e1002789. doi:10.1371/journal.pmed.1002789
Gerson, S. L., Kaplan, S. L., Bruss, J. B., Le, V., Arellano, F. M., Hafkin, B., et al. (2002). Hematologic Effects of Linezolid: Summary of Clinical Experience. Antimicrob. Agents Chemother. 46, 2723–2726. doi:10.1128/aac.46.8.2723-2726.2002
Hanai, Y., Matsuo, K., Ogawa, M., Higashi, A., Kimura, I., Hirayama, S., et al. (2016). A Retrospective Study of the Risk Factors for Linezolid-Induced Thrombocytopenia and Anemia. J. Infect. Chemother. 22 (8), 536–542. doi:10.1016/j.jiac.2016.05.003
Hiraki, Y., Tsuji, Y., Hiraike, M., Misumi, N., Matsumoto, K., Morita, K., et al. (2012). Correlation between Serum Linezolid Concentration and the Development of Thrombocytopenia. Scand. J. Infect. Dis. 44 (1), 60–64. doi:10.3109/00365548.2011.608712
Hirano, R., Sakamoto, Y., Tachibana, N., and Ohnishi, M. (2014). Retrospective Analysis of the Risk Factors for Linezolid-Induced Thrombocytopenia in Adult Japanese Patients. Int. J. Clin. Pharm. 36, 795–799. doi:10.1007/s11096-014-9961-6
Ikuta, S., Tanimura, K., Yasui, C., Aihara, T., Yoshie, H., Iida, H., et al. (2011). Chronic Liver Disease Increases the Risk of Linezolid-Related Thrombocytopenia in Methicillin-Resistant Staphylococcus Aureus-Infected Patients after Digestive Surgery. J. Infect. Chemother. 17, 388–391. doi:10.1007/s10156-010-0188-8
Jones, R. N., Fritsche, T. R., Sader, H. S., and Ross, J. E. (2007). Zyvox Annual Appraisal of Potency and Spectrum Program Results for 2006: An Activity and Spectrum Analysis of Linezolid Using Clinical Isolates from 16 Countries. Diagn. Microbiol. Infect. Dis. 59, 199–209. doi:10.1016/j.diagmicrobio.2007.06.001
Keel, R. A., Schaeftlein, A., Kloft, C., Pope, J. S., Knauft, R. F., Muhlebach, M., et al. (2011). Pharmacokinetics of Intravenous and Oral Linezolid in Adults with Cystic Fibrosis. Antimicrob. Agents Chemother. 55 (7), 3393–3398. doi:10.1128/AAC.01797-10
Kollef, M. H., Sherman, G., Ward, S., and Fraser, V. J. (1999). Inadequate Antimicrobial Treatment of Infections: A Risk Factor for Hospital Mortality Among Critically Ill Patients. Chest 115, 462–474. doi:10.1378/chest.115.2.462
Kumar, A., Roberts, D., Wood, K. E., Light, B., Parrillo, J. E., Sharma, S., et al. (2006). Duration of Hypotension before Initiation of Effective Antimicrobial Therapy Is the Critical Determinant of Survival in Human Septic Shock. Crit. Care Med. 34, 1589–1596. doi:10.1097/01.CCM.0000217961.75225.E9
Li, S. C., Ye, Q., Xu, H., Zhang, L., and Wang, Y. (2019). Population Pharmacokinetics and Dosing Optimization of Linezolid in Pediatric Patients. Antimicrob. Agents Chemother. 63 (4), e02387–18. doi:10.1128/AAC.02387-18
Lin, Y. H., Wu, V. C., Tsai, I. J., Ho, Y. L., Hwang, J. J., Tsau, Y. K., et al. (2006). High Frequency of Linezolid-Associated Thrombocytopenia Among Patients with Renal Insufficiency. Int. J. Antimicrob. Agents 28, 345–351. doi:10.1016/j.ijantimicag.2006.04.017
Luque, S., Grau, S., Alvarez-Lerma, F., Ferrández, O., Campillo, N., Horcajada, J. P., et al. (2014). Plasma and Cerebrospinal Fluid Concentrations of Linezolid in Neurosurgical Critically Ill Patients with Proven or Suspected central Nervous System Infections. Int. J. Antimicrob. Agents 44 (5), 409–415. doi:10.1016/j.ijantimicag.2014.07.001
MacArthur, R. D., Miller, M., Albertson, T., Panacek, E., Johnson, D., Teoh, L., et al. (2004). Adequacy of Early Empiric Antibiotic Treatment and Survival in Severe Sepsis: Experience from the MONARCS Trial. Clin. Infect. Dis. 38, 284–288. doi:10.1086/379825
Matsumoto, K., Shigemi, A., Takeshita, A., Watanabe, E., Yokoyama, Y., Ikawa, K., et al. (2014). Analysis of Thrombocytopenic Effects and Population Pharmacokinetics of Linezolid: A Dosage Strategy According to the Trough Concentration Target and Renal Function in Adult Patients. Int. J. Antimicrob. Agents 44, 242–247. doi:10.1016/j.ijantimicag.2014.05.010
Matsumoto, K., Takeda, Y., Takeshita, A., Fukunaga, N., Shigemi, A., Yaji, K., et al. (2009). Renal Function as a Predictor of Linezolid-Induced Thrombocytopenia. Int. J. Antimicrob. Agents 33, 98–99. doi:10.1016/j.ijantimicag.2008.07.002
Matsumoto, K., Takeshita, A., Ikawa, K., Shigemi, A., Yaji, K., Shimodozono, Y., et al. (2010). Higher Linezolid Exposure and Higher Frequency of Thrombocytopenia in Patients with Renal Dysfunction. Int. J. Antimicrob. Agents 36 (2), 179–181. doi:10.1016/j.ijantimicag.2010.02.019
Morata, L., De la Calle, C., Gómez-Cerquera, J. M., Manzanedo, L., Casals, G., Brunet, M., et al. (2016). Risk Factors Associated with High Linezolid Trough Plasma Concentrations. Expert Opin. Pharmacother. 17, 1183–1187. doi:10.1080/14656566.2016.1182154
Niwa, T., Suzuki, A., Sakakibara, S., Kasahara, S., Yasuda, M., Fukao, A., et al. (2009). Retrospective Cohort Chart Review Study of Factors Associated with the Development of Thrombocytopenia in Adult Japanese Patients Who Received Intravenous Linezolid Therapy. Clin. Ther. 31, 2126–2133. doi:10.1016/j.clinthera.2009.10.017
Nukui, Y., Hatakeyama, S., Okamoto, K., Yamamoto, T., Hisaka, A., Suzuki, H., et al. (2013). High Plasma Linezolid Concentration and Impaired Renal Function Affect Development of Linezolid-Induced Thrombocytopenia. J. Antimicrob. Chemother. 68, 2128–2133. doi:10.1093/jac/dkt133
Pea, F., Cojutti, P. G., and Baraldo, M. (2017). A 10-Year Experience of Therapeutic Drug Monitoring (TDM) of Linezolid in a Hospital-Wide Population of Patients Receiving Conventional Dosing: Is There Enough Evidence for Suggesting TDM in the Majority of Patients? Basic Clin. Pharmacol. Toxicol. 121, 303–308. doi:10.1111/bcpt.12797
Pea, F., Furlanut, M., Cojutti, P., Cristini, F., Zamparini, E., Franceschi, L., et al. (2010). Therapeutic Drug Monitoring of Linezolid: A Retrospective Monocentric Analysis. Antimicrob. Agents Chemother. 54 (11), 4605–4610. doi:10.1128/AAC.00177-10
Pea, F., Viale, P., Cojutti, P., Del Pin, B., Zamparini, E., and Furlanut, M. (2012). Therapeutic Drug Monitoring May Improve Safety Outcomes of Long-Term Treatment with Linezolid in Adult Patients. J. Antimicrob. Chemother. 67, 2034–2042. doi:10.1093/jac/dks153
Phillips, O. A., Abdel-Hamid, M. E., and al-Hassawi, N. A. (2001). Determination of Linezolid in Human Plasma by LC-MS-MS. Analyst 126 (5), 609–614. doi:10.1039/b100076o
Plock, N., Buerger, C., Joukhadar, C., Kljucar, S., and Kloft, C. (2007). Does Linezolid Inhibit its Own Metabolism? Population Pharmacokinetics as a Tool to Explain the Observed Nonlinearity in Both Healthy Volunteers and Septic Patients. Drug Metab. Dispos 35 (10), 1816–1823. doi:10.1124/dmd.106.013755
Rabon, A. D., Fisher, J. P., and MacVane, S. H. (2018). Incidence and Risk Factors for Development of Thrombocytopenia in Patients Treated with Linezolid for 7 Days or Greater. Ann. Pharmacother. 52 (11), 1162–1164. doi:10.1177/1060028018783498
Rayner, C. R., Forrest, A., Meagher, A. K., Birmingham, M. C., and Schentag, J. J. (2003). Clinical Pharmacodynamics of Linezolid in Seriously Ill Patients Treated in a Compassionate Use Programme. Clin. Pharmacokinet. 42, 1411–1423. doi:10.2165/00003088-200342150-00007
Sasaki, T., Takane, H., Ogawa, K., Isagawa, S., Hirota, T., Higuchi, S., et al. (2011). Population Pharmacokinetic and Pharmacodynamic Analysis of Linezolid and a Hematologic Side Effect, Thrombocytopenia, in Japanese Patients. Antimicrob. Agents Chemother. 55 (5), 1867–1873. doi:10.1128/AAC.01185-10
Senneville, E., Legout, L., Valette, M., Yazdanpanah, Y., Giraud, F., Beltrand, E., et al. (2004). Risk Factors for Anaemia in Patients on Prolonged Linezolid Therapy for Chronic Osteomyelitis: A Case-Control Study. J. Antimicrob. Chemother. 54, 798–802. doi:10.1093/jac/dkh409
Soraluce, A., Barrasa, H., Asín-Prieto, E., Sánchez-Izquierdo, J. Á., Maynar, J., Isla, A., et al. (2020). Novel Population Pharmacokinetic Model for Linezolid in Critically Ill Patients and Evaluation of the Adequacy of the Current Dosing Recommendation. Pharmaceutics 12 (1), 54. doi:10.3390/pharmaceutics12010054
Souza, E., Crass, R. L., Felton, J., Hanaya, K., and Pai, M. P. (2020). Accumulation of Major Linezolid Metabolites in Patients with Renal Impairment. Antimicrob. Agents Chemother. 64 (5), e00027–20. doi:10.1128/AAC.00027-20
Stepan, A. F., Walker, D. P., Bauman, J., Price, D. A., Baillie, T. A., Kalgutkar, A. S., et al. (2011). Structural Alert/reactive Metabolite Concept as Applied in Medicinal Chemistry to Mitigate the Risk of Idiosyncratic Drug Toxicity: A Perspective Based on the Critical Examination of Trends in the Top 200 Drugs Marketed in the United States. Chem. Res. Toxicol. 24 (9), 1345–1410. doi:10.1021/tx200168d
Takahashi, Y., Takesue, Y., Nakajima, K., Ichiki, K., Tsuchida, T., Tatsumi, S., et al. (2011). Risk Factors Associated with the Development of Thrombocytopenia in Patients Who Received Linezolid Therapy. J. Infect. Chemother. 17, 382–387. doi:10.1007/s10156-010-0182-1
Taubert, M., Zoller, M., Maier, B., Frechen, S., Scharf, C., Holdt, L. M., et al. (2016). Predictors of Inadequate Linezolid Concentrations after Standard Dosing in Critically Ill Patients. Antimicrob. Agents Chemother. 60, 5254–5261. doi:10.1128/AAC.00356-16
Töpper, C., Steinbach, C. L., Dorn, C., Kratzer, A., Wicha, S. G., Schleibinger, M., et al. (2016). Variable Linezolid Exposure in Intensive Care Unit Patients-Possible Role of Drug-Drug Interactions. Ther. Drug Monit. 38 (5), 573–578. doi:10.1097/FTD.0000000000000324
Tsuji, Y., Hiraki, Y., Matsumoto, K., Mizoguchi, A., Kobayashi, T., Sadoh, S., et al. (2011). Thrombocytopenia and Anemia Caused by a Persistent High Linezolid Concentration in Patients with Renal Dysfunction. J. Infect. Chemother. 17, 70–75. doi:10.1007/s10156-010-0080-6
Tsuji, Y., Holford, N. H. G., Kasai, H., Ogami, C., Heo, Y. A., Higashi, Y., et al. (2017). Population Pharmacokinetics and Pharmacodynamics of Linezolid-Induced Thrombocytopenia in Hospitalized Patients. Br. J. Clin. Pharmacol. 83 (8), 1758–1772. doi:10.1111/bcp.13262
Tsuji, Y., Yukawa, E., Hiraki, Y., Matsumoto, K., Mizoguchi, A., Morita, K., et al. (2013). Population Pharmacokinetic Analysis of Linezolid in Low Body Weight Patients with Renal Dysfunction. J. Clin. Pharmacol. 53, 967–973. doi:10.1002/jcph.133
Wang, D., Zheng, X., Yang, Y., and Chen, X. (2019). Population Pharmacokinetic Analysis of Linezolid in Patients with Different Types of Shock: Effect of Platelet Count. Exp. Ther. Med. 18 (3), 1786–1792. doi:10.3892/etm.2019.7747
Watkins, P. B., Merz, M., Avigan, M. I., Kaplowitz, N., Regev, A., and Senior, J. R. (2014). The Clinical Liver Safety Assessment Best Practices Workshop: Rationale, Goals, Accomplishments and the Future. Drug Saf. 37 (Suppl. 1), S1–S7. doi:10.1007/s40264-014-0181-8
Whitehouse, T., Cepeda, J. A., Shulman, R., Aarons, L., Nalda-Molina, R., Tobin, C., et al. (2005). Pharmacokinetic Studies of Linezolid and Teicoplanin in the Critically Ill. J. Antimicrob. Chemother. 55 (3), 333–340. doi:10.1093/jac/dki014
Wicha, S. G., Frey, O. R., Roehr, A. C., Pratschke, J., Stockmann, M., Alraish, R., et al. (2017). Linezolid in Liver Failure: Exploring the Value of the Maximal Liver Function Capacity (LiMAx) Test in a Pharmacokinetic Pilot Study. Int. J. Antimicrob. Agents 50 (4), 557–563. doi:10.1016/j.ijantimicag.2017.06.023
Wu, V. C., Wang, Y. T., Wang, C. Y., Tsai, I. J., Wu, K. D., Hwang, J. J., et al. (2006). High Frequency of Linezolid-Associated Thrombocytopenia and Anemia Among Patients with End-Stage Renal Disease. Clin. Infect. Dis. 42, 66–72. doi:10.1086/498509
Xie, F., Mantzarlis, K., Malliotakis, P., Koulouras, V., Degroote, S., Koulenti, D., et al. (2019). Pharmacokinetic Evaluation of Linezolid Administered Intravenously in Obese Patients with Pneumonia. J. Antimicrob. Chemother. 74 (3), 667–674. doi:10.1093/jac/dky500
Zhang, L., Bai, N., Liu, Y. N., and Wang, R. (2016). A Study of Population Pharmacokinetics of Linezolid in Chinese. Zhonghua Jie He He Hu Xi Za Zhi 39 (12), 924–928. doi:10.3760/cma.j.issn.1001-0939.2016.12.004
Keywords: linezolid, population pharmacokinetics, myelosuppression, dosage strategy, renal function
Citation: Wu F, Zhang X-S, Dai Y, Zhou Z-Y, Zhang C-H, Han L, Xu F-M, Wang Y-X, Shi D-W, Lin G-Y, Yu X-B and Chen F (2022) Dosage Strategy of Linezolid According to the Trough Concentration Target and Renal Function in Chinese Critically Ill Patients. Front. Pharmacol. 13:844567. doi: 10.3389/fphar.2022.844567
Received: 12 January 2022; Accepted: 10 March 2022;
Published: 11 April 2022.
Edited by:
Rodrigo Cristofoletti, University of Florida, United StatesReviewed by:
Jeffrey Lipman, The University of Queensland, AustraliaCopyright © 2022 Wu, Zhang, Dai, Zhou, Zhang, Han, Xu, Wang, Shi, Lin, Yu and Chen. This is an open-access article distributed under the terms of the Creative Commons Attribution License (CC BY). The use, distribution or reproduction in other forums is permitted, provided the original author(s) and the copyright owner(s) are credited and that the original publication in this journal is cited, in accordance with accepted academic practice. No use, distribution or reproduction is permitted which does not comply with these terms.
*Correspondence: Xu-Ben Yu, eXV4dWJlbkAxMjYuY29t; Fang Chen, ZmFuZ2NoZW4xOTg4MDcwNUAxNjMuY29t
†These authors have contributed equally to this work
Disclaimer: All claims expressed in this article are solely those of the authors and do not necessarily represent those of their affiliated organizations, or those of the publisher, the editors and the reviewers. Any product that may be evaluated in this article or claim that may be made by its manufacturer is not guaranteed or endorsed by the publisher.
Research integrity at Frontiers
Learn more about the work of our research integrity team to safeguard the quality of each article we publish.