
95% of researchers rate our articles as excellent or good
Learn more about the work of our research integrity team to safeguard the quality of each article we publish.
Find out more
ORIGINAL RESEARCH article
Front. Pharmacol. , 24 October 2022
Sec. Experimental Pharmacology and Drug Discovery
Volume 13 - 2022 | https://doi.org/10.3389/fphar.2022.1038754
This article is part of the Research Topic Medicinal Cannabis: Evolution of Therapeutic Use, Future Approaches and Other Implications, Volume II View all 10 articles
 Federica Pigliasco1†Sara Malaca2†
 Alfredo Fabrizio Lo Faro2Anastasio Tini2
 Giuliana Cangemi3
 Alessia Cafaro3,4
 Sebastiano Barco3*
 Antonella Riva1Angelica Pisati1
 Elisabetta Amadori1
 Pasquale Striano1,5
 Adriano Tagliabracci2Marilyn Ann Huestis6
 Francesco Paolo Busardò2
Cannabidiol (CBD) exhibits anti-inflammatory, anxiolytic, antiseizure, and neuroprotective proprieties without addictive or psychotropic side effects, as opposed to Δ9-tetrahydrocannabinol (THC). While recreational cannabis contains higher THC and lower CBD concentrations, medical cannabis contains THC and CBD in different ratios, along with minor phytocannabinoids, terpenes, flavonoids and other chemicals. A volumetric absorptive microsampling (VAMS) method combined with ultra-high-performance liquid chromatography coupled with mass spectrometry in tandem for quantification of CBD, THC and their respective metabolites: cannabidiol-7-oic acid (7-COOH-CBD); 7-hydroxy-cannabidiol (7-OH-CBD); 6-alpha-hydroxy-cannabidiol (6-α-OH-CBD); and 6-beta-hydroxycannabidiol (6-β-OH-CBD); 11- Hydroxy-Δ9-tetrahydrocannabinol (11-OH-THC) and 11-Nor-9-carboxy-Δ9-tetrahydrocannabinol (THCCOOH). After overnight enzymatic glucuronide hydrolysis at 37°C, samples underwent acidic along with basic liquid-liquid extraction with hexane: ethyl acetate (9:1, v/v). Chromatographic separation was carried out on a C18 column, with the mass spectrometer operated in multiple reaction monitoring mode and negative electrospray ionization. Seven patients with intractable epilepsy were dosed with various CBD-containing formulations and blood collected just before their daily morning administration. The method was validated following international guidelines in toxicology. Linear ranges were (ng/ml) 0.5–25 THC, 11-OH-THC, THCCOOH, 6-α-OH-CBD and 6-β-OH-CBD; 10–500 CBD and 7-OH-CBD; and 20–5000 7-COOH-CBD. 7-COOH-CBD was present in the highest concentrations, followed by 7-OH-CBD and CBD. This analytical method is useful for investigating CBD, THC and their major metabolites in epilepsy patients treated with CBD preparations employing a minimally invasive microsampling technique requiring only 30 µL blood.
The most researched phytocannabinoids are cannabidiol (CBD) and Δ9-tetrahydrocannabinol (THC) (Degenhardt et al., 2017; Barco et al., 2018). CBD exhibits anti-inflammatory, antiseizure, anxiolytic, and neuroprotective proprieties without addictive or psychotropic effects, as opposed to THC (Pigliasco et al., 2020). While recreational cannabis generally contains high THC concentrations, medical cannabis contains THC and CBD in varying amounts, along with minor terpenes, flavonoids, phytocannabinoids, and other chemicals (Malaca et al., 2021).
There is growing interest in cannabis-based therapies and clinical applications (Lattanzi et al., 2019, 2020; Arzimanoglou et al., 2020). Different CBD products are available on the market with effects varying based on purity, formulation, and concentration. The European Medicines Agency has authorized Epidyolex®, a pure CBD oral solution. As an add-on therapy for drug-resistant epilepsies including Dravet syndrome, tuberous sclerosis complex and Lennox-Gastaut syndrome (Dubois et al., 2020).
Therapeutic drug monitoring (TDM) of a variety of antiseizure medications (ASMs) is critical in therapeutic management of patients with epilepsy. TDM is particularly useful in emerging clinical practice for cannabis-based therapies to identify the dose associated with an optimal response (Patsalos et al., 2018; Striano et al., 2008; Brandt, 2019). Although TDM is often performed on plasma or serum samples, a major challenge is a need for repeated venipunctures, which is stressful, especially for children. Dried blood spots and other microsampling techniques offer advantages including easy, rapid, and less invasive sample collection, low sample volumes of 10–50 μL, minimal sample preparation and safe sample handling with minimum risk of transmission of infectious diseases (Biagini et al., 2020).
Other analytical methods focused on CBD and metabolite identification and quantification in different biological matrices, but none included simultaneous quantification with the volumetric absorptive microsampling (VAMS) method (Barco et al., 2018; Dubois et al., 2020; Pérez-Acevedo et al., 2020, 2021; Pichini et al., 2020, 2021; Pigliasco et al., 2020; Busardò et al., 2021; Malaca et al., 2021). This method quantifies CBD, THC, cannabidiol-7-oic acid (7-COOH-CBD); 7-hydroxy-cannabidiol (7-OH-CBD); 6-alpha-hydroxy-cannabidiol (6-α-OH-CBD); and 6-beta-hydroxycannabidiol (6-β-OH-CBD); 11-Hydroxy-Δ9-tetrahydrocannabinol (11-OH-THC) and 11-Nor-9-carboxy-Δ9-tetrahydrocannabinol (THCCOOH) in whole blood collected with VAMS and analyzed with ultra-high performance liquid chromatography coupled with mass spectrometry in tandem (UHPLC-MS/MS). In our previous research, we demonstrated that CBD plasma concentrations were comparable to those measured in venous or capillary blood with VAMS, allowing the use of this microsampling fingerpick device (Barco et al., 2017; D’Urso et al., 2019; Pigliasco et al., 2020). The validated method quantified cannabinoids in children’s blood with drug-resistant epilepsy.
Standards for CBD, 7-OH-CBD, 7-COOH-CBD, 6-α–OH–CBD and 6-β–OH–CBD, THC, 11-OH-THC, and THCCOOH were obtained from Dalton Research Molecules (Toronto, ON, Canada) and deuterated internal standards (ISTD) THC-d3, 11-OH-THC-d3, THCCOOH-d3 and CBD-d3 were purchased from Cayman Chemical (Ann Arbor, MI, United States) and stored at −20°C until use. LC-MS grade water, LC grade acetone, formic acid and acetonitrile acquired from Sigma-Aldrich® (Milano, Italy). Ammonium formate 5 mM was prepared with 97% pure ammonium formate ammonium salt (Sigma-Aldrich®) dissolved in LC-MS grade water. Beta-glucuronidase from E. Coli (>20.000 units mg/protein) was obtained from Sigma Aldrich® (Milano, Italy).
A Waters® Xevo® TQ-S micro mass spectrometer (triple quadrupole), equipped with an electrospray ionization source operating in both negative and positive-ion mode (ESI), was used to conduct the UHPLC-MS/MS analysis. The instrument was interfaced with an ACQUITY UPLC® I-Class (Waters®; Milan, Italy). Data were collected using the MassLynx® program version 4.1 (Waters®, Milano, Italy). A Waters® ACQUITYTM PREMIER UPLC® BEH C18 column (100 × 2.1 mm, 1.7 μm) was used for separation. Run time was 17 min with mobile phases (A) water with ammonium formate 5 mM pH 7.5 and (B) acetonitrile at a flow rate of 0.4 ml/min. The gradient program went from 5% B for 0.25 min to 30% B after 1 min, 80% B after 11.5 min and held for 0.5 min, 100% B after 11.55 min till 13.5 min, and then back to 5% B after 13.55 min and held for the remaining 17:00 min. Column oven and autosampler temperatures were 50°C and 10°C, respectively. The mass spectrometer was operated in multiple reaction monitoring (MRM) mode, with two transitions for each analyte and ISTD (see Table 1). By individually injecting neat standards into methanol and ramping cone voltage and collision energy, MS parameter settings were made to be fully optimized. (see Table 1). The ESI conditions were optimized to source temperature 150°C, capillary voltage −2.8 kV, cone gas flow rate 0.18 ml/min, desolvation temperature 650°C, and desolvation gas flow rate 1200 L/h. The scan speed (dwell time) was 0.023 s.
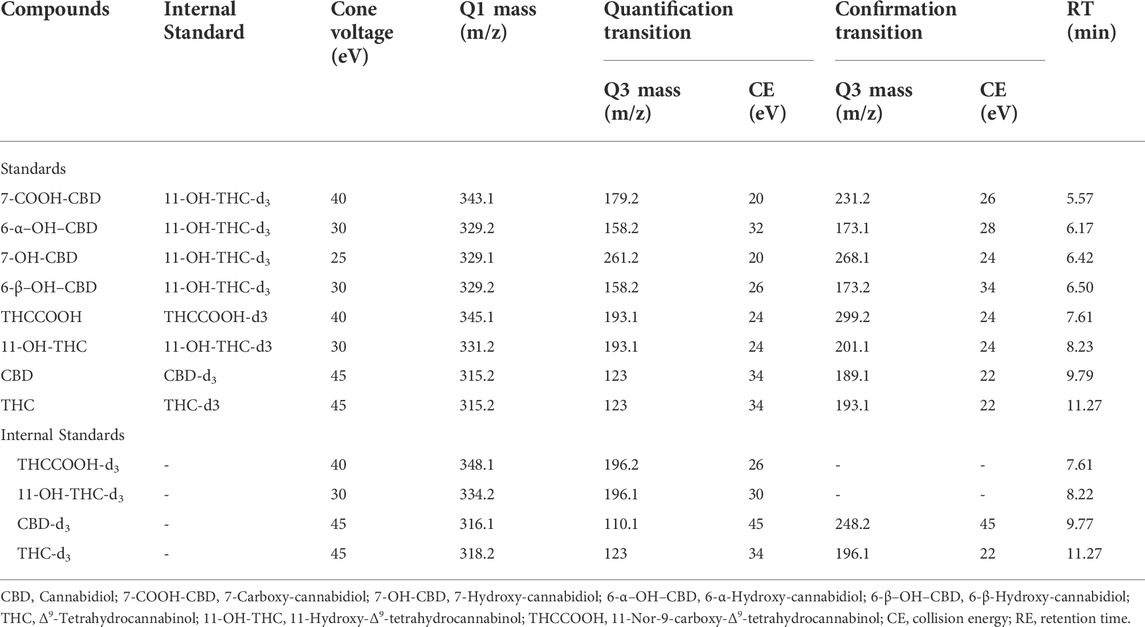
TABLE 1. Mass spectrometry parameters for analytes and internal standards.
Standard stock solutions with all five non-deuterated standards were prepared in methanol at 1 mg/ml, 100 μg/ml, 10 μg/ml, and 1 μg/ml. ISTD stock solution with THC-d3, THCCOOH-d3, 11-OH-THC-d3 and CBD-d3 was prepared in methanol at 1 μg/ml. Due to the unavailability of deuterated standards for the analytes, the deuterated 11-OH-THC standard was used for the CBD metabolites. Glass vials containing the stock solutions were kept at −20°C.
Pre-screened blood samples were donated by Department of Neurosciences, Rehabilitation, Ophthalmology, Genetics, Maternal and Child Health (DI-NOGMI, University of Genoa, Genoa, Italy) as material discarded during current clinical practice. During method validation, samples were evaluated to rule out any potential sources of chromatographic interferences and then mixed to form a homogeneous pool of blank samples for the preparation of calibration standards and quality control samples.
Calibrator working solutions were prepared by diluting standard stock solutions with methanol (0.25, 0.5, 1, 2, 5 and 25 ng/ml for THC, 11-OH-THC, THCCOOH, 6-α–OH–CBD and 6-β–OH–CBD; 1.5, 25, 50, 100, 250 and 500 ng/ml for CBD and 7-OH-CBD; 3.5, 20, 100, 500, 1000 and 5000 ng/ml for 7-COOH-CBD). Low, medium and high-quality control (QC) working solutions were prepared daily from the standard stock solutions in methanol. THC, 11-OH-THC, THCCOOH, 6-α–OH–CBD and 6-β–OH–CBD QC concentrations were 0.75, 1.5 and 20 ng/ml, CBD and 7-OH-CBD QC concentrations were 5, 80 and 400 ng/ml and 7-COOH-CBD QC concentrations were 10, 350 and 4000 ng/ml.
Since prior research and our preliminary experiments in real samples revealed that CBD metabolites were present as glucuronides, blood samples were extracted following enzymatic hydrolysis (Bergamaschi et al., 2013; Ujváry and Hanuš, 2016). Glucuronide hydrolysis was carried out by adding 2 μL ISTD solution (100 ng/ml), beta-glucuronidase (E. Coli >20,000 units mg/protein) was added to 30 ml of blood in a VAMS tip, followed by dilution in 800 ml of water and heated overnight at 37°C. After hydrolysis, acidic and basic extractions were performed to extract all metabolites based on their acid-base properties. For the basic extraction, 100 μL ammonium hydroxide (pH 9) was added to the hydrolyzed sample after the addition of 4 ml hexane: ethyl acetate (9:1). Samples underwent horizontal agitation for 30 min. Samples were centrifuged for 3 min at 3500 rpm, and the supernatant was then transferred to a clean tube. The samples were centrifuged for 3 minutes at 3500 rpm and the supernatant was then transferred to a clean tube. The remaining aqueous phase was then treated with 15 μL of formic acid (≥99.9%) (pH 3) for acid extraction. Four mL of hexane: ethyl acetate (9: 1) was added to the sample. The tubes were then capped, vortexed for 10 s, mixed for 10 min and centrifuged at 5000 g for 5 min . Both extractions’ supernatants were combined in a glass tube (Safe-Lock Tube®, Eppendorf, Milano, Italy) and dried under nitrogen. Samples were resuspended with 100 µL water: methanol (1:1), transferred into autosampler glass vials, and 10 μL injected onto the chromatographic system.
Sensitivity was determined by analyzing four replicates of negative samples and examination of the signal/noise ratio. The standard deviation (SD) of the mean noise level over the retention time window of analytes was used to determine the detection limit (LOD = 3 SD) and the quantification limit (LLOQ = 10 SD). The calculated LLOQ had to demonstrate precision and accuracy within the 20% relative SD and relative error, respectively, in order to be acceptable.
Selectivity evaluated the capacity of analytes to be identified in the presence of matrix elements. Blank blood samples were assayed to identify possible endogenous interferences. In addition, blank blood samples were assayed for possible exogenous drug interferences. For this, other commonly encountered analytes (such as common drugs or metabolites) encountered in routine work were analyzed with fortified matrix samples at high therapeutic or lethal concentrations. The acceptance criteria were no signal/noise ratio higher than 3 at ± 0.2 min of the retention time of the analytes (ranging from 5.57 to 11.27 min) in the quantitative and qualitative ions. To test for carryover, blank blood samples were analyzed immediately after the highest calibrator. Carryover was the highest fortified concentration at which no analyte carryover above the method’s LOD was observed in the blank matrix.
Six calibrators were assayed on five separate days to establish the calibration curve. The peak area ratio of each compound and its corresponding ISTD were plotted against each analyte’s concentration. The minimally acceptable linearity requires a coefficient of correlation (r2) ≥ 0.99 and each calibrator quantifying within ±20% of target concentration. Dilution integrity was checked for over-the-curve samples with concentrations 10 and 50 times higher than the highest calibrators, verifying precision and accuracy to be within 15%.
Imprecision was expressed as the RSD (%), and bias was calculated as (determined concentration)/(nominal concentration)×100%. Acceptance criteria for intra- and inter-assay imprecision were CV ≤ 20% and bias ≤15%. To evaluate intra-assay imprecision, six blank blood samples each were fortified with the target analytes at three different concentrations (low, medium, and high QC) and analyzed on the same day. Evaluation of inter-assay imprecision and bias were performed over 5 days with a minimum of six concentrations.
Matrix effect was determined by comparing peak areas of the extracted blank samples fortified with standards after the extraction procedure with the peak areas of pure diluted substances. Recovery was determined by comparing peak area of the extracted compounds fortified before extraction to the peak area obtained from samples fortified post-extraction (representing 100% recovery). The ISTD mixture was added to samples after extraction.
Compounds’ stability in blood was evaluated through repeated analysis (n = 5) of QC samples after three freeze-thaw cycles (storage at −20°C) on the compounds stability in blood was evaluated by repeated analysis (n = 5) of QC samples. In addition, short term (24 and 48 h) and mid-term (1 month) stability were assessed using five different aliquots of QC stored at −20°C. The stability was expressed as a percentage of the initial concentration (first analyzed batch) of the analytes in QC.
The analytical method’s applicability was demonstrated using real clinical samples from patients taking different CBD formulations. (Epidyolex®, CBD oil, CBD oil Enecta and CBD crystal) for the treatment of drug-resistant epilepsy of different etiologies (see Table 2). Blood samples were collected in the morning before daily dose administration using the 30 µL VAMS devices (MITRA®, Neoteryx, 105 Torrance, CA, United States) for capillary blood collection. Capillary VAMS were obtained in accordance with the manufacturer’s recommendations: before pricking the patient’s finger with a micro-needle, the area was disinfected and after the first drop of blood was removed, the VAMS tip was placed in contact with the surface of the second drop to absorb the matrix. The study was approved by the Regional Ethical Committee (CER Liguria: 056/057/058/059-2019) and written informed consent was signed by patients or caregivers.
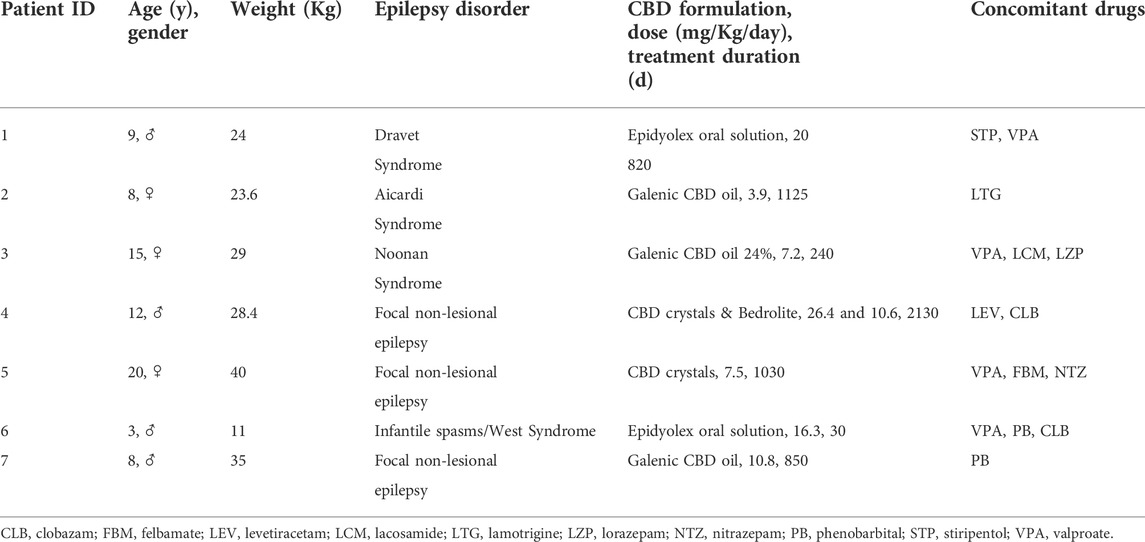
TABLE 2. Patients’ demographic, clinical, and treatment data.
Previous analytical methods determined CBD, THC and metabolites (Figure 1) by UHPLC-MS/MS methods with VAMS collection (Dubois et al., 2020; Pigliasco et al., 2020) but no assay is currently available to simultaneously quantify all of these analytes in whole blood.
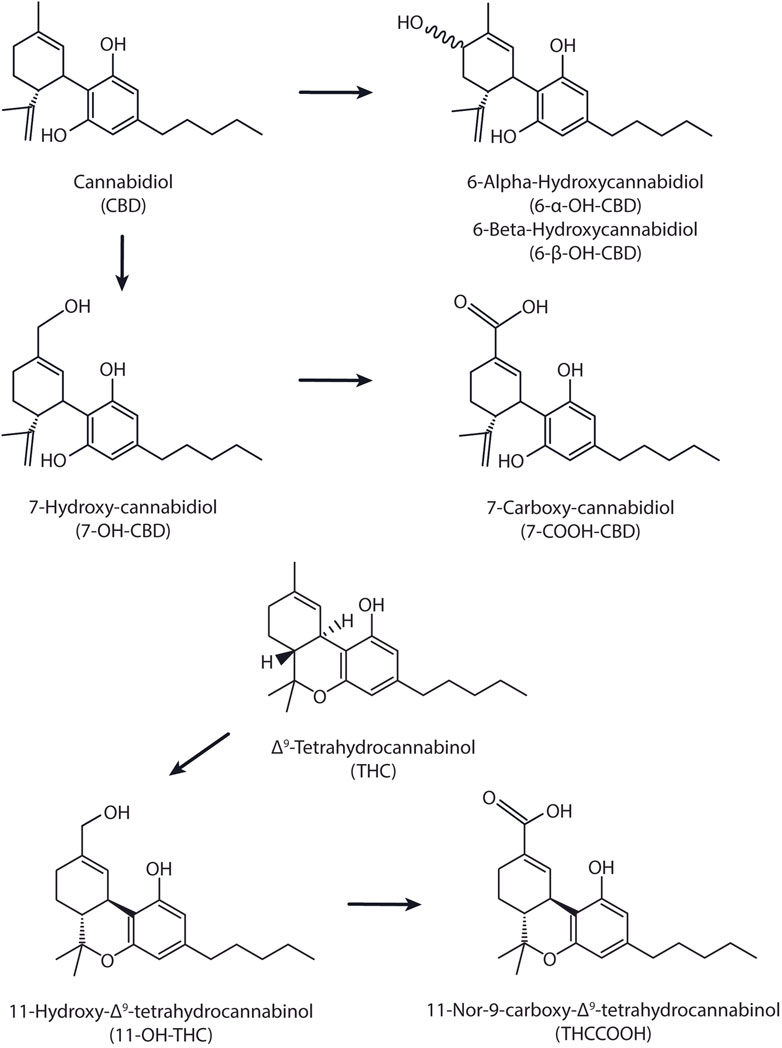
FIGURE 1. Chemical structures for CBD, THC, and their respective metabolites.
The method was validated over 5 days in blood samples following the most recent criteria for bioanalytical method development and validation (Peters et al., 2018; Wille et al., 2018), Linearity, sensitivity [limits of detection (LOD) and quantification (LOQ)], selectivity, accuracy, imprecision and carryover were calculated using five daily replicates of calibrators (six for each calibration curve) and five replicates of the three QC samples. Method validation results, presented in Tables 3, 4 were following the internationally established criteria (Peters et al., 2018; Wille et al., 2018). No relevant degradation was observed after any of the three freeze/thaw cycles, with differences in the initial concentration less than 15% for all the compounds under investigation. Similar results (differences from the initial concentration always lower than 15%) were obtained for the case of short-term and mid-term stability tests, confirming the validity of stored samples for analysis.
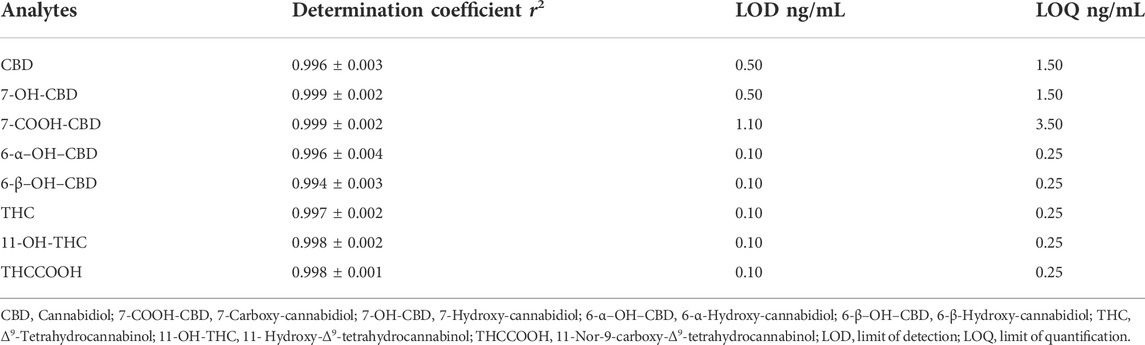
TABLE 3. Linearity, limits of detection (LOD) and limits of quantification (LOQ) for analytes under investigation in blood samples.
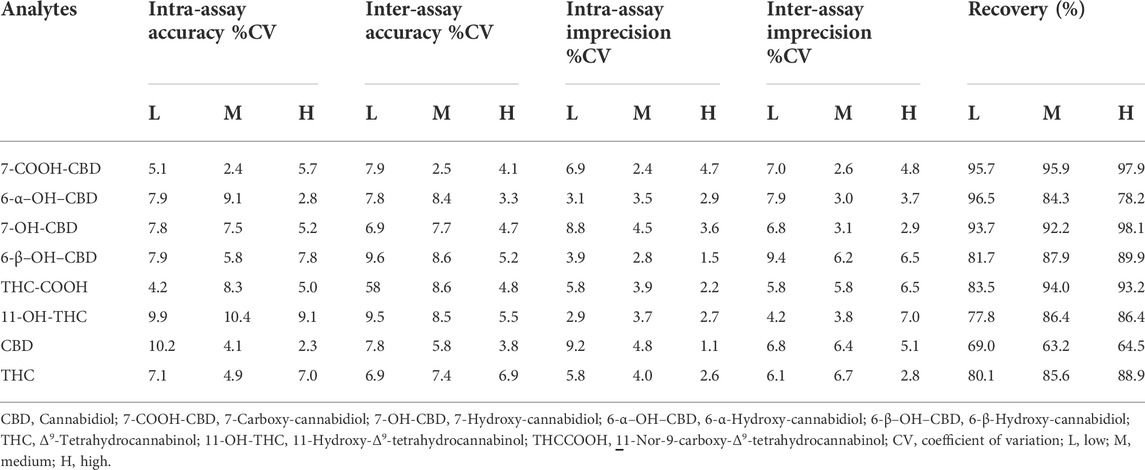
TABLE 4. Validation parameters for cannabinoid analytes under investigation in blood samples.
For proof of concept, the VAMS collection and analytical method were applied to seven samples from seven patients receiving various CBD formulations each at different therapeutic dosages. Four males (ages 3–12 years; weight: 11–28.4 kg) and three females (age range: 8–20 years; weight: 23.6–40 kg) were treated at the Giannina Gaslini Children’s Hospital provided samples. The study was approved by the Regional Ethical Committee (CER Liguria: 056/057/058/059-2019) and written informed consent was provided by patients or caregivers. Table 5 summarizes the patients’ results.
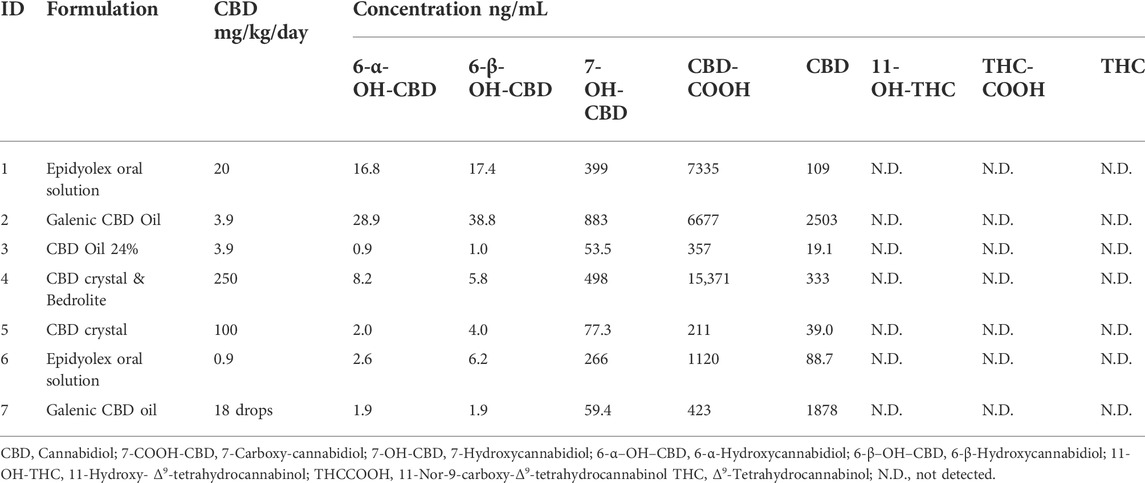
TABLE 5. Formulations, doses, and concentrations of CBD, THC, and their respective metabolites in patients’ blood samples collected with the VAMS technique after CBD therapy.
An analytical method was validated for the determination of CBD, THC, and their respective metabolites and later applied to clinical samples. Blood samples were collected from seven patients under treatment with CBD formulations. Blood CBD concentrations were higher for the patients treated with Galenic CBD oil (patients #2 and #7) compared to patients treated with other CBD preparations. 7-COOH-CBD, the inactive metabolite, was present in the highest concentrations, followed by 7-OH-CBD, and CBD. 6-α–OH–CBD and 6-β–OH–CBD concentrations were always lower than concentrations of the other CBD metabolites, but for the first time were detected in all patients’ samples, with the highest concentrations in patient #2. In previous studies, these two analytes were undetectable in some patients’ samples [4]. THC and its metabolites, THCCOOH and 11-OH-THC, were not detected, indicating that the CBD formulations contained little if any THC.
In conclusion, this simple and rapid UHPLC-MS/MS method enabled robust and sensitive quantification of CBD, THC, and their respective metabolites, with good precision, accuracy, and efficiency. Also, blood sample collection by a microsampling technique (VAMS) is a major advantage when dealing with patients, especially children to avoid invasive procedures during repeated venipunctures.
The original contributions presented in the study are included in the article/supplementary material, further inquiries can be directed to the corresponding author.
The studies involving human participants were reviewed and approved by Regional Ethical Committee (CER Liguria: 056/057/058/059-2019). Written informed consent to participate in this study was provided by the participants’ legal guardian/next of kin.
Conceptualization, FB, GC, and PS; Validation, SM, AL, AT, and FP; Formal Analysis, AC; Investigation, SM, AL, and AT; Resources, AR, AP, and EA; Writing – Original Draft Preparation, SM; Writing – Review & Editing, SM, AL, SB, FB, GC, and PS; Supervision, MH, FB, and PS; Funding Acquisition, GC, ADT, and PS.
This study was funded by the Italian Ministry of Health, RC 2022. We gratefully thank all Italian citizens who allocated the 5 × 1000 share of their tax payment in support of health research.
The authors would like to thank Simonetta di Carlo, Antonella Bacosi, Michele Sciotti, Josuè Gottardi, Chiara Fraioli and Laura Martucci for technical assistance.
The authors declare that the research was conducted in the absence of any commercial or financial relationships that could be construed as a potential conflict of interest.
All claims expressed in this article are solely those of the authors and do not necessarily represent those of their affiliated organizations, or those of the publisher, the editors and the reviewers. Any product that may be evaluated in this article, or claim that may be made by its manufacturer, is not guaranteed or endorsed by the publisher.
Arzimanoglou, A., Brandl, U., Cross, J. H., Gil-Nagel, A., Lagae, L., Landmark, C. J., et al. (2020). Epilepsy and cannabidiol: A guide to treatment. Epileptic Disord. 22, 1–14. doi:10.1684/epd.2020.1141
Barco, S., Castagnola, E., Moscatelli, A., Rudge, J., Tripodi, G., and Cangemi, G. (2017). Volumetric adsorptive microsampling-liquid chromatography tandem mass spectrometry assay for the simultaneous quantification of four antibiotics in human blood: Method development validation and comparison with dried blood spot. J. Pharm. Biomed. Anal. 145, 704–710. doi:10.1016/j.jpba.2017.07.033
Barco, S., Fucile, C., Manfredini, L., Grandis, E. D., Gherzi, M., Martelli, A., et al. (2018). A UHPLC-MS/MS method for the quantification of Δ9-tetrahydrocannabinol and cannabidiol in decoctions and in plasma samples for therapeutic monitoring of medical cannabis. Bioanalysis 10, 2003–2014. doi:10.4155/bio-2018-0184
Bergamaschi, M. M., Barnes, A., Queiroz, R. H. C., Hurd, Y. L., and Huestis, M. A. (2013). Impact of enzymatic and alkaline hydrolysis on CBD concentration in urine. Anal. Bioanal. Chem. 405, 4679–4689. doi:10.1007/s00216-013-6837-x
Biagini, D., Antoni, S., Lomonaco, T., Ghimenti, S., Salvo, P., Bellagambi, F. G., et al. (2020). Micro-extraction by packed sorbent combined with UHPLC-ESI-MS/MS for the determination of prostanoids and isoprostanoids in dried blood spots. Talanta 206, 120236. doi:10.1016/j.talanta.2019.120236
Brandt, C. (2019). Pharmacodynamic monitoring of antiepileptic drug therapy. Ther. Drug Monit. 41, 168–173. doi:10.1097/FTD.0000000000000623
Busardò, F. P., Pérez-Acevedo, A. P., Pacifici, R., Mannocchi, G., Gottardi, M., Papaseit, E., et al. (2021). Disposition of phytocannabinoids, their acidic precursors and their metabolites in biological matrices of healthy individuals treated with vaporized medical cannabis. Pharmaceuticals 14, 59. doi:10.3390/ph14010059
Degenhardt, F., Stehle, F., and Kayser, O. (2017). “Handbook of cannabis and related pathologies biology, pharmacology, diagnosis, and treatment,” in The biosynthesis of cannabinoids, 13–23. doi:10.1016/B978-0-12-800756-3.00002-8
Dubois, S., Marchese, F., Pigliasco, F., Barco, S., Tripodi, G., Lomonaco, T., et al. (2020). A volumetric absorptive microsampling technique to monitor cannabidiol levels in epilepsy patients. Front. Pharmacol. 11, 582286. doi:10.3389/fphar.2020.582286
D’Urso, A., Rudge, J., Patsalos, P. N., and De Grazia, U. (2019). Volumetric absorptive microsampling: A new sampling tool for therapeutic drug monitoring of antiepileptic drugs. Ther. Drug Monit. 41, 681–692. doi:10.1097/FTD.0000000000000652
Lattanzi, S., Brigo, F., Trinka, E., Zaccara, G., Striano, P., Del Giovane, C., et al. (2020). Adjunctive cannabidiol in patients with Dravet syndrome: A systematic Review and meta-analysis of efficacy and safety. CNS Drugs 343 34, 229–241. doi:10.1007/S40263-020-00708-6
Lattanzi, S., Trinka, E., Russo, E., Striano, P., Citraro, R., Silvestrini, M., et al. (2019). Cannabidiol as adjunctive treatment of seizures associated with Lennox-Gastaut syndrome and Dravet syndrome. Drugs Today 55, 177–196. doi:10.1358/DOT.2019.55.3.2909248
Malaca, S., Gottardi, M., Pigliasco, F., Barco, S., Cafaro, A., Amadori, E., et al. (2021). UHPLC-MS/MS analysis of cannabidiol and its metabolites in serum of patients with resistant epilepsy treated with CBD formulations. Pharmaceuticals 14, 630. doi:10.3390/ph14070630
Patsalos, P. N., Spencer, E. P., and Berry, D. J. (2018). Therapeutic drug monitoring of antiepileptic drugs in epilepsy: A 2018 update. Ther. Drug Monit. 40, 526–548. doi:10.1097/FTD.0000000000000546
Pérez-Acevedo, A. P., Busardò, F. P., Pacifici, R., Mannocchi, G., Gottardi, M., Poyatos, L., et al. (2020). Disposition of cannabidiol metabolites in serum and urine from healthy individuals treated with pharmaceutical preparations of medical cannabis. Pharmaceuticals 13, E459. doi:10.3390/ph13120459
Pérez-Acevedo, A. P., Pacifici, R., Mannocchi, G., Gottardi, M., Poyatos, L., Papaseit, E., et al. (2021). Disposition of cannabinoids and their metabolites in serum, oral fluid, sweat patch and urine from healthy individuals treated with pharmaceutical preparations of medical cannabis. Phytother. Res. 35, 1646–1657. doi:10.1002/ptr.6931
Peters, F. T., Wissenbach, D. K., Busardo, F. P., Marchei, E., and Pichini, S. (2018). Method development in forensic toxicology. Curr. Pharm. Des. 23, 5455–5467. doi:10.2174/1381612823666170622113331
Pichini, S., Malaca, S., Gottardi, M., Pérez-Acevedo, A. P., Papaseit, E., Perez-Maña, C., et al. (2021). UHPLC-MS/MS analysis of cannabidiol metabolites in serum and urine samples. Application to an individual treated with medical cannabis. Talanta 223, 121772. doi:10.1016/j.talanta.2020.121772
Pichini, S., Mannocchi, G., Gottardi, M., Pérez-Acevedo, A. P., Poyatos, L., Papaseit, E., et al. (2020). Fast and sensitive UHPLC-MS/MS analysis of cannabinoids and their acid precursors in pharmaceutical preparations of medical cannabis and their metabolites in conventional and non-conventional biological matrices of treated individual. Talanta 209, 120537. doi:10.1016/j.talanta.2019.120537
Pigliasco, F., Barco, S., Dubois, S., Marchese, F., Striano, P., Lomonaco, T., et al. (2020). Cannabidiol determination on peripheral capillary blood using a microsampling method and ultra-high-performance liquid chromatography tandem mass spectrometry with on-line sample preparation. Molecules 25, E3608. doi:10.3390/molecules25163608
Striano, S., Striano, P., Capone, D., and Pisani, F. (2008). Limited place for plasma monitoring of new antiepileptic drugs in clinical practice. Med. Sci. Monit. 14, RA173–RA178.
Ujváry, I., and Hanuš, L. (2016). Human metabolites of cannabidiol: A Review on their formation, biological activity, and relevance in therapy. Cannabis Cannabinoid Res. 1, 90–101. doi:10.1089/can.2015.0012
Keywords: cannabinoids, medical cannabis, serum, CBD metabolites, UHPLC-MS/MS
Citation: Pigliasco F, Malaca S, Lo Faro AF, Tini A, Cangemi G, Cafaro A, Barco S, Riva A, Pisati A, Amadori E, Striano P, Tagliabracci A, Huestis MA and Busardò FP (2022) Cannabidiol, ∆9-tetrahydrocannabinol, and metabolites in human blood by volumetric absorptive microsampling and LC-MS/MS following controlled administration in epilepsy patients. Front. Pharmacol. 13:1038754. doi: 10.3389/fphar.2022.1038754
Received: 07 September 2022; Accepted: 10 October 2022;
Published: 24 October 2022.
Edited by:
Francesca Baratta, University of Turin, ItalyReviewed by:
Abuzar Kabir, Florida International University, United StatesCopyright © 2022 Pigliasco, Malaca, Lo Faro, Tini, Cangemi, Cafaro, Barco, Riva, Pisati, Amadori, Striano, Tagliabracci, Huestis and Busardò. This is an open-access article distributed under the terms of the Creative Commons Attribution License (CC BY). The use, distribution or reproduction in other forums is permitted, provided the original author(s) and the copyright owner(s) are credited and that the original publication in this journal is cited, in accordance with accepted academic practice. No use, distribution or reproduction is permitted which does not comply with these terms.
*Correspondence: Sebastiano Barco, c2ViYXN0aWFub2JhcmNvQGdhc2xpbmkub3Jn
†These authors have contributed equally to this work
Disclaimer: All claims expressed in this article are solely those of the authors and do not necessarily represent those of their affiliated organizations, or those of the publisher, the editors and the reviewers. Any product that may be evaluated in this article or claim that may be made by its manufacturer is not guaranteed or endorsed by the publisher.
Research integrity at Frontiers
Learn more about the work of our research integrity team to safeguard the quality of each article we publish.