
94% of researchers rate our articles as excellent or good
Learn more about the work of our research integrity team to safeguard the quality of each article we publish.
Find out more
ORIGINAL RESEARCH article
Front. Pharmacol. , 09 November 2022
Sec. Experimental Pharmacology and Drug Discovery
Volume 13 - 2022 | https://doi.org/10.3389/fphar.2022.1031969
This article is part of the Research Topic Model-informed drug development and precision dosing in clinical pharmacology practice View all 8 articles
 Xiao-Jun Cai1,2
 Rui-Dong Li3
 Jian-Hua Li3
 Yi-Feng Tao3
 Quan-Bao Zhang3
 Cong-Huan Shen3Xiao-Fei Zhang3
 Zheng-Xin Wang3*
 Zheng Jiao2*
Background and Objective: Tacrolimus, a calcineurin inhibitor widely used as a potent immunosuppressant to prevent graft rejection, exhibits nonlinear kinetics in patients with kidney transplantation and nephrotic syndrome. However, whether nonlinear drug metabolism occurs in adult patients undergoing liver transplantation remains unclear, as do the main underlying mechanisms. Therefore, here we aimed to further confirm the characteristics of nonlinearity through a large sample size, and determine the potential influence of nonlinearity and its possible mechanisms.
Methods: In total, 906 trough concentrations from 176 adult patients (150 men/26 women; average age: 50.68 ± 9.71 years, average weight: 64.54 ± 11.85 kg after first liver transplantation) were included in this study. Population pharmacokinetic analysis was performed using NONMEM®. Two modeling strategies, theory-based linear compartmental and nonlinear Michaelis–Menten (MM) models, were evaluated and compared. Potential covariates were screened using a stepwise approach. Bootstrap, prediction-, and simulation-based diagnostics (prediction-corrected visual predictive checks) were performed to determine model stability and predictive performance. Finally, Monte Carlo simulations based on the superior model were conducted to design dosing regimens.
Results: Postoperative days (POD), Aspartate aminotransferase (AST), daily tacrolimus dose, triazole antifungal agent (TAF) co-therapy, and recipient CYP3A5*3 genotype constituted the main factors in the theory-based compartmental final model, whereas POD, Total serum bilirubin (TBIL), Haematocrit (HCT), TAF co-therapy, and recipient CYP3A5*3 genotype were important in the nonlinear MM model. The theory-based final model exhibited 234 L h−1 apparent plasma clearance and 11,000 L plasma distribution volume. The maximum dose rate (Vmax) of the nonlinear MM model was 6.62 mg day−1; the average concentration at steady state at half-Vmax (Km) was 6.46 ng ml−1. The nonlinear MM final model was superior to the theory-based final model and used to propose dosing regimens based on simulations.
Conclusion: Our findings demonstrate that saturated tacrolimus concentration-dependent binding to erythrocytes and the influence of daily tacrolimus dose on metabolism may partly contribute to nonlinearity. Further investigation is needed is need to explore the causes of nonlinear pharmacokinetic of tacrolimus. The nonlinear MM model can provide reliable support for tacrolimus dosing optimization and adjustment in adult patients undergoing liver transplantation.
Tacrolimus, a potent calcineurin inhibitor, constitutes the cornerstone of most immunosuppressive regimens for solid organ transplantation (Bentata, 2020). It is highly lipophilic and poorly soluble, with a mean bioavailability of 25% (4–89%) (Jusko et al., 1995). Orally administered tacrolimus is rapidly absorbed, reaching peak concentration after 0.5–1 h, and extensively binding to erythrocytes and albumin (approximately 99%) (Yu et al., 2018). Subsequently, it undergoes extensive first-pass metabolism, primarily via the cytochrome P450 isoenzymes CYP3A4 and CYP3A5 and the efflux pump P-glycoprotein (P-gp) (Vanhove et al., 2016). Finally, tacrolimus is fully converted into metabolites that are mainly excreted through bile (>95%) into the feces, with <1% of the parent drug remaining unchanged in the urine or feces (Moller et al., 1999; Staatz and Tett, 2004).
Tacrolimus exhibits a narrow therapeutic index and large intra- and inter-individual pharmacokinetic (PK) variability in liver transplant recipients owing to multiple factors (Coste and Lemaitre, 2022), including postoperative time (POD), patient demographics, analytical assay type, daily tacrolimus dose (DD), graft type (whole or split-liver), hepatic function, concomitant food intake, gastrointestinal disorders, drug–drug interactions, and genetic factors (Christians et al., 2002; Van Boekel et al., 2012; Campagne et al., 2019), especially single-nucleotide polymorphisms in CYP3A genes (i.e., CYP3A5*3 (rs776746) and CYP3A4*1G (rs2242480) alleles) (Andreu et al., 2017; Dong et al., 2022). Small ubiquitin-like modifier 4 (SUMO4) directly or indirectly regulates the CYP3A5 enzyme through the NF-κB signaling pathway, and a SUMO4 (rs237025) genetic variant is associated with a higher tacrolimus dose-corrected concentration (C0 D−1) early after liver transplantation (Zhang et al., 2018). Such increased tacrolimus exposure is primarily regulated by NR112 (rs2276707), which encodes a nuclear receptor that regulates CYP3A and drug transporter expression (Kliewer et al., 2002; Barraclough et al., 2012).
This variability affords higher risk for poor long-term outcomes, such as late allograft rejection, graft loss, adverse effects (e.g., nephrotoxicity and hypertension), and death despite transplant function (Lieber and Volk, 2013; Alissa et al., 2022). To optimize therapeutic efficacy and minimize tacrolimus-induced toxicity, therapeutic drug monitoring (TDM) and population pharmacokinetic (popPK) models are widely used to guide personalized tacrolimus dosing and ensure target whole-blood trough concentrations (C0), especially early post-transplantation (De Jonge et al., 2009; Campagne et al., 2019).
We previously reported nonlinear tacrolimus kinetics in adult patient populations receiving liver and kidney transplantations (Zhao et al., 2016; Cai et al., 2020), similar to results in pediatric patients with primary nephrotic syndrome (PNS) (Huang et al., 2020). Moreover, tacrolimus PK nonlinearity differed among solid organ transplantations (Cai et al., 2020). Such nonlinearity may partly derive from its poor aqueous solubility (1–2 μg ml−1) (Lee et al., 2016) and low intestinal membrane permeability (Tamura et al., 2002), leading to dissolution rate-limited absorption in the gut and variable and low oral bioavailability. Additionally, saturated tacrolimus concentration-dependent binding to erythrocytes and albumin might facilitate nonlinear PK behavior, especially regarding drug distribution (Chow et al., 1997). The TDM effect may also engender nonlinearity, as higher drug clearance is usually associated with lower drug concentrations, leading to higher prescribed doses. Consequently, TDM induces a correlation between total DD and clearance. This may be classified as nonlinear with sampling below three dose levels (Ahn et al., 2005).
Therefore, the present study aimed to 1) further confirm tacrolimus nonlinearity in liver transplant recipients and investigate possible nonlinear mechanisms by expanding the sample size and applying two modeling strategies, theory-based linear compartmental and nonlinear Michaelis–Menten (MM) models, and comparing their differences; 2) further identify any variability, including genetic information of tacrolimus PK, based on routine TDM data prospectively collected at Huashan Hospital to facilitate dose individualization; and 3) propose initial dosing regimens early after adult liver transplantation via Monte Carlo simulations based on the superior model.
A total of 176 adult recipients (150 men/26 women) who underwent their first liver transplantation using organs donated after cardiac death and received immediate-release oral tacrolimus capsules (Prograf, Astellas, Dublin, Ireland) at Huashan Hospital, Fudan University, from June 2018 to October 2019, were included. Patient follow-up was conducted until the day of post-surgery discharge. To ensure tacrolimus concentrations at or near the steady state, records were retrieved only after ≥3 repeated oral doses administered at consistent dose rates. Exclusion criteria included severe gastrointestinal disorders, acute rejection, or secondary liver transplantation.
Tacrolimus C0, laboratory test results, and concomitant medications were prospectively acquired. Patient demographic characteristics, such as body weight, height, age, sex, grafted hepatic weight, dosing regimen, and sampling time, were collected. The study protocol was approved by the Ethics Committee of Huashan Hospital, Fudan University, and registered at the Center for Clinical Research and Biostatistics (www2.ccrb.edu.hk, No: CUHK_TMP00250). Written informed consent was obtained from all subjects. This study was conducted in accordance with the Declaration of Helsinki (2013).
All patients received post-transplantation immunosuppressive therapy with tacrolimus and steroids. The tacrolimus dosage was initially 0.5–1 mg every 12 h (q12 h) and then empirically adjusted to achieve steady-state C0 within 8–12, 8–10, and 6–8 ng ml−1 in the first 3, between 3 and 6, and subsequent postoperative months, respectively.
Intravenous methylprednisolone (500 mg) was administered on the operative day, followed by 80 mg q12 h on postoperative days 1–3, tapering to 80, 40, and 20 mg day−1 on postoperative days 4–5, 6–7, and 8–10, respectively. Oral prednisolone (12 mg day−1) was started on postoperative day 11 and tapered to 4 mg day−1 at a rate of 4 mg day−1, except for patients with hepatocellular carcinoma who underwent liver transplantation. During the second postoperative month, corticosteroid-free treatment was administered, except for patients with autoimmune hepatitis. Mycophenolate mofetil (CellCept, Roche Pharma Ltd., Shanghai, China) was administered orally q12 h at 0.5 g day−1 to recipients exhibiting a glomerular filtration rate below 60 ml min−1 per 1.73 m2.
Whole blood samples were drawn before the morning dose to measure C0 using an enzyme-multiplied immunoassay technique (SYVA Viva-Emit 2000 kit, Siemens Healthcare Diagnostics Inc., Germany). The coefficient of variation of intra- and inter-day precision was within 10% (calibration range 2.0–30 ng ml−1).
Ethylenediaminetetra acetic acid-anticoagulated whole blood obtained from liver transplant recipients and their corresponding donors was stored at −20°C. Genotyping of four single-nucleotide polymorphisms: CYP3A5*3 (rs776746), CYP3A4*1G (rs2242480), SUMO4 (rs237025), and NR112 (rs2276707) was performed by an independent external contractor (Sangon Biotechnology Co., Ltd., Shanghai, China) using a DNA direct sequencing analyzer (Applied Biosystems 3730XL, Foster City, CA, United States). Allele and genotype frequencies were analyzed using the online software SHEsis (http://analysis.bio-x.cn/myAnalysis.php). Hardy–Weinberg equilibrium was assessed using Pearson’s chi-squared test. Appendix S1 includes gene amplification and sequencing details.
PopPK analysis was performed using nonlinear mixed-effects modeling software (NONMEM®, version 7.4; ICON Development Solutions, Ellicott City, MD, United States) compiled with gfortran 4.6.0 and interfaced with Perl-speaks-NONMEM (version 4.7.0; uupharmacometrics.github.io/PsN). The NONMEM output was analyzed using R software (version 3.5.1; www.r-project.org). First-order conditional estimation methodology with interaction between interpatient and residual variability was employed for model development.
Two modeling strategies, theory-based linear compartmental and nonlinear MM empirical modeling, were employed in model development. In theory-based modeling strategies, the whole blood concentration (Cwb) of tacrolimus is converted into plasma concentration (Cp) because of saturated binding to red blood cells. The theory-based linear PK model was a one-compartment model with first-order absorption and elimination and was parameterized in terms of apparent total plasma clearance (CLpl/F), apparent plasma distribution volume (Vpl/F), and absorption rate constant (Ka). As no sampling was performed during the absorption phase, Ka was fixed at 4.48 h−1 based on published data (Zhu et al., 2015).
The nonlinear MM empirical formula is shown as follows:
where Dose is the daily oral tacrolimus dose, Vm is the maximum steady-state dosing rate (DD) (mg day−1), and Km is an MM constant equal to the steady-state concentration at the half-maximum dose rate (ng ml−1). C0 represents steady-state values for at least three oral doses.
Inter-subject variability (ISV) in PK parameters, except Ka, is described by the exponential model below:
where Pi is the PK parameter estimation of the ith subject and TV(P) is the typical value of the population parameter. ηi is defined as the symmetrically distributed ISV (mean = 0; variance = ωi2).
Residual unexplained variability (RUV) was tested using additive (Eq. 3), proportional (Eq. 4), and combination error (Eq. 5) models.
where Y is the observed concentration, F is the individual predicted concentration, and εn represents the symmetrically distributed random variability (mean = 0; variance = σn2).
The influence of potential covariates on tacrolimus PK variability, including age, sex, height, body weight (WT), fat-free mass, grafted hepatic weight, hematocrit (HCT), albumin (ALB), aspartate aminotransferase (AST), total serum bilirubin (TBIL), creatinine clearance, POD, concomitant medications, and CYP3A5*3, CYPP3A4*1G, SUMO4, and NR112 genetic polymorphisms in both donors and recipients, was investigated. The daily tacrolimus dose was screened only for the theory-based linear compartmental model. Only co-medications with a proportion >10% in all patients were tested. These covariates were selected as clinically plausible.
The potential influence of nonlinearity and the functional forms of covariates on model predictability were tested using two modeling strategies.
A theory-based linear compartmental model was developed based on well-accepted theoretical relationships. Tacrolimus extensively binds to erythrocytes, albumin, and a1-acid glycoprotein (>99%; <1% remaining unbound) (Yu et al., 2018). Free tacrolimus concentration depends on its affinity to plasma proteins and erythrocytes. HCT-standardized concentrations maintain a stable ratio with therapeutically active unbound concentrations (assumed to be proportional to Cp). To eliminate the influence of confounding factors of HCT changes on predicting tacrolimus concentration, the Cwb was converted into Cp. PK disposition parameters were estimated from model-predicted Cp rather than measured Cwb under the assumption that tacrolimus binds linearly to plasma components but nonlinearly (strongly) to erythrocytes (Storset et al., 2014a).
Similar to published descriptions (Storset et al., 2014a; Van Erp et al., 2016), tacrolimus Cp was estimated as follows:
where Cwb and Cp are given in ng mL−1, and HCT as %. Bmax is the maximum drug concentration that can be bound per unit volume of red blood cells equal to 418 μg L−1, KD is a dissociation equilibrium constant equal to 3.8 μg L−1 (Jusko et al., 1995; Storset et al., 2014a).
Therefore, all parameter estimates are expressed as plasma PK parameters and the model can predict both Cwb and Cp, provided that HCT is known.
Covariate influence on the MM constant (Km) was empirically investigated. As the tacrolimus steady-state PK changed with time after transplantation and the cut-off point was approximately 10 days after surgery, time factors (10/θ, Eq. 7) were introduced to investigate whether the MM model with time-variant Km was superior.
where θ = POD if 0 < POD≤10, or = 10 if POD >10.
Continuous covariates were normalized to the population median values and modeled using linear (Eq. 8), exponential (Eq. 9), and power (Eq. 10) models.
where COVi is the covariate value of the ith individual, COVmedian is the population median value of the covariate, and θcov is the coefficient term of the covariate effect to be estimated.
The binary covariates, such as concomitant medications, were tested using a scale model (Eq. 11).
where TV(P) is the typical value for parameter P without co-therapy with azole antifungal agents (COVi = 0) and θcov is the fractional change in parameter P with co-therapy (COVi = 1). For the effect of genetic polymorphism, TV(P) is the typical value for parameter P for the wild-type genotype (COVi = 0), and θcov is the fractional change in parameter P for the heterozygous (COVi = 1) or mutant (COVi = 2) genotypes. Mutant and heterozygous genotypes can also be grouped together (COVi = 1) as a binary covariate for analysis.
Covariates were screened in a stepwise manner, with forward inclusion and backward elimination. Individual variable effect on the parameters was tested using the likelihood ratio. For forward inclusion, an objective function value (OFV) reduction of at least 3.84 for 1 degree of freedom (df) (χ2 test, p < 0.05, df = 1) was used as a criterion for covariate inclusion. For backward elimination, an OFV increase ≥6.63 (χ2 test, p < 0.01, df = 1) served as a criterion for covariate retention.
Covariates without pharmacological or biological plausibility or with <20% effect on a parameter were not retained. Improved parameter estimation precision and goodness-of-fit (GOF) plots, reduced ISV and RUV, and parameter estimate stability were also used to select covariates. Shrinkage extent was evaluated using the final model.
Prediction- and simulation-based diagnostics were conducted to compare the predictive performances of the two models. GOF plots, including observed concentrations (OBS) versus population prediction (PRED), individual prediction (IPRED), conditional weighted residuals (CWRES) versus PRED, and time-after-dose (TAD) were used to evaluate the fit of the final model to the data.
PREDs and IPREDs were estimated and compared to the corresponding OBS based on the relative prediction error (PE%, Eq. 12) and individual prediction error (IPE%, Eq. 13), respectively.
The median prediction error (MDPE%) and median absolute prediction error (MAPE%) were used to test predictive performance accuracy and precision, respectively. PE% within ±20% (F20) and 30% (F30), indices of both accuracy and precision, were also calculated. Models with lower MDPE and MAPE values and less PE% beyond ±20 and ±30% were considered superior. IF20 and IF30, indicating IPE% within ±20% and ±30%, respectively, were also used as a combination index of both accuracy and precision.
Additionally, nonparametric bootstrap, prediction- and variability-corrected visual predictive checks (pvcVPCs), and normalized prediction distribution errors (NPDEs) were employed to assess the candidate final model. For the nonparametric bootstrap procedure, 1,000 replicate bootstrap datasets were generated by random resampling from the raw database and fitted with the same model to obtain parameter estimates for each replicate. The medians and 2.5th–97.5th percentiles of the parameters after bootstrap runs with successful convergence were compared with the final model parameter estimates.
For the pvcVPCs, 1,000 new datasets were simulated in NONMEM using the final model to simulate the expected concentrations. The concentration–time profiles were plotted for the 50th, 10th, and 90th percentiles of the simulated data and overlaid with the observed data.
NPDE with 2000 simulations was performed for each observation in the raw dataset using the final model. The NPDE results were summarized statistically and graphically using the NPDE add-on package in R (version 2.0; www.npde.biostat.fr). Their distributions were evaluated to test whether the final model fully described the observed data; plots of NPDEs versus observations and time were also investigated.
Given how crucial is the target tacrolimus C0 (8–12 ng ml −1) in the first week post-transplantation, Monte Carlo simulations were performed to optimize the starting dosing regimen based on the established final popPK model and identified covariates to achieve the target tacrolimus C0 after 7 days multiple oral doses. From 200 simulations performed using the initial dataset, the steady-state C0 of each simulated subject was calculated.
A total of 906 tacrolimus C0 values obtained from 176 liver transplant patients were prospectively collected during hospitalization of eligible patients. Table 1 shows the main demographic characteristics of the enrolled patients. Each patient had a median of five tacrolimus observations (mean tacrolimus dose: 2.73 ± 1.56 mg day−1; corresponding median C0: 5.96 (0.30–23.11) ng ml−1. Concentrations below lower quantification limits were not included in the analysis. Table 2 lists recipient and corresponding donor CYP3A5*3, CYP3A4*1G, SUMO4, and NR112 allele frequencies. These two genotypes showed no deviation from Hardy–Weinberg equilibrium (p > 0.05).
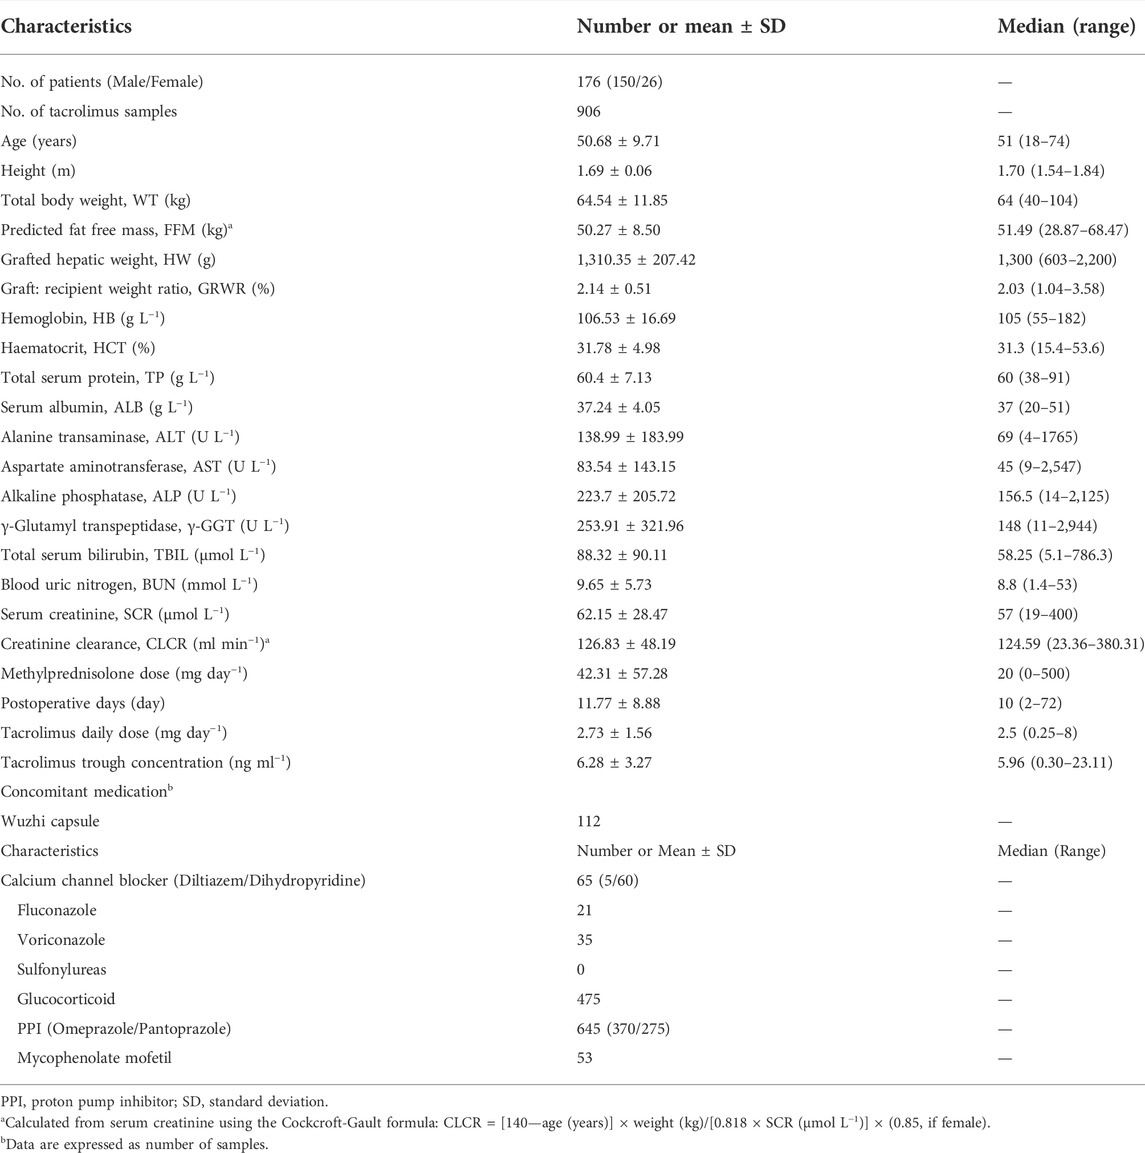
TABLE 1. Demographic and clinical characteristics of participants after liver transplantation used for model development.
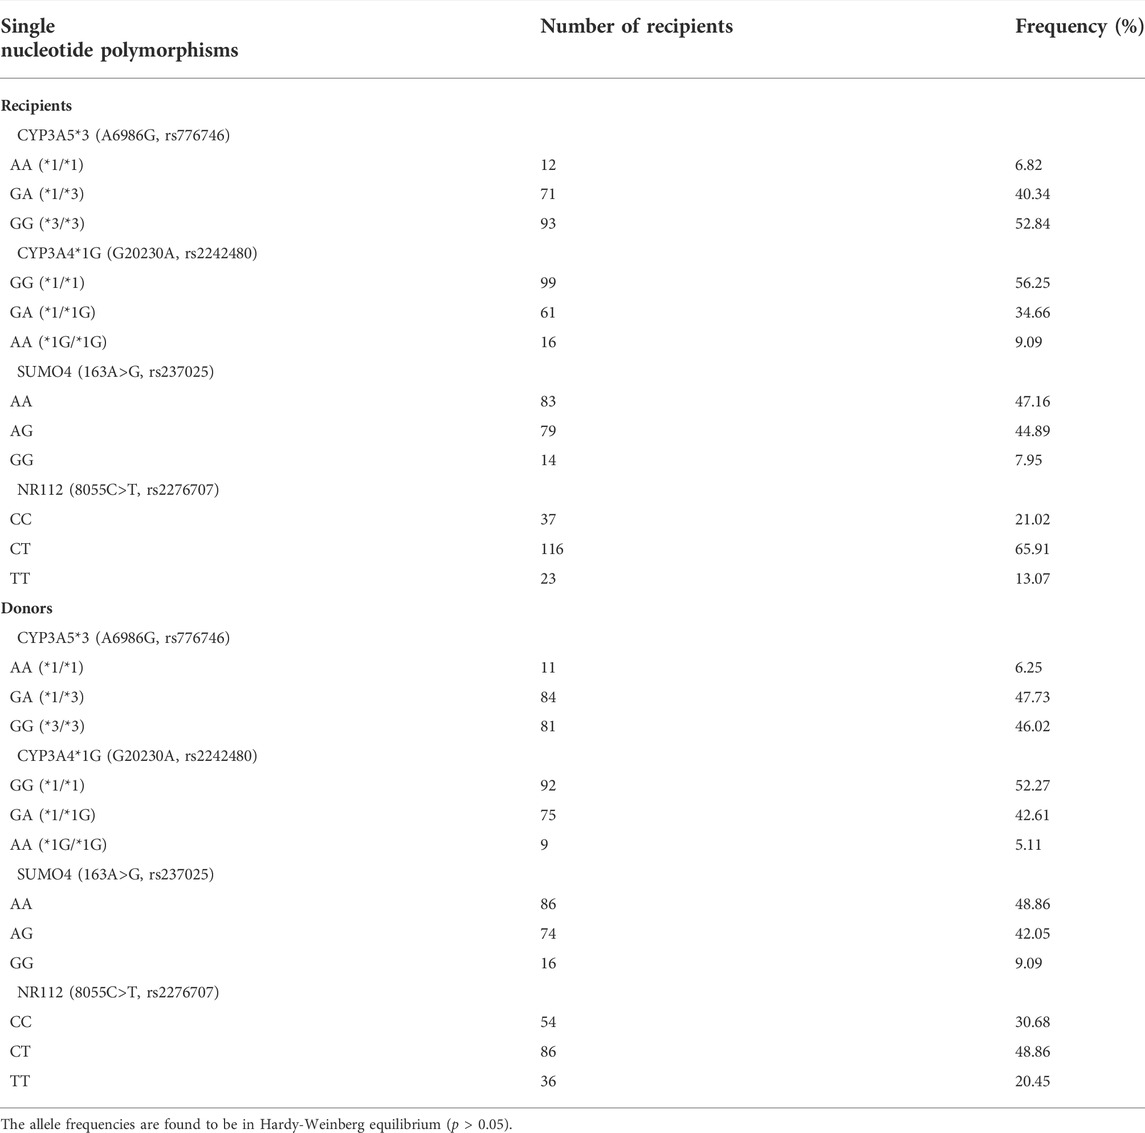
TABLE 2. Allele frequencies of single nucleotide polymorphisms in CYP3A5*3, CYP3A4, SUMO4, and NR112 genes of the development dataset.
In the process of theory-based modeling, a one-compartment model with first-order absorption and elimination was selected as the structural model, and Ka was fixed at 4.48 h−1. Typical population values of the PK parameters CLpl/F and Vpl/F were 456 and 10,700 L h−1, respectively. The inter-subject variabilities of CLpl/F and Vpl/F were 42.2 and 64.4%, respectively. Residual variability was described using a proportional error model. Table 3 present the estimated results.
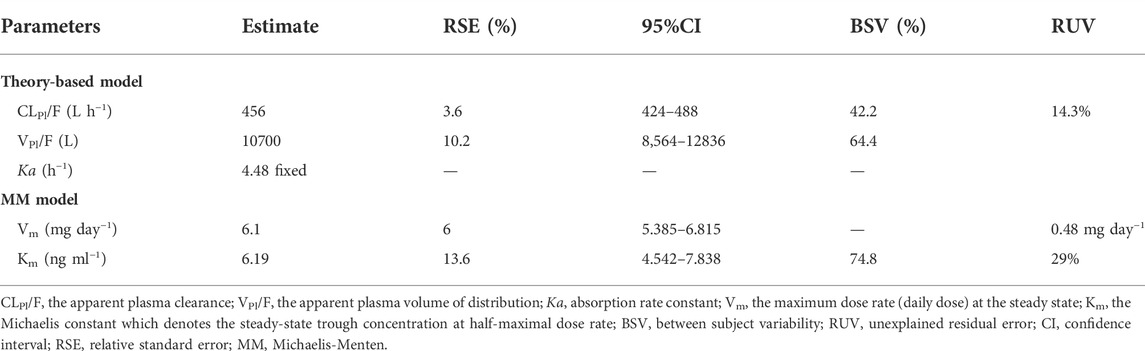
TABLE 3. Population pharmacokinetic parameters of MM and theory-based base models.
The base popPK model was described as follows:
The stepwise method was used to examine covariate influence on PK parameters. OFV decreased significantly (∆OFV = −357.745) upon DD inclusion in CLPl/F in the form of a nonlinear power function. Inter-individual CLPl/F variability decreased by 16.8%, which markedly improved the goodness-of-fit of the model. These results further suggested that tacrolimus exhibits nonlinear PK characteristics. We then included POD in VPl/F, and the OFV further decreased by 49.935. AST, tacrolimus DD, co-medication with triazole antifungal drugs (TAF), and the recipient CYP3A5*3 genotype were added to CLPl/F during the forward inclusion process. No covariate was removed during backward elimination. Supplementary Table S1 list the processes of forward inclusion and backward elimination. The final popPK model was described as follows:
where DD is in mg day−1.
All parameter precisions represented by a standard error were acceptable. The population pharmacokinetic parameter estimates and precision of the final model with covariates are presented in Table 4.
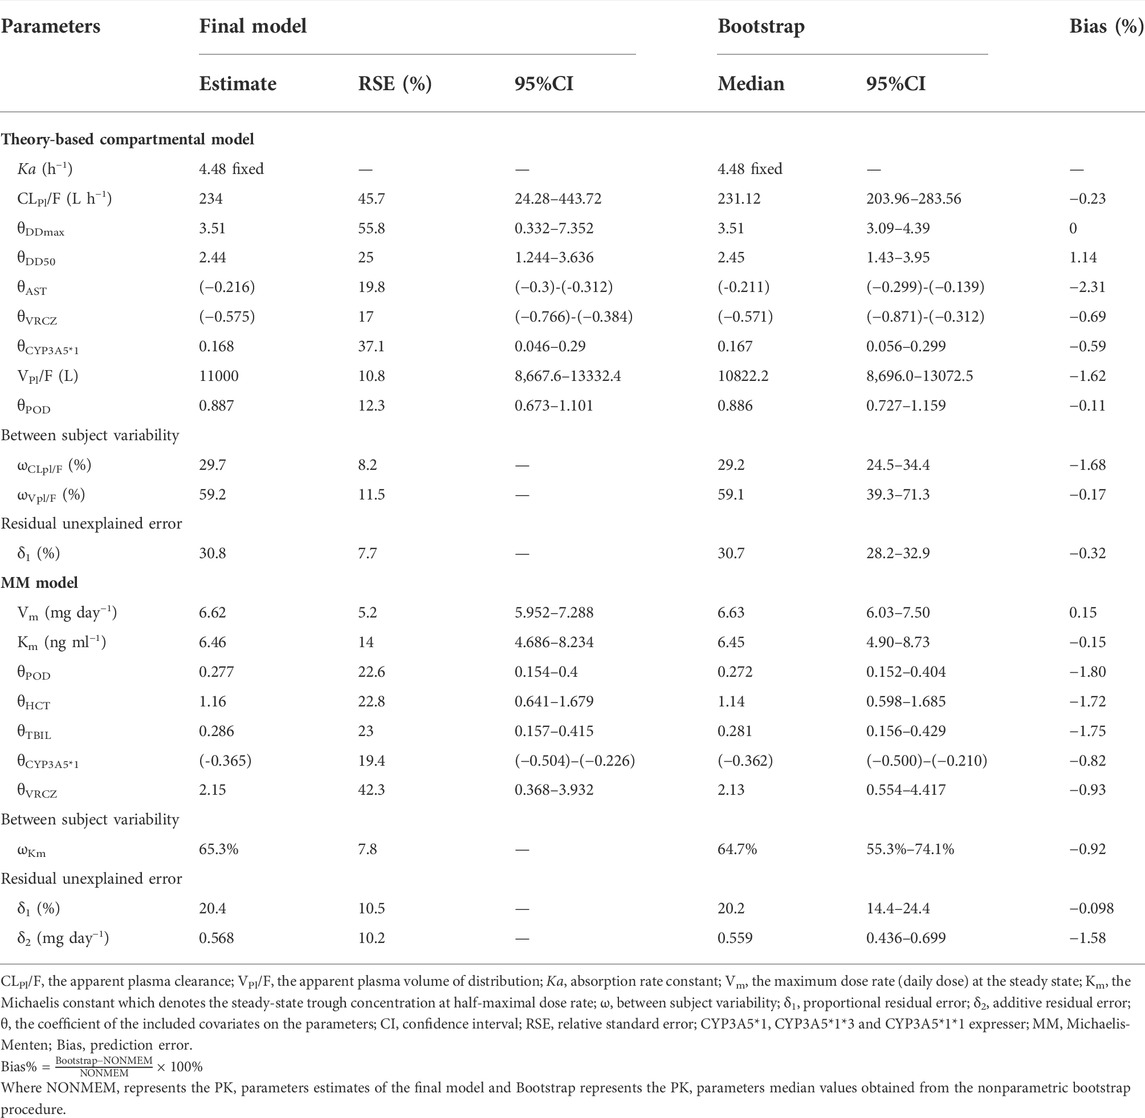
TABLE 4. Pharmacokinetic parameter estimates for the final models and Bootstrap results.
To better estimate the parameters, Vm inter-subject variability was fixed at 0. Typical population PK parameter values were 6.1 mg day−1 for Vm and 6.19 ng ml−1 for Km; Km inter-individual variability was 74.8%. The combination error model best described the residual variability. Table 3 summarize the parameter estimates.
The base popPK model was described as follows:
The MM model describes the nonlinear relationship between drug DD and steady state C0. Following POD addition to Km in the form of an exponential (∆OFV = −36.688) or power function (∆OFV = −90.911), OFV significantly decreased. Upon including the time factors (10/θ) into Km based on parameter and covariate correlation analysis (Supplementary Figure S1), OFV further decreased by 67.657, suggesting that Km exhibits the characteristics of a time-dependent variant. However, the addition of WT did not yield significant changes (p < 0.05).
Because of the predominant hepatic metabolism and bile-based excretion of tacrolimus, we investigated the effects of ALT and TBIL levels as covariates on model fitting. TBIL inclusion in Km (∆OFV = −13.328) led to approximately 5% decrease in Km inter-individual variability. Consistent with its association with erythrocyte levels in vivo and effects on tacrolimus distribution, HCT incorporation into Km improved model fitting (△OFV = −38.741). Addition of the CYP3A5*3 binary covariate to Km also yielded significant change (△OFV = −15.933), whereas including other polymorphisms did not improve model goodness-of-fit, regardless of whether two or three classification covariates were evaluated.
TAFs, such as voriconazole and fluconazole, were investigated as binary variables because they can significantly affect tacrolimus metabolism. Including this covariate in Km decreased OFV by more than 3.84 (△OFV = −43.629). The addition of other covariates, such as concomitant medication hormones, did not significantly affect the forward inclusion process. The final covariates added in this process were POD, time factors (10/θ), TBIL, HCT, CYP3A5*3, and TAF. No covariate was removed during backward elimination. Supplementary Table S2 present the results.
The final popPK model was described as follows:
All parameter precisions represented by a standard error were acceptable. The population pharmacokinetic parameter estimates and precision of the final model with covariates are listed in Table 4.
Figure 1A shows the GOF plots of the base and final models. No significant structural bias or obvious systematic deviations were found in the final model, and data fitting was improved compared with the base model. Most CWRES values of the final model were within ±2, indicating an acceptable fit.
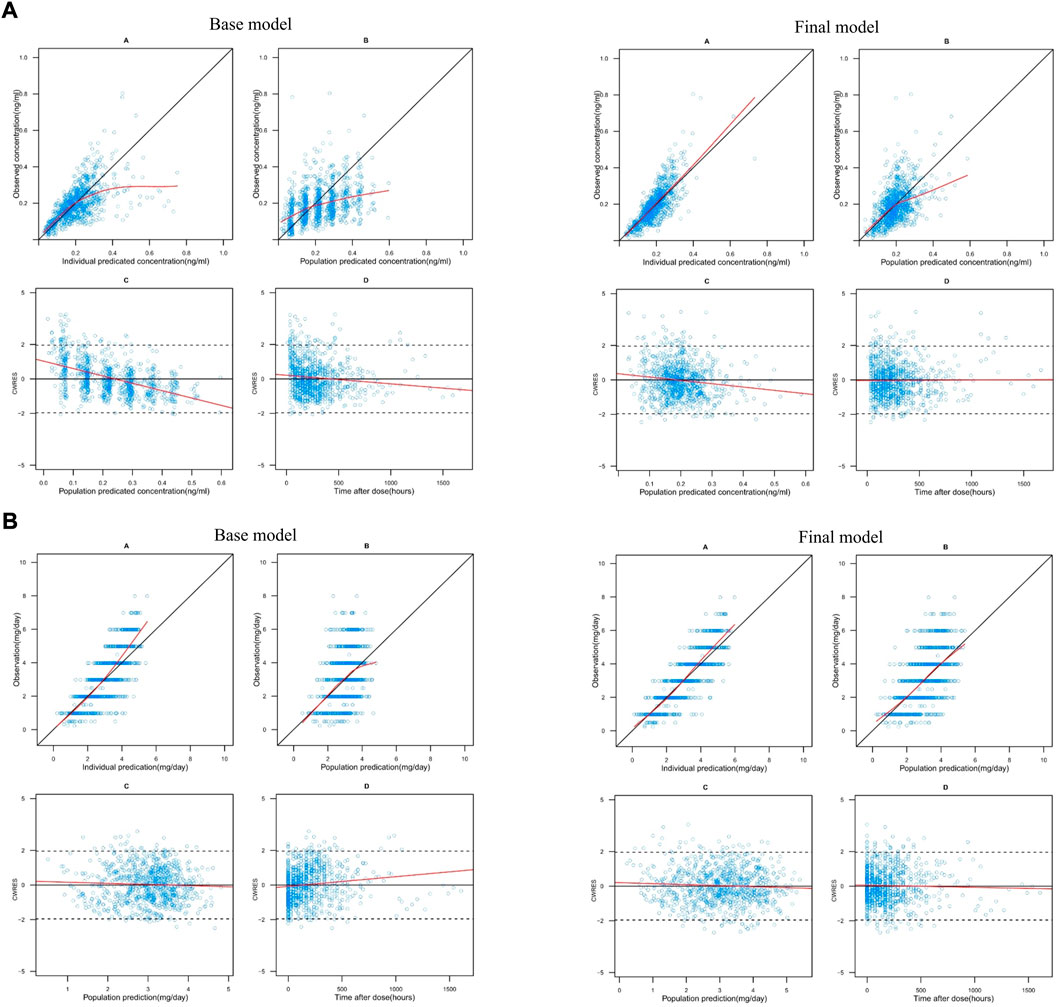
FIGURE 1. (A) Goodness-of-fit plots for the theory-based base and final model. In each model: A. observations (y-axis) vs. individual predictions (x-axis), B. observations (y-axis) vs. population predictions (x-axis), C. conditional weighted residuals (CWRES) (y-axis) vs. population predictions (x-axis) and D. CWRES (y-axis) vs. time after dose (x-axis). In plots A and B, the black solid lines are identity lines. In plots C and D, the black solid and dashed lines represent the y = 0 and y = ±1.96 reference lines, respectively. The red solid lines represent local polynomial regression (lowess) lines. (B) Goodness-of-fit plots for the MM base and final model. In each model: A. observations (y-axis) vs. individual predictions (x-axis), B. observations (y-axis) vs. population predictions (x-axis), C. conditional weighted residuals (CWRES) (y-axis) vs. population predictions (x-axis) and D. CWRES (y-axis) vs. time after dose (x-axis). In plots A and B, the black solid lines are identity lines. In plots C and D, the black solid and dashed lines represent the y = 0 and y = ±1.96 reference lines, respectively. The red solid lines represent local polynomial regression (lowess) lines.
The MAPE, F20, F30, MAIPE, IF20, IF30, MDPE, and MDIPE values of the theory-based final model were 28.08, 37.31, 53.2, 17.41, 56.18, 75.5, 5.27, and −1.59%, respectively. Bootstrap analysis was successful in 96.1% of the 1,000 runs. The PK parameters median values and 2.5–97.5% estimates obtained from the bootstrap approximated those obtained with the original dataset with <3% bias, confirming the stability and robustness of the final model (Table 4).
Figure 2A shows the pvcVPCs of the final model. The 10th, 50th, and 90th percentiles of the observations during the 50 days after surgery were within the 95% confidence intervals (CIs) of the corresponding prediction percentiles for the final model. Only the 10th and 90th percentiles of the observations on the fourth and sixth day after surgery fell slightly outside the 95% CI, revealing an acceptable agreement between the simulated and observed concentrations at most sampling time points.
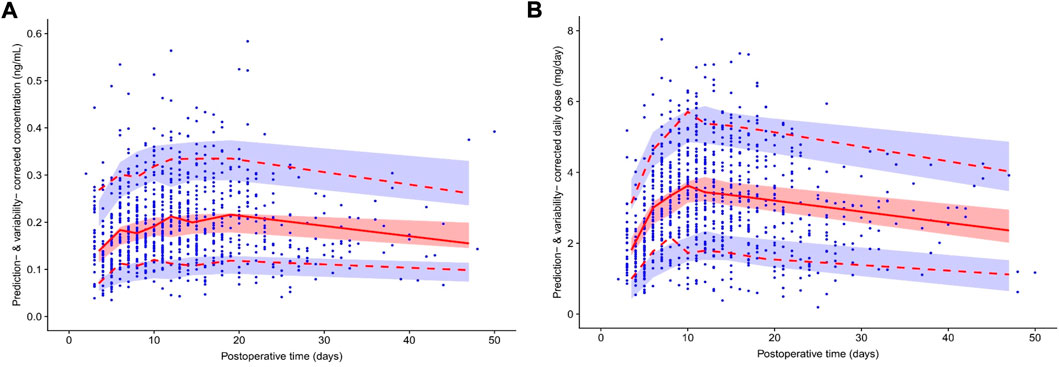
FIGURE 2. Prediction- and variability-corrected visual predictive check (pvcVPC) plot of the theory-based final model plot (A) and final MM model plot (B). The red solid line represents the prediction- and variability-corrected median observed concentration, and the semitransparent red shaded area represents the simulation-based 95% confidence intervals (CIs) for the median. The red dashed lines represent the corrected observed 10th and 90th percentiles, and the semitransparent blue shaded areas represent the simulation-based 95% CIs for the corresponding predicted percentiles from the final model. The blue dots represent the prediction- and variability-corrected observations.
Figure 3A, Supplementary Table S3 show the NPDE results. Quantile–quantile plots and histograms confirmed the normality of NPDE. However, the assumption of a normal distribution for the differences between predictions and observations was statistically unacceptable, with adjusted p-values within 0.05 for the global test, indicating the limited predictability of the final model.
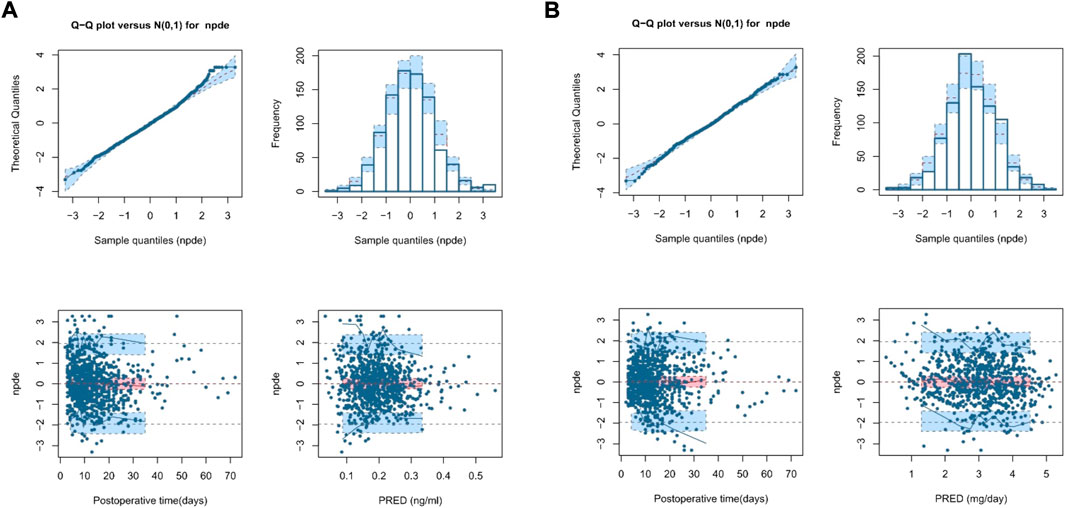
FIGURE 3. Normalized prediction distribution error (NPDE) plot of the theory-based final model plot (A) and MM final model plot (B). The plots are quantile-quantile plot of the distribution of NPDE against the theoretical distribution (semitransparent blue fields) (top left), histogram of the distribution of NPDE against the theoretical distribution (semitransparent blue fields) (top right), scatter plot of NPDE vs. postoperative time (days) (bottom left), and scatter plot of NPDE vs. population predictions (bottom right). In the scatter plots, the red solid lines represent the median NPDE of the observations, and semitransparent red fields represent the simulation-based 95% confidence intervals (CIs) for the median. Blue solid lines represent the NPDE of the observed 5th and 95th percentiles, and semitransparent blue fields represent the simulation-based 95% CIs for the corresponding predicted percentiles from the model. The blue dots represent the NPDE of the observations.
Figure 1B shows the GOF plots of the base and final models. The final model exhibited no significant structural bias or systematic deviation. The data fitting was improved compared to that of the base model. Most CWRES values of the final model were within ±2, indicating an acceptable fit.
The MAPE, F20, F30, MAIPE, IF20, and IF30 of the MM final model were 29.21, 34.11, 51.32, 16.63, 57.95, and 74.06%, respectively. However, its MDPE and MDIPE were 0.84 and −0.11%, respectively, which were both significantly lower than those of the theory-based final model, indicating superior prediction accuracy. The results are presented in Table 5 and Figure 4. Bootstrap analysis was successful in 99.8% of the 1,000 runs. The obtained PK parameters median values and 2.5–97.5% estimates approximated those obtained with the original dataset with <2% bias, confirming the stability and robustness of the final model (Table 4).
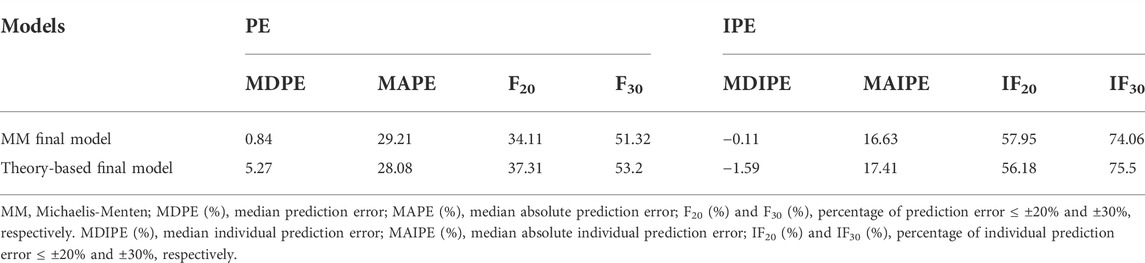
TABLE 5. The results of prediction error evaluation for the MM and theory-based final models.
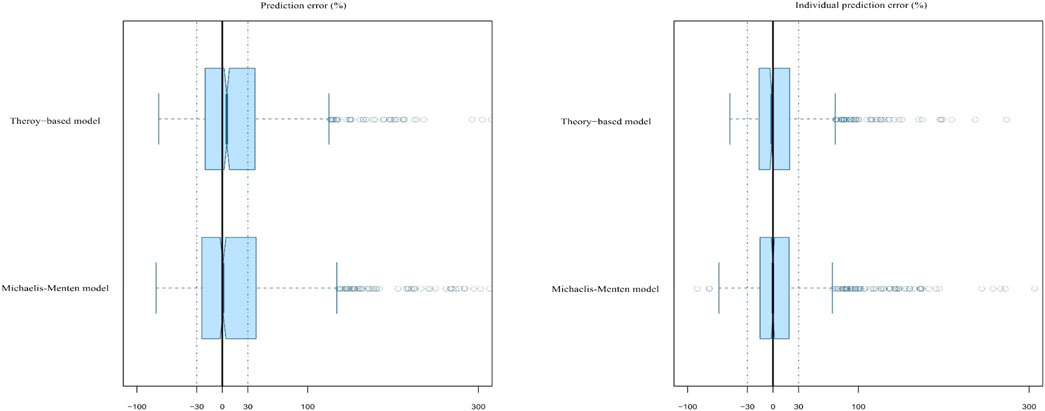
FIGURE 4. Box plots of the prediction error (PE%) and individual prediction error (IPE%) for the two established final models. Black solid lines and blue dotted lines are reference lines indicating PE% or IPE% of 0% and ±30%, respectively.
Figure 2B shows the pvcVPCs of the final model. The 10th, 50th, and 90th percentiles of the observations during the 50 days after surgery were within the 95% CIs of the corresponding prediction percentiles for the final model. However, at around the eighth day after surgery, the 10th percentile of the observed data deviated slightly from the 95% CI of the corresponding percentile of the simulated data, which had a limited impact on the final model overall prediction efficiency.
Figure 3B, Supplementary Table S3 show the NPDE results. Quantile–quantile plots and histograms confirmed NPDE normality and good final model predictability. The assumption of a normal distribution for the differences between predictions and observations was acceptable with adjusted p-values of 0.25 for the global test, indicating a superior predictive performance compared with that of the theory-based final model.
Compared with that of the base model, the data fitting was markedly improved; no significant structural bias or obvious trends were found in the two final models. The bootstrap and pvcVPC results showed that both models had good robustness and comparable predictive performance. The success rate determined using the MM model bootstrap method was slightly higher than that of the theory-based model. However, unlike the final theory-based model, the MM model showed better performance in the NPDE regarding to the normal distribution and global tests, indicating the superiority of the latter. In addition, the MDPE and MDIPE of the MM final model also implied its superiority and higher reliability.
A Monte Carlo simulation for the starting tacrolimus dose was conducted based on the final established nonlinear MM model, which exhibited superior predictive performance. The steady-state target C0 of tacrolimus should be maintained at 8–12 ng ml−1 on the seventh day after liver transplantation in typical adult patients. The HCT was set from 20 to 50% in 10% steps. At each HCT level, TBIL was set to four levels (<17.1, 17.1–85.5, 85.5–171, and >171 μmol L−1) according to the severity of jaundice, and the recipients were divided into poor (CYP3A5*3*3) and intermediate metabolizers (CYP3A5*1*3 or CYP3A5*1*1). Supplementary Table S4 presents the specific simulated scenarios.
The required dose was calculated using Vm, Km, and the desired target C0. For example, when HCT levels were between 20 and 50%, for CYP3A5*3*3 expressers with and without TAF co-therapy, a starting tacrolimus DD of 1–3.25 and 2–5 mg, respectively, could achieve a target steady-state C0 of 8–12 ng ml−1, whereas the initial DD should increase to 1.25–4 and 3.25–5.5 mg for CYP3A5*1*3 or CYP3A5*1*1 carriers, respectively.
Furthermore, as tacrolimus is mainly excreted through bile, its concentration increases significantly with increased TBIL level, leading to a lower dose requirement. For example, for CYP3A5*1*3 or CYP3A5*1*1 patients with TAF co-therapy and a HCT of 20–30%, the starting tacrolimus DD should be reduced from 3.25 to 4 to 2–2.5 mg when TBIL increased from <17.1 to >171 μmol L−1 Figure 5 and Table 6 show the simulation results.
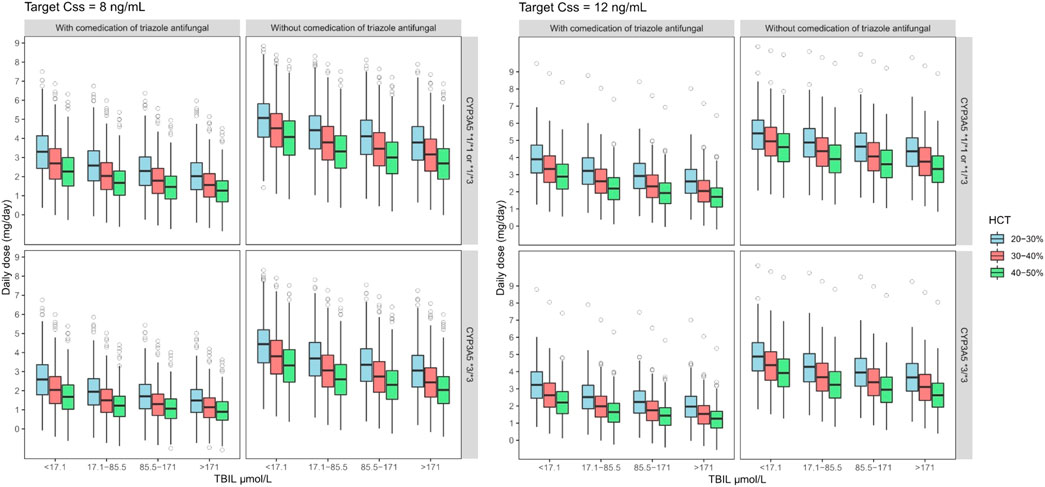
FIGURE 5. Boxplots of the distributions of simulated tacrolimus daily dose for CYP3A5*1*1 or *1*3 and *3*3 on target steady-state trough concentrations at 8–12 ng ml−1 for co-administered with triazole antifungal group in different TBIL and HCT levels. The bold horizontal bars in the middle show the median values, whereas the outer boundaries of the boxes represent the ranges of the 25th and 75th percentiles (interquartile ranges). The whiskers indicate the maximum and the minimum values of daily dose. Dots represent the outliers.

TABLE 6. MM model-informed individualized initial dose regimens based on simulation.
Tacrolimus is a well-known drug exhibiting linear kinetics in most previous studies (Staatz et al., 2003; Li et al., 2007; Zhu et al., 2015; Ji et al., 2018). However, we found that it follows nonlinear kinetics in patients with kidney transplantation and nephrotic syndrome (Zhao et al., 2016; Huang et al., 2020). In this study, we further confirmed tacrolimus nonlinearity in adult patient populations undergoing liver transplantation using a large sample size. To further address whether tacrolimus PK changes with oral DD rate and explore the potential mechanisms of the identified nonlinear kinetics, the nonlinear behavior of tacrolimus PK in adult liver transplant recipients was modeled and compared with that from the theory-based linear model established by the same independent dataset prospectively collected from Huashan Hospital.
The MM model, an efficient population approach to describe the nonlinear correlation between the dose and steady-state C0, was employed as it can describe the overall nonlinear behavior across the entire PK process. Based on the superior predictability in adult liver transplant recipients, the MM model might constitute a promising approach for tacrolimus starting dose determination, implying that the target C0 range can be more easily reached and lead to more effective clinical outcomes in practical application. In the MM final model, the typical value of Vm was 6.62 mg day−1 (95% CI, 5.952–7.288), indicating that a tacrolimus DD exceeding 6.62 mg may lead to drug accumulation and adverse reactions. The typical Km was 6.46 ng ml−1 (95%CI, 4.686–8.234), indicating that for a steady-state concentration <6.46 ng ml−1, the drug exhibited saturated erythrocyte binding. Thus, its nonlinearity would no longer influence dose rate adjustment when the steady-state C0 was ≤6.46 ng ml−1.
However, tacrolimus nonlinearity in adult liver transplant recipients may differ from that in patients with renal transplantation or PNS. For example, the values of Vm and Km in adult liver transplant recipients were significantly higher than those in patients with PNS (Vm: 1.92 mg kg−1; Km: 1.98 ng ml−1) (Cai et al., 2020) and adult renal transplant recipients (Vm: 5.54 mg day−1; Km: 2.36 ng ml−1). The discrepancy between these two populations might be attributed to various changes during childhood growth (Yokoi, 2009), lower total DD, and lower target tacrolimus C0 requirement (5–10 ng ml−1) (Subspecialty Group of Nephrology S O P C M A, 2010; Vasudevan et al., 2021) than in adult liver transplant recipients (8–12 ng ml−1 within 3 months after transplantation). Poor hepatic function might also significantly affect first-pass tacrolimus metabolism in liver transplant recipients; these also receive different steroid dosages (Bekersky et al., 2001; Shimomura et al., 2002; Vanhove et al., 2016). Additionally, most liver transplant recipients included in our study were hepatitis B-, hepatitis C-, or hepatitis E-positive, unlike most PNS or renal transplant recipients. Hepatitis virus replication in hepatocytes alters the CYP3A system, leading to reduced tacrolimus metabolism (Horina et al., 1993).
Factors contributing to tacrolimus nonlinearity may involve specific drug properties including poor water solubility (1–2 μg ml−1), high absorption variability, and acceleration of metabolism at high doses (Lee et al., 2006). Furthermore, post-transplantation gastrointestinal dysfunction, changes in metabolizing enzymes and P-gp activity with POD, and gradually decreasing hepatic and intestinal CYP3A and P-gp induction by tapered co-administered steroid dosing cause higher fluctuations in absorption and metabolism leading to more pronounced nonlinear PK behavior (Chow et al., 1997; Christians et al., 2002; Lee et al., 2006; Tubic et al., 2006).
Nonlinear tacrolimus PK may also result from poor hepatic function and low HCT levels, as patients with liver transplantation usually suffer from gastrointestinal bleeding and postoperative bone marrow suppression early after surgery. Descending plasma protein caused by poor hepatic function, in addition to low HCT levels, could lead to saturated tacrolimus concentration-dependent binding to albumin and erythrocytes, consequently increasing the free tacrolimus proportion (Chow et al., 1997). Free tacrolimus can pass through the cell membrane, undergo CYP3A-mediated metabolism, and be cleared by the liver and kidney (Jusko et al., 1995), leading to nonlinear distribution and elimination. The relationship between nonlinear PK and distribution and elimination in vivo could be explained by the present results, as HCT constituted a significant variable in the developed MM model, and saturated tacrolimus–erythrocyte binding was incorporated into the theory-based final model.
Notably, early classic PK studies in healthy individuals showed that the tacrolimus PK at a single oral dose of 3, 7, and 10 mg indicated a linear process, and the clearance rate was not related to the dose (Bekersky et al., 1999). Several factors may underlie these discrepancies. 1) The median tacrolimus DD in adult liver transplant recipients enrolled in the present study was 2.5 mg; i.e., the DD in 50% of patients was <3 mg, which was not within the dose range of 3–10 mg. 2) In contrast to the steady-state levels in a healthy population, HCT and CYP3A activity in the intestine and liver gradually recovered with POD after surgery (Brooks et al., 2016), further contribute to the nonlinear PK characteristics in adult liver transplant recipients.
The superior predictive performance of the nonlinear MM empirical model suggests that this model provides a novel perspective for future investigations, and that saturated binding to erythrocytes only partially explains the nonlinear tacrolimus PK. Nevertheless, considering that only C0 values were available, the function of the DD might reflect nonlinearity in the clearance process. Further studies are needed to confirm the sources of tacrolimus PK nonlinearity and investigate the physiological significance of Km and Vm.
Our study shows that in theory-based modeling, PK parameters were estimated based on Cp (Hebert et al., 2013; Storset et al., 2014b). For CYP3A5*3*3 patients with an AST of 45 U L−1, administered TAF-free treatment and 1 mg tacrolimus DD, estimated CLpl/F was 234 L h−1, which is much lower than the reported value (473–695 L h−1) for non-Asian liver transplant (Jusko et al., 1995; Sam et al., 2006) and kidney transplant populations (811 L h−1) (Storset et al., 2014a). This discrepancy cou1d be attributed to the different races and to lower tacrolimus bioavailability in recipients of renal versus liver transplants (Staatz and Tett, 2004).
Both final models indicated that only the CYP3A5*3 genotype recipients significantly affected tacrolimus PK in liver transplant patients, consistent with published data (Zhu et al., 2015; Teng et al., 2022). Liver transplant recipients with CYP3A5*1*3 or CYP3A5*1*1 had 16.8% higher CLpl/F and 36.5% lower Km values than those of CYP3A5*3*3 carriers. Other tested genetic polymorphisms, including CYP3A4*1G (rs2242480), SUMO4 (rs237025), and NR112 (rs2276707) genotypes of both donors and recipients did not improve the predictive performance of the final models and were not included therein.
Co-therapeutic agents also contributed to tacrolimus PK variability in liver transplant recipients. Our results showed that CLpl/F decreased by 57.5% and Km increased 3.15-fold in liver transplant patients co-administered TAFs such as voriconazole and fluconazole. These agents, commonly used to prevent and treat fungal infection, could reduce tacrolimus metabolism in the jejunum, improve intestinal absorption, and increase bioavailability, leading to higher tacrolimus concentrations by suppressing CYP450 system activity (Albengres et al., 1998; Iwamoto et al., 2015; Mimura et al., 2019). Similarly, calcium channel blockers and Wuzhi capsule, extensively used as a tacrolimus-sparing agent (Li et al., 2011), impact tacrolimus by affecting CYP3A enzyme activity (Jones and MORRIS, 2002; Qin et al., 2013; Zhang et al., 2019), but they failed to be covariates in the final models. Steroids act as CYP3A substrates and inducers (Lunde et al., 2014). Tacrolimus apparent clearance increased up to 1.6-fold with steroid doses >25 mg (Antignac et al., 2007). However, steroids had no significant effect in our study, probably owing to the low dosages (17.27 ± 15.85 mg day−1 presented as prednisone).
POD, considered a major surrogate for many time-dependent variables (Pou et al., 1998; Teng et al., 2022), was also identified as an alternative indicator of time-dependent factors in CLpl/F and Km in our study. This may be attributed to progressive CYP3A enzyme activity recovery in the intestine and liver, and steroid dose tapering after transplantation. Other factors and possible mechanisms related to POD effects on tacrolimus PK remain to be determined.
Ultimately, we used the superior MM final model to predict the tacrolimus DD and test the possible clinical impact of the CYP3A5*3 genotype, concomitant medication with TAFs, and HCT levels. The simulation results indicated that a starting DD of 1–3.25 mg for CYP3A5*3*3 patients with TAF co-therapy could reach the target treatment concentration range (8–12 ng ml−1) 1 week after surgery, whereas 3.25–5.5 mg was required for CYP3A5*1*3 or CYP3A5*1*1 carriers receiving TAF-free treatment.
This study had some limitations. First, no intensive sampling was available. Only clearance and its covariates were reliably estimated. C0 values alone cannot yield reliable estimates of Vd, or adequately illustrate the exact nonlinear PK mechanisms in other processes, especially absorption.
Tacrolimus PK in recipients of liver transplantation were first compared between theory-based linear compartment and nonlinear MM models through prospective population analysis, and factors contributing to individual PK variability were identified. The MM model, a nonlinear empirical model, better described tacrolimus PK behavior and yielded superior predictive performance based on the large sample size, further confirming tacrolimus nonlinearity. Saturated concentration-dependent erythrocyte binding and the influence of tacrolimus DD on metabolism could partially explain tacrolimus nonlinearity. Notably, tacrolimus nonlinearity in liver transplant patients differed from that in renal transplantation and PNS patients. POD, HCT, TBIL, recipient CYP3A5*3 genotype, and TAF co-therapy represented significant factors in the final MM model, and dosing regimens were proposed. TDM should be strengthened to ensure tacrolimus safety and therapeutic effect, and further efforts should be directed to investigate specific nonlinearities.
The datasets presented in this study can be found in online repositories. The names of the repository/repositories and accession number(s) can be found in the article/Supplementary Material.
The studies involving human participants were reviewed and approved by the Ethics Committee of Huashan Hospital, Fudan University. Written informed consent to participate in this study was provided by the participants’ legal guardian/next of kin. The patients/participants provided their written informed consent to participate in this study.
X-JC, ZJ, and Z-XW designed the research and planned the work that led to the manuscript. X-JC, R-DL, Y-FT, J-HL, and C-HS acquired the data and were responsible for interpreting the data. X-JC, J-HL, and Q-BZ collected the blood samples. X-JC analysed the data and provided statistical expertise. X-JC drafted the manuscript and ZJ revised the manuscript. All authors commented on and approved the final version to be published.
This work was supported by the National Natural Science Foundation of China (81573505), the Top Talent Support Program for young and middle-aged people of Wuxi Health Committee (BJ2020022), and the Wuxi Foundation for Development of Science and Technology (N20202026).
All the liver transplant recipients that have contributed to this project. Clinical laboratory for assistance of acquiring the data. We would also like to sincerely thank Yifan Cui from the Department of Pharmacy, Shanghai Chest Hospital for providing details about the drafted manuscript, Xiao-Fei Zhang from the Department of General Surgery, Huashan Hospital for assisting to collect the blood samples, and Editage (www.editage.cn) for English language editing.
The authors declare that the research was conducted in the absence of any commercial or financial relationships that could be construed as a potential conflict of interest.
All claims expressed in this article are solely those of the authors and do not necessarily represent those of their affiliated organizations, or those of the publisher, the editors and the reviewers. Any product that may be evaluated in this article, or claim that may be made by its manufacturer, is not guaranteed or endorsed by the publisher.
The Supplementary Material for this article can be found online at: https://www.frontiersin.org/articles/10.3389/fphar.2022.1031969/full#supplementary-material
Ahn, J. E., Birnbaum, A. K., and Brundage, R. C. (2005). Inherent correlation between dose and clearance in therapeutic drug monitoring settings: Possible misinterpretation in population pharmacokinetic analyses. J. Pharmacokinet. Pharmacodyn. 32 (5-6), 703–718. doi:10.1007/s10928-005-0083-6
Albengres, E., Le Louet, H., and Tillement, J. P. (1998). Systemic antifungal agents. Drug interactions of clinical significance. Drug Saf. 18 (2), 83–97. doi:10.2165/00002018-199818020-00001
Alissa, D. A., Alkortas, D., Alsebayel, M., Almasuood, R. A., Aburas, W., Altamimi, T., et al. (2022). Tacrolimus-induced neurotoxicity in early post-liver transplant Saudi patients: Incidence and risk factors. Ann. Transpl. 27, e935938. doi:10.12659/AOT.935938
Andreu, F., Colom, H., Elens, L., van Gelder, T., van Schaik, R. H. N., Hesselink, D. A., et al. (2017). A new CYP3A5*3 and CYP3A4*22 cluster influencing tacrolimus target concentrations: A population approach. Clin. Pharmacokinet. 56 (8), 963–975. doi:10.1007/s40262-016-0491-3
Antignac, M., Barrou, B., Farinotti, R., Lechat, P., and Urien, S. (2007). Population pharmacokinetics and bioavailability of tacrolimus in kidney transplant patients. Br. J. Clin. Pharmacol. 64 (6), 750–757. doi:10.1111/j.1365-2125.2007.02895.x
Barraclough, K. A., Isbel, N. M., Lee, K. J., Bergmann, T. K., Johnson, D. W., McWhinney, B. C., et al. (2012). NR1I2 polymorphisms are related to tacrolimus dose-adjusted exposure and BK viremia in adult kidney transplantation. Transplantation 94 (10), 1025–1032. doi:10.1097/TP.0b013e31826c3985
Bekersky, I., Dressler, D., Alak, A., and Mekki, Q. A. (2001). Comparative tacrolimus pharmacokinetics: Normal versus mildly hepatically impaired subjects. J. Clin. Pharmacol. 41 (6), 628–635. doi:10.1177/00912700122010519
Bekersky, I., Dressler, D., and Mekki, Q. A. (1999). Dose linearity after oral administration of tacrolimus 1-mg capsules at doses of 3, 7, and 10 mg. Clin. Ther. 21 (12), 2058–2064. doi:10.1016/s0149-2918(00)87237-9
Bentata, Y. (2020). Tacrolimus: 20 years of use in adult kidney transplantation. What we should know about its nephrotoxicity [J]. Artif. Organs 44 (2), 140–152. doi:10.1111/aor.13551
Brooks, E., Tett, S. E., Isbel, N. M., and Staatz, C. E. (2016). Population pharmacokinetic modelling and bayesian estimation of tacrolimus exposure: Is this clinically useful for dosage prediction yet? [J]. Clin. Pharmacokinet. 55 (11), 1295–1335. doi:10.1007/s40262-016-0396-1
Cai, X., Li, R., Sheng, C., Tao, Y., Zhang, Q., Zhang, X., et al. (2020). Systematic external evaluation of published population pharmacokinetic models for tacrolimus in adult liver transplant recipients. Eur. J. Pharm. Sci. 2020, 105237. doi:10.1016/j.ejps.2020.105237
Campagne, O., Mager, D. E., and Tornatore, K. M. (2019). Population pharmacokinetics of tacrolimus in transplant recipients: What did we learn about sources of interindividual variabilities? [J]. J. Clin. Pharmacol. 59 (3), 309–325. doi:10.1002/jcph.1325
Chow, F. S., Piekoszewski, W., and Jusko, W. J. (1997). Effect of hematocrit and albumin concentration on hepatic clearance of tacrolimus (FK506) during rabbit liver perfusion. Drug Metab. Dispos. 25 (5), 610–616.
Christians, U., Jacobsen, W., Benet, L. Z., and Lampen, A. (2002). Mechanisms of clinically relevant drug interactions associated with tacrolimus. Clin. Pharmacokinet. 41 (11), 813–851. doi:10.2165/00003088-200241110-00003
Coste, G., and Lemaitre, F. (2022). The role of intra-patient variability of tacrolimus drug concentrations in solid organ transplantation: A focus on liver, heart, lung and pancreas. Pharmaceutics 14 (2), 379. doi:10.3390/pharmaceutics14020379
De Jonge, H., Naesens, M., and Kuypers, D. R. (2009). New insights into the pharmacokinetics and pharmacodynamics of the calcineurin inhibitors and mycophenolic acid: Possible consequences for therapeutic drug monitoring in solid organ transplantation. Ther. Drug Monit. 31 (4), 416–435. doi:10.1097/FTD.0b013e3181aa36cd
Dong, Y., Xu, Q., Li, R., Tao, Y., Zhang, Q., Li, J., et al. (2022). CYP3A7, CYP3A4, and CYP3A5 genetic polymorphisms in recipients rather than donors influence tacrolimus concentrations in the early stages after liver transplantation. Gene 809, 146007. doi:10.1016/j.gene.2021.146007
Hebert, M. F., Zheng, S., Hays, K., Shen, D. D., Davis, C. L., Umans, J. G., et al. (2013). Interpreting tacrolimus concentrations during pregnancy and postpartum. Transplantation 95 (7), 908–915. doi:10.1097/TP.0b013e318278d367
Horina, J. H., Wirnsberger, G. H., Kenner, L., Holzer, H., and Krejs, G. J. (1993). Increased susceptibility for CsA-induced hepatotoxicity in kidney graft recipients with chronic viral hepatitis C. Transplantation 56 (5), 1091–1094. doi:10.1097/00007890-199311000-00008
Huang, L., Liu, Y., Jiao, Z., Wang, J., Fang, L., and Mao, J. (2020). Population pharmacokinetic study of tacrolimus in pediatric patients with primary nephrotic syndrome: A comparison of linear and nonlinear michaelis-menten pharmacokinetic model. Eur. J. Pharm. Sci. 143, 105199. doi:10.1016/j.ejps.2019.105199
Iwamoto, T., Monma, F., Fujieda, A., Nakatani, K., Gayle, A. A., Nobori, T., et al. (2015). Effect of genetic polymorphism of CYP3A5 and CYP2C19 and concomitant use of voriconazole on blood tacrolimus concentration in patients receiving hematopoietic stem cell transplantation. Ther. Drug Monit. 37 (5), 581–588. doi:10.1097/FTD.0000000000000182
Ji, E., Kim, M. G., and Oh, J. M. (2018). CYP3A5 genotype-based model to predict tacrolimus dosage in the early postoperative period after living donor liver transplantation. Ther. Clin. Risk Manag. 14, 2119–2126. doi:10.2147/TCRM.S184376
Jones, T. E., and Morris, R. G. (2002). Pharmacokinetic interaction between tacrolimus and diltiazem: Dose-response relationship in kidney and liver transplant recipients. Clin. Pharmacokinet. 41 (5), 381–388. doi:10.2165/00003088-200241050-00005
Jusko, W. J., Piekoszewski, W., Klintmalm, G. B., Shaefer, M. S., Hebert, M. F., Piergies, A. A., et al. (1995). Pharmacokinetics of tacrolimus in liver transplant patients. Clin. Pharmacol. Ther. 57 (3), 281–290. doi:10.1016/0009-9236(95)90153-1
Kliewer, S. A., Goodwin, B., and Willson, T. M. (2002). The nuclear pregnane X receptor: A key regulator of xenobiotic metabolism. Endocr. Rev. 23 (5), 687–702. doi:10.1210/er.2001-0038
Lee, D. R., Ho, M. J., Jung, H. J., Cho, H. R., Park, J. S., Yoon, S. H., et al. (2016). Enhanced dissolution and oral absorption of tacrolimus by supersaturable self-emulsifying drug delivery system. Int. J. Nanomedicine 11, 1109–1117. doi:10.2147/IJN.S102991
Lee, J. Y., Hahn, H. J., Son, I. J., Suh, K. S., Yi, N. J., Oh, J. M., et al. (2006). Factors affecting the apparent clearance of tacrolimus in Korean adult liver transplant recipients. Pharmacotherapy 26 (8), 1069–1077. doi:10.1592/phco.26.8.1069
Li, D., Lu, W., Zhu, J. Y., Gao, J., Lou, Y. Q., and Zhang, G. L. (2007). Population pharmacokinetics of tacrolimus and CYP3A5, MDR1 and IL-10 polymorphisms in adult liver transplant patients. J. Clin. Pharm. Ther. 32 (5), 505–515. doi:10.1111/j.1365-2710.2007.00850.x
Li, J. L., Wang, X. D., Chen, S. Y., Liu, L. S., Fu, Q., Chen, X., et al. (2011). Effects of diltiazem on pharmacokinetics of tacrolimus in relation to CYP3A5 genotype status in renal recipients: From retrospective to prospective. Pharmacogenomics J. 11 (4), 300–306. doi:10.1038/tpj.2010.42
Lieber, S. R., and Volk, M. L. (2013). Non-adherence and graft failure in adult liver transplant recipients. Dig. Dis. Sci. 58 (3), 824–834. doi:10.1007/s10620-012-2412-0
Lunde, I., Bremer, S., Midtvedt, K., Mohebi, B., Dahl, M., Bergan, S., et al. (2014). The influence of CYP3A, PPARA, and POR genetic variants on the pharmacokinetics of tacrolimus and cyclosporine in renal transplant recipients. Eur. J. Clin. Pharmacol. 70 (6), 685–693. doi:10.1007/s00228-014-1656-3
Mimura, A., Yamaori, S., Ikemura, N., Katsuyama, Y., Matsuzawa, N., and Ohmori, S. (2019). Influence of azole antifungal drugs on blood tacrolimus levels after switching from intravenous tacrolimus to once-daily modified release tacrolimus in patients receiving allogeneic hematopoietic stem cell transplantation. J. Clin. Pharm. Ther. 44 (4), 565–571. doi:10.1111/jcpt.12834
Moller, A., Iwasaki, K., Kawamura, A., Teramura, A., Shiraga, T., Hata, T., et al. (1999). The disposition of 14C-labeled tacrolimus after intravenous and oral administration in healthy human subjects. Drug Metab. Dispos. 27 (6), 633–636.
Pou, L., Brunet, M., Andres, I., RodaMilans, M., Lopez, R., and Corbella, J. (1998). Influence of posttransplant time on dose and concentration of tacrolimus in liver transplant patients. Transpl. Int. 11 (1), S270–S271. doi:10.1007/s001470050476
Qin, X. L., Yu, T., Li, L. J., Wang, Y., Gu, H. M., Wang, Y. T., et al. (2013). Effect of long-term co-administration of Wuzhi tablet (Schisandra sphenanthera extract) and prednisone on the pharmacokinetics of tacrolimus. Phytomedicine 20 (3-4), 375–379. doi:10.1016/j.phymed.2012.11.008
Sam, W. J., Tham, L. S., Holmes, M. J., Aw, M., Quak, S. H., Lee, K. H., et al. (2006). Population pharmacokinetics of tacrolimus in whole blood and plasma in Asian liver transplant patients. Clin. Pharmacokinet. 45 (1), 59–75. doi:10.2165/00003088-200645010-00004
Shimomura, M., Masuda, S., Saito, H., Sakamoto, S., Uemoto, S., Tanaka, K., et al. (2002). Roles of the jejunum and ileum in the first-pass effect as absorptive barriers for orally administered tacrolimus. J. Surg. Res. 103 (2), 215–222. doi:10.1006/jsre.2002.6359
Staatz, C. E., and Tett, S. E. (2004). Clinical pharmacokinetics and pharmacodynamics of tacrolimus in solid organ transplantation. Clin. Pharmacokinet. 43 (10), 623–653. doi:10.2165/00003088-200443100-00001
Staatz, C. E., Willis, C., Taylor, P. J., Lynch, S. V., and Tett, S. E. (2003). Toward better outcomes with tacrolimus therapy: Population pharmacokinetics and individualized dosage prediction in adult liver transplantation. Liver Transpl. 9 (2), 130–137. doi:10.1053/jlts.2003.50023
Storset, E., Holford, N., Hennig, S., Bergmann, T. K., Bergan, S., Bremer, S., et al. (2014a). Improved prediction of tacrolimus concentrations early after kidney transplantation using theory-based pharmacokinetic modelling. Br. J. Clin. Pharmacol. 78 (3), 509–523. doi:10.1111/bcp.12361
Storset, E., Holford, N., Midtvedt, K., Bremer, S., Bergan, S., and Asberg, A. (2014b). Importance of hematocrit for a tacrolimus target concentration strategy. Eur. J. Clin. Pharmacol. 70 (1), 65–77. doi:10.1007/s00228-013-1584-7
Subspecialty Group of Nephrology S O P C M A (2010). Evidence-based guidelines on diagnosis and treatment of childhood common renal diseases (III): Guideline on diagnosis and treatment of steroid-resistant nephrotic syndrome. Zhonghua Er Ke Za Zhi 48 (1), 72–75.
Tamura, S., Ohike, A., Ibuki, R., Amidon, G. L., and Yamashita, S. (2002). Tacrolimus is a class II low-solubility high-permeability drug: The effect of P-glycoprotein efflux on regional permeability of tacrolimus in rats. J. Pharm. Sci. 91 (3), 719–729. doi:10.1002/jps.10041
Teng, F., Zhang, W., Wang, W., Chen, J., Liu, S., Li, M., et al. (2022). Population pharmacokinetics of tacrolimus in Chinese adult liver transplant patients. Biopharm. Drug Dispos. 43 (2), 76–85. doi:10.1002/bdd.2311
Tubic, M., Wagner, D., Spahn-Langguth, H., Bolger, M. B., and Langguth, P. (2006). In silico modeling of non-linear drug absorption for the P-gp substrate talinolol and of consequences for the resulting pharmacodynamic effect. Pharm. Res. 23 (8), 1712–1720. doi:10.1007/s11095-006-9020-7
Van Boekel, G. A., Aarnoutse, R. E., Van Der Heijden, J. J., Hoogtanders, K. E. J., and Hilbrands, L. B. (2012). Effect of mild diarrhea on tacrolimus exposure. Transplantation 94 (7), 763–767. doi:10.1097/TP.0b013e3182629e13
Van Erp, N. P., Van Herpen, C. M., De Wit, D., Willemsen, A., Burger, D. M., Huitema, A. D. R., et al. (2016). A semi-physiological population model to quantify the effect of hematocrit on Everolimus pharmacokinetics and pharmacodynamics in cancer patients. Clin. Pharmacokinet. 55 (11), 1447–1456. doi:10.1007/s40262-016-0414-3
Vanhove, T., Annaert, P., and Kuypers, D. R. (2016). Clinical determinants of calcineurin inhibitor disposition: A mechanistic review. Drug Metab. Rev. 48 (1), 88–112. doi:10.3109/03602532.2016.1151037
Vasudevan, A., Thergaonkar, R., Mantan, M., Sharma, J., Khandelwal, P., Hari, P., et al. (2021). Consensus guidelines on management of steroid-resistant nephrotic syndrome. Indian Pediatr. 58 (7), 650–666. doi:10.1007/s13312-021-2262-y
Yokoi, T. (2009). Essentials for starting a pediatric clinical study (1): Pharmacokinetics in children. J. Toxicol. Sci. 34 (2), SP307–12. doi:10.2131/jts.34.sp307
Yu, M., Liu, M., Zhang, W., and Ming, Y. (2018). Pharmacokinetics, pharmacodynamics and pharmacogenetics of tacrolimus in kidney transplantation. Curr. Drug Metab. 19 (6), 513–522. doi:10.2174/1389200219666180129151948
Zhang, T., Liu, Y., Zeng, R., Ling, Q., Wen, P., Fan, J., et al. (2018). Association of donor small ubiquitin-like modifier 4 rs237025 genetic variant with tacrolimus elimination in the early period after liver transplantation. Liver Int. 38 (4), 724–732. doi:10.1111/liv.13597
Zhang, Z., Lu, X., Dong, L., Ma, J., and Fan, X. (2019). Clinical observation on the effect of Wuzhi soft capsule on FK506 concentration in membranous nephropathy patients. Med. Baltim. 98 (48), e18150. doi:10.1097/MD.0000000000018150
Zhao, C. Y., Jiao, Z., Mao, J. J., and Qiu, X. Y. (2016). External evaluation of published population pharmacokinetic models of tacrolimus in adult renal transplant recipients. Br. J. Clin. Pharmacol. 81 (5), 891–907. doi:10.1111/bcp.12830
Keywords: tacrolimus, liver transplantation, population pharmacokinetics, nonlinear pharmacokinetics, Monte Carlo simulation
Citation: Cai X-J, Li R-D, Li J-H, Tao Y-F, Zhang Q-B, Shen C-H, Zhang X-F, Wang Z-X and Jiao Z (2022) Prospective population pharmacokinetic study of tacrolimus in adult recipients early after liver transplantation: A comparison of Michaelis-Menten and theory-based pharmacokinetic models. Front. Pharmacol. 13:1031969. doi: 10.3389/fphar.2022.1031969
Received: 30 August 2022; Accepted: 17 October 2022;
Published: 09 November 2022.
Edited by:
Dongdong Wang, Xuzhou Medical University, ChinaReviewed by:
Bing Chen, Shanghai Jiao Tong University, ChinaCopyright © 2022 Cai, Li, Li, Tao, Zhang, Shen, Zhang, Wang and Jiao. This is an open-access article distributed under the terms of the Creative Commons Attribution License (CC BY). The use, distribution or reproduction in other forums is permitted, provided the original author(s) and the copyright owner(s) are credited and that the original publication in this journal is cited, in accordance with accepted academic practice. No use, distribution or reproduction is permitted which does not comply with these terms.
*Correspondence: Zheng-Xin Wang, d2FuZ3poZW5neGluQGh1YXNoYW4ub3JnLmNu; Zheng Jiao, amlhb3poZW5Ab25saW5lLnNoLmNu
Disclaimer: All claims expressed in this article are solely those of the authors and do not necessarily represent those of their affiliated organizations, or those of the publisher, the editors and the reviewers. Any product that may be evaluated in this article or claim that may be made by its manufacturer is not guaranteed or endorsed by the publisher.
Research integrity at Frontiers
Learn more about the work of our research integrity team to safeguard the quality of each article we publish.