
94% of researchers rate our articles as excellent or good
Learn more about the work of our research integrity team to safeguard the quality of each article we publish.
Find out more
METHODS article
Front. Pharmacol., 10 October 2022
Sec. Experimental Pharmacology and Drug Discovery
Volume 13 - 2022 | https://doi.org/10.3389/fphar.2022.1031759
This article is part of the Research TopicArtificial Intelligence and Machine Learning for Drug Discovery, Design and Repurposing: Methods and ApplicationsView all 8 articles
 Shaoyou Yu1,2,3
 Dejun Peng1,2,3
 Wen Zhu1,2,3*
 Bo Liao1,2,3Peng Wang1,2,3Dongxuan Yang1,2,3Fangxiang Wu1,2,3
DNA-binding proteins (DBP) play an essential role in the genetics and evolution of organisms. A particular DNA sequence could provide underlying therapeutic benefits for hereditary diseases and cancers. Studying these proteins can timely and effectively understand their mechanistic analysis and play a particular function in disease prevention and treatment. The limitation of identifying DNA-binding protein members from the sequence database is time-consuming, costly, and ineffective. Therefore, efficient methods for improving DBP classification are crucial to disease research. In this paper, we developed a novel predictor Hybrid _DBP, which identified potential DBP by using hybrid features and convolutional neural networks. The method combines two feature selection methods, MonoDiKGap and Kmer, and then used MRMD2.0 to remove redundant features. According to the results, 94% of DBP were correctly recognized, and the accuracy of the independent test set reached 91.2%. This means Hybrid_ DBP can become a useful prediction tool for predicting DBP.
DNA-related activities are integral to biological cellular life activities, including detecting DNA damage, DNA replication, and gene transcription. The replication and recombination of DNA are facilitated by DNA-binding proteins (Luscombe et al., 2000). The proteins associated with and regulating the life activities of DNA are called DNA-binding proteins (DBP) (Gao and Jeffrey, 2008). In the past few years, DBP has become the subject of increasing research that is crucial to genetics and evolution. Thus, identifying DNA sequences could potentially treat cancer and hereditary diseases. DBP has been determined using several experimental approaches (comprising filter binding analysis, genetic analysis, and X-ray) (Nakano et al., 2016). This technique can provide detailed information about DBP, but it is costly and takes longer to perform. In this post-genomic era, there are many protein sequences containing DNA-binding domains, so how to identify these proteins efficiently and effectively is an important topic worth studying in depth in bioinformatics. The identification and prediction methods of DBP were mostly based on machine learning, and many studies tried to use protein sequence features and machine learning to distinguish DBP. DBD-Threader (Mu and Skolnick, 2009) thread-based approach was applied to predict DNA-binding domains and associated functional sites. DBPBIND (Szilágyi and Skolnick, 2006) identified DBP from amino acid sequences and low-resolution junctions. A support vector machine (SVM) model was constructed by DNABinder (Kumar et al., 2007) by analyzing amino acids and dipeptides. DNA-Prot (Kumar et al., 2009) was originally trained to identify DBP from features derived from sequences using a random forest (RF) classifier, and iDNA-Prot (Lin et al., 2011) was subsequently named. IDNAPro-PseAAC (Liu et al., 2015a) used the SVM to improve the predictive power. After conducting dimensionality reduction, the model was renamed iDNA-Prot|dis (Liu et al., 2014). Kmer1 + ACC (Liu et al., 2016) proposed a new approach combining support vector machines and self-crossing covariance transformations. In DBPred (Lou et al., 2014), the selection was performed by using a mixture of Random Forest and Gaussian Naive Bayes. PsePSSM+PSSM-AB+PSSM-DWT (Lu et al., 2020) was constructed using evolutionary computation and the SVM approach. Protein identification work is increasingly being carried out with artificial intelligence and big data, which brings new perspectives. Many studies have attempted to use deep learning algorithms to distinguish the sequences of identifying DBP (Zhang et al., 2020; Li et al., 2021). Previous approaches have contributed to the development of this field, but the prediction accuracy has not yet reached satisfactory results and needs to be further improved. We urgently need a method for extracting and classifying optimal features to identify DBP.
In this paper, three feature selection approaches were chosen: monoDiKGap, profile-based cross covariance (CC-PSSM) and Kmer. Combining the three features in different combinations was conducted using a hybrid feature approach. We then used MRMD2.0 to remove redundant hybrid features, and then use the convolutional neural networks (CNN) to predict DBP. The result showed the CNN can be very effective in predicting DBP on the basis of the hybrid features of monoDiKGap and Kmer methods. Further, a test set was applied to assess the generalization capability, and the results demonstrated that the model was robust and generalizable. It showed the reliability of this paper’s method for studying DNA-binding proteins. We illustrate our framework in Figure 1, which explains our modeling process.
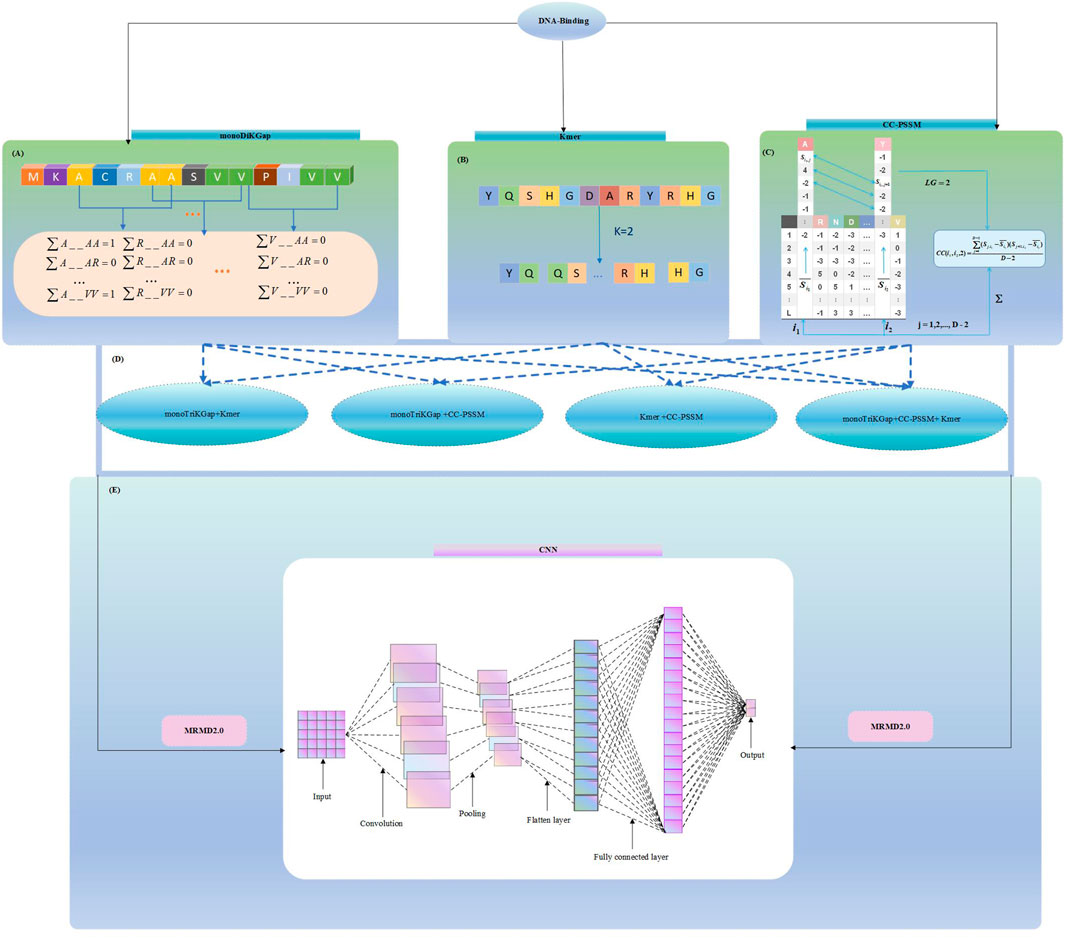
FIGURE 1. Hybrid_DBP model structure flowchart (A) Extract features using monoDiKGap feature selection (B) Extract features using Kmer feature selection (C) Extract features using CC-PSSM feature selection (D) Combine three single feature representations and choose the best hybrid features (E) Remove redundant features using MRMD2.0 and Predict DBP by 1-D CNN model.
Datasets of high standard are the foundation for a reliable model. The dataset used in this paper was obtained from Liu et al, (2014), which was collected through the Protein Data Bank (PDB) database of DBP. The database is the most prevalent in the field of bioinformatics. To process the data set further, we deleted the sequences comprising nonstandard amino acid characters “B,” “J,” “O,” “U,” “X,” and “Z.” Finally, 1069 DNA-binding protein samples were obtained, of which 525 were DBP and 544 were non-DBP. To further test the reliability of the model, this paper used Lou et al, (2014) compiling the DNA-binding protein dataset PDB186 as an independent test set, which includes 93 DBPs and 93 non-DBPs. The model data can be downloaded from https://github.com/YUshunL/DBP-file.
The monoDiKGap feature selection is a modification of the kmer feature selection approach in the PyFeat (Rafsanjani et al., 2019). Kmer, a typical and important approach for extracting local features is known as k-tuples. KGap describes a sequence with monoDiKGap combined with subsequences. MonoDiKGap then uses AdaBoost (Zhu et al., 2006) to eliminate redundant features to produce optimal features. The AdaBoost uses the SCRIT package in Python in order to select the n highest scoring features for training after the data have been selected.
As a result of the optimal set of features generated, the dimensionality of the features will be reduced and good predictions will be made. KGap was set at 2 in this study. In monoDiKGap, we can express it as follows:
In Eq. 1,
CC-PSSM (Yanzhi et al., 2008) uses a site-specific scoring matrix as a feature. Using PSI-BLAST (Altschul et al., 1997) and NCBI’s NR database, DNA-binding protein sequences were compared with local information to determine PSSM matrix information. Using the PSSM matrix, protein sequences can be predicted based on evolution. The component
The CC-PSSM algorithm converts PSSM matrixes of various sizes into vectors of identical length. A difference in property between two residues was computed using CC, along with a lag in sequence between them. Following is the formula:
In the Eq. 2,
The Kmer (Liu et al., 2015b) method is a method of extracting protein features based on sequence data, a relatively simple and widely used feature extraction method in bioinformatics. Kmer is a vector consisting of K adjacent amino acid frequency values.
Separate frequencies are calculated for each amino acid arrangement, and the size of the generated frequency vector is
Hundreds of features are selected by feature extraction methods. Nevertheless, some of these features are redundant. In this section, we used the maximum correlation maximum distance (MRMD2.0) (He et al., 2020) to perform feature selection. MRMD2.0 reduces dimensionality and ranks features by identifying those contributing most to predictor variables or outputs. After extracting features from the sequences, it used the concepts of the PageRank algorithm and combined the method coefficients of ANOVA, minimum redundancy and maximum correlation, maximum information, and the minimum absolute shrinkage and selection operators (Quan et al., 2016). Thus, MRMD2.0 used a forward addition method to detect optimized dimensions, combining seven various feature ranking methods with PageRank. Each target page was assigned a weight value according to the PageRank method. Smaller weight values were displayed at the back of pages with larger weight values.
This study is a representative binary classification issue to predict DBP. We mainly used CNN algorithms to better explore the prediction model. To better demonstrate the robustness of our model, the three most prominent deep learning (DL) architectures and five classical machine learning (ML) models were compared. In our study, the DL architectures included CNN, Recurrent Neural Network (RNN) (Arunkumar et al., 2021), Long Short- Term Memory (LSTM) (Liu et al., 2021), while the classical ML models included RF (Qi, 2012), SVM (Meng et al., 2020), Naive Bayes (NB) (Sun, 2005), Logistic Regression (LR) (Hosmer et al., 1997)and K-nearest neighbors (KNN) (Samanthula et al., 2015).
A classical CNN has four kinds of layers: convolutional, pooling, flat, and fully connected. A feature extraction process is conducted on the first two layers, while the last two layers map the extracted features to the final output shown in its classical structure (Le et al., 2018; Nguyen et al., 2019). According to the current study, CNN used the following layers:
1) As part of the convolution process, convolution layers were used to extract features embedded in 1D (one dimension) input vectors. Every input shape was transformed with a sliding window and a specific step shift. A representative value was generated by sliding the input shapes. During the convolution process, a vector preserved distances between values. By utilizing small slides of the input data, this layer was learned the important features (Le et al., 2017; Le et al., 2019).
2) The activation layer was performed after the convolution layer. Rectified Linear Unit (ReLU) is a non-linear operation applied and computed in Eq. 5:
In the Eq. 5, x is the amount of inputs. By introducing ReLU into our CNN, we enabled it to learn more effectively based on data analysis.
3) The pooling layer was used for the convolutional layer to decrease the computation of the following layer. Our architecture selected the maximum pooling from three different types of pooling layers to select the maximum value over 2 windows.
4) To cope with the overfitting problem of neural networks and improve the model’s generalization ability, we set the dropout size to 0.2, randomly discarded some neurons, and improved the performance results in some cases.
5) In the flat layer, the previous layer’s feature matrix is flattened into one-dimensional feature vectors, which facilitate the input to the fully connected layer, which is typically found at the end of a CNN network, and consists of individual nodes connected to the inputs (Srivastava et al., 2014).
6) The fully connected layer was typically applied at the end of the neural network. There is a full connection between each node in this layer and every other node during the previous layer. Two layers were fully connected in the current model. Using this first one, we gained more knowledge and enhanced our model’s performance by connecting all input nodes to the spreading layer. The second layer connected this layer to the output layer. Since DNA-binding proteins were classified using binary classification, the output layer consists of 2 nodes.
7) Softmax is an evaluation function that determines the probability of each possible output at the output. The following formula can be used to calculate its function:
A K-dimensional vector represents the input vector z, the ith class is based on predicted probability for x, and
In this paper, accuracy (ACC) (Wang et al., 2019), sensitivity (SN), specificity (SP) (Zhu et al., 2020), and Mathew correlation coefficient (MCC) (Zeng et al., 2019) were applied as a measure of model performance and represented in Eq. 7–9:
In the model, TP indicates that the DBP is accurately predicted; FN indicates that the DBP is inaccurately predicted as the non-DBP; FP demonstrates that the model inaccurately predicts the DBP from the non-DBP, and TN demonstrates that the model accurately predicts the non-DBP. To determine the performance of our model, we calculated the area under the ROC curve (AUC) and the precision-recall curve (PRC).
Three feature selection approaches were used for comparison to find better feature types. To illustrate the stability and robustness, we used 80% of the samples in the dataset for training and 20% for validation. The constructed neural network has three convolutional layers. The first has a size in convolutional kernels is 10 and a number of 256, the second has a size in convolutional kernels is 5 and a number of 128, and the third has a size in convolutional kernels is 5 and 64. The convolutional layer’s activation function used ReLU to improve generalization to deal with the neural network’s overfitting problem. The size of the dropout was 0.2, and some neurons were randomly discarded. For the pooling layer, max-pooling was chosen for our model. Figure 2 shows the results of classification using a 1D CNN under the three feature selection methods. We found that the model built based on the 441 optimal feature subsets selected by monoDiKGap has a higher performance than other methods. MonoDiKGap feature extraction method predicted 90.5% for the validation set, which is significantly better than CC-PSSM and Kmer-2. According to the analysis, monoTriKGap outperformed better than other two feature selection methods for classification with 1D CNN. The results illustrated the importance of choosing an appropriate feature extraction method for model building.
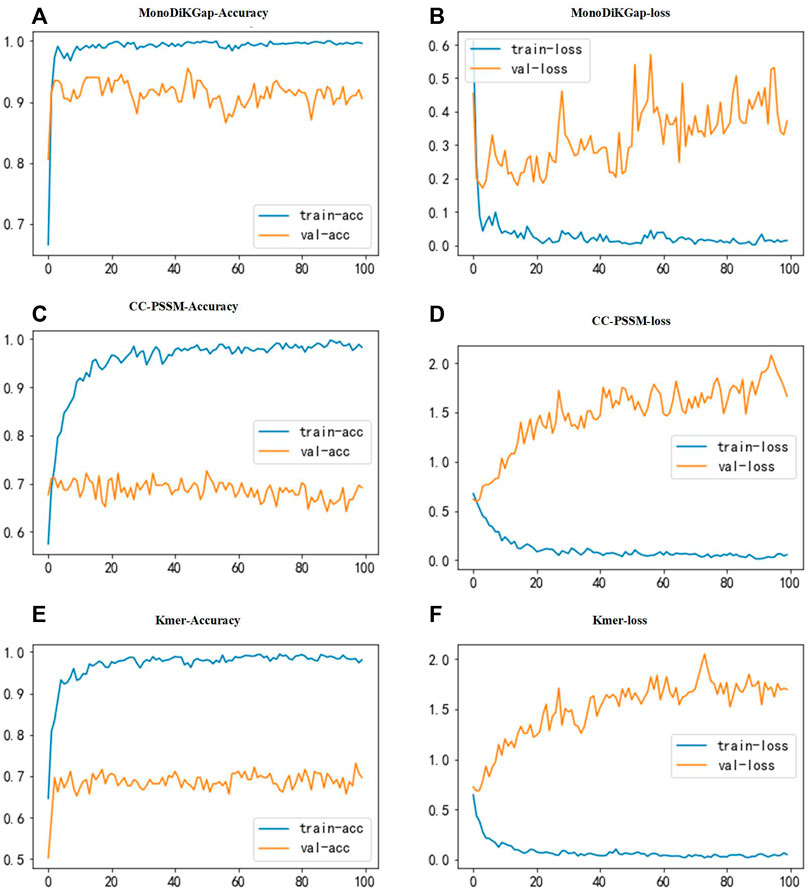
FIGURE 2. Accuracy and loss function plots for three feature selection methods. (A,B) illustrate the accuracy and loss function plots under monoTriKGap. (C,D) illustrate the accuracy and loss function plots under CC-PSSM. (E,F) illustrate the classification accuracy and loss function plots under Kmer. The blue line describes the training set and the yellow line describes the validation set.
Different gradient optimization algorithms were applied to optimize the neural network to enhance the accuracy and convergence of the model. Six optimizers were selected in this paper to optimize the weight coefficients and bias coefficients of the neural network, namely: Adam, SGD, Adagrad, RMSprop, Adadelta, and Adamax optimizers (Chensi et al., 2018). The purpose is to find the appropriate optimizer to converge the model faster and better. The accuracy and loss function plots of the six optimizers are shown after 50 epochs in Figure 3. The best optimizer sought should result in the fastest convergence of the model’s accuracy and loss function. Figure 3 showed that the Adam optimizer worked better, with fewer fluctuations, and was more stable than the other optimizers. Therefore, this parameter optimization step is vital for improving the overall model’s accuracy.
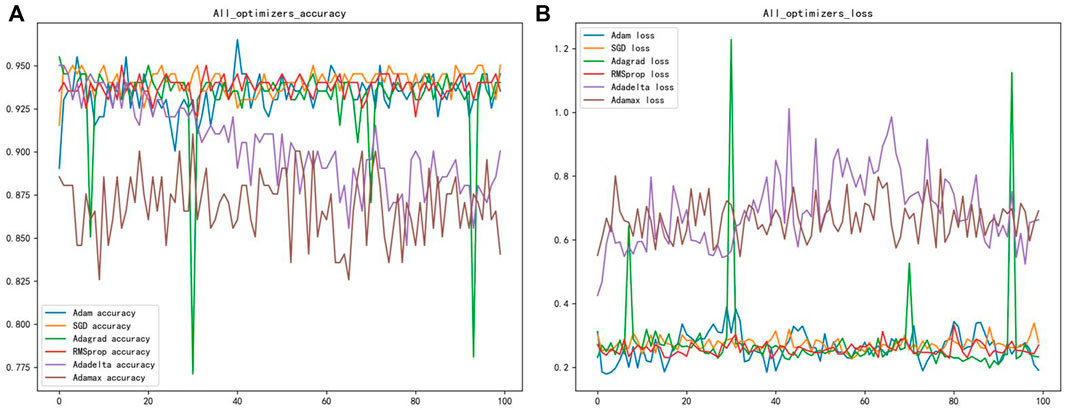
FIGURE 3. (A) Shows the classification accuracy of different optimizers (B) shows the loss function of different optimizers.
To determine a better method for extracting features for DBP, multiple types of feature information was combined by feature combination. Combining the three feature selection approaches yields four types of feature combination methods: monoTriKGap+CC-PSSM, K-mer2 +CC-PSSM, CC-PSSM + Kmer-2, monoTriKGap+CC-PSSM+K-mer2. There may be redundancies among these feature combinations, which can affect performance. Therefore, each of these four feature combinations was dimensionally reduced through MRMD2.0 and the classification results of the validation set were evaluated using a 1-D CNN, and the results were shown in Table 1. The best classification was found by comparing experimental results when monoTriKGap and Kmer were applied with MRMD2.0 dimensionality reduction, which provided ACC values of 94%, MCC values of 0.91, SN values of 95%, and SP values of 93.1%, which was a 3.5% increase over the accuracy obtained by monoTriKGap with a single optimal feature. The monoDiKGap method combines basic features from adjacent amino acids, generating features to capture amino acid arrangement frequency distributions in biological protein sequences, as well as reducing the amount of dimensionality, complexity and computation time by selecting features with the most distinguishable information based on AdaBoost. An advantage of a K-mer protein representation is that it does not require structural knowledge in order to determine the frequency of incidence of k neighboring amino acids. Howerver, with frequency-based features, the more features that are redundant, the less improvement it makes, and the longer the feature vector becomes, the less generalization ability of the underlying prediction model will be achieved. The CC-PSSM has the advantages of storing the evolutionary information of protein sequences. However, calculating features takes time and does not utilize evolutionary information and protein sequence order information, making the process more time consuming. To analyze the amino acid frequency distribution from different perspectives, we found that combining K-mer and monoDiKGap is more effective, and we called this model Hybrid_DBP.
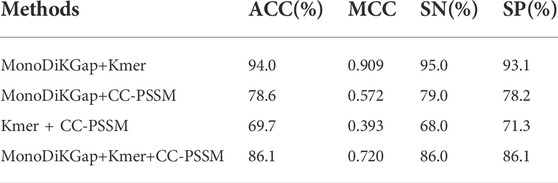
TABLE 1. Performance comparison of different feature combinations under 1-D CNN
To test the generalization ability of the Hybrid_DBP, we used PDB186 to test Hybrid_DBP. The first step in the process was to extract feature vectors using the monoDiKGap method and Kmer, followed by filtering the extracted feature set with MRMD2.0 to generate the best hybrid features with low redundancy and high relevance. The hybrid features were not only more expressive, but also reduce feature dimensionality. After using CNN for classification, 91.2% of DBPs were identified. Figure 4 showed the confusion matrix for the validation and test sets of the model. According to the result, the model developed in this paper was extremely useful for identifying DBP.
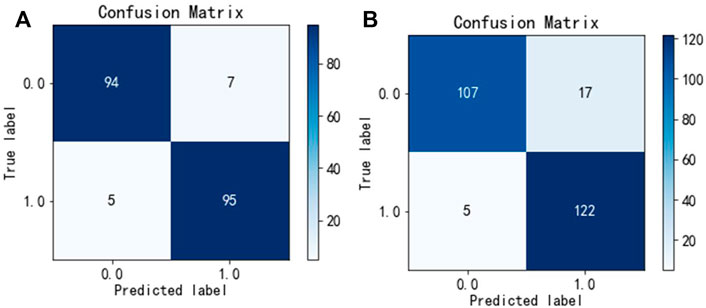
FIGURE 4. Confusion matrix unde Hybrid_DBP (A) validation set, (B) test set.
To explore the extracted features used to select the best classification method, we kept the other conditions of the model constant and explored the model with three classical deep learning methods and five machine learning classification methods while exploring the model. We selected a total of eight widely used classifiers for comparison on the same benchmark dataset, namely CNN, RNN, LSTM, RF, NB, LR, KNN and SVM, based on the Hybrid_DBP approach. Figure 5 illustrated the ROC curve and PRC curves from multiple classification models, in which it could be observed that the ROC curve of CNN should be the furthest from the dotted line, close to the upper left corner, with a value of 0.963. A CNN model with PRC curve value of 0.95, closest to the upper right corner, had the best classification capability. Therefore, CNN was used to construct our final classification model.
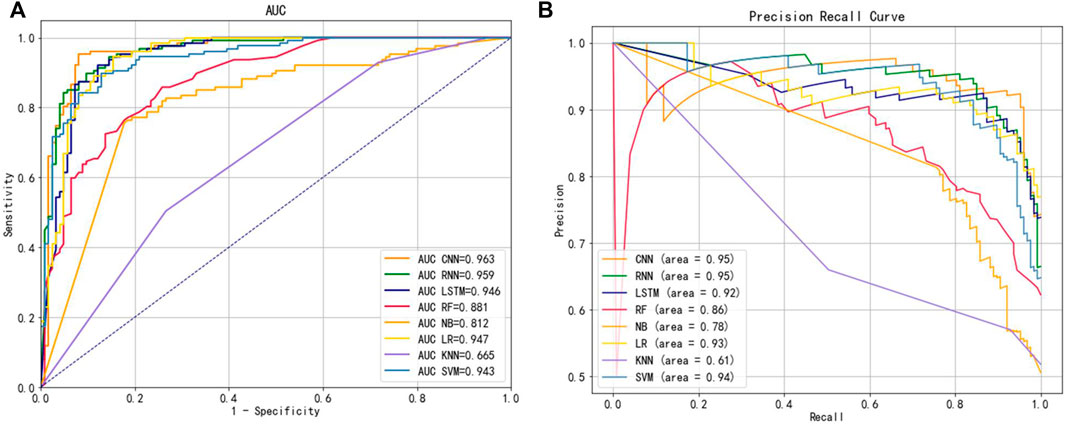
FIGURE 5. (A) ROC curves for different classifiers (B) PRC curves for different classifiers.
To compare and analyze the advantages of this model with previous results, we used PDB186 to conduct experiments. Table 2 compared the performance method with 10 previous methods on the independent data set. From the monoTriKGap-CNN method, we found that the ACC was 91.2%, the MCC was 0.828, the SN was 96.1, which were 5.1%, 0.107 and 11% better than the current optimal PsePSSM+PSSM-AB+PSSM-DWT methods, respectively. Compared to most of the existing methods, the CNN-based algorithms performed better at certain confidence levels. The selected method presented in this study is effective and accurate at identifying DBP based on the previous experimental results.
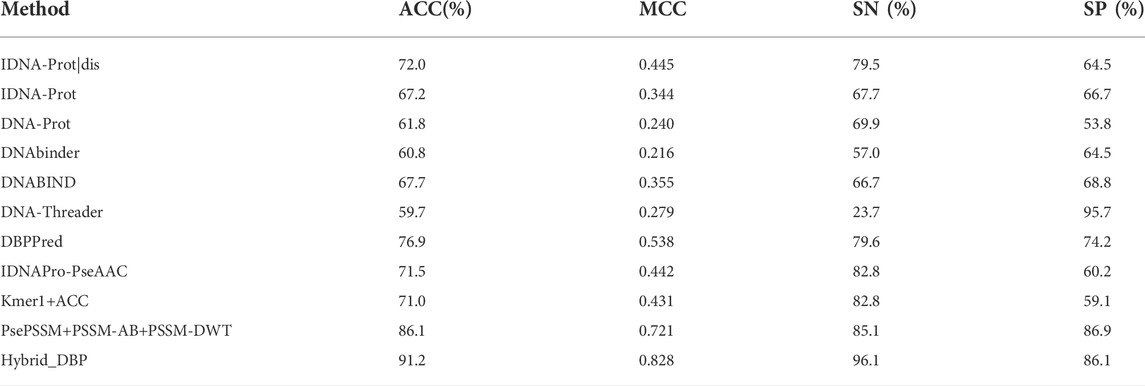
TABLE 2. Performance comparison of existing methods
The ability to accurately predict DNA-binding proteins could be beneficial for treating diseases, which is more beneficial to developing drugs and treating diseases. This study focuses on the accurate prediction of DBP. The results showed that the best feature set produced by combining monoDiKGap and Kmer via MRMD2.0 under convolutional neural networks could predict 94% of DNA binding proteins. Furthermore, with the Hybrid_DBP, 91.2% accuracy was achieved in the independent test set. As a result, the Hybrid_DBP model was a useful method for studying DBP and providing reference values for other research studies.
The original contributions presented in the study are included in the article/Supplementary Material, further inquiries can be directed to the corresponding author.
Conception, BL and DP; collection or analysis of data, SY and WZ; validation, WZ and PW; writing—creation of original draft, SY and DY; writing—revisions and editing, DP and FW. All authors have approved the published manuscript.
This work was supported by the National Nature Science Foundation of China (Grant Nos. 61863010, 11926205,11926412, and 61873076), National Key R and D Program of China (No.2020YFB2104400,2021YFA1300404), Natural Science Foundation of Hainan, China (Grant Nos.121RC538, 119MS036, 120RC588,120MS028 and 2019RC184), the innovation platform for Academinicians of Hainan Province and Hainan Province 2021 Graduate Student Innovation Research Project (Qhys 2021–303).
The authors declare that the research was conducted in the absence of any commercial or financial relationships that could be construed as a potential conflict of interest.
All claims expressed in this article are solely those of the authors and do not necessarily represent those of their affiliated organizations, or those of the publisher, the editors and the reviewers. Any product that may be evaluated in this article, or claim that may be made by its manufacturer, is not guaranteed or endorsed by the publisher.
Altschul, S. F., Madden, T. L., Schaffer, A. A., Zhang, J., Zhang, Z., Miller, W., et al. (1997). Gapped BLAST and PSI-blast: A new generation of protein database search programs. Nucleic Acids Res. 25, 3389–3402. doi:10.1093/nar/25.17.3389
Arunkumar, K. E., Kalaga, D. V., Kumar, C. M. S., Kawaji, M., and Brenza, T. M. (2021). Forecasting of COVID-19 using deep layer recurrent neural networks (RNNs) with gated recurrent units (GRUs) and Long short-term memory (LSTM) cells. Chaos Solit. Fractals 146, 110861. doi:10.1016/j.chaos.2021.110861
Chensi, C., Liu, F., Tan, H., Song, D., Shu, W., Li, W., et al. (2018). Deep learning and its applications in biomedicine. Genomics Proteomics Bioinforma. 16, 17–32. doi:10.1016/j.gpb.2017.07.003
Galili, T. (2015). dendextend: an R package for visualizing, adjusting and comparing trees of hierarchical clustering. Bioinformatics 31, 3718–3720. doi:10.1093/bioinformatics/btv428
Gao, M., and Jeffrey, S. (2008). DBD-hunter: A knowledge-based method for the prediction of DNA–protein interactions. Nucleic Acids Res. 36, 3978–3992. doi:10.1093/nar/gkn332
He, S., Guo, F., Zou, Q., and Hui, D. (2020). MRMD2.0: A Python tool for machine learning with feature ranking and reduction. Curr. Bioinform. 15, 1213–1221. doi:10.2174/1574893615999200503030350
Hosmer, D. W., Hosmer, T., Le Cessie, S., and Lemeshow, S. (1997). A comparison of goodness-of-fit tests for the logistic regression model. Statistics Med. 16, 965–980. doi:10.1002/(SICI)1097-0258(19970515)16:9<965::AID-SIM509>3.0.2-O
Kumar, K. K., Pugalenthi, G., and Suganthan, P. N. (2009). DNA-prot: Identification of DNA binding proteins from protein sequence information using random forest. J. Biomol. Struct. Dyn. 26, 679–686. doi:10.1080/07391102.2009.10507281
Kumar, M., Gromiha, M. M., and Raghava, G. P. (2007). Identification of DNA-binding proteins using support vector machines and evolutionary profiles. BMC Bioinforma. 8, 463–510. doi:10.1186/1471-2105-8-463
Le, N., Huynh, T. T., Yapp, E. K. Y., and Yeh, H. Y. (2019). Identification of clathrin proteins by incorporating hyperparameter optimization in deep learning and PSSM profiles. Comput. Methods Programs Biomed. 177, 81–88. doi:10.1016/j.cmpb.2019.05.016
Le, N. Q. K., Ho, Q. T., and Ou, Y. Y. (2017). Incorporating deep learning with convolutional neural networks and position specific scoring matrices for identifying electron transport proteins. J. Comput. Chem. 38, 2000–2006. doi:10.1002/jcc.24842
Le, N., Quang-Thai, H., and Ou, Y. Y. (2018). Classifying the molecular functions of Rab GTPases in membrane trafficking using deep convolutional neural networks. Anal. Biochem. 555, 33–41. doi:10.1016/j.ab.2018.06.011
Li, G., Du, X., Li, X., Zou, L., Zhang, G., and Wu, Z. (2021). Prediction of DNA binding proteins using local features and long-term dependencies with primary sequences based on deep learning. PeerJ 9, e11262. doi:10.7717/peerj.11262
Lin, W. Z., Fang, J. A., Xiao, X., and Chou, K. C. (2011). iDNA-Prot: Identification of DNA binding proteins using random forest with grey model. Plos One 6, e24756. doi:10.1371/journal.pone.0024756
Liu, B., Liu, F., Wang, X., Chen, J., Fang, L., and Chou, K. C. (2015). Pse-in-One: A web server for generating various modes of pseudo components of DNA, RNA, and protein sequences. Nucleic Acids Res. 43, W65–W71. doi:10.1093/nar/gkv458
Liu, B., Wang, S., Dong, Q., Li, S., and Liu, X. (2016). Identification of DNA-binding proteins by combining auto-cross covariance transformation and ensemble learning. IEEE Trans. Nanobioscience 15, 328–334. doi:10.1109/TNB.2016.2555951
Liu, B., Wang, S., and Wang, X. (2015). DNA binding protein identification by combining pseudo amino acid composition and profile-based protein representation. Sci. Rep. 5, 15479–15511. doi:10.1038/srep15479
Liu, B., Xu, J., Lan, X., Xu, R., Zhou, J., Wang, X., et al. (2014). iDNA-Prot|dis: Identifying DNA-binding proteins by incorporating amino acid distance-pairs and reduced alphabet profile into the general pseudo amino acid composition. PloS one 9, e106691. doi:10.1371/journal.pone.0106691
Liu, B., Wu, H., and Chou, K. C. (2017). Pse-in-One 2.0: An improved package of web servers for generating various modes of pseudo components of DNA, RNA, and protein sequences. Nat. Sci. (Irvine). 9, 67–91. doi:10.4236/ns.2017.94007
Liu, J., Pan, C., Lei, F., Hu, D., and Zuo, H. (2021). Fault prediction of bearings based on LSTM and statistical process analysis. Reliab. Eng. Syst. Saf. 214, 107646. doi:10.1016/j.ress.2021.107646
Lou, W., Wang, X., Chen, F., Chen, Y., Jiang, B., and Zhang, H. (2014). Sequence based prediction of DNA-binding proteins based on hybrid feature selection using random forest and Gaussian Naı¨ve Bayes. PloS one 9, e86703. doi:10.1371/journal.pone.0086703
Lu, W., Song, Z., Ding, Y., Wu, H., Cao, Y., Zhang, Y., et al. (2020). Use chou's 5-step rule to predict DNA-binding proteins with evolutionary information. Biomed. Res. Int. 2020, 6984045–6984049. doi:10.1155/2020/6984045
Luscombe, N. M., Austin, S. E., Berman, H. M., and Thornton, J. M. (2000). An overview of the structures of protein-DNA complexes. Genome Biol. 1, 1–37. doi:10.1186/gb-2000-1-1-reviews001
Meng, C., Wu, J., Guo, F., Dong, B., and Xu, L. (2020). CWLy-pred: A novel cell wall lytic enzyme identifier based on an improved MRMD feature selection method. Genomics 112, 4715–4721. doi:10.1016/j.ygeno.2020.08.015
Mu, G., and Skolnick, J. (2009). A threading-based method for the prediction of DNA-binding proteins with application to the human genome. PLoS Comput. Biol. 5, e1000567. doi:10.1371/journal.pcbi.1000567
Nakano, T., Xu, X., Salem, A. M. H., Shoulkamy, M. I., and Ide, H. (2016). Radiation-induced DNA-protein cross-links: Mechanisms and biological significance. Free Radic. Biol. Med. 107, 136–145. doi:10.1016/j.freeradbiomed.2016.11.041
Nguyen, T., Le, N. Q. K., Kusuma, R. M. I., and Ou, Y. Y. (2019). Prediction of ATP-binding sites in membrane proteins using a two- dimensional convolutional neural network. J. Mol. Graph. Model. 92, 86–93. doi:10.1016/j.jmgm.2019.07.003
Qi, Y. (2012). “Random forest for bioinformatics,” in Ensemble Machine Learning (Boston, MA,USA: Springer), 307–323. doi:10.1007/978-1-4419-9326-7_11
Quan, Z., Zeng, J., Cao, L., and Ji, R. (2016). A novel features ranking metric with application to scalable visual and bioinformatics data classification. Neurocomputing 173, 346–354. doi:10.1016/j.neucom.2014.12.123
Rafsanjani, M., Ahmed, S., Md Farid, D., Shatabda, S., Sharma, A., and Dehzangi, A. (2019). PyFeat: A python-based effective feature generation tool for DNA, rna, and protein sequences. Bioinformatics 35, 3831–3833. doi:10.1093/bioinformatics/btz165
Samanthula, B. K., Elmehdwi, Y., and Wei, J. (2015). K-nearest neighbor classification over semantically secure encrypted relational data. IEEE Trans. Knowl. Data Eng. 27, 1261–1273. doi:10.1109/TKDE.2014.2364027
Srivastava, N., Hinton, G. E., Krizhevsky, A., Sutskever, I., and Salakhutdinov, R. R. (2014). Dropout: A simple way to prevent neural networks from overfitting. J. Mach. Learn. Res. 15, 1929–1958. doi:10.5555/2627435.2670313
Sun, H. (2005). A naive Bayes classifier for prediction of multidrug resistance reversal activity on the basis of atom typing. J. Med. Chem. 48, 4031–4039. doi:10.1021/jm050180t
Szilágyi, A., and Skolnick, J. (2006). Efficient prediction of nucleic acid binding function from low-resolution protein structures. J. Mol. Biol. 358, 922–933. doi:10.1016/j.jmb.2006.02.053
Wang, H., Ding, Y., Tang, J., and Guo, F. (2019). Identification of membrane protein types via multivariate information fusion with Hilbert–Schmidt Independence Criterion. Neurocomputing 383, 257–269. doi:10.1016/j.neucom.2019.11.103
Yanzhi, G., Yu, L., Wen, Z., and Li, M. (2008). Using support vector machine combined with auto covariance to predict protein–protein interactions from protein sequences. Nucleic Acids Res. 36, 3025–3030. doi:10.1093/nar/gkn159
Zeng, X., Zhu, S., Liu, X., Zhou, Y., Nussinov, R., and Cheng, F. (2019). deepDR: a network-based deep learning approach to in silico drug repositioning. Bioinformatics 35, 5191–5198. doi:10.1093/bioinformatics/btz418
Zhang, Y., Holenarsipur, V. K., Kandoussi, H., Zeng, J., Mariappan, T. T., Sinz, M., et al. (2020). DeepSite: Bidirectional LSTM and CNN models for predicting DNA-protein binding. Drug Metab. Dispos. 11, 841–848. doi:10.1124/dmd.120.000076
Zhu, J., Arbor, A., Hastie, T., and Zou, H. (2006). Multi-class AdaBoost. Stat. Interface 2, 349–360. doi:10.4310/SII.2009.v2.n3.a8
Keywords: DNA-binding proteins, monoDiKGap, CC-PSSM, kmer, MRMD2.0, convolutional neural network
Citation: Yu S, Peng D, Zhu W, Liao B, Wang P, Yang D and Wu F (2022) Hybrid_DBP: Prediction of DNA-binding proteins using hybrid features and convolutional neural networks. Front. Pharmacol. 13:1031759. doi: 10.3389/fphar.2022.1031759
Received: 30 August 2022; Accepted: 27 September 2022;
Published: 10 October 2022.
Edited by:
Xiangxiang Zeng, Hunan University, ChinaReviewed by:
Yuanyuan Zhang, Qingdao University of Technology, ChinaCopyright © 2022 Yu, Peng, Zhu, Liao, Wang, Yang and Wu. This is an open-access article distributed under the terms of the Creative Commons Attribution License (CC BY). The use, distribution or reproduction in other forums is permitted, provided the original author(s) and the copyright owner(s) are credited and that the original publication in this journal is cited, in accordance with accepted academic practice. No use, distribution or reproduction is permitted which does not comply with these terms.
*Correspondence: Wen Zhu, c3l6aHV3ZW5AMTYzLmNvbQ==
Disclaimer: All claims expressed in this article are solely those of the authors and do not necessarily represent those of their affiliated organizations, or those of the publisher, the editors and the reviewers. Any product that may be evaluated in this article or claim that may be made by its manufacturer is not guaranteed or endorsed by the publisher.
Research integrity at Frontiers
Learn more about the work of our research integrity team to safeguard the quality of each article we publish.