 Chu-Qiao Gao
 Yuan-Ke Zhou
 Xiao-Hong Xin
 Pu-Feng Du
- College of Intelligence and Computing, Tianjin University, Tianjin, China
Drug repositioning provides a promising and efficient strategy to discover potential associations between drugs and diseases. Many systematic computational drug-repositioning methods have been introduced, which are based on various similarities of drugs and diseases. In this work, we proposed a new computational model, DDA-SKF (drug–disease associations prediction using similarity kernels fusion), which can predict novel drug indications by utilizing similarity kernel fusion (SKF) and Laplacian regularized least squares (LapRLS) algorithms. DDA-SKF integrated multiple similarities of drugs and diseases. The prediction performances of DDA-SKF are better, or at least comparable, to all state-of-the-art methods. The DDA-SKF can work without sufficient similarity information between drug indications. This allows us to predict new purpose for orphan drugs. The source code and benchmarking datasets are deposited in a GitHub repository (https://github.com/GCQ2119216031/DDA-SKF).
1 Introduction
In recent decades, although investment in pharmaceutical research and development has increased substantially, the discovery of a new drug is still a time-consuming, risky, and challenging process (Chong and Sullivan, 2007; Paul et al., 2010; Pammolli et al., 2011; Li et al., 2016). The pharmaceutical industry did not receive rational benefits from investments (Kola and Landis, 2004; Munos, 2009; Schuhmacher et al., 2016). A large number of new drug candidates failed in the FDA evaluations, thereby preventing their applications in therapies (Weng et al., 2013; Mullard, 2017; Mullard, 2018; Mullard, 2019; Mullard, 2020; Mullard, 2021). Today, drug repositioning has gained importance in identifying new therapeutic purposes for already-approved drugs (Parvathaneni et al., 2019). Repositioning of “old” drugs to treat both common and rare diseases is becoming an attractive proposition because it involves the use of safe compounds, with potentially lower overall development costs and shorter development cycles (Pushpakom et al., 2019). So far, drug repositioning has achieved many successes (Swanson, 1990; Soignet et al., 1998; Ashburn and Thor, 2004). Currently, rare diseases are a serious threat to human health (Wästfelt et al., 2006; Harari, 2016). Several orphan drugs are intended to treat rare diseases. Developing a new drug intended to treat a rare disease is costly and time-consuming (Attwood et al., 2018). Drug repositioning is considered as a more efficient strategy than traditional drug development (Scherman and Fetro, 2020). In fact, some successfully repurposed orphan drugs (Gordon et al., 2018; Kurolap et al., 2019; Scherman and Fetro, 2020) have attracted much attention. Therefore, systematic computational drug repositioning is an important research topic in both medical science and computational life science.
Many computational methods have been proposed to predict potential drug–disease associations for drug repositioning. Machine learning approaches play important roles in predicting associations between drugs and diseases. For example, Gottlieb et al. (2011) integrated several drug similarities and disease similarities to score the novel drug–disease associations by learning a logistic regression classifier. Recently, a method, which is called DRIMC (Zhang et al., 2020), introduced a drug-repositioning approach by using Bayesian inductive matrix completion. Xuan et al. (2019) presented DisDrugPred method based on nonnegative matrix factorization to predict the drug-related candidate indications. SCMFDD (Zhang et al., 2018b) proposed a similarity-constrained matrix factorization method for the drug–disease association prediction. PREDICT (Gottlieb et al., 2011) integrated several similarities to score the novel associations by learning a logistic regression classifier. LRSSL (Liang et al., 2017) proposed a Laplacian regularized sparse subspace learning method to identify novel indications.
Recently, the systems biology–based methods have been overwhelmingly studied in predicting drug–disease associations. Most methods of this kind constructed a heterogenous network model before calculating prediction scores. The MBiRW model (Luo et al., 2016) utilized bi-random walk (BiRW) algorithm to predict unknown drug–disease associations on a heterogenous network. Luo et al. (2018) designed a drug repositioning recommendation system (DRRS) based on the singular value decomposition to complete the potential association matrix of the heterogenous network. BNNR (Yang et al., 2019a) employs a bounded norm regularization method to complete the drug–disease matrix under the low-rank assumption. NTSIM (Zhang et al., 2018a) used the network topological similarity-based inference method. Yu et al. (2021) proposed a novel computational method, which is named as a layer attention graph convolutional network, to predict unobserved associations.
Previous studies have achieved many successes. It should be noted that most existing methods employ only one type of drug or disease similarity rather than integrating multiple similarities (Yang et al., 2019a; Yang et al., 2019b). Some models utilized linear combinations to integrate multiple similarities (Jiang et al., 2019; Yan et al., 2019), which loses the high-order interactions between different similarities.
In this work, we proposed the similarity kernel fusion (SKF) to integrate different similarity kernels with Laplacian regularized least squares (LapRLS) algorithms. We named our method as the DDA-SKF method. The overall workflow of DDA-SKF was illustrated in Figure 1. First, we constructed multiple similarity kernels for drugs and diseases. These similarity kernels were integrated by the SKF iterative process into two comprehensive similarity kernels. Finally, the Laplacian regularized least squares (LapRLS) algorithms were used to obtain the prediction association matrix. To demonstrate the effectiveness of our model, we compared it with several state-of-the-art methods.
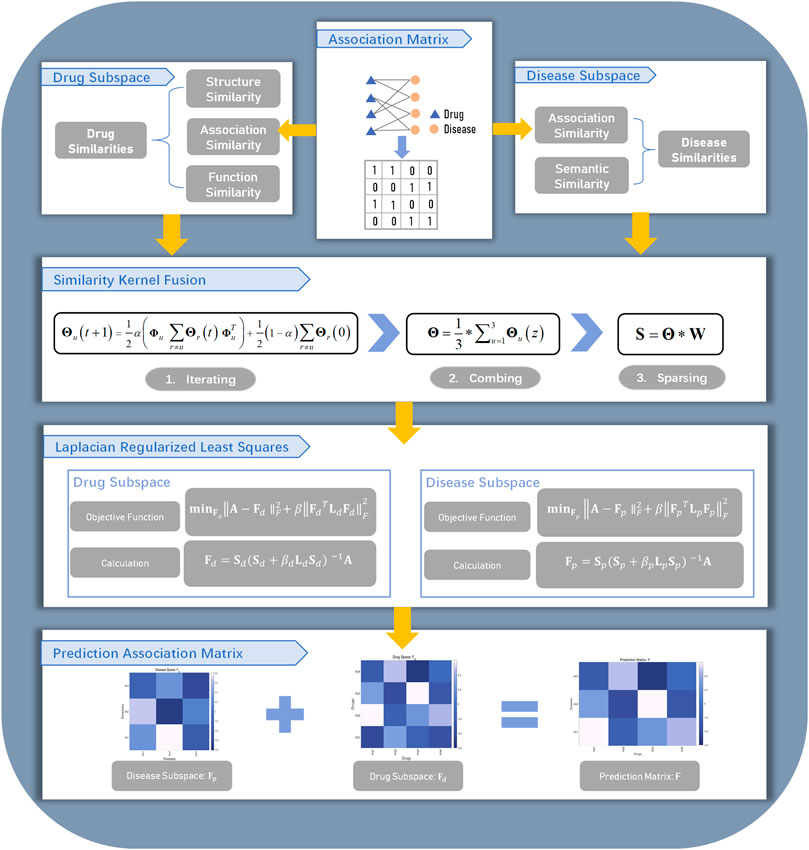
FIGURE 1. Flowchart of DDA-SKF. The model DDA-SKF included three steps: (1) three drug similarity kernels and two disease similarity kernels were calculated; (2) similarity kernel fusion (SKF) algorithm was used to integrate these similarities into two comprehensive similarity kernels; (3) Laplacian regularized least squares (LapRLS) framework was used to build the prediction model.
2 Materials and Methods
2.1 Drug–Disease Association Dataset
We adapted two benchmarking datasets in this article, which are the PREDICT dataset and the LRSSL dataset. The PREDICT dataset was obtained from the literature (Gottlieb et al., 2011), which was originally collected from the DrugBank database (Wishart et al., 2018) and the OMIM (Online Mendelian Inheritance in Man) database (Hamosh et al., 2005). It contains 1933 known drug–disease associations between 593 drugs and 313 diseases. The LRSSL dataset was extracted from the literature (Liang et al., 2017). It contains 3,051 drug–disease associations between 763 drugs and 681 diseases.
Without losing generality, we take the PREDICT dataset as an example to describe our method. Let pi (i = 1, 2, … , 313) be the i-th disease and dj (j = 1, 2, … , 593) the j-th drug. We defined the relationship between pi and dj as:
An adjacency matrix was then created to describe the drug–disease associations in the whole dataset which can be noted as A ∈ R313×593.
2.2 Similarity Kernels for Drug and Disease
The basic assumption of this work is that drug-related diseases are more likely to be similar when the drugs are more similar. Three different similarity kernels of drugs and two different similarity kernels of diseases were applied. By fusing these similarity kernels, our method can identify potential associations between drugs and diseases.
2.2.1 Drug Chemical Similarity
We obtained the drug chemical similarity kernel from the literature (Zhang et al., 2020). PaDEL software (Yap, 2011) was used to compute PubChem fingerprint descriptors for each drug. The pairwise similarity between drugs was measured by the Jaccard coefficient between PubChem fingerprints. The drug chemical similarity kernel was noted as a 593 × 593 matrix Md,1. Md,1 (i, j), which is the element in the i-th row and the j-th column of Md,1, represents the chemical similarity between the i-th and the j-th drug. Because of the Jaccard coefficient definition, 0 ≤ Md,1 (i, j) ≤ 1.
2.2.2 Drug Functional Similarity Kernel
The drug function was described by the Gene Ontology terms of the target genes. The Jaccard coefficient was used to measure the similarity between the Gene Ontology annotations of two different target genes. We obtain the similarity values from the literature (Zhang et al., 2020). The drug functional similarity was noted also as a 593 × 593 matrix Md,2. The element Md,2 (i, j) is the functional similarity between the i-th drug and the j-th drug.
2.2.3 Association Similarity Kernels for Drugs and Diseases
The association profile of the i-th drug is defined as the i-th column of the association matrix A, which can be noted as A*i. The drug association similarity kernel was represented by a 593 × 593 matrix Md,3; the element Md,3 (i, j) is the association similarity between di and dj, which can be defined as:
where
and ||.|| is the 2-norm operator.
Similarly, the association profile of the i-th disease is defined as the i-th row of the association matrix A, which can be noted as Ai*. The disease association similarity kernel was represented by a 313 × 313 matrix Mp,1; the element Mp,1 (i, j) is the association similarity between disease pi and disease pj, which can be calculated as:
where
2.2.4 Disease Semantic Similarity Kernel
A disease semantic similarity kernel is a 313 × 313 matrix Mp,2. The element Mp,2 (i, j) is the similarity between disease pi and disease pj. The disease semantic similarity is accessible by MimMiner (van Driel et al., 2006), which is a text mining approach to quantify phenotype relationships between human disease phenotypes from the OMIM database. We obtain the values of Mp,2 from the literature (Zhang et al., 2020).
2.3 Similarity Kernel Fusion
The similarity kernel fusion (SKF) algorithm was applied to integrate three drug similarity kernels into a drug comprehensive similarity kernel and two disease similarity kernels into a disease comprehensive similarity kernel. Without losing generality, we take the drug similarity kernels as an example to explain this fusing process.
First, we normalize the aforementioned three drug similarity kernels (Md,u, u = 1, 2, 3) by using the following formula:
where θd,u (i, j) represents a normalized similarity corresponding to Md,u (i, j). The matrix composed by the normalized kernel is noted as:
Second, we established a neighbor-constrained normalization kernel for each drug similarity kernel. Given the drug di and Md,u, we collected the k most similar drugs as a set Nd,u (i, k). The neighborhood-constrained normalization of the Md,u can be defined as follows:
where
The matrix composed by the neighborhood-constrained normalization is noted as:
Finally, the normalized kernel Θd,u and the neighbor-constrained normalization kernel Φd,u were fused by using the following iterative process:
where t is the number of iterations, α, a weight parameter between 0 and 1, T, the transpose operator in matrix algebra, and
After z rounds of iterative computations, we obtained the integration kernel as follows:
Although useful information was extracted in the fusion process, noise is inevitable simultaneously. The information of k most similar drugs for each drug was further extracted to suppress the noise influence by defining a weight matrix; we defined an indicator function as follows:
Finally, the drug comprehensive similarity kernel was defined as the following formula:
where θd (i, j) is the element in the i-th row and the j-th column of the matrix Θd.
By applying Eqs 6–15 and employing two disease similarities, we obtained the disease comprehensive similarity kernel Sp,k. The value of k in the computing disease comprehensive similarity kernel is not necessarily the same as that of the drugs.
2.4 Laplacian Regularized Least Squares
In this work, Laplacian regularized least squares (LapRLS) were employed to build the prediction model to uncover the potential drug–disease associations. Based on the characteristics of the model, we could predict the drug–disease associations from either the drug subspace or disease subspace.
In terms of the drug subspace, the Laplacian similarity matrix Ld was represented as follows:
where Dd is a diagonal matrix whose diagonal elements are the sum of the corresponding row elements of the matrix Sd,k.
The drug–disease association prediction matrix Fd was calculated by minimizing the following loss function:
where A is the original drug–disease association matrix, Fd, the predicted association matrix in the drug subspace, βd, the weighting coefficient, and ||.||F, the F-norm operator. The first term of the loss function aims to reduce the difference between the original matrix and prediction matrix. The second term is used to avoid the over-fitting problem.
The derivation of the optimization algorithm of LapRLS was introduced in Xia et al. (2010). We can calculate the predicted association matrix in the drug subspace by using the following formula:
Similarly, by using Eqs 16–18 on the disease subspace, the predicted association matrix Fp in the disease subspace was calculated as follows:
where Lp is the normalized similarity matrix in the disease subspace. Lp was defined as follows:
where Dp is the diagonal matrix of the matrix Sp,k.
With the two predicted association matrices Fd and Fp, we defined the final predicted association matrix as follows:
where λ ∈ (0, 1) is a weighting parameter.
2.5 Performance Evaluation
We used novel association prediction and novel drug prediction to estimate the prediction performance of our method. In the novel association prediction, we applied both 5-fold and 10-fold cross-validation schemes. For the 10-fold cross validation, all drug–disease associations in the benchmarking dataset were divided into 10 nonoverlapping subsets randomly with almost the same size. While for the 5-fold cross validation, the number of the nonoverlapping subsets is five. The novel drug prediction was used to evaluate the prediction performance on new drugs. All drugs, not the drug–disease associations, were randomly divided into 10 subsets of approximately equal size. In each trial, one set was used in turn to act as the testing set, and other sets were used as the training set. In all aforementioned cross-validations, when one subset was used as the testing set, all prior knowledge of the testing set was removed before computing the association similarity kernels for drugs and diseases. The known associations corresponding to the testing set were reset to unknown. This guarantees that there is no information leak in the testing process.
All pairs of drug–disease associations were scored. Given a threshold, the drug–disease pair with a score larger than the threshold is predicted to be associated, otherwise nonassociated.
Due to the requirement of performance comparison and the performance values that are reported by the existing methods, we took a different set of performance measures in different contexts. We used the AUROC (area under receiver operating characteristics) curve and AUPR (area under precision-recall) curve to evaluate the prediction performance of our method in the context of 10-fold cross-validations. AUROC and AUPR are threshold-free metrics that are capable of measuring the overall performance of prediction models (Jiao and Du, 2016). While AUROC is powerful and popular as a main performance evaluation index, the value of AUROC may be misleading when the dataset is highly imbalanced (Saito and Rehmsmeier, 2015). It should be noticed that the value of AUPR can be used as an alternative metric to evaluate the prediction performance when the data is imbalanced (Davis and Goadrich, 2006). The value of AUPR tends to be smaller relative to the value of AUROC because of the highly imbalanced dataset (Saito and Rehmsmeier, 2015). In the context of 5-fold cross-validations, we applied several additional performance measures other than the AUROC and the AUPR. Six statistics, including sensitivity (SEN), specificity (SPE), precision (PRE), accuracy (ACC), F1-score (F1), and Matthew’s correlation coefficient (MCC), were applied in measuring the prediction performance of DDA-SKF in the context of 5-fold cross-validations. The threshold was optimized to maximize the F1-score. These performance measures were defined as follows:
where TP, TN, FP, and FN represent the number of true positives, true negatives, false positives, and false negatives in the 5-fold cross-validation, respectively.
2.6 Parameter Calibration
There are three parameters in the SKF, which are the number of neighbors k, the weighting coefficient α, and the number of iterations t. There are also two parameters in the LapRLS, which are the weighting coefficients β and λ. To find the best parameter combination, we performed many trials manually with arbitrary values of parameters to optimize the AUROC value. We also performed a systematic exploration using a floating forward grid search strategy to further analyze the effects of different parameters. We finally fix the parameter values α and k as 0.2 and 15 in the drug subspace, while 0.7 and 10 in the disease subspace, respectively. The parameters β and λ were fixed as 2−16 and 0.4, respectively. The number of iteration t was determined using a stopping criterion. We defined the relative error Ed,u in the drug space as follows:
where u = 1, 2, 3. The relative error Ep,u in the disease subspace is defined similarly. In the disease subspace, if the Ed,u < 10−7 and t ≥ 10, the iteration will be terminated, while in the drug subspace, the iteration will be terminated if Ep,u <10−10 and t ≥ 10. The number of iterations was finally fixed as 10.
3 Results and Discussion
In this section, we verified the prediction performance of DDA-SKF. First, we compared the performance of DDA-SKF with other state-of-the-art methods. Second, case studies were conducted to confirm the effectiveness of DDA-SKF. Third, we employed single similarity in the drug and disease subspace to predict potential associations and compared the performance of single similarity and SKF.
3.1 Comparison With State-Of-The-Art Methods
In this section, to evaluate the prediction performance of our model on the benchmarking datasets using both novel association prediction and the novel drug prediction. We compared our model against other state-of-the-art methods, including BNNR (Yang et al., 2019a), DisDrugPred (Xuan et al., 2019), DRRS (Luo et al., 2018), SCMFDD (Zhang et al., 2018b), MBiRW (Luo et al., 2016), and DRIMC (Zhang et al., 2020). We also compared our method against the PREDICT (Gottlieb et al., 2011), LRSSL (Liang et al., 2017), and NTSIM methods (Zhang et al., 2018a).
To eliminate the randomness in the cross-validation, we repeated each cross-validation five times with different random data partition schemes. The average value and the standard deviations of every performance measures were reported. However, it should be noted that the standard deviations were not reported by other methods in comparison.
For the novel association prediction, the evaluation results of all the methods on the benchmarking dataset are collected in Table 1. As in Table 1, DDA-SKF obtained good values in AUROC and AUPR. DDA-SKF achieved an AUROC of 0.937, which is 0.536, 5.281, 0.861, 31.601, and 2.854%, respectively, higher than that of BNNR’s 0.932, DisDrugPred’s 0.890, DRRS’s 0.929, SCMFDD’s 0.712, and MBiRW’s 0.911. DDA-SKF also has an AUPR of 0.533, which is only slightly lower than that of BNNR. Therefore, we believe that DDA-SKF has a better, or at least comparable, performance to all state-of-the art methods in novel association prediction. The integration of disease and drug similarity kernels is effective.
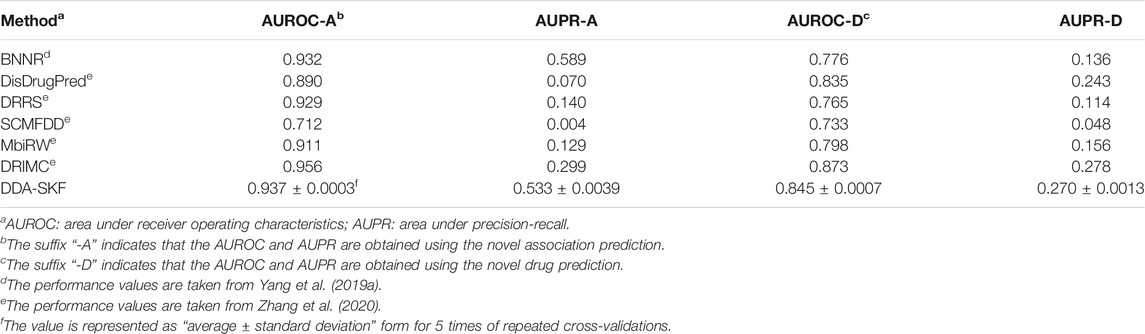
TABLE 1. Performance comparison analysis using both the novel association test and novel drug test.
For the novel drug prediction, we evaluated the performance of all models in the benchmarking dataset. The results are recorded in Table 1. DDA-SKF achieved an AUROC of 0.845, which is 8.892, 1.198, 10.458, 15.280, and 5.890%, respectively, higher than that of BNNR’s 0.776, DisDrugPred’s 0.835, DRRS’s 0.765, SCMFDD’s 0.733, and MBiRW’s 0.798. DDA-SKF also obtained an AUPR of 0.270, which is only slightly lower than that of DRIMC. Therefore, we conclude that DDA-SKF outperformed most state-of-the-art methods in novel drug predictions.
In the comparison with PREDICT, LRSSL, and NTSIM methods, 5-fold cross-validation was applied rather than 10-fold cross-validations, as all three existing methods reported their performances in 5-fold cross validations. According to the results in Table 2, DDA-SKF achieved better performances in almost every comparison. DDA-SKF achieved an AUROC of 0.929 and 0.931 for the PREDICT dataset and LRSSL dataset, which are 0.869 and 3.215% higher than that of the second model NTSIM, respectively. As for AUPR, DDA-SKF achieves an AUPR of 0.497 and 0.382 on the PREDICT dataset and LRSSL dataset, which are the best values among the four. For the F1-score, DDA-SKF achieves 0.504 and 0.427 for the PREDICT dataset and LRSSL dataset, which are 25.373 and 26.331% higher than that of NTSIM, respectively. In summary, DDA-SKF achieved better performances in this comparison.
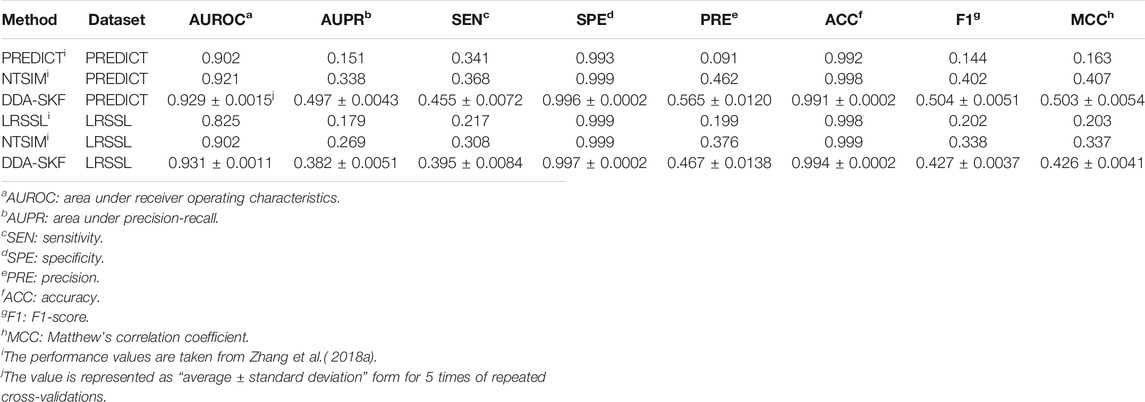
TABLE 2. Performance comparison analysis with PREDICT, NTSIM, and LRSSL.
3.2 Case Study
Although the prediction performances of DDA-SKF in terms of AUROC and AUPR are slightly lower than those of the best method for the novel association prediction and novel drug prediction, our method can work without enough disease similarities. This is useful when the orphan drugs, whose indication is still very limited, are considered.
In this section, the capability of our model in predicting novel drug–disease associations is tested. We performed three tests based on the PREDICT dataset in this part: one is drug-repositioning prediction, the second is orphan drug indications prediction, and the last is complex disease prediction.
To predict novel indications for all drugs, all known drug–disease associations in the benchmarking dataset were used as the training set, and the unknown drug–disease associations were regarded as the candidate set. DDA-SKF was applied to obtain scores for all candidate drug–disease associations. All candidate associations were ranked according to the prediction scores. Top-ranked candidate associations were identified as novel drug–disease associations.
We verified newly predicted associations by comparing them against the Comparative Toxicogenomics Database (CTD) (Davis et al., 2019). CTD contains curated and inferred chemical–disease relationships, which are divided into marker/mechanism and therapeutic. We only compared the therapeutic relationships for verification. For each of the 593 drugs, we collected the top-5 and the top-20 prediction results. The predictions for all drugs were listed in Supplementary Table S1 and Supplementary Table S2 as OMIM IDs in supplementary materials. In the DDA-SKF prediction results, 156 of top-5 and 377 of top-20 predictions have been confirmed by CTD.
We listed several top-5 prediction results in Table 3. Although some top-ranked predictions had not been verified, we believe that these may provide new indications for approved drugs. For example, vincristine for B chronic lymphocytic leukemia (CLL), cisplatin for acute lymphoblastic leukemia (ALL), and methotrexate for neuroblastoma. These articles provide some possible hints that consist of our predictions (Lj et al., 1997; Vilpo et al., 2000; Lau et al., 2015).
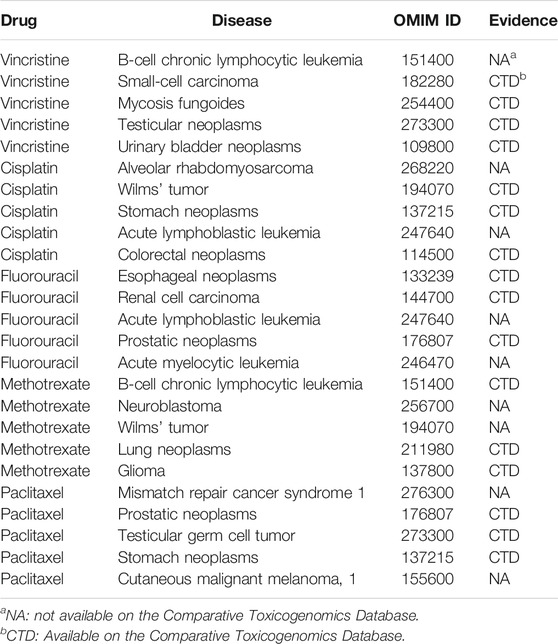
TABLE 3. Top five candidate diseases for typical drugs.
In particular, DDA-SKF can perform drug–disease association prediction without disease similarities. This may be important in studying some orphan drugs. Since the indications of orphan drugs are usually very limited, the similarities between diseases may be misleading. Therefore, by excluding the disease similarities from the model, DDA-SKF should have more potential in finding new indications for orphan drugs, which may eventually decrease the cost of orphan drug utilization.
We selected several orphan drugs from Orphanet (http://www.orpha.net), including celecoxib, methotrexate, and doxorubicin. For each orphan drug, all known drug–disease associations were removed. The orphan drug would have no association information during the process of prediction. We fed the drug similarity kernels with orphan drug information and the aforementioned association matrix to our model. The results of top-20 predictions for each orphan drug were recorded in Supplementary Table S3 in supplementary materials. The top-5 predicted results are summarized in Table 4. These successful prediction instances further confirm that DDA-SKF has the potential to predict novel indications for orphan drugs without disease similarity information.
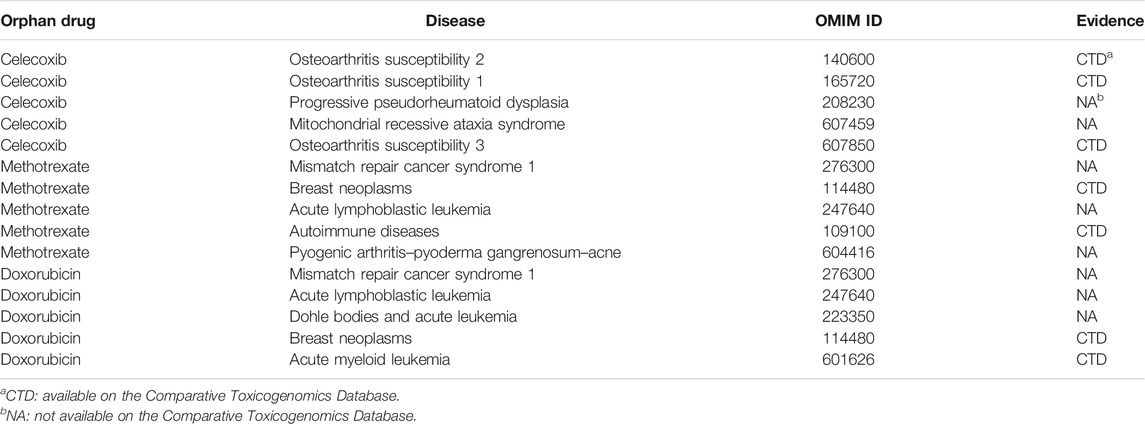
TABLE 4. Top five candidate diseases for typical orphan drugs.
Last, several commonly studied complex diseases were chosen to evaluate DDA-SKF. For instance, Alzheimer’s disease (AD), Parkinson’s disease (PD), and amyotrophic lateral sclerosis (ALS) were considered. We listed the top-5 predicted results in Table 5 along with the literature evidences. For each disease, the uncovered associations will be ranked based on the prediction scores, and the top-ranked unknown associations were identified as the prediction results. The AD and PD results were obtained on the PREDICT dataset, while the ALS results were obtained using the LRSSL dataset. These results indicate that DDA-SKF has the potential to uncover new drugs for these complex diseases.
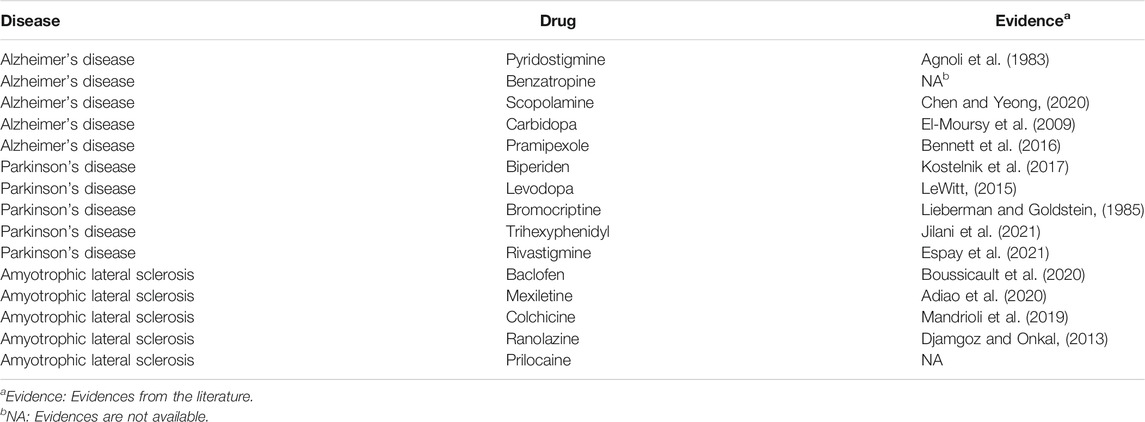
TABLE 5. Top five candidate drugs for complex diseases.
3.3 Comparison With Single Similarity
In this work, different drug similarity kernels were integrated as a drug comprehensive similarity kernel in the drug subspace. Also, different disease similarity kernels were integrated as a disease comprehensive similarity kernel. To demonstrate the effectiveness in integrating multiple similarity kernels, we calculated the values of AUROC and AUPR with every single similarity kernel on the PREDICT dataset. The results are shown in Figure 2 and Figure 3. We also compared the effectiveness of the multiple similarity kernels fusion and all single similarity kernels. The results are recorded in Table 6. We can see that the comprehensive kernel produced higher performances than every single kernel.
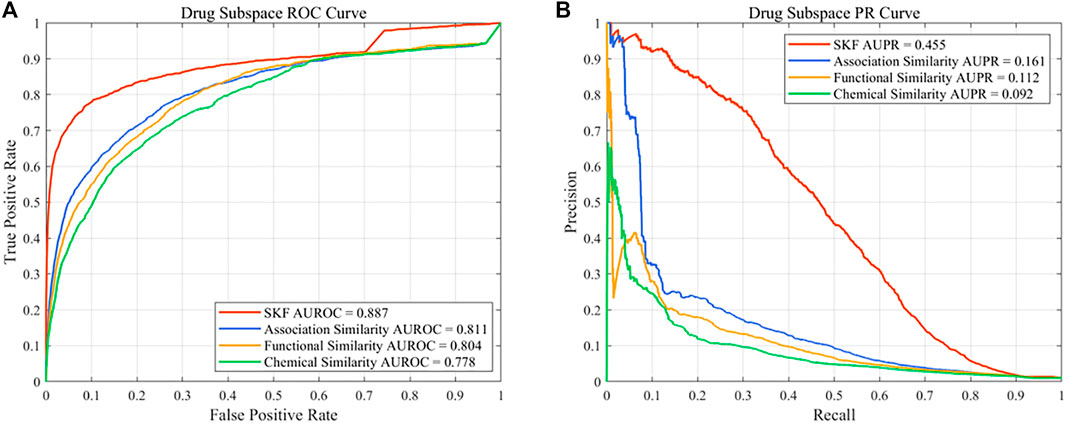
FIGURE 2. Performance of the single similarity and SKF in the drug subspace of the PREDICT dataset. (A) ROC curve and (B) PR curve.
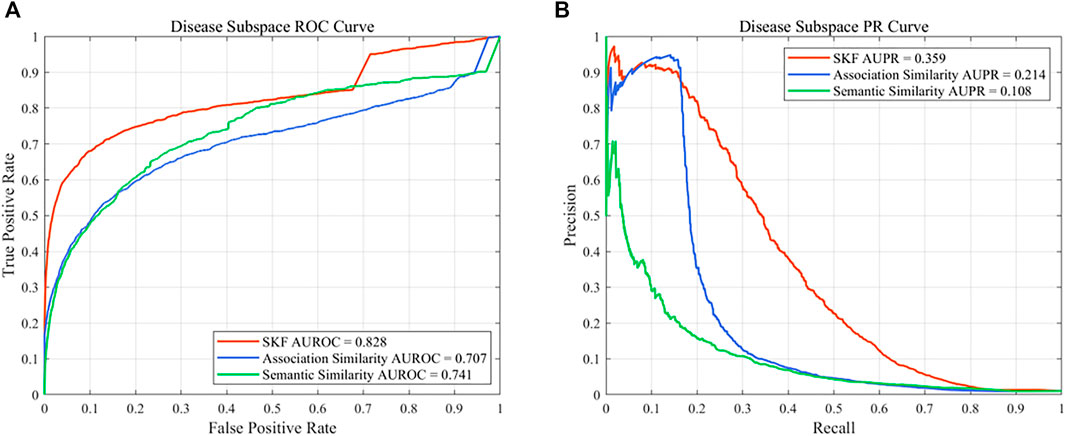
FIGURE 3. Performance of the single similarity and SKF in the disease subspace of the PREDICT dataset. (A) ROC curve and (B) PR curve.
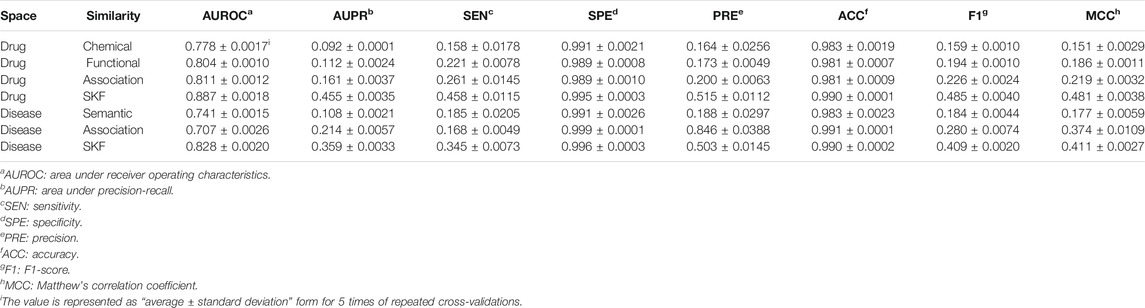
TABLE 6. Performance comparison between the multiple similarity fusion and every single similarity.
4 Conclusion
In this study, we proposed DDA-SKF (drug–disease associations prediction based on the similarity kernels fusion) for predicting drug–disease associations. Several similarity kernels of drugs and diseases were integrated. The SKF method has a better, or at least comparable, performance than the existing methods, in terms of AUROC and AUPR. The novel drug prediction test indicated that DDA-SKF can identify potential indications of approved drugs, which may be useful in drug repositioning. The DDA-SKF can also make predictions without disease similarity. This allows it to be applied on orphan drugs, which is useful in exploring potential indications of such drugs. The evaluation on several complex diseases illustrates that our method can provide valuable information and potential indications for clinical studies. However, it should be noted that there is still a room for further improvement. One is to integrate similarities from more biological knowledge, and the other is to integrate information of the drug-target information. Due to the limited time and resources of this study, these works will be conducted in future.
Data Availability Statement
Publicly available datasets were analyzed in this study. These data can be found here: https://github.com/GCQ2119216031/DDA-SKF.
Author Contributions
C-QG collected the data, implemented the algorithm, performed the experiments, analyzed the results, and partially wrote the manuscript; Y-KZ designed the algorithm and analyzed the results; X-HX analyzed the results and partially wrote the manuscript; HM partially collected the data and partially analyzed the results; P-FD directed the whole study, conceptualized the algorithm, supervised the experiments, analyzed the results, and wrote the manuscript.
Funding
This work was supported by the National Natural Science Foundation of China (No. NSFC 61872268) and National Key R&D Program of China (No. 2018YFC0910405).
Conflict of Interest
The authors declare that the research was conducted in the absence of any commercial or financial relationships that could be construed as a potential conflict of interest.
Publisher’s Note
All claims expressed in this article are solely those of the authors and do not necessarily represent those of their affiliated organizations, or those of the publisher, the editors, and the reviewers. Any product that may be evaluated in this article, or claim that may be made by its manufacturer, is not guaranteed or endorsed by the publisher.
Supplementary Material
The Supplementary Material for this article can be found online at: https://www.frontiersin.org/articles/10.3389/fphar.2021.784171/full#supplementary-material
References
Agnoli, A., Martucci, N., Manna, V., Conti, L., and Fioravanti, M. (1983). Effect of Cholinergic and Anticholinergic Drugs on Short-Term Memory in Alzheimer's Dementia: a Neuropsychological and Computerized Electroencephalographic Study. Clin. Neuropharmacol 6, 311–323. doi:10.1097/00002826-198312000-00005
Ashburn, T. T., and Thor, K. B. (2004). Drug Repositioning: Identifying and Developing New Uses for Existing Drugs. Nat. Rev. Drug Discov. 3, 673–683. doi:10.1038/nrd1468
Attwood, M. M., Rask-Andersen, M., and Schiöth, H. B. (2018). Orphan Drugs and Their Impact on Pharmaceutical Development. Trends Pharmacol. Sci. 39, 1077–1535. doi:10.1016/j.tips.2018.03.003
B Adiao, K. J., I Espiritu, A., and C Bagnas, M. A. (2020). Efficacy and Safety of Mexiletine in Amyotrophic Lateral Sclerosis: a Systematic Review of Randomized Controlled Trials. Neurodegener Dis. Manag. 10, 397–407. doi:10.2217/nmt-2020-0026
Bennett, J., Burns, J., Welch, P., and Bothwell, R. (2016). Safety and Tolerability of R(+) Pramipexole in Mild-To-Moderate Alzheimer's Disease. J. Alzheimers Dis. 49, 1179–1187. doi:10.3233/JAD-150788
Boussicault, L., Laffaire, J., Schmitt, P., Rinaudo, P., Callizot, N., Nabirotchkin, S., et al. (2020). Combination of Acamprosate and Baclofen (PXT864) as a Potential New Therapy for Amyotrophic Lateral Sclerosis. J. Neurosci. Res. 98, 2435–2450. doi:10.1002/jnr.24714
Chen, W. N., and Yeong, K. Y. (2020). Scopolamine, a Toxin-Induced Experimental Model, Used for Research in Alzheimer's Disease. CNS Neurol. Disord. Drug Targets 19, 85–93. doi:10.2174/1871527319666200214104331
Chong, C. R., and Sullivan, D. J. (2007). New Uses for Old Drugs. Nature 448, 645–646. doi:10.1038/448645a
Davis, A. P., Grondin, C. J., Johnson, R. J., Sciaky, D., McMorran, R., Wiegers, J., et al. (2019). The Comparative Toxicogenomics Database: Update 2019. Nucleic Acids Res. 47, D948–D954. doi:10.1093/nar/gky868
Davis, J., and Goadrich, M. (2006). “The Relationship between Precision-Recall and ROC Curves,” in Proceedings Of the 23rd International Conference on Machine Learning ICML ’06 (New York, NY, USA: Association for Computing Machinery), 233–240. doi:10.1145/1143844.1143874
Djamgoz, M. B., and Onkal, R. (2013). Persistent Current Blockers of Voltage-Gated Sodium Channels: a Clinical Opportunity for Controlling Metastatic Disease. Recent Pat Anticancer Drug Discov. 8, 66–84. doi:10.2174/15748928130107
El-Moursy, S. A., Shawky, H. M., Abdel Wahab, Z., and Rashed, L. (2009). The Effect of Memantine and Levodopa/carbidopa on the Responses of Phrenic Nerve-Diaphragm Preparations from Aged Rats. Med. Sci. Monit. 15, BR339–48.
Espay, A. J., Marsili, L., Mahajan, A., Sturchio, A., Pathan, R., Pilotto, A., et al. (2021). Rivastigmine in Parkinson's Disease Dementia with Orthostatic Hypotension. Ann. Neurol. 89, 91–98. doi:10.1002/ana.25923
Gordon, L. B., Shappell, H., Massaro, J., D'Agostino, R. B., Brazier, J., Campbell, S. E., et al. (2018). Association of Lonafarnib Treatment vs No Treatment with Mortality Rate in Patients with Hutchinson-Gilford Progeria Syndrome. JAMA 319, 1687–1695. doi:10.1001/jama.2018.3264
Gottlieb, A., Stein, G. Y., Ruppin, E., and Sharan, R. (2011). PREDICT: a Method for Inferring Novel Drug Indications with Application to Personalized Medicine. Mol. Syst. Biol. 7, 496. doi:10.1038/msb.2011.26
Hamosh, A., Scott, A. F., Amberger, J. S., Bocchini, C. A., and McKusick, V. A. (2005). Online Mendelian Inheritance in Man (OMIM), a Knowledgebase of Human Genes and Genetic Disorders. Nucleic Acids Res. 33, D514–D517. doi:10.1093/nar/gki033
Harari, S. (2016). Why We Should Care about Ultra-rare Disease. Eur. Respir. Rev. 25, 101–103. doi:10.1183/16000617.0017-2016
Jiang, H. J., You, Z. H., and Huang, Y. A. (2019). Predicting Drug-Disease Associations via Sigmoid Kernel-Based Convolutional Neural Networks. J. Transl Med. 17, 382. doi:10.1186/s12967-019-2127-5
Jiao, Y., and Du, P. (2016). Performance Measures in Evaluating Machine Learning Based Bioinformatics Predictors for Classifications. Quant Biol. 4, 320–330. doi:10.1007/s40484-016-0081-2
Jilani, T. N., Sabir, S., and Sharma, S. (2021). “Trihexyphenidyl,” in StatPearls (Treasure Island (FL): StatPearls Publishing). Available at: http://www.ncbi.nlm.nih.gov/books/NBK519488/(Accessed November 16, 2021).
Kola, I., and Landis, J. (2004). Can the Pharmaceutical Industry Reduce Attrition Rates? Nat. Rev. Drug Discov. 3, 711–715. doi:10.1038/nrd1470
Kostelnik, A., Cegan, A., and Pohanka, M. (2017). Anti-Parkinson Drug Biperiden Inhibits Enzyme Acetylcholinesterase. Available at: https://pubmed.ncbi.nlm.nih.gov/28785576/(Accessed November 16, 2021).
Kurolap, A., Eshach Adiv, O., Hershkovitz, T., Tabib, A., Karbian, N., Paperna, T., et al. (2019). Eculizumab Is Safe and Effective as a Long-Term Treatment for Protein-Losing Enteropathy Due to CD55 Deficiency. J. Pediatr. Gastroenterol. Nutr. 68, 325–333. doi:10.1097/MPG.0000000000002198
Lau, D. T., Flemming, C. L., Gherardi, S., Perini, G., Oberthuer, A., Fischer, M., et al. (2015). MYCN Amplification Confers Enhanced Folate Dependence and Methotrexate Sensitivity in Neuroblastoma. Oncotarget 6, 15510–15523. doi:10.18632/oncotarget.3732
LeWitt, P. A. (2015). Levodopa Therapy for Parkinson's Disease: Pharmacokinetics and Pharmacodynamics. Mov Disord. 30, 64–72. doi:10.1002/mds.26082
Li, J., Zheng, S., Chen, B., Butte, A. J., Swamidass, S. J., and Lu, Z. (2016). A Survey of Current Trends in Computational Drug Repositioning. Brief Bioinform 17, 2–12. doi:10.1093/bib/bbv020
Liang, X., Zhang, P., Yan, L., Fu, Y., Peng, F., Qu, L., et al. (2017). LRSSL: Predict and Interpret Drug-Disease Associations Based on Data Integration Using Sparse Subspace Learning. Bioinformatics 33, 1187–1196. doi:10.1093/bioinformatics/btw770
Lieberman, A. N., and Goldstein, M. (1985). Bromocriptine in Parkinson Disease. Pharmacol. Rev. 37, 217–227.
Lj, E., P, I., Ps, G., Ag, E., W, L.-M., and Md, K. (1997). A Phase II Study of Carboplatin as a Treatment for Children with Acute Leukemia Recurring in Bone Marrow: a Report of the Children’s Cancer Group. Cancer 80. Available at: https://pubmed.ncbi.nlm.nih.gov/9217045/(Accessed September 25, 2021).
Luo, H., Li, M., Wang, S., Liu, Q., Li, Y., and Wang, J. (2018). Computational Drug Repositioning Using Low-Rank Matrix Approximation and Randomized Algorithms. Bioinformatics 34, 1904–1912. doi:10.1093/bioinformatics/bty013
Luo, H., Wang, J., Li, M., Luo, J., Peng, X., Wu, F. X., et al. (2016). Drug Repositioning Based on Comprehensive Similarity Measures and Bi-random Walk Algorithm. Bioinformatics 32, 2664–2671. doi:10.1093/bioinformatics/btw228
Mandrioli, J., Crippa, V., Cereda, C., Bonetto, V., Zucchi, E., Gessani, A., et al. (2019). Proteostasis and ALS: Protocol for a Phase II, Randomised, Double-Blind, Placebo-Controlled, Multicentre Clinical Trial for Colchicine in ALS (Co-ALS). BMJ Open 9, e028486. doi:10.1136/bmjopen-2018-028486
Mullard, A. (2017). 2016 FDA Drug Approvals. Nat. Rev. Drug Discov. 16, 73–76. doi:10.1038/nrd.2017.14
Mullard, A. (2018). 2017 FDA Drug Approvals. Nat. Rev. Drug Discov. 17, 81–85. doi:10.1038/nrd.2018.4
Mullard, A. (2019). 2018 FDA Drug Approvals. Nat. Rev. Drug Discov. 18, 85–89. doi:10.1038/d41573-019-00014-x
Mullard, A. (2020). 2019 FDA Drug Approvals. Nat. Rev. Drug Discov. 19, 79–84. doi:10.1038/d41573-020-00001-7
Mullard, A. (2021). 2020 FDA Drug Approvals. Nat. Rev. Drug Discov. 20, 85–90. doi:10.1038/d41573-021-00002-0
Munos, B. (2009). Lessons from 60 Years of Pharmaceutical Innovation. Nat. Rev. Drug Discov. 8, 959–968. doi:10.1038/nrd2961
Pammolli, F., Magazzini, L., and Riccaboni, M. (2011). The Productivity Crisis in Pharmaceutical R&D. Nat. Rev. Drug Discov. 10, 428–438. doi:10.1038/nrd3405
Parvathaneni, V., Kulkarni, N. S., Muth, A., and Gupta, V. (2019). Drug Repurposing: a Promising Tool to Accelerate the Drug Discovery Process. Drug Discov. Today 24, 2076–2085. doi:10.1016/j.drudis.2019.06.014
Paul, S. M., Mytelka, D. S., Dunwiddie, C. T., Persinger, C. C., Munos, B. H., Lindborg, S. R., et al. (2010). How to Improve R&D Productivity: the Pharmaceutical Industry's Grand challenge. Nat. Rev. Drug Discov. 9, 203–214. doi:10.1038/nrd3078
Pushpakom, S., Iorio, F., Eyers, P. A., Escott, K. J., Hopper, S., Wells, A., et al. (2019). Drug Repurposing: Progress, Challenges and Recommendations. Nat. Rev. Drug Discov. 18, 41–58. doi:10.1038/nrd.2018.168
Saito, T., and Rehmsmeier, M. (2015). The Precision-Recall Plot Is More Informative Than the ROC Plot when Evaluating Binary Classifiers on Imbalanced Datasets. PLOS ONE 10, e0118432. doi:10.1371/journal.pone.0118432
Scherman, D., and Fetro, C. (2020). Drug Repositioning for Rare Diseases: Knowledge-Based success Stories. Therapie 75, 161–167. doi:10.1016/j.therap.2020.02.007
Schuhmacher, A., Gassmann, O., and Hinder, M. (2016). Changing R&D Models in Research-Based Pharmaceutical Companies. J. Transl Med. 14, 105. doi:10.1186/s12967-016-0838-4
Soignet, S. L., Maslak, P., Wang, Z. G., Jhanwar, S., Calleja, E., Dardashti, L. J., et al. (1998). Complete Remission after Treatment of Acute Promyelocytic Leukemia with Arsenic Trioxide. N. Engl. J. Med. 339, 1341–1348. doi:10.1056/NEJM199811053391901
Swanson, D. R. (1990). Medical Literature as a Potential Source of New Knowledge. Bull. Med. Libr. Assoc. 78, 29–37.
van Driel, M. A., Bruggeman, J., Vriend, G., Brunner, H. G., and Leunissen, J. A. (2006). A Text-Mining Analysis of the Human Phenome. Eur. J. Hum. Genet. 14, 535–542. doi:10.1038/sj.ejhg.5201585
Vilpo, J. A., Koski, T., and Vilpo, L. M. (2000). Selective Toxicity of Vincristine against Chronic Lymphocytic Leukemia Cells In Vitro. Eur. J. Haematol. 65, 370–378. doi:10.1034/j.1600-0609.2000.065006370.x
Wastfelt, M., Fadeel, B., and Henter, J.-I. (2006). A Journey of hope: Lessons Learned from Studies on Rare Diseases and Orphan Drugs. J. Intern. Med. 260, 1–10. doi:10.1111/j.1365-2796.2006.01666.x
Weng, L., Zhang, L., Peng, Y., and Huang, R. S. (2013). Pharmacogenetics and Pharmacogenomics: a Bridge to Individualized Cancer Therapy. Pharmacogenomics 14, 315–324. doi:10.2217/pgs.12.213
Wishart, D. S., Feunang, Y. D., Guo, A. C., Lo, E. J., Marcu, A., Grant, J. R., et al. (2018). DrugBank 5.0: a Major Update to the DrugBank Database for 2018. Nucleic Acids Res. 46, D1074–D1082. doi:10.1093/nar/gkx1037
Xia, Z., Wu, L. Y., Zhou, X., and Wong, S. T. (2010). Semi-supervised Drug-Protein Interaction Prediction from Heterogeneous Biological Spaces. BMC Syst. Biol. 4, S6. doi:10.1186/1752-0509-4-S2-S6
Xuan, P., Cao, Y., Zhang, T., Wang, X., Pan, S., and Shen, T. (2019). Drug Repositioning through Integration of Prior Knowledge and Projections of Drugs and Diseases. Bioinformatics 35, 4108–4119. doi:10.1093/bioinformatics/btz182
Yan, C. K., Wang, W. X., Zhang, G., Wang, J. L., and Patel, A. (2019). BiRWDDA: A Novel Drug Repositioning Method Based on Multisimilarity Fusion. J. Comput. Biol. 26, 1230–1242. doi:10.1089/cmb.2019.0063
Yang, M., Luo, H., Li, Y., and Wang, J. (2019a). Drug Repositioning Based on Bounded Nuclear Norm Regularization. Bioinformatics 35, i455–i463. doi:10.1093/bioinformatics/btz331
Yang, M., Luo, H., Li, Y., Wu, F. X., and Wang, J. (2019b). Overlap Matrix Completion for Predicting Drug-Associated Indications. Plos Comput. Biol. 15, e1007541. doi:10.1371/journal.pcbi.1007541
Yap, C. W. (2011). PaDEL-descriptor: an Open Source Software to Calculate Molecular Descriptors and Fingerprints. J. Comput. Chem. 32, 1466–1474. doi:10.1002/jcc.21707
Yu, Z., Huang, F., Zhao, X., Xiao, W., and Zhang, W. (2021). Predicting Drug-Disease Associations through Layer Attention Graph Convolutional Network. Brief Bioinform 22, bbaa243. doi:10.1093/bib/bbaa243
Zhang, W., Xu, H., Li, X., Gao, Q., and Wang, L. (2020). DRIMC: an Improved Drug Repositioning Approach Using Bayesian Inductive Matrix Completion. Bioinformatics 36, 2839–2847. doi:10.1093/bioinformatics/btaa062
Zhang, W., Yue, X., Huang, F., Liu, R., Chen, Y., and Ruan, C. (2018a). Predicting Drug-Disease Associations and Their Therapeutic Function Based on the Drug-Disease Association Bipartite Network. Methods 145, 51–59. doi:10.1016/j.ymeth.2018.06.001
Keywords: drug repositioning, drug–disease association, similarity kernel fusion, Laplacian regularized least squares, orphan drugs
Citation: Gao C-Q, Zhou Y-K, Xin X-H, Min H and Du P-F (2022) DDA-SKF: Predicting Drug–Disease Associations Using Similarity Kernel Fusion. Front. Pharmacol. 12:784171. doi: 10.3389/fphar.2021.784171
Received: 27 September 2021; Accepted: 20 December 2021;
Published: 13 January 2022.
Edited by:
FangXiang Wu, University of Saskatchewan, CanadaReviewed by:
Marcus Scotti, Federal University of Paraíba, BrazilWen Zhang, Huazhong Agricultural University, China
Copyright © 2022 Gao, Zhou, Xin, Min and Du. This is an open-access article distributed under the terms of the Creative Commons Attribution License (CC BY). The use, distribution or reproduction in other forums is permitted, provided the original author(s) and the copyright owner(s) are credited and that the original publication in this journal is cited, in accordance with accepted academic practice. No use, distribution or reproduction is permitted which does not comply with these terms.
*Correspondence: Pu-Feng Du, cGR1QHRqdS5lZHUuY24=