 Xipei Wang1,2†
 Yijin Wu3†
 Jinsong Huang3Songgui Shan4
 Mingjie Mai3Jiade Zhu3
 Min Yang2
 Dewei Shang5
 Zheng Wu6
 Jinhua Lan6
 Shilong Zhong4,7
 Min Wu3*
- 1Research Center of Medical Sciences, Guangdong Provincial People’s Hospital, Guangdong Academy of Medical Sciences, Guangzhou, China
- 2Guangdong Provincial Key Laboratory of Clinical Pharmacology, Guangdong Cardiovascular Institute, Guangdong Provincial People’s Hospital, Guangdong Academy of Medical Sciences, Guangzhou, China
- 3Department of Cardiac Surgery, Guangdong Cardiovascular Institute, Guangdong Provincial People’s Hospital, Guangdong Academy of Medical Sciences, Guangzhou, China
- 4Department of Pharmacy, Guangdong Provincial People’s Hospital, Guangdong Academy of Medical Sciences, Guangzhou, China
- 5Department of Pharmacy, The Affiliated Brain Hospital of Guangzhou Medical University, Guangzhou, China
- 6School of Biology and Biological Engineering, South China University of Technology, Guangzhou, China
- 7Guangdong Provincial Key Laboratory of Coronary Heart Disease Prevention, Guangdong Cardiovascular Institute, Guangzhou, China
Purpose: The aim of this study is i) to establish a strategy to estimate the area under the curve of the dosing interval (AUC0–12h) of mycophenolic acid (MPA) in the heart transplant recipients and ii) to find the covariates that significantly affect the pharmacokinetics of MPA exposure.
Methods: This single-center, prospective, open-label, observational study was conducted in 91 adult heart transplant recipients orally taking mycophenolate mofetil dispersible tablets. Samples collected intensively and sparsely were analyzed by the enzyme-multiplied immunoassay technique, and all the data were used in PPK modeling. Potential covariates were tested stepwise. The goodness-of-fit plots, the normalized prediction distribution error, and prediction-corrected visual predictive check were used for model evaluation. Optimal sampling times by ED-optimal strategy and multilinear regression (MLR) were analyzed based on the simulated data by the final PPK model. Moreover, using intensive data from 14 patients, the accuracy of AUC0–12h estimation was evaluated by Passing–Bablok regression analysis and Bland–Alman plots for both the PPK model and MLR equation.
Results: A two-compartment model with first-order absorption and elimination with a lag time was chosen as the structure model. Co-medication of proton pump inhibitors (PPIs), estimated glomerular filtration rate (eGFR), and albumin (ALB) were found to significantly affect bioavailability (F), clearance of central compartment (CL/F), and the distribution volume of the central compartment (V2/F), respectively. Co-medication of PPIs decreased F by 27.6%. When eGFR decreased by 30 ml/min/1.73 m2, CL/F decreased by 23.7%. However, the impact of ALB on V2/F was limited to MPA exposure. The final model showed an adequate fitness of the data. The optimal sampling design was pre-dose and 1 and 4 h post-dose for pharmacokinetic estimation. The best-fit linear equation was finally established as follows: AUC0–12h = 3.539 × C0 + 0.288 × C0.5 + 1.349 × C1 + 6.773 × C4.5.
Conclusion: A PPK model was established with three covariates in heart transplant patients. Co-medication of PPIs and eGFR had a remarkable impact on AUC0–12h of MPA. A linear equation was also concluded with four time points as an alternative way to estimate AUC0–12h for MPA.
Introduction
Mycophenolic acid (MPA) is the active metabolite of the prodrug mycophenolate mofetil (MMF), with a high oral bioavailability (95%) (Bullingham et al., 1996). MPA selectively inhibits inosine monophosphate dehydrogenase in de novo purine synthesis in T and B lymphocytes. As an antimetabolite drug, MPA is one of the most commonly prescribed drugs in immunosuppression therapy to prevent graft rejection after kidney, lung, liver, and heart transplantation (Bergan et al., 2021). It has a protein binding rate of about 97% and is mainly metabolized by uridine diphosphate glucuronosyltransferase (UGT) into the inactive 7-O-glucuronide (MPAG) metabolite (Bullingham et al., 1998). It exhibits enterohepatic circulation (EHC) during which MPAG returns to the small intestine and is degraded into MPA by microorganisms, and MPA is re-absorbed into the circulatory system. MPA is eliminated through the kidneys mainly as MPAG (Bergan et al., 2021). Adequate MPA exposure could effectively prevent graft rejection, while oversuppression may increase the cancer risk in organ transplant recipients (Huo et al., 2020). The area under the curve of the dosing interval (AUC0–12h) of MPA is considered a reliable biomarker for graft rejection (Tett et al., 2011). It was reported that AUC0–12h values below 36 mg h /L were related to heart transplantation rejection (Dösch et al., 2006; Figurski et al., 2012). However, the method to directly calculate AUC0–12h needs intensive sample collection, which is difficult to implement in clinical application.
Previously, the methods used to estimate the MPA AUC0–12h in heart transplant recipients were investigated, including limited sampling strategies with multiple linear regression (MLR), population pharmacokinetic (PPK), and machine learning (ML) approaches (Bergan et al., 2021; Woillard et al., 2021). MLR was used in the estimation of MPA AUC0–12h in several published studies in heart transplant recipients (Ting et al., 2008; Baraldo et al., 2009; Pawinski et al., 2009). The linear equations were convenient to use but with different sampling time points and large variability between studies. Most importantly, there were systematic errors between the bioanalysis methods of MPA concentrations. The measurements by the enzyme-multiplied immunoassay technique (EMIT) were higher than those by high-performance liquid chromatography (HPLC), with a positive bias over 24% (Kunicki et al., 2015; Bergan et al., 2021). Based on the HPLC-measured MPA concentrations from Chinese adult heart transplant recipients, a four timepoint linear model (0.5, 2, 4, and 6 h post-dose) was generated (Xiang et al., 2021). However, it could not be applied to the MPA concentrations measured by the EMIT for the systematic errors, which was not negligible. Moreover, fixed sampling time points in the linear model made it difficult to deal with clinically variable situations, such as missing data and collection time deviation.
PPK modeling is more flexible for sample collection and has been widely used in the estimation of MPA AUC0–12h in lung, liver, and kidney transplantations (Kiang and Ensom, 2018). However, PPK studies in heart transplant recipients are limited. A website platform (ISBA 3.0) provides MPA AUC0–12h estimation in Caucasian patients by a Bayesian approach based on three samples (https://abis.chu-limoges.fr/). A previously published study based on the PPK approach using both parametric and nonparametric methods resulted in an equally accurate estimation of AUC0–12h (Woillard et al., 2015). However, no covariate was previously found in the heart transplant recipients. The main factors that influence the pharmacokinetics of MPA were important for personalized therapy. ML models built based on a large pooled dataset from organ transplant recipients and patients with autoimmune disease treated with various immunosuppressant co-medications [such as cyclosporine and tacrolimus (TAC)] yielded better performances in AUC0–12h estimation than the Bayesian approach. However, it was not built on a biological basis, and it was even less flexible than the PPK approach with respect to the number of samples and sampling time points (Woillard et al., 2021). Both linear regression and PPK modeling have their advantages in clinical application. Linear equations are easy to use and popularize. PPK features fewer sampling limitations, and its application in clinical practice is flexible. However, no study provided a systematic strategy to adapt to clinical variability using both linear regression and a PPK approach.
The aim of the present study was i) to establish a systematic strategy for MPA AUC0–12h estimation and ii) to investigate the impact of the main factors on the MPA AUC0–12h in Chinese adult heart transplant recipients. This gives a reference to the doctors for the selection of a convenient and accurate method for MPA AUC0–12h estimation, taking into account key factors when making dose adjustments.
Materials and Methods
Study Design and Patients
This was a single-center, prospective, open-label, observational study. The entire study design is shown in Figure 1. Patients were aged ≥18 years and underwent their first heart transplantation surgery at Guangdong Provincial People’s Hospital and received triple maintenance immunosuppressive therapy comprising MMF, TAC, and corticosteroids. Patients undergoing combined organ transplantation were excluded. The study protocols were approved by the Research Ethics Committee of Guangdong Provincial People’s Hospital [2018478H (R1)], and all participants provided written informed consent before inclusion. The study protocol was registered in the Chinese Clinical Trial Registry (No. ChiCTR2000030903). Volunteers were the sole source of transplants in the current study. There were no executed donors in the current study. Generally, in China, doctors select heart donors under the age of 50. The mean age of the donors in the present study was 35.1 ± 9.4 years, and six donors were females. The donor cause of death was trauma, cerebrovascular accident, brain tumor, or hypoxic brain injury.
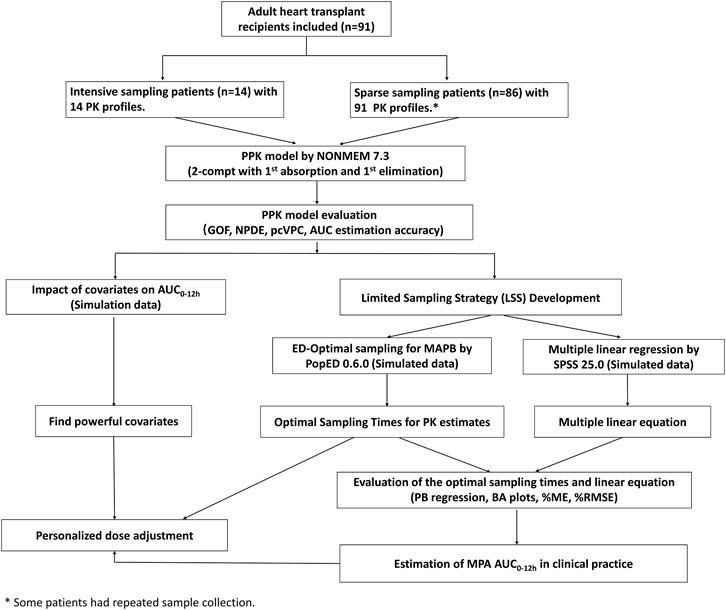
FIGURE 1. Flowchart of the study. PPK, population pharmacokinetic; AUC0–12h, the area under the curve of the dosing interval; MPA, mycophenolic acid; GOF, goodness-of-fit; NPDE, normalized prediction distribution error; pcVPC, prediction-corrected visual predictive check; MAPB, maximum a posteriori Bayesian; PB regression, Passing–Bablok regression; BA plot, Bland-Altman plot; %ME, mean error in percentage; and %RMSE, percent root mean squared error.
MMF dispersible tablets (Cycopin®, manufactured by Huadong Medicine Co., Ltd.) were orally administered at a maintenance dose of 250–750 mg twice daily (bid). TAC (Prograf®) was dosed at 0.5–4 mg once or twice a day after transplantation and therapeutic drug monitoring was conducted to achieve the target concentration. Methylprednisolone (20 mg) was administered during the operation and was switched to 8 mg in the following days. Sample collection for the measurement of MPA concentrations started at least 7 days post-operation. Full pharmacokinetic profiles were obtained by intensive sampling, drawing 10 blood samples: pre-dose, 0.5, 1, 1.5, 2, 3, 4, 6, 8, and 12 h after the morning dose. For sparse sample collection, blood samples were drawn at 0.5, 1.5, 4, and 9 h post-dose after the morning dose. More than one pharmacokinetic sampling cycle might be collected in one patient.
Patient information was collected during sample collection from the medical electronic records, including demographic information, biochemical indices, concomitant medications, TAC concentrations and daily dose, and postoperative time (POT). Proton pump inhibitors (PPIs) included omeprazole injections or gastro-resistant tablets and pantoprazole injections or enteric-coated tablets.
Sample Collection and Bioanalytical Assay
Blood samples were collected in EDTA-coated tubes and centrifuged at room temperature (2,000 × g for 10 min) to separate plasma, which was analyzed within 24 h after collection. MPA concentrations were detected by the EMIT using MPA kits on the Viva-E system (Siemens Healthcare Diagnostics, Newark, Del, United States) according to the manufacturer’s guidelines. The linear range of MPA concentrations was 0.1–15 mg/L. The lower limit of quantification (LLOQ) was 0.1 mg/L. At the control levels of 1, 7.5, and 12 mg/L, the precisions were 5–6%, 3.1–4.5%, and 4.3–6.5%, respectively.
Pharmacokinetic Modeling
The intensive and sparse concentration data were pooled and simultaneously fitted using a nonlinear mixed-effects modeling software program (NONMEM, version 7.3.0, ICON Development Solutions, MD, United States). The units of MMF doses and MPA concentrations were unified as moles by multiplying the molecular weights. The first-order conditional estimation with interaction (FOCEI) method was used throughout the entire model-building process. One- or two-compartment models with time-lagged first-order absorption and first-order elimination or a two-compartment model with EHC were tried as the structure model. Oral bioavailability (F) was fixed as 0.95 as in Bullingham et al. (1996) and Armstrong et al. (2005). Inter-individual variability (IIV) of each PK parameter was modeled using the following exponential error model:
where Pi represents the PK parameter of the ith individual, Ptv represents the typical population value, and ηi is the inter-individual random effect with mean 0 and variance ω2. The covariance between IIV values was estimated using a variance–covariance matrix.
The influence of covariates, including sex, age, body weight (WT), height (HT), body mass index (BMI), hemoglobin (HGB), hematocrit (HCT), serum creatinine (Scr), serum albumin (ALB), total protein (TP), blood urea nitrogen (BUN), uric acid (URIC), total bilirubin (TBIL), direct bilirubin (DBIL), diuretic co-medication (1 for yes/0 for no), PPI co-medication (1 for yes/0 for no), and TAC daily dose and trough concentrations on the main pharmacokinetic parameters was evaluated. The estimated glomerular filtration rate (eGFR) was calculated by the Modification of Diet in Renal Disease (MDRD) equation (modified for Chinese): eGFR = 175 × (Scr)−1.234 × (Age)−0.179 × (0.79 if female) (Ma et al., 2006). Discrete covariates (such as sex and co-medication of PPIs) were modeled as follows:
Here, COVi represents the discrete covariate value of the ith individual as a binary variable (1 or 0) and Θ represents the factor of the covariate.
For continuous covariates (such as WT and ALB), an exponential or linear model with average covariate values and an adjusting factor were tried as follows:
Here, COVi represents the continuous covariate value of the ith individual, COVave represents the average values of the covariates, and Θ represents the factor of the covariate.
The objective function value (OFV) and goodness-of-fit (GOF) plots were used as the criteria for model selection. For forward inclusion, it was considered significant if the OFV decreased more than 6.63 (chi-squared distribution, d = 1, p < 0.01). Backward exclusion had a stricter criterion of increase in the OFV, that is, OFV >10.83 (chi-squared distribution, d = 1, p < 0.001).
PPK Model Evaluation
The adequacy of the final model was assessed using GOF plots, the normalized prediction distribution error (NPDE) and prediction-corrected visual predictive check (pcVPC). 1,000 bootstraps for the 95% confidence intervals (CIs) of the parameters (n = 1,000 times) were conducted in Perl-speaks-NONMEM (PsN) version 4.9.0 (psn.sourceforge.net, Uppsala University, Sweden) (Lindbom and Jonsson, 2004). The GOF plots were generated using R software (version 3.6.3) (R Core Team, 2019). The NPDE analysis and plotting were implemented using the NPDE add-on package (version 2.0) (Scrucca et al., 2016). PcVPC was performed by simulations (n = 1,000) based on the final PPK model using PsN and plotted by R.
The predictive performance of AUC0–12h by the final PPK model was evaluated using intensive data from 14 patients. The AUC0–12h value of MPA based on the intensive concentrations versus the time profile (marked as AUCobs) was calculated directly by the linear trapezoidal rule using the R add-on package PKNCA (version 0.9.2) (Denney et al., 2015). The individual-predicted AUC0–12h (AUCipred) was calculated by the simulated pharmacokinetic profiles with a virtual sampling increment of 0.5 h, using the individual PK parameters estimated by the final PPK model. The bias was expressed as the mean error in percentage (%ME), and precision was evaluated using percent root mean squared error (%RMSE) as in the following equations.
Here, AUCref, i is the AUCobs of the ith patient and AUCpred, i is the AUCipred of the ith patient. Passing–Bablok regression analysis and Bland–Alman plots were used to estimate the relationship between predicted and observed AUC0–12h values using an R add-on package (MethComp 1.30.0) (Carstensen et al., 2020).
Impact of Covariates on MPA Exposure
Simulations were performed on the final PPK model to investigate the impact of the significant covariates on MPA exposure. Full pharmacokinetic profiles at steady-state, with time point increments of 0.5 h during a 12-h dosing interval, were simulated at a virtual dose of 500 mg MMF in 24 scenarios, including eGFR values of 30, 60, 90, and 130 ml/min/1.73 m2, ALB values of 30, 40, and 60 g/L, and with or without PPIs. The eGFR values were used to simulate patients with severe or mild renal impairment, normal renal function, and augmented renal clearance (ARC). The selected ALB value of 30 g/L was used to simulate patients with hypoproteinemia. The AUC0–12h values were calculated by the linear trapezoidal rule based on population-predicted (PRED) values using R.
Limited Sampling Strategy Development
For the limited sampling strategy (LLS), we used two methods: 1) optimal sampling times for Bayesian estimation by ED-optimal sampling and 2) a fixed time-point linear equation using MLR.
For the accurate individual pharmacokinetic estimates, an ED-optimal sampling strategy was applied to optimize the sampling time points using the R package PopED (version 0.6.0) (Nyberg et al., 2012). For the current study, the sampling timepoints were constrained to four within 6 h after drug intake, including pre-dose (0 h). To evaluate the accuracy of AUC0–12h estimation based on the optimal sampling times, we performed simulations to generate 100 virtual patients receiving MMF at an oral dose of 500 mg. The covariate values (i.e., eGFR, ALB, and co-medication of PPIs) were generated using the mean and standard deviation of the original patients. Intensive concentrations of the virtual patients during a dosing interval were generated (as a reference dataset) based on the final PPK model. For the optimal sampling dataset, we assumed that the plasma concentration samples were only collected at the optimal sampling times from the reference dataset. AUC0–12h was calculated with the linear trapezoidal rule using R. AUCref was calculated based on the reference dataset. AUCopt was calculated based on the simulated concentrations by the individual PK parameters estimated by maximum a posteriori Bayesian (MAPB) estimation. We also selected the observed concentrations at the optimal sampling timepointss from the intensive dataset (n = 14) and estimated the individual PK parameters by MAPB. The AUC0–12h value was marked as AUCopt14. Predictive performance was evaluated by comparing the individual reference values with those estimated based on the optimal sampling dataset, respectively, and the %ME and %RMSE calculated by Eqs 5, 6. Here, AUCref, i is AUCref of the ith virtual patient or the AUCobs of the ith intensive sampling patient and AUCpred, i is AUCopt of the ith virtual patient or the AUCopt14 of the ith intensive sampling patient. Passing–Bablok regression analysis and Bland–Alman plots were used to estimate the correlation using R.
For clinical convenience, a fixed time-point linear equation was generated using simulated data based on the original dataset. Using the actual doses and the patients’ pharmacokinetic parameters obtained from the final PPK model, we simulated the complete pharmacokinetic profiles with a time increment of 0.5 h during the dosing interval. The simulated AUC0–12h values were calculated by the linear trapezoidal rule as the reference (marked as AUCipred). With simulated data of each patient, we searched for predictive models of the AUCipred using multiple stepwise linear regression analysis with a limited sampling window ≤6 h post-dose and a maximum number of four samples. Data were analyzed using the software package SPSS 25.0 for Windows (SPSS Inc., Chicago, IL, United States). We considered linear equations with high coefficients (r2) and clinical convenience as acceptable. The variance inflation factor (VIF) was calculated to check for collinearity of the variables, and VIF <10 was preferred. AUC0–12h calculated by the final linear model was marked as AUCMLR. The predictive accuracy was evaluated by comparing the AUCipred to AUCMLR and the AUCobs to AUCMLR, respectively. The %ME and %RMSE were calculated by Eqs 5, 6. In the equations, AUCref, i is AUCipred of the ith patient and AUCpred, i is AUCMLR of the ith patient. To compare with the observed AUC0–12h, AUCref, i is found to be AUCobs of the ith patient from 14 intensive sampling patients and AUCpred, i is AUCMLR of the ith patient. Passing–Bablok regression analysis was performed, and Bland–Alman plots were generated to evaluate the accuracy of the linear equation.
In addition, optimal sampling based on the time-points in the final MLR equation was also evaluated, for there might be missing samples in clinical practice. If it happened, AUC0–12h could also be estimated by MAPB estimation based on the linear sampling times.
Results
Patients’ Characteristics
In total, 508 plasma samples with 507 above LLOQ were obtained from 91 adult heart transplant recipients with 105 pharmacokinetic sampling cycles. Seventy-seven patients had one PK profile, 13 patients had two, and one patient had three PK profiles. The sampling time after operation (POT) was extensive, from 7 days to nearly 3 years. The intensive sampling was collected from 14 patients, and the other data were sparse. The patient characteristics are shown in Table 1. The recipients (seven females) had a median age of 50 (range, 21–74) years and a median bodyweight of 60.0 kg (range, 33.4–95.0 kg). Furthermore, the doses of MMF were in a range of 250–750 mg, co-medicated with TAC dosed from 1 to 8 mg per day.
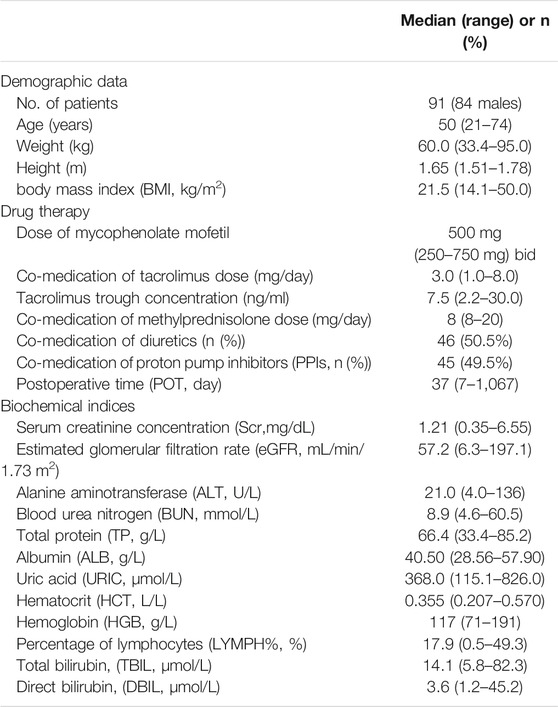
TABLE 1. Demographic characteristics of adult heart transplant recipients for population pharmacokinetic analysis of mycophenolic acid (MPA).
Final PPK Model
MPA plasma concentrations were adequately fitted using the two-compartment model with lag time (TLag) and three covariates in the final model. The combined residual error model resulted in a proportional error of 26.1% and an additive residual error of 0.144 mg/L. The PPK parameter estimates with 95% CIs are shown in Table 2. The impacts of co-medication of PPIs on the bioavailability (F) of eGFR on the clearance of the central compartment (CL/F) and ALB on the volume of the central compartment (V2/F) were significant covariates incorporated in the final PPK model. On the use of PPIs, the F of MPA decreased to 72.4%. The typical value of CL/F was 7.36 L/h. The factor of the eGFR covariate model (θ in Eq. 4) was 0.00791. The inclusion of eGFR explained 11.6% of the IIV of CL/F. With an incremental decrease of 30 ml/min/1.73 m2 of eGFR, CL/F decreased by 23.7%. The impact factor of ALB on V2/F was −7.31 using the exponential covariate model (Eq. 3), which resulted in a 30.8% reduction of IIV of V2/F. The Q/F was estimated as 17.0 L/h, and the V3/F was as large as 560 L with very high IIV (189.5%). The model-building process is shown in Supplementary Table S1.
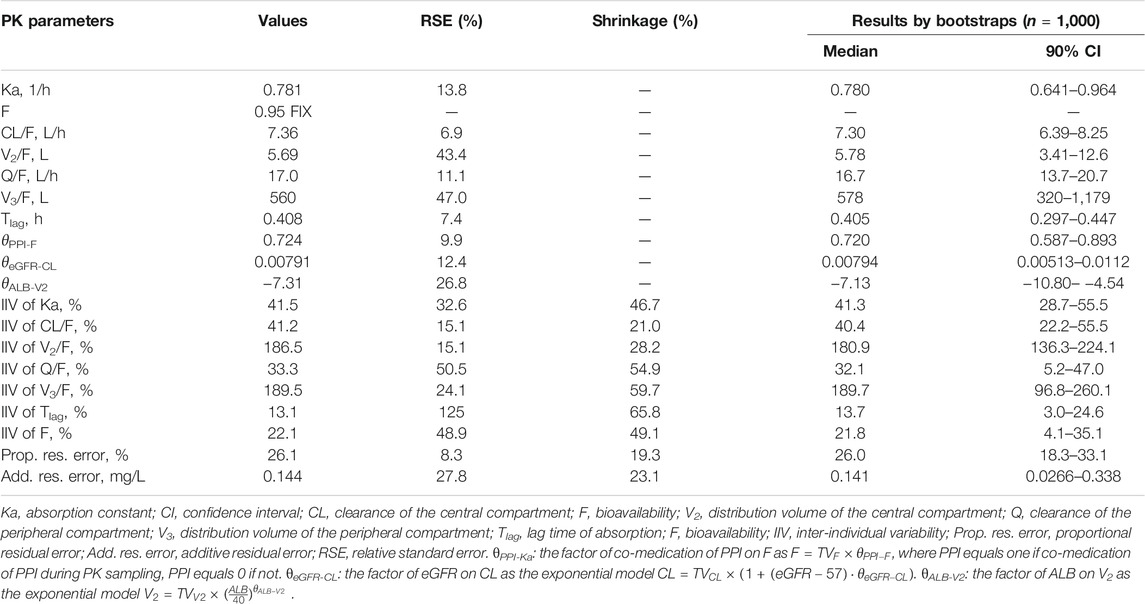
TABLE 2. Population pharmacokinetic parameters of MPA in the heart transplant recipients (n = 91).
PPK Model Evaluation
The GOF plots showed an adequate fitness of the final model (Figure 2). There was a good agreement between population-predicted concentrations (PREDs) and the observed concentrations, except for underestimating the higher observations (Figure 2A). It improved in the individual-predicted concentrations (IPREDs) vs. the observed concentrations. However, a similar underestimation also occurred in the higher concentration range (>15 mg/L). With an acceptable range of the conditional weighted residuals (CWRES), CWRES indicated no obvious trends throughout the time and the predicted concentrations (Figures 2C,D). The NPDE plots are shown in Figure 3. The quantile–quantile (QQ) plot and the distribution histogram of the NPDE showed a mean of 0.0613 and a variance of 0.9812 (p = 0.164) (Figures 3A,B). There was no trend for the NPDE versus time (Figure 3C) or the NPDE versus the predicted concentrations (Figure 3D). These results indicated that the final PPK model of MPA was accurate and reliable. The pcVPC plot is shown in Supplementary Figure S1. The pcVPC plot shows that most of the observed concentrations were between the 5th and 95th percentiles of model predictions, except that the predictions were higher than the observations around the peak timepoints (1–2 h post-dose). Generally, the model adequately characterized MPA concentrations.
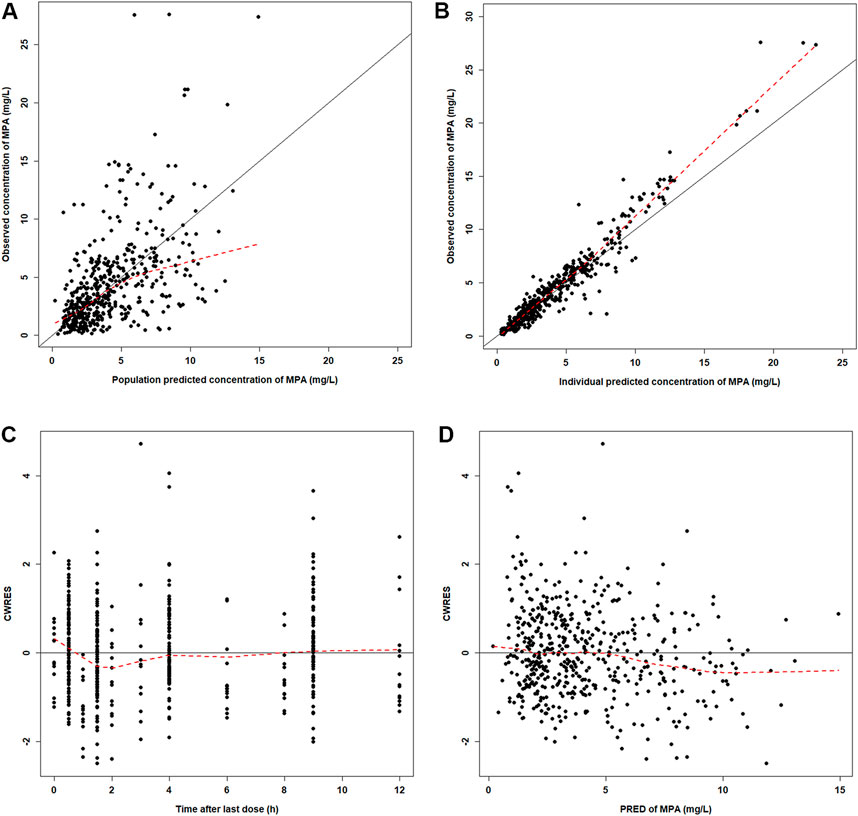
FIGURE 2. Diagnostic plots for the final PK model. (A) Observed versus population-predicted concentrations (DV vs. PRED). (B) Observed versus individual-predicted concentrations (DV vs. IPRED). (C) Conditional weight residual error versus time (CWRES vs. TIME). (D) Conditional weight residual error versus population-predicted concentration (PRED) (CWRES vs. PRED).
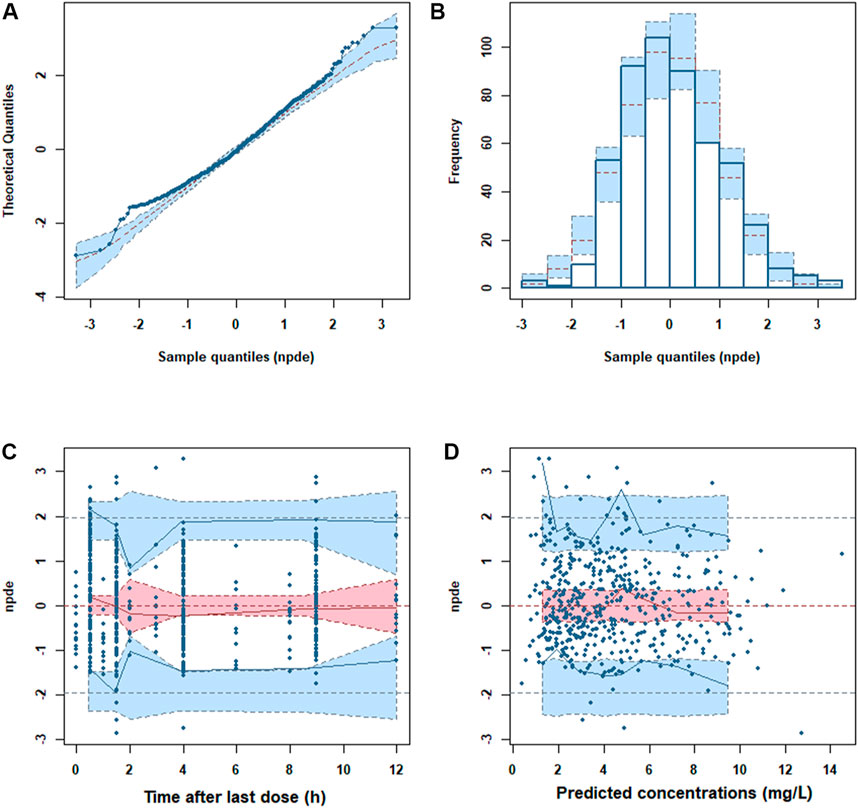
FIGURE 3. Normalized prediction distribution error (NPDE) metrics of the final model. (A) QQ plot of the NPDE. (B) Distribution of the NPDE. (C) NPDE versus time. (D) NPDE versus predicted concentrations.
Compared with the observed AUC0–12h values (AUCobs) of the intensive data, the accuracy (%ME) and precision (%RMSE) of the AUC0–12h estimation were 5.0 and 11.8%, respectively. High correlations between the AUCobs and AUCipred (r = 0.977) and most of the differences within 1.96 SD limits are shown in Supplementary Figure S2. It demonstrated that the final PPK model predicted the AUC0–12h values well.
Impacts of Covariates on MPA Exposure
The simulated AUC0–12h values at the steady-state calculated by the PRED are listed in Table 3. The change of ALB values resulted in few changes in AUC0–12h. However, PPI co-medication and eGFR change remarkably affected MPA exposure. With PPIs, AUC0–12h was reduced by approximately 26%, which was uniform with the influence on F. The simulated AUC0–12h values under severe renal impairment, mild renal impairment, and ARC were about 1.60-, 1.23-, and 0.78-fold that for normal renal function, respectively. Without PPIs, severe renal-impaired patients acquired the highest MPA exposure.
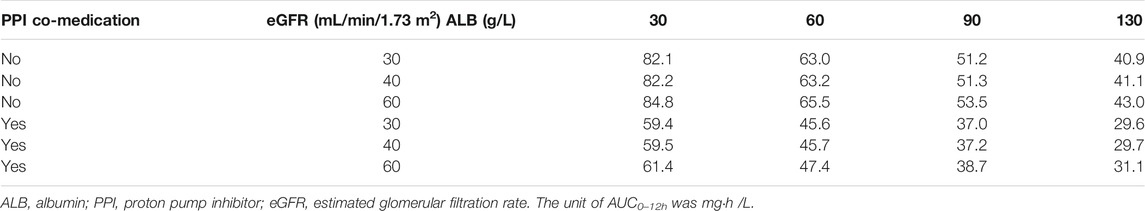
TABLE 3. Simulated steady-state area under curve (AUC0–12h) of mycophenolic acid (MPA) at a dose of 500 mg mycophenolate mofetil bid at different covariate values based on the final PPK model.
Optimal Sampling Times and Linear Model by LSS
The ED-optimal sampling timepoints included three timepoints: pre-dose and 1 and 4 h post-dose. We found that, except for 1 or 4 h post-dose alone, taking any of the optimal sampling times could obtain accurate AUC0–12h by MPAB estimation, with the value of correlation coefficients above 0.97 (Supplementary Table S2). We got the highest r2 (0.9981) with the %ME value of −0.1% and the %RMSE value of 2.9% taking all three sampling timepoints. It showed a high linear correlation between AUCref and AUCopt (r = 0.998) (Figure 4A). The Bland–Altman plot showed that only eight AUCopt values were outside the 1.96SD limit (Figure 4B). The linear coefficient between AUCobs and AUCopt14 was 0.843 (Figure 4C), with an acceptable bias (%ME = –3.3%), but with a larger precision (%RMSE = 32.4%). There was only one outlier in the Bland–Altman plot (Figure 4D).
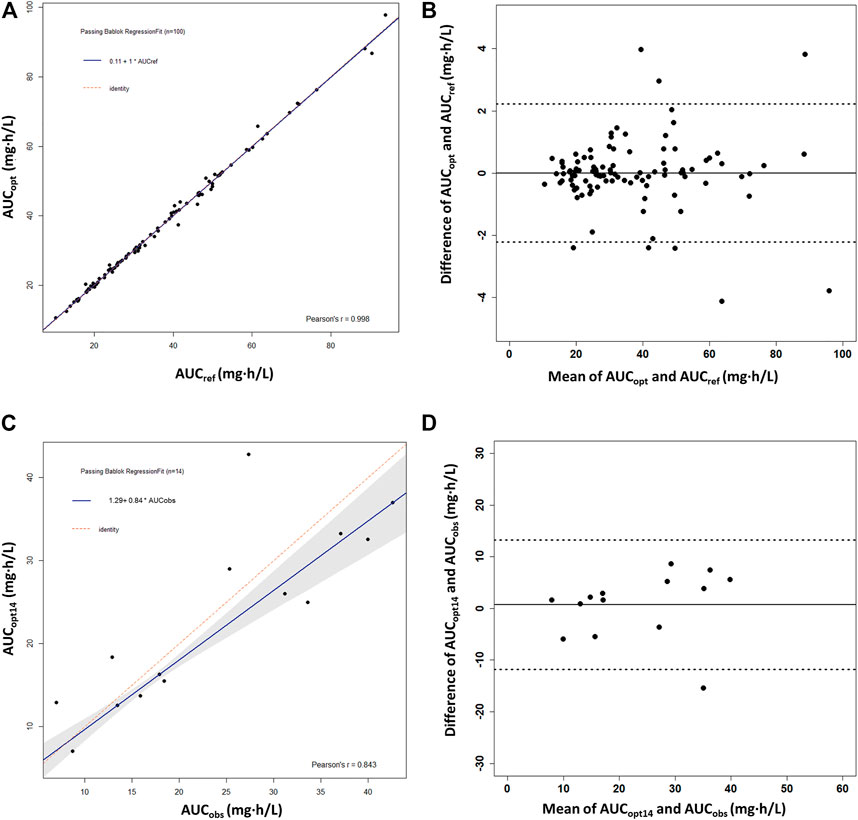
FIGURE 4. Passing–Bablok regression analysis and the Bland–Altman plot between the reference AUC0–12h and the predicted AUC0–12h of MPA obtained using the optimal sampling times by maximum a posteriori Bayesian (MAPB) estimation in heart transplant recipients. (A,B) Comparison between AUC0–12h based on the full PK profiles of the virtual patients (AUCref) and AUC0–12h based on the optimal sampling times (AUCopt) (n = 100). (C,D) Comparison between the observed AUC0–12h from the patients with intensive data as the reference AUC0–12h (AUCobs) and AUC0–12h based on the optimal sampling times (AUCopt14) (n = 14). AUC0–12h, the area under the curve of the dosing interval; MPA, mycophenolic acid.
The MLR analysis showed several one-to four-timepoint linear models with R2 > 0.9 (Supplementary Table S3). Considering estimation reliability, collinearity, and convenience of clinical application, a best-fit linear equation with four timepoints was finally chosen: AUC0–12h = 3.539 × C0 + 0.288 × C0.5 + 1.349 × C1 + 6.773 × C4.5 (r2 = 0.999). No intercept was included in the linear equation because it was not significant (p = 0.471). High correlations between the PPK-predicted, linear-calculated, and observed AUC0–12h values indicated the accuracy of the linear equation, with slopes of 1.0 (r = 1.00) and 0.95 (r = 0.976), respectively (Figures 5A,C). The %ME and %RMSE values between AUCipred and AUCMLR were 0.33 and 1.75%, respectively. Compared with the AUCobs, the %ME and %RMSE values were 6.1 and 11.0%, respectively. The Bland–Altman plot showed that only six AUCMLR values (5.7%) were outside the 1.96SD limits with AUCipred as the reference (Figure 5B). With AUCobs as a reference, there was only one outlier calculated by the linear equation (Figure 5D). The linear sampling times also showed adequate accuracy of AUC0–12h estimation by MAPB estimation (Supplementary Table S2).
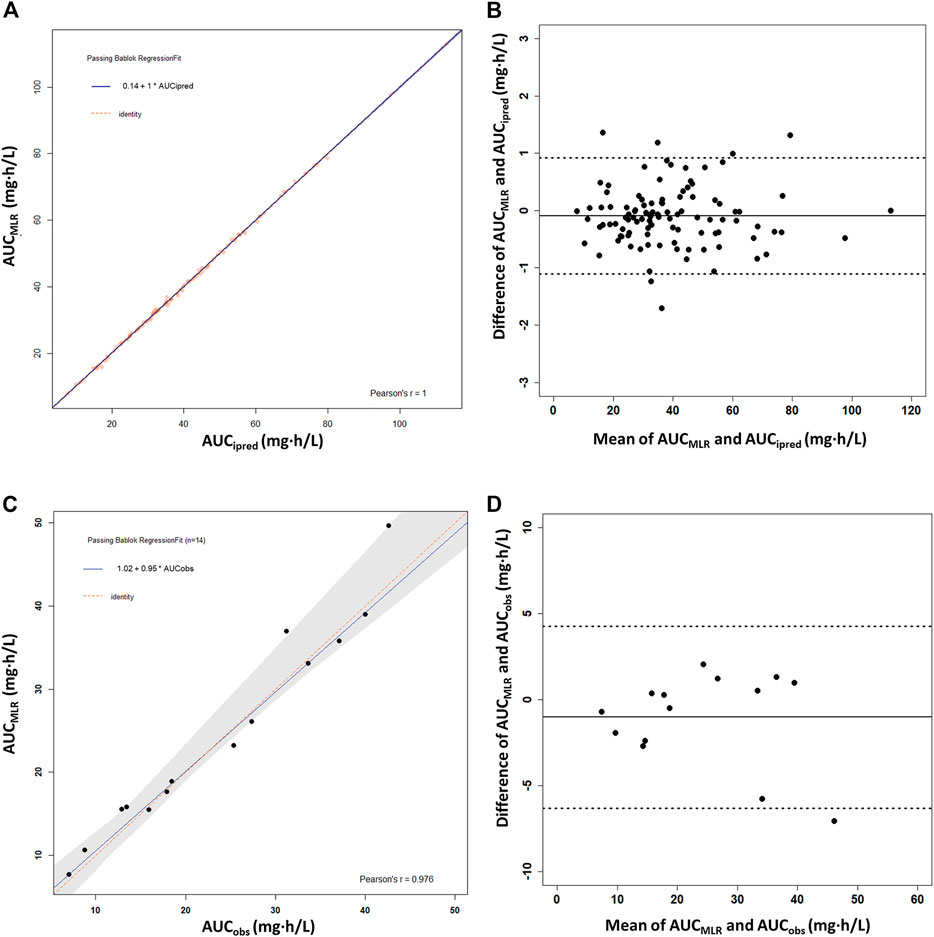
FIGURE 5. Passing–Bablok regression analysis and the Bland–Altman plot between the reference AUC0–12h and the calculated AUC0–12h of MPA obtained using the multiple linear regression model (AUCMLR) in the heart transplant recipients. (A,B) AUC0–12h obtained by PPK prediction as the reference AUC0–12h (AUCipred) (n = 91). (C,D) Observed AUC0–12h values from the patients with intensive data as the reference AUC0–12h (AUCobs) (n = 14). AUC0–12h, the area under the curve of the dosing interval; MPA, mycophenolic acid.
Discussion
To the best of our knowledge, this is the first study to report significant covariates affecting MPA pharmacokinetics in heart transplant recipients and provide a complete strategy for MPA exposure estimation using both the PPK modeling approach and linear regression. A two-compartment model with Tlag and three covariates adequately fitted the data. MPA exhibited EHC (Bergan et al., 2021). However, the EHC compartment was often supported by intensive data (Jiao et al., 2008; Wang et al., 2017; Colom et al., 2018), and it was validated to be inferior to the conventional two-compartment model (Zhang et al., 2019). Moreover, a two-compartment model with Tlag is more often chosen in organ transplant recipients (Kiang and Ensom, 2018; Yu et al., 2017). The two-compartment model without EHC in the current study adequately described the main part of the pharmacokinetic profile. However, there were still some deviations in the estimation of PK parameters. The large relative standard error (RSE%) and shrinkage of V2/F were probably caused by the inadequate fitness of the peak concentrations. Meanwhile, the parameters of the peripheral compartment (Q/F and V3/F) also had higher RSE% and shrinkage because the second peaks (or rebound concentrations) after 6 h post-dose, especially in the intensive data, were not well-fitted by the two-compartment model. In addition, the different sample collection times in the intensive and sparse data might have contributed to the high shrinkage in Tlag. Nevertheless, the AUC 0–12h estimation accuracy was acceptable based on the evaluation results of the final PPK model.
Previously, no covariate had been found in heart transplant recipients with Bayesian and nonparametric analysis (Woillard et al., 2015). However, significant factors influencing the MPA pharmacokinetics are essential in explaining the large inter-individual variability and could guide dose initiation and adjustment. We found three significant covariates in the final PPK model, including PPI co-medication (on F), eGFR (on CL/F), and ALB (on V2/F). PPI co-medication and eGFR were powerful covariates, which resulted in significant changes in AUC0–12h values, whereas the impact of ALB on AUC0–12h was limited.
PPIs are routinely used as co-medications to prevent gastrointestinal tract complications following surgery. The drug–drug interaction (DDI) between MPA and PPIs was previously reported (Wedemeyer and Blume, 2014; Benjanuwattra et al., 2020). In heart transplant recipients with PPI co-medication, the AUC0–12h of MPA was 25∼30% lower (Kofler et al., 2009a, 2009b). A similar reduction in the AUC0–12h values was estimated in our final PPK model (27.6% decrease). A previous study found that parenteral PPI administration decreased MPA AUC0–12h by 17.4% compared with oral administration in heart transplant recipients (Urbanowicz et al., 2020). However, we did not find a difference in F between different methods of PPI administration.
Moreover, diuretics also are commonly used medications after heart transplant surgery. Therefore, in our dataset, half of the patients received PPIs and diuretics during the study, three of whom were administered only diuretics without PPIs and five of whom received only PPIs without diuretics. Most patients took PPIs and diuretics simultaneously, especially during the period after surgery. The OFV (−18.4, p < 0.01) significantly decreased when diuretic co-medication on CL/F was included alone. However, it could not be retained in the full model once PPI co-medication on F was included. The impact of diuretics on the pharmacokinetics of MPA has to be investigated in further studies.
The published covariates with significant effects on CL/F of MPA in liver and renal transplant recipients include WT, Scr, SLCO1B1, and MRP-2 genetic polymorphism (Musuamba et al., 2012; Han et al., 2014; Yu et al., 2017). However, there was no significance in our study when including WT alone, while eGFR was a complex index to reflect renal function including WT, Scr, age, and sex. The effect of renal function on MPA CL/F was also found in previous studies, which showed that lower creatinine clearance is related to lower MPA clearance (Han et al., 2014; Langers et al., 2014). With severe renal function impairment, which possibly occurs after surgery, MPA exposure could increase by 30%. However, co-administration of PPIs decreased AUC0–12h by approximately 30%, which resulted in adequate MPA exposure. For patients with mild renal impairment taking PPIs, AUC0–12h only reached 45.7 mg h/L. In patients with normal renal function, AUC0–12h reduced to 37.2 mg h/L, close to the lower limit of MPA exposure for rejection (Table 3). Attention should be paid in the case of PPI co-medication and renal impairment, especially for the initial dose and dose adjustment of MMF, in heart transplant recipients. When the renal function recovered to normal and PPI medication was stopped, the AUC0–12h was still enough. If PPIs were still co-administered, the exposure of MPA would be lower than the target range. The recipient with ARC was at a higher risk of insufficient exposure to MPA. A dose adjustment might be necessary for this situation.
In previous studies, a series of covariates, including low plasma albumin levels and accumulation of the inactive MPAG, decreased the binding of MPA to ALB. WT and ALB were found to significantly influence MPA clearance and distribution volume or the protein-binding rate in renal transplant recipients (de Winter et al., 2010; Sheng et al., 2020). The subsequent increase in unbound MPA produces an increase in MPA clearance, resulting in decreased MPA exposure (de Winter et al., 2010). ALB was negatively related to CL/F of MPA in the liver transplant recipients, leading to lower MPA exposure (Langers et al., 2014). The effect of ALB on V2/F in our final model demonstrated the same trend of MPA concentrations. However, its impact seemed limited to the AUC0–12h. Other potential covariates were also investigated. The DDI between MPA and TAC was controversial in previous studies in healthy volunteers and renal transplant recipients (Kawauchi et al., 2019; Kim et al., 2018; Rong et al., 2019). However, in the current study, TAC trough concentrations and daily dose did not significantly influence the MPA pharmacokinetics. Other significant individual covariates, such as WT (on V2/F), PPIs (on Ka), and diuretics (on CL/F), were not included in the final PPK model, once other significant covariates were involved. The other potential covariates, such as age, POT, and liver function, were not found to significantly influence pharmacokinetic parameters. In addition, the Chinese patients in the present study received a similar MPA exposure at a lower dose of MMF (250–750 mg bid) compared with the Caucasian patients (750–1,500 mg bid) [35.2 (7.7–113.0) mg h/L vs. 33.8 (4.1–98.7) mg h/L] (Woillard et al., 2015). A 2- to 3-fold higher dosage resulted in similar MPA exposure in the Caucasian patients. A higher dose-normalized AUC0–12 was observed in the Chinese patients, which was also observed in a renal transplant population (Li et al., 2014). The lower WT in the Chinese population may be one of the reasons underlying the ethnic difference. However, other reasons, such as diet, pharmacogenomics, and enterohepatic circulation of MPA, may also contribute to this ethnic difference (Bergan et al., 2021).
In the ED-optimal sampling times, any two optimal sampling times could result in accurate AUC0–12h estimation (Supplementary Table S2). However, if only one sample could be collected, the pre-dose sample was recommended. Sampling only at 4 h post-dose could have a high coefficient but larger bias (%ME of −7.5%). If only one sample at 1 h post-dose was collected, the coefficient could be as low as 0.7168. The optimal sampling times were validated in the observed intensive dataset. However, considerable precision (%RMSE of 32.4%) was observed because there were only 14 patients with intensive data. The PK profiles of these patients also showed increased between-subject variability.
The following linear regression model was generated based on the simulated data of the final PPK model: AUC0–12h = 3.539 × C0 + 0.288 × C0.5 + 1.349 × C1 + 6.773 × C4.5. Although MLR models 2, 3, and 5 showed adequate accuracy of AUC0–12h estimation with VIF <10, MLR model 5 required a shorter collection time (within 4.5 h post-dose) (Supplementary Table S3). A linear model using three timepoint concentrations of C1, C2, and C4 with an intercept of 23.56 for the prediction of AUC0–12h in heart transplant recipients co-medicated with CsA or TAC was generated. However, an increased bias was found during clinical practice when calculating AUC0–12h (Wada et al., 2007). Kaczmarek et al. (2008) established the more reliable multiple linear models of four timepoints (C1, C4, C8, and C10) without intercept (r2 = 0.95); meanwhile, using the first 2-h post-dose concentrations [C0.5, C1 and C2 (r2 = 0.84) or C0.5 and C2 (r2 = 0.75)] could also provide an optional model to estimate AUC0–12h (Kaczmarek et al., 2008). However, in our study, collecting samples at the absorption phase (C0.5 and C1) was not recommended for linear or MAPB estimation. The correlation efficient was only 0.7473 (Supplementary Table S2). Moreover, the MPA concentrations measured by the EMIT were higher than the results measured by HPLC (Kunicki et al., 2015; Bergan et al., 2021). Furthermore, we compared our linear equation with another linear equation based on Chinese adult heart transplant recipients. The MPA concentrations were determined by HPLC, and the four-timepoint equation (C0.5, C2, C4, and C6) had an intercept of 8.424 (Xiang et al., 2021). Interestingly, taking our simulation data as a reference, the calculated AUC0–12h values by the published linear equation were generally higher by approximating the intercept (8.424), demonstrating that the bioanalysis methods’ systematic error probably caused the intercept. It still needs further validation.
The sampling times of the linear equation were around the ED-optimal sampling times. The ED-optimal sampling strategy and linear regression found similar time-point patterns. Four timepoints in the MLR equation could estimate AUC0–12h accurately (r = 0.9699). However, collecting at 0.5, 1, and 4.5 h post-dose without the pre-dose sample could also obtain an accurate AUC0–12h estimate (r = 0.9981). It meant that once the pre-dose was missing, AUC0–12h estimation could still be obtained based on other samples by MAPB estimation. One sample alone (except for pre-dose) was not recommended for MAPB estimation. There are some recommendations for the use of the linear model and the final PPK model. The final PPK model and the linear equation were both accurate to estimate MPA AUC0–12h. However, the linear model’s premise was the exact collection timepoint and the EMIT bioanalysis method. Once there are missing samples, changes in co-medication or renal impairments require dose adjustment, and the PPK model is preferred for its flexible application and strong adaptability. Once the concentrations were obtained, prediction could be performed directly using the final PPK model, such as the online Bayesian estimator (Woillard et al., 2015). However, when covariates change (e.g., PPI co-administration ceases), the PPK simulation could give some guidance for dose adjustment.
This study had some limitations. Due to the limited number of participants, the patient groups could not represent all patients. Therefore, probably not all significant covariates could be identified. The intensive data were collected in only 14 patients, and hence our conclusions need to be externally validated with further intensive data. The linear model was based on the EMIT data, so MPA concentrations measured by HPLC cannot be used in our linear models. Finally, the applied immunosuppressant was TAC, with no patients taking cyclosporine, which could affect MPA exposure.
Conclusion
A PPK model of MPA was established with three covariates. Co-medication of PPIs and eGFR had significant impact on MPA AUC0–12h. The optimal sampling times for MAPB estimation were pre-dose and 1 and 4 h post-dose. The following MLR model was generated: AUC0–12h = 3.539 × C0 + 0.288 × C0.5 + 1.349 × C1 + 6.773 × C4.5. These models accurately calculated AUC0–12h values. The PPK model is preferred for its flexible application and strong adaptability, while the linear regression equation was a convenient alternative for the fast estimation of MPA AUC0–12h values.
Data Availability Statement
The raw data supporting the conclusions of this article will be made available by the authors, without undue reservation.
Ethics Statement
The studies involving human participants were reviewed and approved by the Research Ethics Committee of Guangdong Provincial People’s Hospital, Guangdong Academy of Medical Sciences. The patients/participants provided their written informed consent to participate in this study.
Author Contributions
MW contributed to the design of the research and interpretation of the data. MW, YW, JH, and JZ were responsible for data collection. ZW and JL were responsible for sample collection. SS was responsible for the bioanalysis of MPA concentrations in the blood samples. XW was responsible for PK modeling. XW, DS, and SZ were responsible for writing the manuscript. All authors have agreed to be fully accountable for ensuring the integrity and accuracy of the study. In addition, all authors read and approved the final manuscript.
Funding
Author MW is currently receiving a Grant (202102080011) from the Science and Technology Program of Guangzhou and a Grant (A2020002) from the Medical Scientific Research Foundation of Guangdong Province of China. Author XW is currently receiving a Grant (#2018A04) from the Guangdong Provincial Hospital Pharmaceutical Research Fund (ChiaTai Tianqing) of Guangdong Pharmaceutical Association.
Conflict of Interest
The authors declare that the research was conducted in the absence of any commercial or financial relationships that could be construed as a potential conflict of interest.
Publisher’s Note
All claims expressed in this article are solely those of the authors and do not necessarily represent those of their affiliated organizations, or those of the publisher, the editors, and the reviewers. Any product that may be evaluated in this article, or claim that may be made by its manufacturer, is not guaranteed or endorsed by the publisher.
Acknowledgments
The authors would like to thank all the doctors, nurses, technicians, and patients involved for their dedication to the study. We thank International Science Editing (http://www.internationalscienceediting.com) for editing this manuscript.
Supplementary Material
The Supplementary Material for this article can be found online at: https://www.frontiersin.org/articles/10.3389/fphar.2021.748609/full#supplementary-material
References
Armstrong, V. W., Tenderich, G., Shipkova, M., Parsa, A., Koerfer, R., Schröder, H., et al. (2005). Pharmacokinetics and Bioavailability of Mycophenolic Acid after Intravenous Administration and Oral Administration of Mycophenolate Mofetil to Heart Transplant Recipients. Ther. Drug Monit. 27, 315–321. doi:10.1097/01.ftd.0000163949.40686.0f
Baraldo, M., Cojutti, P. G., Isola, M., Feruglio, M. T., Tursi, V., Livi, U., et al. (2009). Validation of Limited Sampling Strategy for Estimation of Mycophenolic Acid Exposure during the First Year after Heart Transplantation. Transpl. Proc 41, 4277–4284. doi:10.1016/j.transproceed.2009.08.077
Benjanuwattra, J., Pruksakorn, D., and Koonrungsesomboon, N. (2020). Mycophenolic Acid and its Pharmacokinetic Drug-Drug Interactions in Humans: Review of the Evidence and Clinical Implications. J. Clin. Pharmacol. 60, 295–311. doi:10.1002/jcph.1565
Bergan, S., Brunet, M., Hesselink, D. A., Johnson-Davis, K. L., Kunicki, P. K., Lemaitre, F., et al. (2021). Personalized Therapy for Mycophenolate: Consensus Report by the International Association of Therapeutic Drug Monitoring and Clinical Toxicology. Ther. Drug Monit. 43, 150–200. doi:10.1097/FTD.0000000000000871
Bullingham, R., Monroe, S., Nicholls, A., and Hale, M. (1996). Pharmacokinetics and Bioavailability of Mycophenolate Mofetil in Healthy Subjects after Single-Dose Oral and Intravenous Administration. J. Clin. Pharmacol. 36, 315–324. doi:10.1002/j.1552-4604.1996.tb04207.x
Bullingham, R. E., Nicholls, A. J., and Kamm, B. R. (1998). Clinical Pharmacokinetics of Mycophenolate Mofetil. Clin. Pharmacokinet. 34, 429–455. doi:10.2165/00003088-199834060-00002
Carstensen, B., Gurrin, L., Ekstrøm, C., and Figurski, M. (2020). MethComp: Analysis of Agreement in Method Comparison Studies. R Package Version 1.30.0. https://CRAN.R-project.org/package=MethComp.
Colom, H., Andreu, F., van Gelder, T., Hesselink, D. A., de Winter, B. C. M., Bestard, O., et al. (2018). Prediction of Free from Total Mycophenolic Acid Concentrations in Stable Renal Transplant Patients: A Population-Based Approach. Clin. Pharmacokinet. 57, 877–893. doi:10.1007/s40262-017-0603-8
de Winter, B. C., Mathot, R. A., Sombogaard, F., Neumann, I., van Hest, R. M., Doorduijn, J. K., et al. (2010). Differences in Clearance of Mycophenolic Acid Among Renal Transplant Recipients, Hematopoietic Stem Cell Transplant Recipients, and Patients with Autoimmune Disease. Ther. Drug Monit. 32, 606–614. doi:10.1097/FTD.0b013e3181efd715
Denney, W., and Buckeridge, C. (2015). Abstracts Accepted for American Conference on Pharmacometrics 2015 (ACoP6). J. Pharmacokinet. Pharmacodyn. 42, 11–107. doi:10.1007/s10928-015-9432-2
Dösch, A. O., Ehlermann, P., Koch, A., Remppis, A., Katus, H. A., and Dengler, T. J. (2006). A Comparison of Measured Trough Levels and Abbreviated AUC Estimation by Limited Sampling Strategies for Monitoring Mycophenolic Acid Exposure in Stable Heart Transplant Patients Receiving Cyclosporin A-Containing and Cyclosporin A-free Immunosuppressive Regimens. Clin. Ther. 28, 893–905. doi:10.1097/TP.000000000000269810.1016/j.clinthera.2006.06.015
Figurski, M. J., Pawiński, T., Goldberg, L. R., DeNofrio, D., Nawrocki, A., Taylor, D. O., et al. (2012). Pharmacokinetic Monitoring of Mycophenolic Acid in Heart Transplant Patients: Correlation the Side-Effects and Rejections with Pharmacokinetic Parameters. Ann. Transpl. 17, 68–78. doi:10.12659/aot.882638
Han, N., Yun, H. Y., Kim, I. W., Oh, Y. J., Kim, Y. S., and Oh, J. M. (2014). Population Pharmacogenetic Pharmacokinetic Modeling for Flip-Flop Phenomenon of Enteric-Coated Mycophenolate Sodium in Kidney Transplant Recipients. Eur. J. Clin. Pharmacol. 70, 1211–1219. doi:10.1007/s00228-014-1728-4
Huo, Z., Li, C., Xu, X., Ge, F., Wang, R., Wen, Y., et al. (2020). Cancer Risks in Solid Organ Transplant Recipients: Results from a Comprehensive Analysis of 72 Cohort Studies. Oncoimmunology 9, 1848068. doi:10.1080/2162402X.2020.1848068
Jiao, Z., Ding, J. J., Shen, J., Liang, H. Q., Zhong, L. J., Wang, Y., et al. (2008). Population Pharmacokinetic Modelling for Enterohepatic Circulation of Mycophenolic Acid in Healthy Chinese and the Influence of Polymorphisms in UGT1A9. Br. J. Clin. Pharmacol. 65, 893–907. doi:10.1111/j.1365-2125.2008.03109.x
Kaczmarek, I., Bigdeli, A. K., Vogeser, M., Mueller, T., Beiras-Fernandez, A., Kaczmarek, P., et al. (2008). Defining Algorithms for Efficient Therapeutic Drug Monitoring of Mycophenolate Mofetil in Heart Transplant Recipients. Ther. Drug Monit. 30, 419–427. doi:10.1097/FTD.0b013e31817d7064
Kawauchi, S., Wada, K., and Oita, A. (2019). Changes in blood concentration of mycophenolic acid and FK506 in a heart-transplant patient treated with plasmapheresis. Int. J. Clin. Pharmacol. Ther. 57, 32–36. doi:10.5414/CP203278
Kiang, T. K. L., and Ensom, M. H. H. (2018). Population Pharmacokinetics of Mycophenolic Acid: An Update. Clin. Pharmacokinet. 57, 547–558. doi:10.1007/s40262-017-0593-6
Kim, J. H., Han, N., Kim, M. G., Yun, H. Y., Lee, S., Bae, E., et al. (2018). Increased Exposure of Tacrolimus by Co-administered Mycophenolate Mofetil: Population Pharmacokinetic Analysis in Healthy Volunteers. Sci. Rep. 8, 1687. doi:10.1038/s41598-018-20071-3
Kofler, S., Deutsch, M. A., Bigdeli, A. K., Shvets, N., Vogeser, M., Mueller, T. H., et al. (2009a). Proton Pump Inhibitor Co-medication Reduces Mycophenolate Acid Drug Exposure in Heart Transplant Recipients. J. Heart Lung Transpl. 28, 605–611. doi:10.1016/j.healun.2009.03.006
Kofler, S., Shvets, N., Bigdeli, A. K., König, M. A., Kaczmarek, P., et al. (2009b). Proton Pump Inhibitors Reduce Mycophenolate Exposure in Heart Transplant Recipients-A Prospective Case-Controlled Study. Am. J. Transpl. 9, 1650–1656. doi:10.1111/j.1600-6143.2009.02682.x
Kunicki, P. K., Pawiński, T., Boczek, A., Waś, J., and Bodnar-Broniarczyk, M. (2015). A Comparison of the Immunochemical Methods, PETINIA and EMIT, with that of HPLC-UV for the Routine Monitoring of Mycophenolic Acid in Heart Transplant Patients. Ther. Drug Monit. 37, 311–318. doi:10.1097/ftd.0000000000000151
Langers, P., Press, R. R., Inderson, A., Cremers, S. C., den Hartigh, J., Baranski, A. G., et al. (2014). Limited Sampling Model for Advanced Mycophenolic Acid Therapeutic Drug Monitoring after Liver Transplantation. Ther. Drug Monit. 36, 141–147. doi:10.1097/FTD.0b013e3182a37a1e
Li, P., Shuker, N., Hesselink, D. A., van Schaik, R. H., Zhang, X., and van Gelder, T. (2014). Do Asian Renal Transplant Patients Need Another Mycophenolate Mofetil Dose Compared with Caucasian or African American Patients. Transpl. Int. 27, 994–1004. doi:10.1111/tri.12382
Lindbom, L., Ribbing, J., and Jonsson, E. N. (2004). Perl-speaks-NONMEM (PsN)-Aa Perl Module for NONMEM Related Programming. Comput. Methods Programs Biomed. 75, 85–94. doi:10.1016/j.cmpb.2003.11.003
Ma, Y. C., Zuo, L., Chen, J. H., Luo, Q., Yu, X. Q., Li, Y., et al. (2006). Modified Glomerular Filtration Rate Estimating Equation for Chinese Patients with Chronic Kidney Disease. J. Am. Soc. Nephrol. 17, 2937–2944. doi:10.1681/ASN.2006040368
Musuamba, F. T., Mourad, M., Haufroid, V., Demeyer, M., Capron, A., Delattre, I. K., et al. (2012). A Simultaneous D-Optimal Designed Study for Population Pharmacokinetic Analyses of Mycophenolic Acid and Tacrolimus Early after Renal Transplantation. J. Clin. Pharmacol. 52, 1833–1843. doi:10.1177/0091270011423661
Nyberg, J., Ueckert, S., Strömberg, E. A., Hennig, S., Karlsson, M. O., and Hooker, A. C. (2012). PopED: an Extended, Parallelized, Nonlinear Mixed Effects Models Optimal Design Tool. Comput. Methods Programs Biomed. 108, 789–805. doi:10.1016/j.cmpb.2012.05.005
Pawinski, T., Kunicki, P. K., Sobieszczanska-Malek, M., Gralak, B., and Szlaska, I. (2009). A Limited Sampling Strategy for Estimating Mycophenolic Acid Area under the Curve in Adult Heart Transplant Patients Treated with Concomitant Cyclosporine. J. Clin. Pharm. Ther. 34, 89–101. doi:10.1111/j.1365-2710.2008.00973.x
R Core Team (2019). R: A Language and Environment for Statistical Computing. Vienna, Austria: R Foundation for Statistical Computing. URL https://www.R-project.org/.
Rong, Y., Mayo, P., Ensom, M. H. H., and Kiang, T. K. L. (2019). Population Pharmacokinetics of Mycophenolic Acid Co-administered with Tacrolimus in Corticosteroid-free Adult Kidney Transplant Patients. Clin. Pharmacokinet. 58, 1483–1495. doi:10.1007/s40262-019-00771-3
Scrucca, L., Fop, M., Murphy, T. B., and Raftery, A. E. (2016). Mclust 5: Clustering, Classification and Density Estimation Using Gaussian Finite Mixture Models. R. J. 8, 289–317. doi:10.32614/rj-2016-021
Sheng, C., Zhao, Q., Niu, W., Qiu, X., Zhang, M., and Jiao, Z. (2020). Effect of Protein Binding on Exposure of Unbound and Total Mycophenolic Acid: A Population Pharmacokinetic Analysis in Chinese Adult Kidney Transplant Recipients. Front. Pharmacol. 11, 340. doi:10.3389/fphar.2020.00340
Tett, S. E., Saint-Marcoux, F., Staatz, C. E., Brunet, M., Vinks, A. A., Miura, M., et al. (2011). Mycophenolate, Clinical Pharmacokinetics, Formulations, and Methods for Assessing Drug Exposure. Transpl. Rev (Orlando) 25, 47–57. doi:10.1016/j.trre.2010.06.001
Ting, L. S., Partovi, N., Levy, R. D., Ignaszewski, A. P., and Ensom, M. H. (2008). Performance of Limited Sampling Strategies for Predicting Mycophenolic Acid Area under the Curve in Thoracic Transplant Recipients. J. Heart Lung Transpl. 27, 325–328. doi:10.1016/j.healun.2007.12.009
Urbanowicz, T., Straburzyńska-Migaj, E., Casadei, V., Bociański, M., and Jemielity, M. (2020). Different Routes of Proton Pumps Inhibitors Co-administration Have Significant Impact on Mycophenolate Acid (MPA) Serum Levels in Heart Transplant Recipients. Ann. Transpl. 25, e920225. doi:10.12659/aot.920225
Wada, K., Takada, M., Kotake, T., Ochi, H., Morishita, H., Komamura, K., et al. (2007). Limited Sampling Strategy for Mycophenolic Acid in Japanese Heart Transplant Recipients: Comparison of Cyclosporin and Tacrolimus Treatment. Circ. J. 71, 1022–1028. doi:10.1253/circj.71.1022
Wang, X. X., Liu, W., Zheng, T., Park, J. M., Smith, D. E., and Feng, M. R. (2017). Population Pharmacokinetics of Mycophenolic Acid and its Glucuronide Metabolite in Lung Transplant Recipients with and without Cystic Fibrosis. Xenobiotica 47, 697–704. doi:10.1080/00498254.2016.1214885
Wedemeyer, R. S., and Blume, H. (2014). Pharmacokinetic Drug Interaction Profiles of Proton Pump Inhibitors: an Update. Drug Saf. 37, 201–211. doi:10.1007/s40264-014-0144-0
Woillard, J. B., Saint-Marcoux, F., Monchaud, C., Youdarène, R., Pouche, L., and Marquet, P. (2015). Mycophenolic Mofetil Optimized Pharmacokinetic Modelling, and Exposure-Effect Associations in Adult Heart Transplant Recipients. Pharmacol. Res. 99, 308–315. doi:10.1016/j.phrs.2015.07.012
Woillard, J. B., Labriffe, M., Debord, J., and Marquet, P. (2021). Mycophenolic Acid Exposure Prediction Using Machine Learning. Clin. Pharmacol. Ther. 110, 370–379. doi:10.1002/cpt.2216
Xiang, H., Zhou, H., Zhang, J., Sun, Y., Wang, Y., Han, Y., et al. (2021). Limited Sampling Strategy for Estimation of Mycophenolic Acid Exposure in Adult Chinese Heart Transplant Recipients. Front. Pharmacol. 12, 652333. doi:10.3389/fphar.2021.652333
Yu, Z. C., Zhou, P. J., Wang, X. H., Françoise, B., Xu, D., Zhang, W. X., et al. (2017). Population Pharmacokinetics and Bayesian Estimation of Mycophenolic Acid Concentrations in Chinese Adult Renal Transplant Recipients. Acta Pharmacol. Sin 38, 1566–1579. doi:10.1038/aps.2017.115
Zhang, H. X., Sheng, C. C., Liu, L. S., Luo, B., Fu, Q., Zhao, Q., et al. (2019). Systematic External Evaluation of Published Population Pharmacokinetic Models of Mycophenolate Mofetil in Adult Kidney Transplant Recipients Co-administered with Tacrolimus. Br. J. Clin. Pharmacol. 85, 746–761. doi:10.1111/bcp.13850
Keywords: heart transplantation, enzyme multiplied immunoassay technique, maximum a posteriori Bayesian estimation, limited sampling strategy, multilinear regression analysis, population pharmacokinetics, mycophenolic acid
Citation: Wang X, Wu Y, Huang J, Shan S, Mai M, Zhu J, Yang M, Shang D, Wu Z, Lan J, Zhong S and Wu M (2021) Estimation of Mycophenolic Acid Exposure in Heart Transplant Recipients by Population Pharmacokinetic and Limited Sampling Strategies. Front. Pharmacol. 12:748609. doi: 10.3389/fphar.2021.748609
Received: 28 July 2021; Accepted: 14 October 2021;
Published: 19 November 2021.
Edited by:
Bente Jespersen, Aarhus University Hospital, DenmarkReviewed by:
Niels Henrik Buus, Aarhus University, DenmarkJiao Zheng, Shanghai Jiaotong University, China
Copyright © 2021 Wang, Wu, Huang, Shan, Mai, Zhu, Yang, Shang, Wu, Lan, Zhong and Wu. This is an open-access article distributed under the terms of the Creative Commons Attribution License (CC BY). The use, distribution or reproduction in other forums is permitted, provided the original author(s) and the copyright owner(s) are credited and that the original publication in this journal is cited, in accordance with accepted academic practice. No use, distribution or reproduction is permitted which does not comply with these terms.
*Correspondence: Min Wu, d3VtaW4wMDExQGdkcGgub3JnLmNu
†These authors have contributed equally to this work and share first authorship