 Yaoli Liu1
 Yaoting Ji
94% of researchers rate our articles as excellent or good
Learn more about the work of our research integrity team to safeguard the quality of each article we publish.
Find out more
ORIGINAL RESEARCH article
Front. Pharmacol., 29 April 2021
Sec. Translational Pharmacology
Volume 12 - 2021 | https://doi.org/10.3389/fphar.2021.665894
Background: Sulforaphane (SFN), an isothiocyanate naturally occurring in cruciferous vegetables, is a potent indirect antioxidant and a promising agent for the control of metabolic disorder disease. The glucose intolerance and adipogenesis induced by diet in rats was inhibited by SFN. Strategies aimed at induction of brown adipose tissue (BAT) could be a potentially useful way to against obesity. However, in vivo protective effect of SFN against obesity by browning white adipocyte has not been reported. Our present study is aimed at evaluation the efficacy of the SFN against the high-fat induced-obesity mice and investigating the potential mechanism.
Methods: High-Fat Diet-induced obese female C57BL/6 mice were intraperitoneally injected with SFN (10 mg/kg) daily. Body weight was recorded every 3 days. 30 days later, glucose tolerance test (GTT) and insulin tolerance test (ITT) were performed. At the end of experiment, fat mass were measured and the adipogenesis as well as browning associated genes expression in white adipose tissue (WAT) were determined by RT-qPCR and western blot. Histological examination of the adipose tissue samples were carried out with hematoxylin–eosin (HE) staining and immunofluorescence staining method. In vitro, pre-adipocytes C3H10T1/2 were treated with SFN to investigate the direct effects on adipogenesis.
Results: SFN suppressed HFD-induced body weight gain and reduced the size of fat cells in mice. SFN suppressed the expression of key genes in adipogenesis, inhibited lipid accumulation in C3H10T1/2 cells, increased the expression of brown adipocyte-specific markers and mitochondrial biogenesis in vivo and in vitro, and decreased cellular and mitochondrial oxidative stress. These results suggested that SFN, as a nutritional factor, has great potential role in the battle against obesity by inducing the browning of white fat.
Conclusion: SFN could significantly decrease the fat mass, and improve glucose metabolism and increase insulin sensitivity of HFD-induced obese mice by promoting the browning of white fat and enhancing the mitochondrial biogenesis in WAT. Our study proves that SFN could serve as a potential medicine in anti-obesity and related diseases.
Obesity is a global public health problem that results in many metabolic disorders, such as type 2 diabetes, coronary heart disease, cancer, hypertension, and other chronic diseases (Kopelman, 2007). These diseases have an adverse effect on personal health and cause the cost explosion in public health systems (Ahima and Lazar, 2013).
There are two main types of adipose tissue in mammals: white adipose tissue (WAT) and brown adipose tissue (BAT) (Jeremic et al., 2017). WAT, which is composed of subcutaneous and visceral fat, is specialized to store energy and directly modulates metabolism by secreting various adipokines, such as LPL and LEP (Plaza et al., 2018). In comparison, BAT is highly expressing uncoupling protein 1 (UCP1) and contains a considerable amount of mitochondria, which enhances heat production and thermogenesis (Bargut et al., 2017).
Although white and brown adipocytes originate from different cell lineages, they are readily interconvertible to each other (Sanchez-Gurmaches et al., 2016). The Ucp1 positive multilocular cells with thermogenic capability developed in white fat depots, which are characterized as beige or brite (brown in white), with some external stimuli (Herz and Kiefer, 2019). WAT can possess biochemical and morphological features similar to those of BAT, such as the presence of multilocular lipid droplets and the increased expression of Ucp1 and other genes associated with mitochondrial biogenesis, when subjected to certain stimuli (Vidal and Stanford, 2020). The conversion process of WAT into BAT is called “browning”, which may positively contribute to cellular bioenergetics and metabolism homeostasis (Herz and Kiefer, 2019). WAT could be appearance of brite adipocytes under the condition of cold exposure or pharmacological activaton β-3 adrenergic receptors via the promotion of WAT reprogramming (P. Liu et al., 2019b).
It was well known that a number of dietary compounds present in fruit and vegetables could increase energy expenditure and decrease fat accumulation in mammals resulting in the decrease of medical care cost associated with obesity (Montanari et al., 2017). Sulforaphane (SFN), derived from glucosinolates in cruciferous vegetables, is a potent indirect anti-oxidant and as a promising chemopreventive agent against cancer (Houghton, 2019). More and more research proved that SFN may play a positive role in the target to control metabolic disorder (Z. Li et al., 2020b). The glucose intolerance and adipogenesis induced by diet in rats was inhibited by SFN (Sun et al., 2020). SFN induces the browning of pre-adipocytes via increasing the content of mitochondrial and activity of enzymes in respiratory chain (Zhang et al., 2016). However, whether SFN prevent high fat feed-induced obesity through the browning of white adipocyte remains unknown.
In the present study, we report that SFN induces the browning of mature C3H10T1/2 adipocytes based on the promotion of mitochondrial biogenesis by means of the upregulation of the AMPK and NRF2 signaling pathways and the enhancement of mitochondrial function. Our further research revealed that SFN can prevent high-fat diet (HFD)-induced obesity in C57BL/6N mice by inducing the browning of WAT.
C3H10T1/2 pre-adipocytes were cultured in basal medium (high-glucose Dulbecco’s modified Eagle’s medium [DMEM]) supplemented with 10% FBS, 1% penicillin-streptomycin, and 1% L-glutamine) at 37°C in a humidified incubator with 5% CO2. Cells were passaged when 80% confluent, then seeded in a six-well plate at a density of 1 × 10⁵ cells/well, and grown to confluency (designated as “day 0”) in basal medium. The differentiation of the cells into mature adipocytes was induced through the classic cocktail method. At day 0, the cells were cultured in DMEM with 10% FBS, 0.5 μM rozglitazone, 10 μM insulin, 0.25 μM glutamine, 1 μM dexamethasone, and 0.5 mM 3-isobutyl-1-methyxanthine for 3 days. The culture medium was replaced with DMEM containing 10% FBS, 0.25 μM glutamine, and 10 μM insulin at day 3 for 1 day. The steps were repeated three times until the cells differentiated into mature adipocytes.
C3H10T1/2 cells were seeded at a density of 3,000 cells/well in a 96-well plate. After 24 h, the cells were treated with various concentrations of SFN (0, 1, 5, 10, and 20 μM) (Cayman Chemical, Item No: 10,496, Purity ≥98%, synthetic, dissolved in PBS). After 12, 24, or 48 h of culture, the reagent of cell counting kit 8 (CCK8, 10 μL) was added to each well. The plates were incubated for another 1 h at 37°C. The absorbance was measured at 450 nm.
Oil red O staining was performed after the C3H10T1/2 cells differentiated into mature adipocytes. The cells were washed with PBS and fixed with 4% formalin for 30 min. The lipid droplets were stained with Oil Red O solution for 20 min. The solution was removed, and the lipid droplets in the cells were dissolved in 100% isopropanol. Optical density was measured at 520 nm.
Total RNA was isolated using the TRIzol® (TaKaRa Bio, Otsu, Shiga, Japan) method following the manufacturer’s instruction. The concentration and quality of the total RNA was checked by NanoDrop 2000 analyzer (Thermo Scientific, Ltd., Wilmington, DE, United States). cDNA was synthesized using the HiScript II QRT SuperMix for qPCR (+gDNA wiper) (Vazyme biotech). qPCR was performed with the QuantStudio six Flex Real-Time PCR System (Life Technologies, United States) using ChamQ SYBR qPCR Master Mix (Vazyme biotech). All reactions were performed in triplicate. Fold differences in gene expression were calculated with the ΔΔCt method using β-actin as the housekeeping gene. The primer sequences for tested genes were as follows (Table 1).
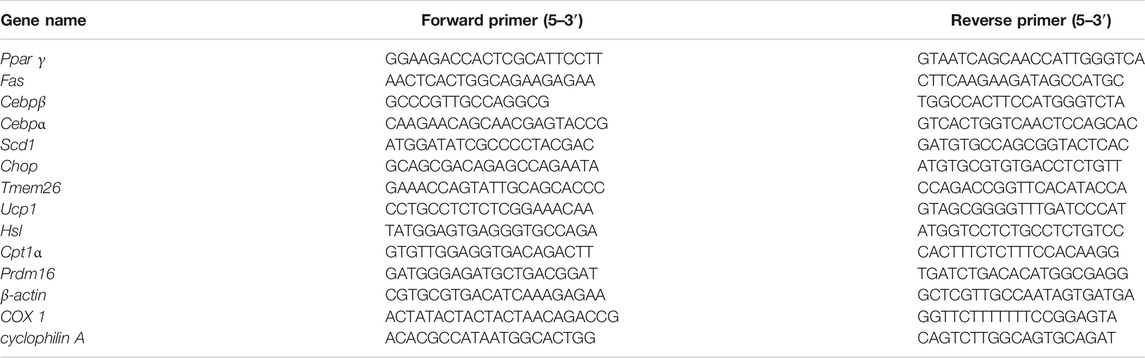
TABLE 1. Oligonucleotide Primers Used for qPCR.
The animal procedures were approved by the Institutional Animal Care and Use Committee of Wuhan University. Female C57BL/6 mice (n = 28, 8 weeks old) were purchased from the Laboratory Animal Center of Wuhan University (Wuhan, China) and maintained at a temperature of 24–26°Cand a 12 h light/12 h dark cycle. The mice were randomly divided into four groups: group 1, normal diet; group 2, normal diet plus SFN (10 mg/kg/day); group 3, HFD; and group 4, HFD plus SFN (10 mg/kg/day). In group 2 and 4, C57BL/6 mice were intraperitoneally injected with SFN (10 mg/kg) daily and in group 1 and 3, mice were intraperitoneally injected with the same amount of PBS.
After 30 days intervention, the GTT and ITT were performed. For GTT, the mice were fasted for 16 h of the next day with free access to drinking water. The blood glucose were recorded before the mice were intraperitoneally injected with 10% D-glucose (1.0 g/kg body weight). Blood glucose levels were measured at 15, 30, 60, 90, and 120 min with Sannuo blood glucose meter (Sinocare Inc. China). Three days later, the mice were subjected to ITT. The mice were fasted for 4 h (8:00–12:00) with free access to drinking water and then intraperitoneally injected with insulin (1 U/kg body weight; Humulin; Eli Lilly, Indianapolis, IN, United States ). Blood glucose levels were measured as described above. The animals were euthanized with Carbon dioxide (CO2) inhalation 3 days after the ITT was performed and tissue collection was performed at this stage.
Adipose and liver tissues were fixed in 4% paraformaldehyde solution, dehydrated in a graded ethanol series (70–100%), and embedded in paraffin. Paraffin-embedded section was sliced at 5 µm (Leica, RM2235). The slides were carried out with hematoxylin–eosin (HE) staining and subjected to immunohistochemistry staining with UCP-1 antibody (Ab10983; Abcam). The image were captured with a light microscope (CX41; Olympus, Japan) and analyzed using NIH ImageJ software.
C3H10T1/2 cells were washed with ice-cold PBS for three times and lyzed with lysis buffer at 4°C for 30 min and further treated by ultrasound, then centrifuged at 12,000 rpm for 15 min at 4°C. The supernatant was collected and the protein concentrations were determined by BCA™ protein assay. Samples were loaded and separated in 12% sodium dodecyl sulfate polyacrylamide (SDS-PAGE) gels and then transferred to polyvinylidene difluoride (PVDF) membrane. The membrane was blocked in 5% non-fat milk for 15 min and incubated overnight at 4°C with primary antibodies. The details of the primary antibodies used are as followed: Akt (4,685; Cell Signaling Technology), phos-Akt (4,060; Cell Signaling Technology), p38 (8,690; Cell Signaling Technology), phos-p38 (4,511; Cell Signaling Technology), JNK (9,252; Cell Signaling Technology), phos-JNK (4,668; Cell Signaling Technology), Erk (4,695; Cell Signaling Technology), phos-Erk (4,370; Cell Signaling Technology), CREB (9,197; Cell Signaling Technology), phos-CREB (9,198; Cell Signaling Technology), UCP-1 (Ab10983; Abcam),PGC1α (66369-1-Ig; proteintech), NRF2 (16396-1-AP; proteintech), GAPDH (10494-1-AP; proteintech), ACTB (20536-1-AP; proteintech). All the primary antibodies were incubated at the concentration of 1:1,000. Then, the membrane was washed with Tris-buffered saline with Tween and incubated with secondary antibodies at 25°C for 1 h. The images were presented using ECL luminous fluid (Advansta, America) on the imaging system (Li-cor Odyssey, America).
Removed the medium from the dishes, and the cells were washed with ice-cold PBS. The prewarmed solution containing 100 nM MitoScene TM Green II (US EVERBRIGHT, Jiangsu, China) was added and incubated in the dark for 30 min at 37°C. Then the cells were observed using a fluorescence microscope. The paraffin sections of adipose tissues were hydrated in a graded ethanol series (70–100%). MitoScene TM Green II (US EVERBRIGHT, Jiangsu, China) was used to determine the mitochondrial mass. The tissues were stained with mitochondria-specific dye at 37°C for 30 min and 4′6-diamidino-2-phenylindole for 15 min. Digital images (×200) were captured with a fluorescent microscope.
QIA amp DNA Mini Kit (Qiagen, Venlo, Netherlands) was used to extract total DNA (genomic and mitochondrial DNA) in C3H10T1/2 cells following the instructions. The concentration and quality of DNA were determined using NanoDrop 2000 analyzer (Thermo Scientific, United States). qPCR was performed with the QuantStudio six Flex Real-Time PCR System (Life Technologies, United States) using ChamQ SYBR qPCR Master Mix (Vazyme biotech) to analyze the copy number of mtDNA associated with genomic DNA. The primer sequences of COX one and cyclophilin A are shown in Table 1.
The section images of HE staining were used to calculate the individual adipocyte size (square area) by the delineation of the circumference of individual adipocytes using the NIH ImageJ software. For each image, the area of the individual adipocytes were sorted from the smallest to the largest. Subsequently, the total number of adipocytes and the mean adipocyte area were determined.
All data are presented as mean ± standard deviation (SD). Statistical analysis was performed using SPSS software. One-way ANOVA and Student t test was used to analysis the difference. p < 0.05 was considered statistically significant.
SFN is a small molecular compound with high energy chemical bonds (Figure 1A). The cell viability of C3H10T1/2 cells treated with different SFN concentrations was detected using CCK8 assays. The results revealed that the half-maximal inhibitory concentration (IC50) of SFN to C3H10T1/2 cells is 20 μM (Figure 1B). Thus, the maximum concentration we used in vitro experiment was 10 μM.
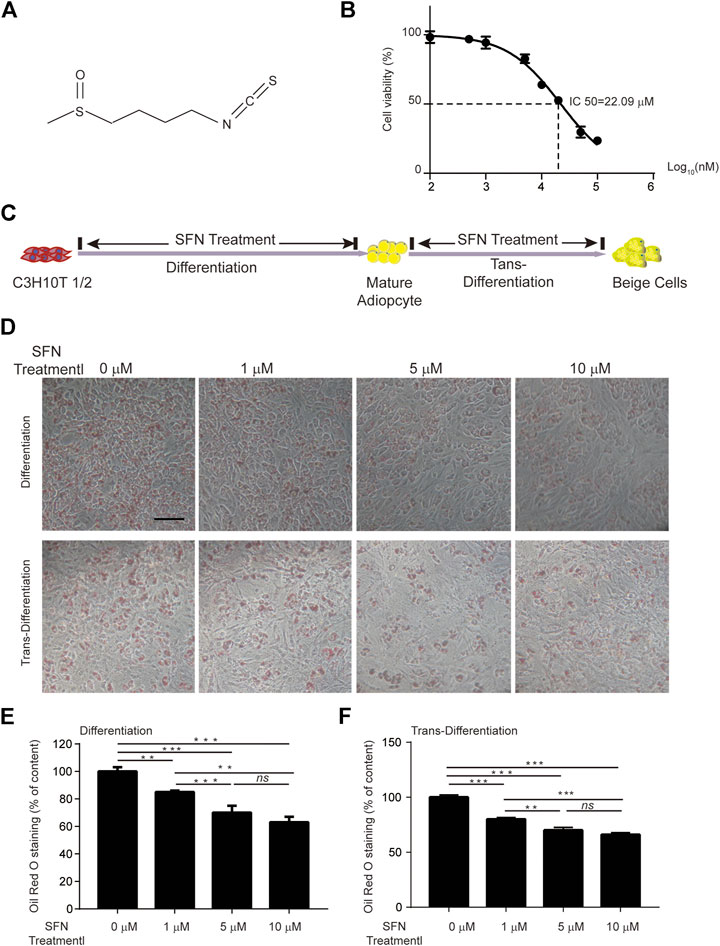
FIGURE 1. Effects of SFN on lipid droplet biogenesis during the differentiation or trans-differentiation of C3H10T1/2 cells. (A) Chemical structure of SFN. (B) IC50 of SFN on C3H10T1/2 cells. (C) Flow diagram of the experimental design (D) SFN inhibited the lipid accumulation in the differentiation of C3H10T1/2 cells and enhanced the trans-differentiation of adipocytes. Cells were fixed and stained with Oil red O. (E,F) Oil red O staining was quantified. Scar bar = 50 μm. All the results were expressed in graph with mean ± SD. Statistical significance was evaluated by ANOVA test. *, ** and *** represent the significant difference at p < 0.05, p < 0.001 and p < 0.0001. ns represent not significant.
The processes of adipogenic differentiation and browning were designed as shown in Figure 1C. During the induction of adipogenic differentiation, the cells were incubated with varying SFN concentrations (1–10 μM). We found that SFN considerably inhibits the differentiation of C3H10T1/2 cells into mature adipocytes and lipid content (Figures 1D,E). Furthermore, the lipid droplet decreased when the mature adipocytes were treated with SFN (Figures 1D,F). Mature adipocytes could trans-differentiate into other cell types, like beige cells, under certain conditions. The gene expression profile of C3H10T1/2 cells after SFN treatment showed that SFN inhibited the expression of core adipogenesis genes (Pparγ, Fas, Cebpβ and Scd1) and enhanced the expression of browning genes (Chop, Temem 26, Ucp1, Pgc-1α, and Prdm16) in adipocyte differentiation and trans-differentiation. This result suggested the possible conversion of white adipocytes into beige cells (Figures 2A,B).
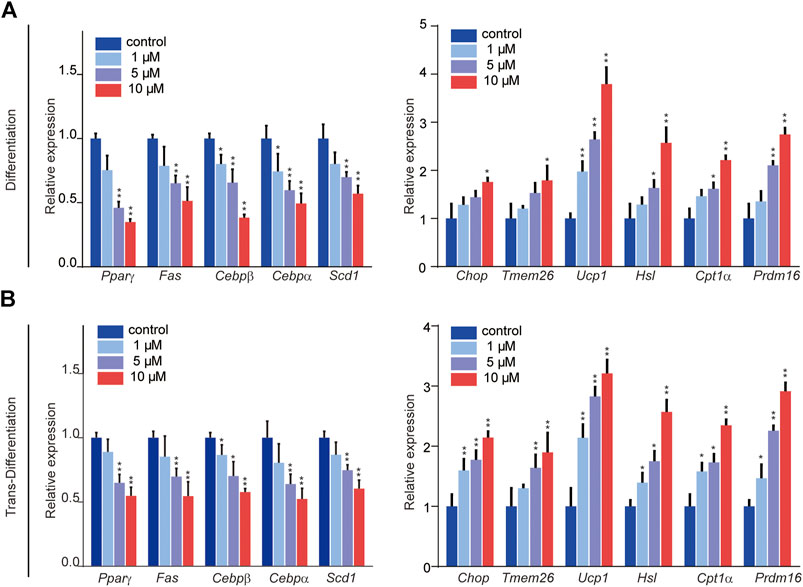
FIGURE 2. Effects of SFN on the expression of key adipocyte-specific markers (left) and browning-specific markers (right) in C3H10T1/2 adipocytes. (A,B) Total RNA was extracted at the end of the differentiation and trans-differentiation processes. mRNA expression was analyzed by real-time qPCR. The results were normalized to β-actin. All the results were expressed in graph with mean ± SD. Statistical significance was evaluated by Student t test. * and ** represent the significant difference at p < 0.05, p < 0.01 vs control group.
To explore the effect of SFN on weight gain in C57BL/6 mice, the 8-week-old female mice treated with 10 mg/kg/day SFN were noticeably protected from weight gain (Figure 3B). We assessed food intake in mice treated with SFN or vehicle. As shown in Figure 3A, SFN did not alter food intake. Therefore, the loss of weight gain is not the result of reduced calorie intake.
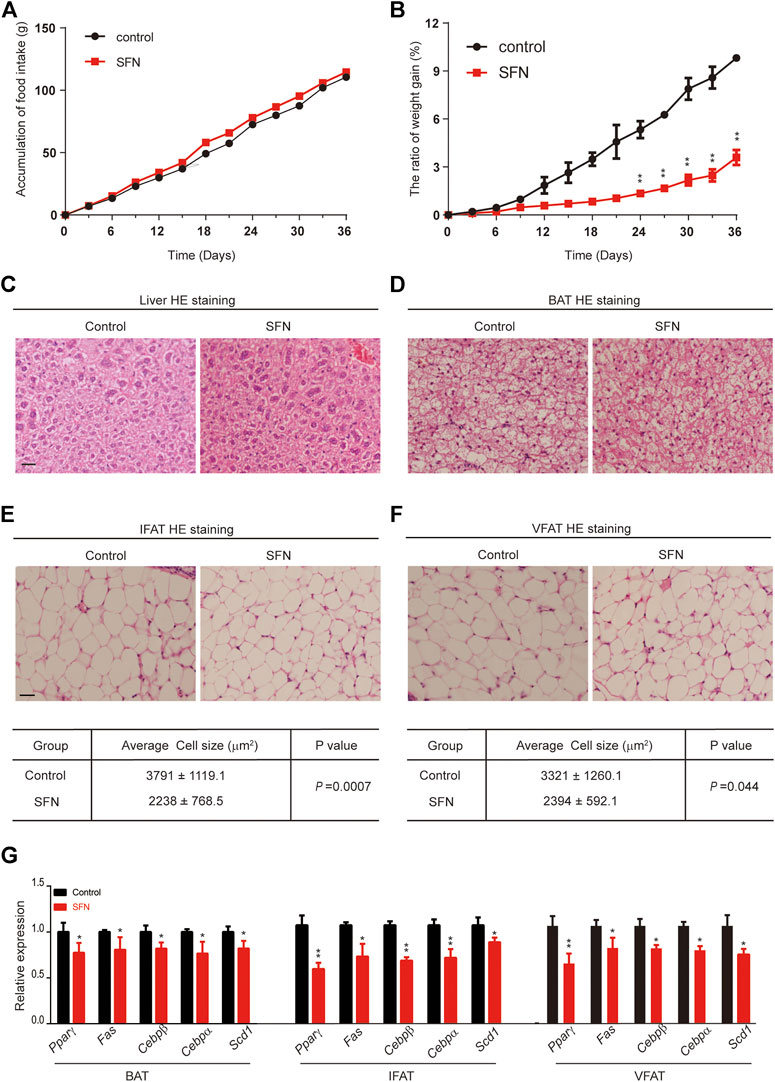
FIGURE 3. SFN impairs adipose cell differentiation in mice fed with normal diet. (A,B) SFN did not influence food intake but decreased weight gain. n = 7/group, **p < 0.01 vs. control. (C,D) Histology analysis of the effect of SFN on the cell morphology of the liver and BAT. (E,F) SFN decreased the adipose cell size of IWAT and VWAT. (G) SFN decreased the adipogenesis gene expression in WAT. Scar bar = 50 μm. All the results were expressed in graph with mean ± SD. Statistical significance was evaluated by Student t test. * and ** represent the significant difference at p < 0.05, p < 0.01 vs control group.
Next, we performed HE staining on the sections of liver tissue, BAT, inguinal fat adipose tissue (IFAT), and visceral fat adipose tissue (VFAT). SFN had no toxic effect on body metabolism as the staining morphological analysis revealed no difference in liver tissue and BAT (Figures 3C,D). The average of adipocyte area in IFAT and VFAT in the SFN-treated group were considerably smaller than those in the vehicle-treated group (Figures 3E,F). The relative expression of adipogenic-specific genes was examined by qPCR (Figure 3G). SFN remarkably downregulated the mRNA expression of adipogenic-specific genes compared with vehicle control. Next, we examined the effect of SFN on the browning of adipose tissue. The immunohistochemistry staining showed that, in the SFN-treated group, the level of UCP1 in fat tissues was higher than in the vehicle-treated group (Figure 4A). The expression of browning marker genes indicated that brown fat marker genes (Chop, Temem26, Ucp1, Pgc-1α, Prdm16, Hsl and Cpl1α) were remarkably upregulated in fat tissues in the SFN group (Figure 4B).
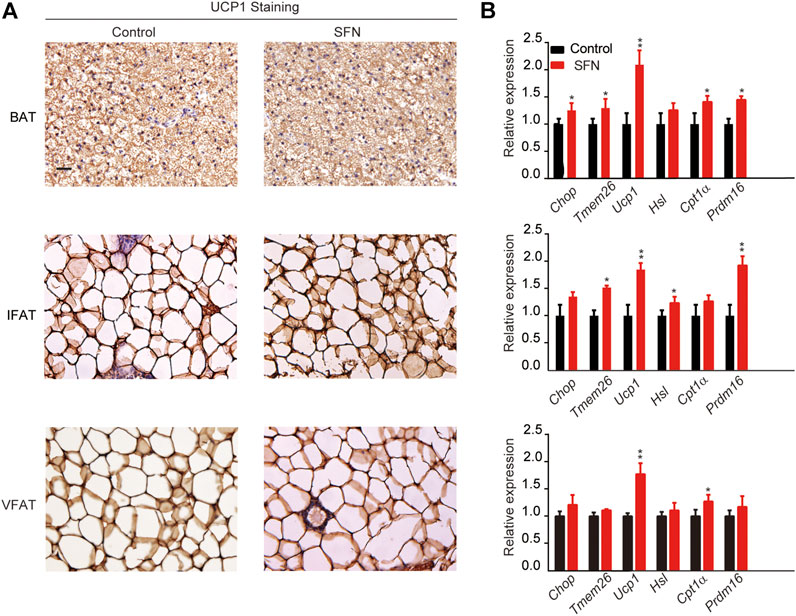
FIGURE 4. SFN promotes WAT browning in HFD-induced mice. (A) Immunostaining for UCP1 in the adipose tissue sections of BAT, IWAT, and VWAT from experiment mice. (B) SFN enhanced the browning gene expression in BAT, IWAT, and VWAT as determined by real-time qPCR assay. Scar bar = 50 μm. All the results were expressed in graph with mean ± SD. Statistical significance was evaluated by Student t test. * and ** represent the significant difference at p < 0.05, p < 0.01 vs control group.
Next, we explored the effect of SFN on HFD-induced obesity in C57BL/6 mice. SFN (10 mg/kg/day) was intraperitoneally injected into female HFD fed C57BL/6 mice. After 36 days of injection, the SFN- and vehicle-treated groups had no difference in total food intake (Figure 5A). However, the rate of body weight gain in the SFN-treated group was considerably lower than that of the vehicle-treated group (Figure 5B). In addition, SFN substantially decreased the volume and weight of inguinal fat compared with the vehicle-treated group (Figures 5C,D). GTT and ITT were performed to investigate the effect of SFN on metabolism. The SFN-treated mice showed remarkable improvement in glucose and insulin tolerance compared with vehicle control (Figures 5E,F).
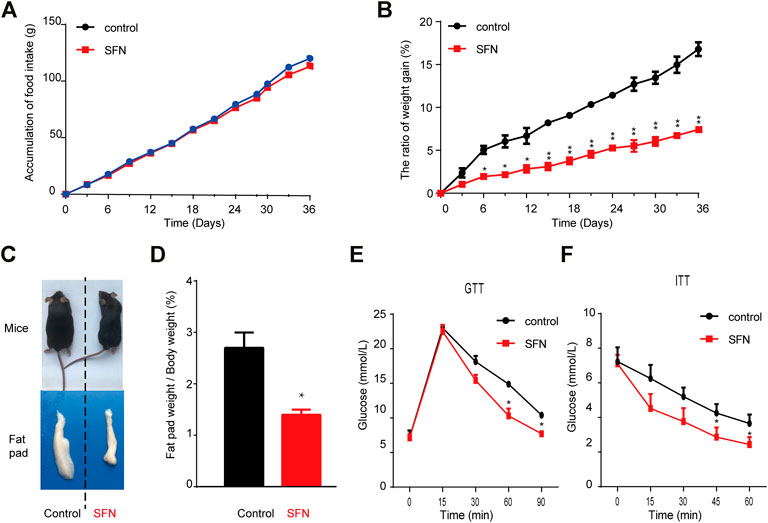
FIGURE 5. SFN prevented HFD-induced obesity. (A,B) SFN had no effect on food intake but decreased body weight gain, n = 7/group, *p < 0.05, **p < 0.01 vs. control. (C) Representative photograph of HFD-induced mice and SFN-treated HFD-induced mice (D) Percent of fat pad weight to the whole body weight. (E,F) GTT and ITT in control and SFN-treated groups. n = 7/group. All the results were expressed in graph with mean ± SD. Statistical significance was evaluated by Student t test. * and ** represent the significant difference at p < 0.05, p < 0.01 vs control group.
HE staining showed that the morphology of liver cells was affected by HFD (Figure 6A). The steatosis in livers caused by HFD was largely ameliorated after SFN treatment. HE staining was also performed to detect the morphological alteration in fat tissues. The results showed that the BAT cells of the SFN-treated group had more multilocular lipid droplets (Figure 6B), and that the cell sizes of IFAT (Figures 6C,D) and VFAT (Figures 6E,F) remarkably decreased in the SFN group. Aside from the effects on morphological characteristics, the mRNA level of adipogenesis-specific genes was substantially reduced in the SFN group (Figure 6G). Thus, we drew the conclusion that SFN could inhibit adipogenesis in HFD-fed mice.
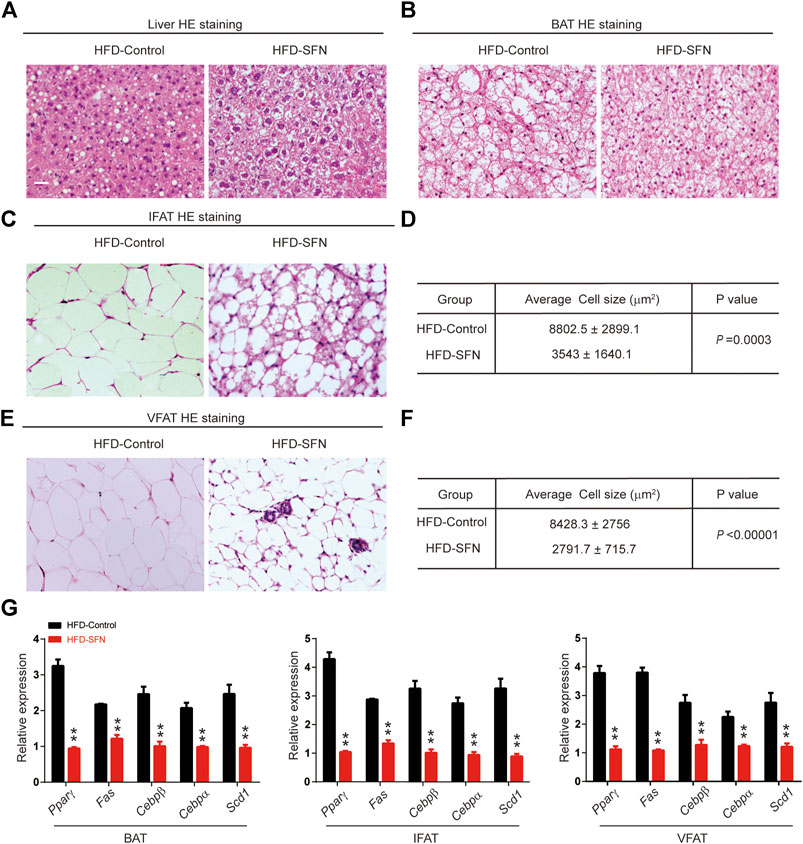
FIGURE 6. SFN prevented lipid accumulation in HFD-induced mice. (A,B) HE staining showed the effect of SFN on the liver and BAT. (C–F) SFN reduced the lipid droplets and the size of adipose cell from IWAT and VWAT. (G) Changes in the expression adipogenesis genes in different adipose tissues from HFD-induced obese mice without SFN treatment. Scar bar = 50 μm. All the results were expressed in graph with mean ± SD. Statistical significance was evaluated by Student t test. * and ** represent the significant difference at p < 0.05, p < 0.01 vs control group.
Immunohistochemistry was performed to understand the mechanism by which SFN exerted its fat-browning effect. SFN treatment upregulated the expression of UCP1 in adipose tissues (Figure 7A). Furthermore, we analyzed the expression of brown adipocyte marker genes that exhibited altered expression levels in adipose tissues (Figure 7B). The expression of brown adipocyte marker genes were substantially elevated compared with the control group.
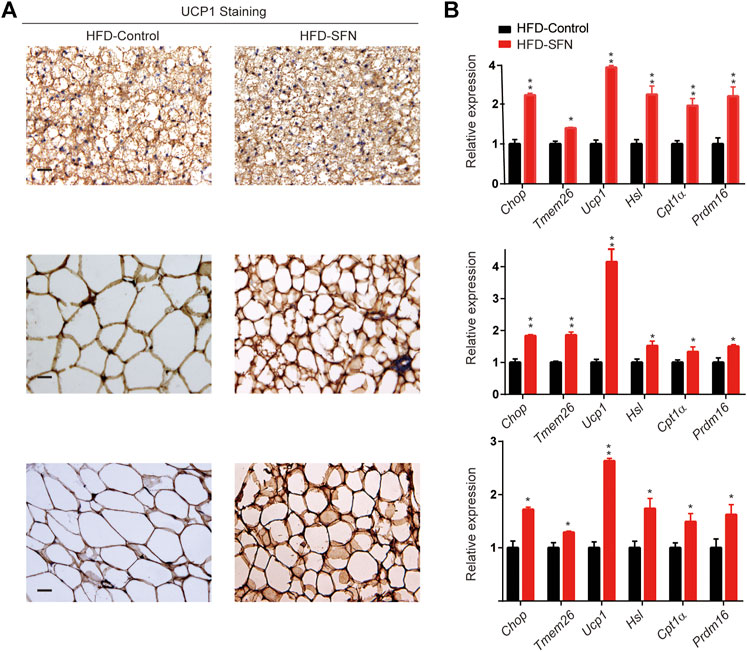
FIGURE 7. SFN induced WAT browning in HFD-induced mice. (A) Immunostaining for UCP1 in adipose tissue sections of BAT, IWAT, and VWAT from experiment mice. (B) SFN enhanced the expression of browning genes in BAT, IWAT, and VWAT as determined by real-time qPCR assay. Scar bar = 50 μm. All the results were expressed in graph with mean ± SD. Statistical significance was evaluated by Student t test. * and ** represent the significant difference at p < 0.05, p < 0.001 vs control group.
The browning effect of SFN is associated with the regulation of the NRF2/PGC-1α and MAPK pathways and the increase in mitochondrial biogenesis.
C3H10T1/2 cells were treated with SFN for 1 h to further verify the function of SFN on WAT browning. The results showed that the MAPK pathway was activated during browning (Figure 8A). Then, we investigated the protein level of the Nrf2/PGC-1α pathway in C3H10T1/2 cells treated with SFN in adipogenic differentiation and trans-differentiation. As shown in Figure 8B, SFN markedly increased the levels of these proteins in a dose-dependent manner. (The original films were shown in Supplementary Material). The results demonstrated that the NRF2/PGC-1α and MAPK pathways could be activated by SFN. The MitoScene Green staining was used to observe mitochondrial biosynthesis in SFN-treated cells (Figure 8C). The results showed that fluorescence intensity was increased by SFN treatment, and the cells treated with 10 μM SFN showed the highest fluorescence intensity. The ratio of mtDNA to nuclear DNA was dramatically increased by SFN (Figure 8D). Furthermore, we found that the mitochondrial biosynthesis in the WAT of SFN-treated mice fed with HFD was elevated compared with that in vehicle control (Figure 8E) by immunostaining.
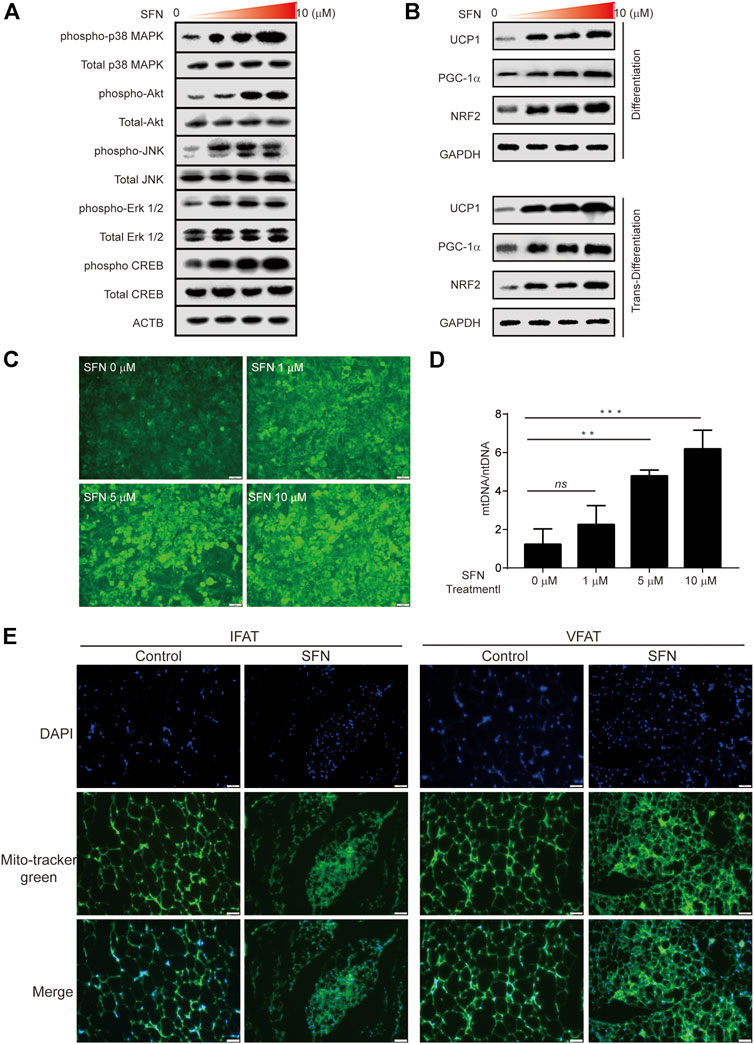
FIGURE 8. SFN promoted the browning of adipocytes through mitochondrial biogenesis. (A) SFN activated the MAPK and PKA–CREB pathway. (B) SFN promoted the expression of UCP1, PGC-1α, and NRF2 in the adipocyte differentiation and trans-differentiation periods. (C) Distribution of adipocyte mitochondria as assessed by MitoTracker Green staining. (D) The copy number of mtDNA per adipocyte was assessed by real-time qPCR. (E). Scar bar = 50 μm. The content of adipocyte mitochondria assessed by MitoTracker Green staining in the adipose tissue section of HFD-induced mice. All the results were expressed in graph with mean ± SD. Statistical significance was evaluated by ANOVA test. *, ** and *** represent the significant difference at p < 0.05, p < 0.001 and p < 0.0001. ns represent not significant.
There are mainly three types of adipose tissue in mammals: WAT, BAT, and beige adipose tissue (Hildebrand et al., 2018). WAT and BAT play different roles in lipid metabolism (Srivastava and Veech, 2019). Beige adipose develops postnatally and is highly inducible. Beige adipocyte recruitment, like white-to-brown adipocyte, is mediated by multiple factors, such as sympathetic nervous system activation and pharmacological conditions (Paulo and Wang, 2019). Metabolic disease, including obesity, can be prevented by activating the activities of brown and beige adipocytes, which has received much more attention (Heeren and Scheja, 2018). In this study we examined the effects of SFN on adipogenic differentiation in C3H10T1/2 preadipocytes and lipid metabolism regulation in HFD-fed obese C57BL/6 mice. We identified that SFN effectively inhibits the preadipocytes’ differentiation and enhances the mature adipocytes’ trans-differentiation into beige cells. Moreover, our in vivo experiment results confirmed that SFN treatment substantially decreased the adipocyte size and body weight gain, and further prevented HFD-induced obesity through the browning of adipocytes via mitochondrial biogenesis and the activation of Ucp1 and Pgc1-α.
The common way to prevent obesity is to inhibit adipogenesis (Roman et al., 2015). Here, we report that SFN showed a distinct anti-adipogenesis activity in adipocytes. SFN treatment can substantially inhibit the expression of adipogenesis-specific genes, such as Pparγ, Fas, Cebpβ and Scd1, in vivo and in vitro and reduce lipid accumulation in pre-adipocyte differentiation. In the present study, SFN drastically decreased adipocyte size in inguinal and visceral adipose tissues compared with the control in mice fed with normal diet or HFD; thus, SFN could inhibit adipogenesis and lipid accumulation remarkably.
Beige adipocytes are interspersed in WAT (Giralt and Villarroya, 2013). Recently, it was well known that adipocytes can trans-differentiate into beige adipocytes through browning (Bartelt and Heeren, 2014). Adipocyte browning can promote the energy metabolism and insulin resistance contributing to the body weight loss. (Carey and Kingwell, 2013). In an in vivo study, the fusion of lipid droplet can be enhanced by the inducer in differentiate medium, while the transformation of beige adipocyte is promoted by SFN treatment (Zhang et al., 2016). Similarly, we observed that SFN induced browning in HFD-induced obese mice. The inhibition of lipogenesis and the reduction of intracellular lipid content by SFN was resulting from the enhancement of energy expenditure via promoting the energy metabolism of adipocyte. We detected the beige adipocyte-related biomarkers to prove the formation of beige adipocyte formation after SFN treatment. In this study, SFN drastically increased the transcriptional and translational level of beige adipocyte-related genes including Ucp1, Pgc1-α and Prdm16 compared with the control. These data revealed that SFN can suppress the formation of white adipocytes while stimulate the beige adipocyte formation.
No previous study has reported that SFN has anti-obesity activity in animal via adipocyte browning. In our research, we observed no changes in food intake accumulation, but body weight gain was attenuated in the SFN-treated group. The expression of Pparγ and Cebpα were induced by HFD in murine adipose tissue. Accordingly, the inhibition of these two genes in adipose tissue can prevent obesity (Choi et al., 2014). By regulating various genes responsible for adipogenesis Pparγ and Cebpα play essential roles in adipocyte metabolism (Wang et al., 2020). In parallel with these previous studies, our data indicated that the expression of Pparγ and Cebpα can be drastically inhibited by SFN in inguinal and visceral adipose tissues and even in BAT. We observed similar effect of SFN in both female and male mice while white fat browning is more pronounced in female mice (data not shown). Gender differences may be involved in the white fat browning process (Chang et al., 2018; Shao et al., 2020) and potential mechanism needs more and further research.
UCP1 is abundant in the mitochondria of BAT, which plays a crucial role in the production and consumption of energy as well as beige fat (Ruan, 2020). The browning of white adipose, where WAT trans-differentiate into beige adipose tissue, is directly associated with increasing the quantity of mitochondria and promoting mitochondrial function in adipose tissue (M. Liu et al., 2019). Here, we showed that SFN has a positive effect on mitochondrial contents and induces the elevation of the gene expression levels of related mitochondrial biogenesis biomarkers, including Pgc1-α. The activation of these biomarkers could furthermore contribute to the expression of downstream transcription factors. We used immunofluorescence by MitoTracker Green to assess mitochondrial content and better understand the importance of SFN in mitochondrial biogenesis. SFN-treated adipocytes showed remarkably increased mitochondrial activity. Adipocytes treated with SFN appeared to have a remarkable improvement in mitochondrial activity. In general, these findings indicated that the differentiation of adipocyte had a direct relation with the adjustment of the energy metabolism. In addition, SFN enhance the browning of adipocyte via upregulating Ucp1 expression.
Oxidative stress is considered to play a vital role in cell injury and metabolic disorders in different kinds of diseases (Vona et al., 2019). It is believed that mitochondria are major production place of reactive oxygen species (ROS) (Lejri et al., 2019). Lipid overaccumulation results in a significant activation of intracellular ROS accumulation, leading to intensified oxidative process in obesity. This alteration can damage mitochondrial function, causing higher reactive oxygen species production (Brunetta et al., 2020). SFN has been proven to be an effective compound that prevents oxidative stress through the activation of Nrf2 (D. Li et al., 2020). Pgc-1α and Nrf2 were two of the important modulating factors in mitochondrial biogenesis (Kasai et al., 2020). Moreover, it has been reported that SFN could improve mitochondrial content, which means SFN could alter mitochondrial biogenesis (Lei et al., 2019). Correspondingly, SFN exhibited an adverse effect against the decline of mtDNA content in mice fed with HFD. In the present study, the inhibition of adipogenesis and the promotion of adipocyte browning by SFN was related to its antioxidant capacity for inducing mitochondrial biogenesis.
Due to the cellular expansion, the MAPK pathway is downregulated in the early adipogenesis and would be suppressend for adipogenesis. (Jang et al., 2015). However, in our study, at the period of trans-differentiation, the MAPK pathway was upregulated because of SFN treatment. Some studies confirmed the positive role of MAPK pathway in browning of adipocytes in 3T3-L1 cells. (Bae and Kim, 2020). Our present study also supported that the augmentation of browning by SFN treatment is involved with the activation of MAPK pathway at the late period of adipogenesis. Hence, MAPK pathway possibly has a beneficial effect on the promotion of browning adipogenesis.
In the present study, we demonstrated that SFN could attenuate adipogenesis and explored the underlying mechanisms. SFN triggered the browning of C3H10T1/2 adipocytes via upregulating the expression of biomarkers concerned with brown adipocyte as well as mitochondrial biogenesis in vivo and in vitro, and inhibiting mitochondrial oxidative stress. Our study suggests that SFN, as a nutritional factor, is a promising medicine in the battle against obesity and various metabolic disorders via promoting the browning of white fat and improving glucose metabolism. Thus SFN may be used in new strategies for the prevention and inhibition of obesity and related diseases.
The raw data supporting the conclusions of this article will be made available by the authors, without undue reservation, to any qualified researcher.
The animal study was reviewed and approved by the Institutional Animal Care and Use Committee of Wuhan University, China.
Methodology: YL, XF, CZ, TL, ZC, YJ and ZB; data curation: YL, XF, CZ, TL, ZC, YJ and ZB; formal analysis: YL, XF, CZ, TL, ZC, YJ and ZB; writing—original draft preparation, YL, ZC, TL and YJ; writing—review and editing: XF, YJ, CZ and ZB. All authors have read and agreed to the published version of the manuscript.
This research was funded by the National Natural Science Foundation of China (No. 81700772 for Yaoting Ji, No. 81970923 for Zhuan Bian, No. 81900987 for Xiazhou Fu).
The authors declare that the research was conducted in the absence of any commercial or financial relationships that could be construed as a potential conflict of interest.
The Supplementary Material for this article can be found online at: https://www.frontiersin.org/articles/10.3389/fphar.2021.665894/full#supplementary-material
Ahima, R. S., and Lazar, M. A. (2013). The Health Risk of Obesity-Better Metrics Imperative. Science 341 (6148), 856–858. doi:10.1126/science.1241244
Bae, I.-S., and Kim, S. H. (2020). Sinapic Acid Promotes Browning of 3T3-L1 Adipocytes via P38 MAPK/CREB Pathway. Biomed. Res. Int. 2020, 1–8. doi:10.1155/2020/5753623
Bargut, T. C. L., Souza-Mello, V., Aguila, M. B., and Mandarim-de-Lacerda, C. A. (2017). Browning of White Adipose Tissue: Lessons from Experimental Models. Horm. Mol. Biol. Clin. Investig. 31 (1), 1–13. doi:10.1515/hmbci-2016-0051
Bartelt, A., and Heeren, J. (2014). Adipose Tissue Browning and Metabolic Health. Nat. Rev. Endocrinol. 10 (1), 24–36. doi:10.1038/nrendo.2013.204
Brunetta, H. S., Politis-Barber, V., Petrick, H. L., Dennis, K. M. J. H., Kirsh, A. J., Barbeau, P. A., et al. (2020). Nitrate Attenuates High Fat Diet-Induced Glucose Intolerance in Association with Reduced Epididymal Adipose Tissue Inflammation and Mitochondrial Reactive Oxygen Species Emission. J. Physiol. 598 (16), 3357–3371. doi:10.1113/jp279455
Carey, A. L., and Kingwell, B. A. (2013). & therapeuticsBrown Adipose Tissue in Humans: Therapeutic Potential to Combat Obesity. Pharmacol. Ther. 140 (1), 26–33. doi:10.1016/j.pharmthera.2013.05.009
Chang, E., Varghese, M., and Singer, K. (2018). Gender and Sex Differences in Adipose Tissue. Curr. Diab Rep. 18 (9), 69. doi:10.1007/s11892-018-1031-3
Choi, K.-M., Lee, Y.-S., Kim, W., Kim, S. J., Shin, K.-O., Yu, J.-Y., et al. (2014). Sulforaphane Attenuates Obesity by Inhibiting Adipogenesis and Activating the AMPK Pathway in Obese Mice. J. Nutr. Biochem. 25 (2), 201–207. doi:10.1016/j.jnutbio.2013.10.007
Giralt, M., and Villarroya, F. (2013). White, Brown, Beige/brite: Different Adipose Cells for Different Functions? Endocrinology, 154(9), 2992–3000. doi:10.1210/en.2013-1403
Heeren, J., and Scheja, L. (2018). Brown Adipose Tissue and Lipid Metabolism. Curr. Opin. Lipidol. 29 (3), 180–185. doi:10.1097/mol.0000000000000504
Herz, C. T., and Kiefer, F. W. (2019). Adipose Tissue Browning in Mice and Humans. J. Endocrinol. 241(3), R97–R109. doi:10.1530/joe-18-0598
Hildebrand, S., Stümer, J., and Pfeifer, A. (2018). PVAT and its Relation to Brown, Beige, and White Adipose Tissue in Development and Function. Front. Physiol. 9, 70. doi:10.3389/fphys.2018.00070
Houghton, C. A. (2019). Sulforaphane: Its “Coming of Age” as a Clinically Relevant Nutraceutical in the Prevention and Treatment of Chronic Disease. Oxidative Med. Cell Longevity 2019, 1–27. doi:10.1155/2019/2716870
Jang, Y. J., Koo, H. J., Sohn, E.-H., Kang, S. C., Rhee, D.-K., and Pyo, S. (2015). Theobromine Inhibits Differentiation of 3T3-L1 Cells during the Early Stage of Adipogenesis via AMPK and MAPK Signaling Pathways. Food Funct. 6 (7), 2365–2374. doi:10.1039/c5fo00397k
Jeremic, N., Chaturvedi, P., and Tyagi, S. C. (2017). Browning of White Fat: Novel Insight into Factors, Mechanisms, and Therapeutics. J. Cel. Physiol 232 (1), 61–68. doi:10.1002/jcp.25450
Kasai, S., Shimizu, S., Tatara, Y., Mimura, J., and Itoh, K. (2020). Regulation of Nrf2 by Mitochondrial Reactive Oxygen Species in Physiology and Pathology. Biomolecules 10 (2), 320. doi:10.3390/biom10020320
Kopelman, P. (2007). Health Risks Associated with Overweight and Obesity. Obes. Rev. 8 (Suppl. 1), 13–17. doi:10.1111/j.1467-789X.2007.00311.x
Lei, P., Tian, S., Teng, C., Huang, L., Liu, X., Wang, J., et al. (2019). Sulforaphane Improves Lipid Metabolism by Enhancing Mitochondrial Function and Biogenesis In Vivo and In Vitro. Mol. Nutr. Food Res. 63 (4), 1800795, doi:10.1002/mnfr.201800795
Lejri, I., Agapouda, A., Grimm, A., and Eckert, A. (2019). Mitochondria- and Oxidative Stress-Targeting Substances in Cognitive Decline-Related Disorders: From Molecular Mechanisms to Clinical Evidence. Oxidative Med. Cell Longevity 2019, 1–26. doi:10.1155/2019/9695412
Li, D., Shao, R., Wang, N., Zhou, N., Du, K., Shi, J., et al. (2020). Sulforaphane Activates a Lysosome-dependent Transcriptional Program to Mitigate Oxidative Stress. Autophagy 15, 1–16. doi:10.1080/15548627.2020.1739442
Li, Z., Guo, H., Li, J., Ma, T., Zhou, S., Zhang, Z., et al. (2020). Sulforaphane Prevents Type 2 Diabetes-Induced Nephropathy via AMPK-Mediated Activation of Lipid Metabolic Pathways and Nrf2 Antioxidative Function. Clin. Sci. (Lond 134, 2469–2487. doi:10.1042/cs20191088
Liu, M., Zheng, M., Cai, D., Xie, J., Jin, Z., Liu, H., et al. (2019). Zeaxanthin Promotes Mitochondrial Biogenesis and Adipocyte Browning via AMPKα1 Activation. Food Funct. 10 (4), 2221–2233. doi:10.1039/c8fo02527d
Liu, P., Huang, S., Ling, S., Xu, S., Wang, F., Zhang, W., et al. (2019). Foxp1 Controls Brown/beige Adipocyte Differentiation and Thermogenesis through Regulating β3-AR Desensitization. Nat. Commun. 10 (1), 5070. doi:10.1038/s41467-019-12988-8
Montanari, T., Pošćić, N., and Colitti, M. (2017). Factors Involved in White-To-Brown Adipose Tissue Conversion and in Thermogenesis: a Review. Obes. Rev. 18 (5), 495–513. doi:10.1111/obr.12520
Paulo, E., and Wang, B. (2019). Towards a Better Understanding of Beige Adipocyte Plasticity. Cells 8 (12), 1552. doi:10.3390/cells8121552
Plaza, A., Merino, B., Cano, V., Domínguez, G., Pérez-Castells, J., Fernández-Alfonso, M. S., et al. (2018). Cholecystokinin Is Involved in Triglyceride Fatty Acid Uptake by Rat Adipose Tissue. J. Endocrinol. 236(3), 137–150. doi:10.1530/joe-17-0580
Roman, S., Agil, A., Peran, M., Alvaro-Galue, E., Ruiz-Ojeda, F. J., Fernández-Vázquez, G., et al. (2015). Brown Adipose Tissue and Novel Therapeutic Approaches to Treat Metabolic Disorders. Translational Res. 165 (4), 464–479. doi:10.1016/j.trsl.2014.11.002
Ruan, H.-B. (2020). Developmental and Functional Heterogeneity of Thermogenic Adipose Tissue. J. Mol. Cel Biol, 12, 775, 784. doi:10.1093/jmcb/mjaa029
Sanchez-Gurmaches, J., Hung, C.-M., and Guertin, D. A. (2016). Emerging Complexities in Adipocyte Origins and Identity. Trends Cel Biol. 26 (5), 313–326. doi:10.1016/j.tcb.2016.01.004
Shao, X., Chen, Y., Shao, X., Wang, S., Wang, S., and Wang, Y. (2020). Gender Differences in Brown Adipose Tissue-Related Brain Functional Networks. Nucl. Med. Commun. 41 (6), 526–532. doi:10.1097/MNM.0000000000001190
Srivastava, S., and Veech, R. L. (2019). Brown and Brite: The Fat Soldiers in the Anti-obesity Fight. Front. Physiol. 10, 38. doi:10.3389/fphys.2019.00038
Sun, Y., Zhou, S., Guo, H., Zhang, J., Ma, T., Zheng, Y., et al. (2020). Protective Effects of Sulforaphane on Type 2 Diabetes-Induced Cardiomyopathy via AMPK-Mediated Activation of Lipid Metabolic Pathways and NRF2 Function. Metabolism 102, 154002. doi:10.1016/j.metabol.2019.154002
Vidal, P., and Stanford, K. I. (2020). Exercise-Induced Adaptations to Adipose Tissue Thermogenesis. Front. Endocrinol. 11, 270. doi:10.3389/fendo.2020.00270
Vona, R., Gambardella, L., Cittadini, C., Straface, E., and Pietraforte, D. (2019). Biomarkers of Oxidative Stress in Metabolic Syndrome and Associated Diseases. Oxidative Med. Cell Longevity, 5, 1–19. doi:10.1155/2019/8267234
Wang, G., Wu, B., Zhang, L., Cui, Y., Zhang, B., and Wang, H. (2020). Laquinimod Prevents Adipogenesis and Obesity by Down-Regulating PPAR-γ and C/EBPα through Activating AMPK. ACS Omega 5 (36), 22958–22965. doi:10.1021/acsomega.0c02525
Keywords: sulforaphane, obesity, white adipose browning, browning, high-fat diet
Citation: Liu Y, Fu X, Chen Z, Luo T, Zhu C, Ji Y and Bian Z (2021) The Protective Effects of Sulforaphane on High-Fat Diet-Induced Obesity in Mice Through Browning of White Fat. Front. Pharmacol. 12:665894. doi: 10.3389/fphar.2021.665894
Received: 09 February 2021; Accepted: 15 April 2021;
Published: 29 April 2021.
Edited by:
Guanglong He, University of Wyoming, United StatesReviewed by:
Jinzhuo Zhao, Fudan University, ChinaCopyright © 2021 Liu, Fu, Chen, Luo, Zhu, Ji and Bian. This is an open-access article distributed under the terms of the Creative Commons Attribution License (CC BY). The use, distribution or reproduction in other forums is permitted, provided the original author(s) and the copyright owner(s) are credited and that the original publication in this journal is cited, in accordance with accepted academic practice. No use, distribution or reproduction is permitted which does not comply with these terms.
*Correspondence: Yaoting Ji, eWFvdGluZ2ppQHdodS5lZHUuY24=; Zhuan Bian, YmlhbnpodWFuQHdodS5lZHUuY24=
Disclaimer: All claims expressed in this article are solely those of the authors and do not necessarily represent those of their affiliated organizations, or those of the publisher, the editors and the reviewers. Any product that may be evaluated in this article or claim that may be made by its manufacturer is not guaranteed or endorsed by the publisher.
Research integrity at Frontiers
Learn more about the work of our research integrity team to safeguard the quality of each article we publish.