
94% of researchers rate our articles as excellent or good
Learn more about the work of our research integrity team to safeguard the quality of each article we publish.
Find out more
ORIGINAL RESEARCH article
Front. Pharmacol., 17 March 2021
Sec. Drugs Outcomes Research and Policies
Volume 12 - 2021 | https://doi.org/10.3389/fphar.2021.636048
This article is part of the Research TopicTherapeutic Drug Monitoring in Solid Organ TransplantationView all 9 articles
 Pere Fontova1,2,3Helena Colom4*Raül Rigo-Bonnin5,2
 Lisanne N. van Merendonk1,2,3Anna Vidal-Alabró1,2,3Nuria Montero1,2,3
 Edoardo Melilli1,2,3Maria Meneghini1,2,3
 Anna Manonelles1,2,3
 Josep M. Cruzado1,2,3Juan Torras1,2,3
 Josep Maria Grinyó1,2,3
 Oriol Bestard1,2,3
 Nuria Lloberas1,2,3*
Introduction: Tacrolimus is the backbone immunosuppressant after solid organ transplantation. Tacrolimus has a narrow therapeutic window with large intra- and inter-patient pharmacokinetic variability leading to frequent over- and under-immunosuppression. While routine therapeutic drug monitoring (TDM) remains the standard of care, tacrolimus pharmacokinetic variability may be influenced by circadian rhythms. Our aim was to analyze tacrolimus pharmacokinetic/pharmacodynamic profiles on circadian rhythms comparing morning and night doses of a twice-daily tacrolimus formulation.
Methods: This is a post-hoc analysis from a clinical trial to study the area under curve (AUC) and the area under effect (AUE) profiles of calcineurin inhibition after tacrolimus administration in twenty-five renal transplant patients. Over a period of 24 h, an intensive sampling (0, 0.5, 1, 1.5, 2, 3, 4, 6, 8, 12, 12.5, 13, 13.5, 14, 15, 20, and 24 h) was carried out. Whole blood and intracellular tacrolimus concentrations and calcineurin activity were measured by UHPLC-MS/MS.
Results: Whole blood and intracellular AUC12–24 h and Cmax achieved after tacrolimus night dose was significantly lower than after morning dose administration (AUC0–12 h) (p < 0.001 for both compartments). AUE0–12 h and AUE12–24 h were not statistically different after morning and night doses. Total tacrolimus daily exposure (AUC0–24 h), in whole blood and intracellular compartments, was over-estimated when assessed by doubling the morning AUC0–12 h data.
Conclusion: The lower whole blood and intracellular tacrolimus concentrations after night dose might be influenced by a distinct circadian clock. This significantly lower tacrolimus exposure after night dose was not translated into a significant reduction of the pharmacodynamic effect. Our study may provide conceptual bases for better understanding the TDM of twice-daily tacrolimus formulation.
Tacrolimus (Tac) is the most commonly used immunosuppressor after solid organ transplantation. After oral Tac administration, there is a large variability in the rate of absorption and bioavailability (Staatz and Tett, 2004; Hesselink et al., 2005). Therapeutic Tac doses are adjusted by monitoring the morning whole blood trough concentrations (Ctrough), even though some controversies remain regarding the relationship between Ctrough and clinical outcomes. The area under concentration-time curve (AUC) is the most accurate assessment of overall Tac exposure although it is difficult to implement in clinical daily practice (Wallemacq et al., 2009). Therefore, routine therapeutic drug monitoring (TDM) of morning trough concentrations remains as the standard of care. Data of correlations between Ctrough and AUC still remains a matter of discussion (Brunet et al., 2019). Marquet et al. (2018) reported that for twice-daily Tac formulation, the AUC0–12 h correlated better with C12 than C0. A poor correlation between Tac dosage and trough levels exists, thus further research of factors influencing Tac exposure is strongly recommended (Hesselink et al., 2005; Wallemacq et al., 2009).
Immunosuppressive drugs have pharmacokinetic (PK) characteristics that may be influenced by circadian rhythms. These biological rhythms have been singled out as one of the causes of intra- and inter-patient variability (Baraldo and Furlanut, 2006). Several studies have shown the influence of circadian rhythms in gastric pH, gastric emptying time, gastrointestinal transit time, cytochrome P450 (CYP) activity in the liver and renal function, among others (Labrecque and Bélanger, 1991; Baraldo and Furlanut, 2006). Therefore, circadian rhythms affect processes of absorption, distribution, metabolism, and elimination of drugs and ultimately drug exposure and efficacy (Ohdo, 2007). In this context, differences in the P-glycoprotein (Pgp, encoded by ABCB1 gene) efflux pump or in the CYP3A activity, could also affect morning and night Tac exposures (Hoffmeyer et al., 2000; Baraldo and Furlanut, 2006; Andreu et al., 2017).
In recent years, several studies have investigated the impact of circadian rhythms in twice-daily Tac formulation but whether there is a constant effect of Tac throughout a 24 h period remains to be concluded. Prado-Velasco et al. (2020) developed the first PK model-based study that supports the relationship between Tac concentration patterns and the circadian modulation of clearance and absorption suggesting that Tac intra-patient variability may be partially explained by circadian rhythms in Tac absorption and metabolism. However, most studies on twice-daily Tac formulation analyzed a low number of transplant patients, employed different Tac determination methodologies and fasting conditions (Min et al., 1996; Tada et al., 2003; Iwahori et al., 2005; Park et al., 2007; Satoh et al., 2008; Gustavsen et al., 2020). Notably, these studies have only evaluated Tac exposure after the morning dose during the 12 h intervals between the two daily doses (AUC0–12 h), but differences between the two AUCs (AUC0–12 h and AUC12–24 h) still need to be studied more comprehensively (Min et al., 1996; Tada et al., 2003; Iwahori et al., 2005; Park et al., 2007; Gustavsen et al., 2020). Despite various reports analyzing the PK differences between day- and night-time of twice-daily Tac administration, results continue to be controversial. Furthermore, the effect of circadian rhythms on intracellular Tac concentrations and, ultimately, on different calcineurin (CN) activity, has not been fully investigated yet. The intracellular Tac concentrations on its target site of action could better reflect Tac exposure and it has been correlated with clinical outcomes (Capron et al., 2012; Han et al., 2016; Francke et al., 2020).
Our aim was to investigate whether the influence of circadian timing system on whole blood following Tac administration of twice-daily Tac formulations have an impact on intracellular lymphocyte Tac concentrations and on its pharmacodynamics (PD) (measured as CN activity inhibition). For this purpose, PK/PD analysis comparing morning and night Tac AUCs in renal transplant patients was performed.
A post-hoc analysis of a prospective, non-randomized clinical trial was carried out at the Kidney Transplant Unit of Bellvitge University Hospital (clinicalTrials.gov NCT02961608) (Fontova et al., 2021). This clinical trial was conducted in accordance with the Declaration of Helsinki and with the local ethics committee. The study involved 25 adult recipients who received a kidney transplant at least 6 months before the inclusion. Main exclusion criteria for the PK/PD analysis included patients with severe gastrointestinal disorders or current infections and patients receiving concomitant drugs interacting with CYP3A enzymes. Recipients using twice-daily Tac formulation (Prograf® or Adoport®), with Ctrough between 5 and 10 ng/ml and who signed informed consent were recruited in this study. No changes of Tac doses at least for 2 weeks before the PK/PD analysis was mandatory. During the period of 24 h, PK and PD analysis was conducted by an intensive sampling on the following time-points: Pre-dose and at 0.5, 1, 1.5, 2, 3, 4, 6, 8, and 12 following morning Tac dose and 12, 12.5, 13, 13.5, 14, 15, 20, and 24 h following night Tac dose. The night sampling was reduced according to the nursery blood draw logistics. Tac doses were carried out at least 1 h before and 2 h after meals, every 12 h (at 8:00 am and 08:00 pm) and all patients received the same Mediterranean diet (breakfast: 9:30 am, lunch: 2:00 pm, snack: 5:00 pm, dinner: 09:00 pm).
The measurement of Tac concentrations in whole blood and intracellular in peripheral blood mononuclear cells (PBMCs) was performed using ultra-high-performance liquid chromatography coupled with tandem mass-spectrometry (UHPLC-MS/MS; Acquity®-TQD® mass spectrometer) using previously validated methods by our group (Rigo-Bonnin et al., 2015; van Merendonk et al., 2020). For intracellular Tac measurement, PBMCs isolation from whole blood was carried out using Ficoll density gradient. Thereafter, these PBMCs were lysed with a hypotonic lysis buffer. All Tac determinations showed concentrations higher than the limit of quantification either in whole blood or in intracellular compartments (0.65 and 0.126 ng/ml, respectively).
A non-compartmental PK analysis was carried out to estimate the most relevant exposure parameters from the individual concentration-time profiles obtained at steady-state conditions. Both the whole blood and intracellular concentration-time profiles were analyzed by using Phoenix-WinNonlin 64 v8.2. The parameters calculated were: trough concentration values (Ctrough), denoted as C0, trough concentration before morning dose; C12, trough concentration before night dose, C24, trough concentration 12 h after night dose; Cmax, peak concentration after each Tac dose; Tmax, time to reach Cmax; AUCs, areas under the concentration-time curves from 0 to 12 h time intervals after each morning (AUC0–12 h) and night (AUC12–24 h) doses calculated by the trapezoidal rule; Peak-trough fluctuation index (PTF) calculated as % PTF = 100 × [(Cmax − Ctrough)/Caverage] where Caverage, was estimated from the ratios AUC0–12/τ or AUC12–24/τ where τ = 12 h; Swing fluctuation index (SFI) estimated as % SFI = 100 × [(Cmax − Ctrough)/Ctrough]. Oral clearance values (CL/F) were also estimated from the ratios Dose/AUC.
The PD effect of Tac was based on measurements of CN activity in PBMCs using a method previously validated by our group (Fontova et al., 2019). Briefly, once PBMCs were isolated and lysed with the hypotonic buffer used for intracellular Tac determination, the lysate was incubated for 15 min at 30°C with an exogenous phosphorylated peptide (RIIp). The calcium-dependent CN activity dephosphorylates RIIp, and after solid-phase extraction, dephosphorylated peptide (RII) and its corresponding internal-standard (RII-IS, isotope-labelled RII) were determined by UHPLC-MS/MS. All the extractions showed RII levels higher than the limit of quantification (0.04 µM).
Distinct PD parameters were calculated from the CN activity-time profiles at steady-state conditions in PBMCs by using Phoenix-WinNonlin 64 v8.2. The parameters calculated were: trough CN activity (Itrough) denoted as, I0, trough CN activity before morning dose; I12, trough CN activity before night dose; I24, trough CN activity 12 h after night dose; Imin, minimum inhibition of CN activity, Inadir, maximum CN inhibition; Tnadir, time to achieve Inadir; AUEs, areas under the effect-time profiles from 0 to 12 h time intervals after morning (AUE0–12 h) and night (AUE12–24 h) doses estimated using the trapezoidal rule. The AUEs were evaluated from the percentage of inhibition curves considering either the Imin and Inadir from the 24 h time interval period as baseline following the Eqs. 1, 2 respectively:
where Ix was the CN activity at each experimental time.
Genomic DNA was extracted from a peripheral whole-blood sample using Maxwell RSC® (Promega Corporation, Sydney, Australia) and was stored at −80°C. Genotyping of the CYP3A5*3 G > A (rs776746), CYP3A4*22 C > T (rs35599367) and ABCB1 3435C > T (rs1045642) polymorphisms (SNPs) was carried out using TaqMan SNP Genotyping Assay (Applied Biosystems, Foster City, CA, United States) in 384-well plates that included positive and negative controls. Real-time PCRs were carried out on the 7900HT Fast Real-time PCR System, Applied Biosystems (Thermo Fisher Scientific, Waltham, MA, United States), following standard recommendations. Briefly, 0.5 µl of each probe was mixed with 5 µl iTaq Universal Probes Supermix, 1 µl genomic DNA (10–20 ng/μl) and 3.5 µl of DNAse free water. The Real-time conditions were heat to 50°C for 2°min and 95°C for 10 min in the thermal cycler. This was then followed by 40 cycles of denaturization at 95°C for 15°s and annealing/extending at 60°C for 1 min. Samples were genotyped in CCiT-UB (Centres Científics i Tecnològics) at University of Barcelona, Campus Bellvitge.
Continuous variables derived from intracellular and whole blood Tac concentration-time and CN activity-time profiles were expressed as geometric mean [95% geometric mean interval confidence]. Tac exposure PK parameters and CN activity PD parameters estimated after the morning and night doses were compared by means of a two-sided paired t-test of natural log-transformed values. In contrast, Wilcoxon tests were performed for non-parametric variables such as Tmax and Tnadir. Correlations between the PD and PD parameters were evaluated by the parametric Pearson’s correlation test. Finally, demographic and non-continuous variables were described as median [interquartile range]. Statistical significance was set at α = 0.05. The statistical packages IBM SPSS v23 and Graphpad Prism 6.0 were used for the statistical analyses.
Twenty-five renal transplant recipients from Bellvitge University Hospital were included in the clinical trial between 2016 and 2018. Patients received an immunosuppressive maintenance therapy consisting of twice-daily Tac with mycophenolate and corticosteroids. Three patients with asymmetric morning and night Tac doses were excluded from this PK/PD analysis. The demographic, CYP3A and ABCB1 pharmacogenetics and clinical characteristics of the twenty-two patients are shown in Table 1.
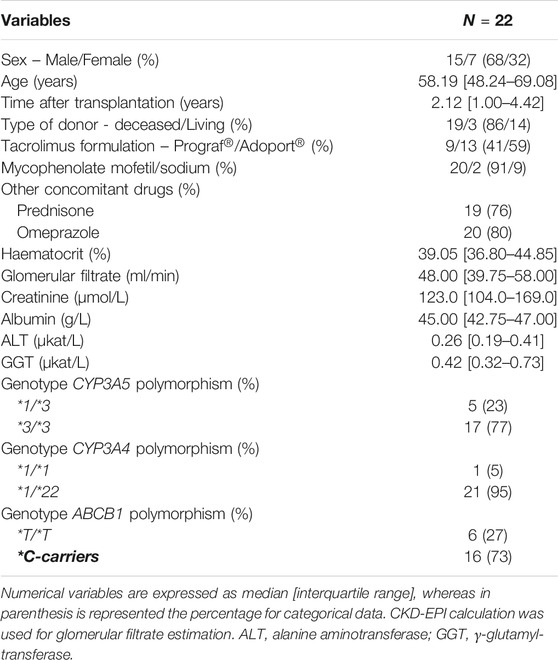
TABLE 1. Baseline characteristics of the recipients included in the study (n = 22).
The observed mean Tac concentration-time profiles in whole blood after morning and night doses are shown in Figure 1A. The AUC, Caverage and Ctrough values were higher after the morning dose than the night doses (Table 2). CL/F was 25% higher after the morning dose with respect to the 12–24 h dosing interval. After the morning dose, a higher Cmax was achieved than after the night dose. This was paired with a tendency to shorter Tmax after the morning dose compared to the night dose, although it did not reach statistical significance (p = 0.182). Also, a higher fluctuation (PTF and SFI) was observed after morning dose as compared to the night dose, whereas Ctrough/AUC ratios were lower after the morning dose (Table 2).
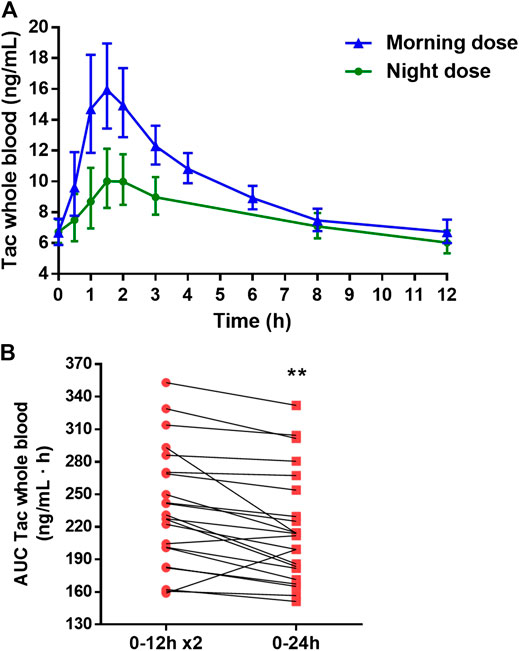
FIGURE 1. (A) Whole blood tacrolimus (Tac) concentration-time profiles along 12 h dose interval after the administration of morning and night dose of twice-daily Tac. (B). Estimation of the total Tac daily exposure (AUC0–24 h) in whole blood (red square) by doubling the Tac exposure after the morning Tac dose (AUC0–12 x2) (red round). Each point joined by a line represented one patient. Paired t-test between both estimations was applied. **p < 0.01.
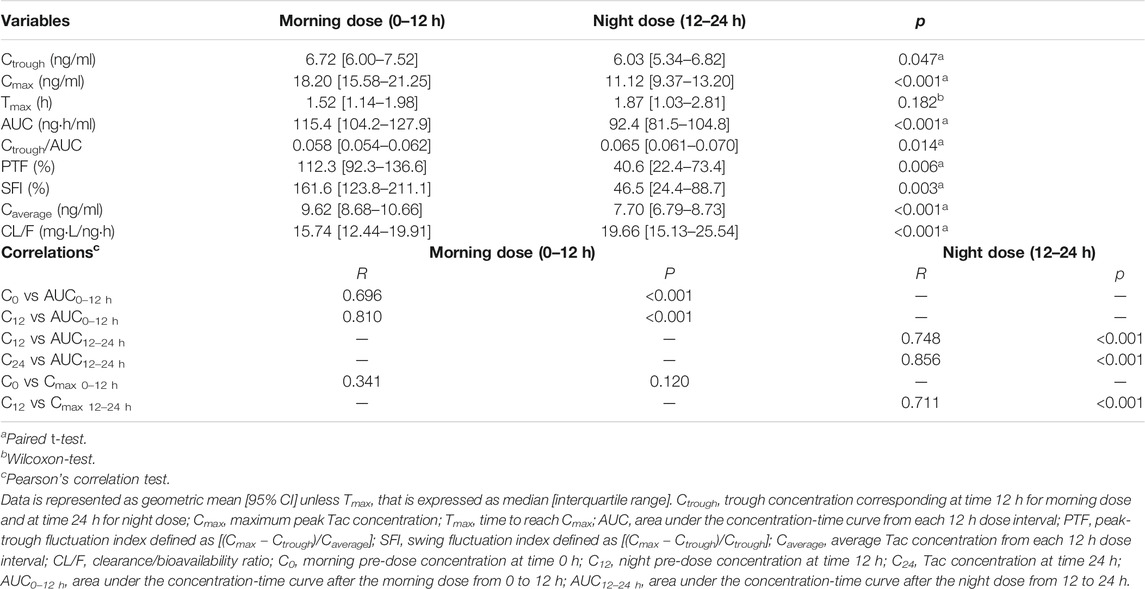
TABLE 2. Comparison of tacrolimus (Tac) pharmacokinetic variables in whole blood and their corresponding correlations after morning Tac dose (0–12 h) and after night Tac dose (12–24 h) of twice-daily Tac formulation.
Furthermore, a significant overestimation of the total daily Tac exposure was observed when the AUC0–24 h was assessed by doubling the morning AUC0–12 (p = 0.002) (Figure 1B). In most patients, such overestimation was higher than 5% (16/22) and in some patients greater than 10% (8/22).
As also shown in Table 2, correlation between Ctrough and Cmax was only observed after the night dose. Strong correlations were also found between AUC0–12 and C12 and between AUC12–24 and C24 (r ∼ 0.8), although weaker correlations between AUC0–12 and C0 or AUC12–24 and C12 were also found (r ∼ 0.7). Scatter plots of these correlations are represented in Supplementary Figure S1.
The influence of genotypes on circadian rhythms was assessed. Frequencies observed in the present study were in accordance with reported allele frequencies in a Caucasian population and did not deviate from Hardy–Weinberg distribution. All patients were of Caucasian ethnicity. A three-way analysis of variance was applied for log-transformed normalized by dose AUC values with daytime (morning and night) and SNP (CYPA3A4, CYP3A5 or ABCB1) as fixed factors and patient as a random factor nested within SNP. Statistically significant differences were always found between daytimes (p < 0.001), CYP3A5 SNP (p < 0.001), but not between ABCB1 (p = 0.533) and CYP3A4 SNPs (p = 0.324). Therefore, in this line, CYP3A5 1*/3* patients showed lower AUC/Dose than CYP3A5 3*/3* (p < 0.001) in both morning and night dose.
PK profiles of intracellular Tac measured in PBMCs were comparable to whole blood PK profiles (Figure 2A). Once again, Tac exposures given by AUCs, Caverage and Ctrough were higher in the morning when compared to the night dosing interval (Table 3). Similarly, to whole blood, after the morning Tac dose, a higher intracellular Cmax was observed compared to the night dose. Meanwhile, no statistically significant differences were found between Tmax values, nevertheless there was a tendency towards greater values at night with respect to the day-time dose (Table 3). This was in accordance with a more fluctuating profile (PTF and SFI values) after the morning dose in contrast to the night dose. No differences regarding, Ctrough/AUC ratios were found between both time settings (morning and night) although numerically higher values were observed after night dose (p = 0.085).
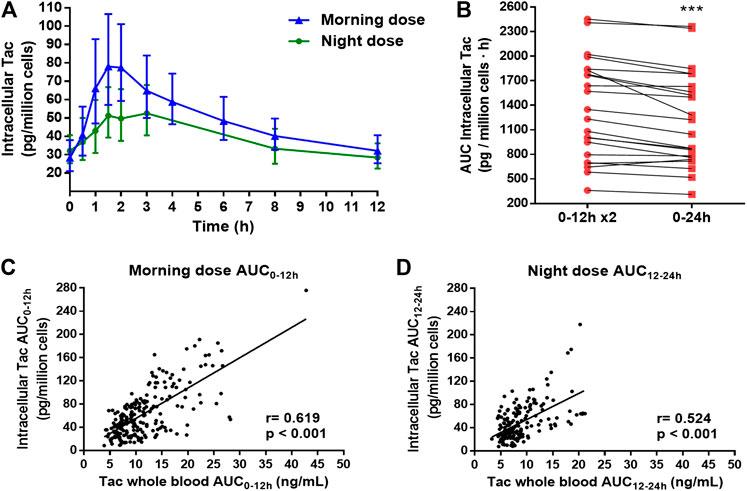
FIGURE 2. (A) Intracellular tacrolimus (Tac) concentration-time profiles along 12 h dose interval after the administration of morning and night dose of twice-daily Tac. (B). Estimation of the total intracellular Tac daily exposure (AUC0–24 h) (red square) by doubling the Tac exposure after the morning Tac dose (AUC0–12 x2) (red round). Each point joined by a line represented one patient. Paired t-test between both estimations was applied. **p < 0.001. (C,D) Correlations between all whole blood Tac concentrations and intracellular Tac concentrations sampling after morning and night dose, respectively. Pearson test of Ln transformed data were performed for correlation analysis.
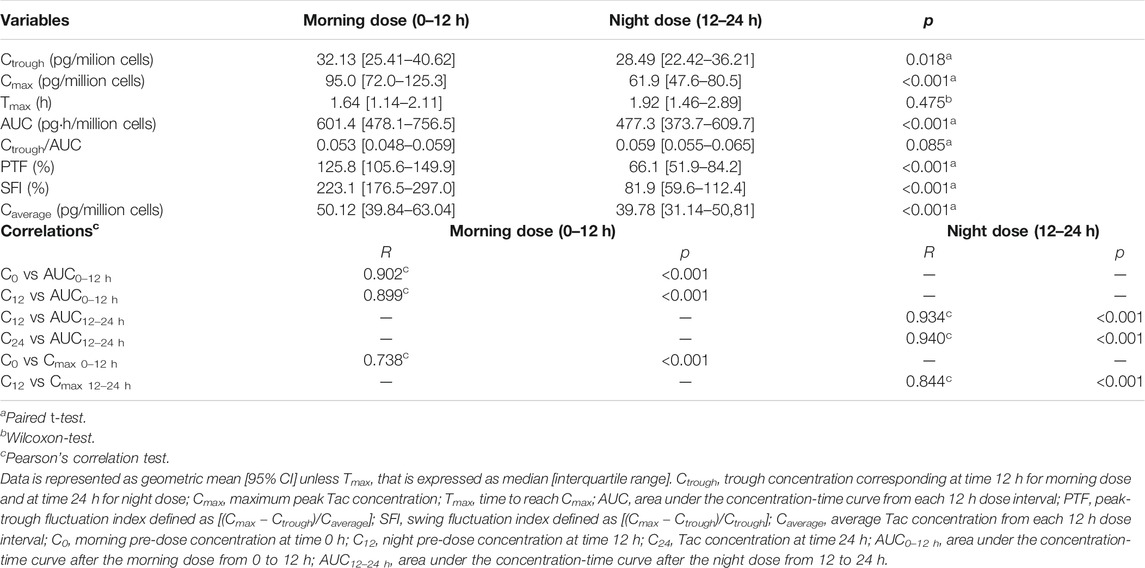
TABLE 3. Comparison of intracellular tacrolimus (Tac) pharmacokinetic variables and their corresponding correlations after morning Tac dose (0–12 h) and after night Tac dose (12–24 h) of twice-daily Tac formulation.
As in whole blood, the estimation of AUC0–24 h by doubling the morning AUC0–12 h, was also overestimated in the intracellular compartment, although more patients displayed differences higher than 10% (13/22) (Figure 2B).
In contrast to whole blood, a significant correlation between Ctrough and Cmax after morning and night doses was observed in the intracellular compartment (Table 3). Stronger correlations between all possible combinations between trough concentrations and AUC values were observed compared to whole blood (r ∼ 0.9–0.95). The scatter plots representing these correlations are showed in Supplementary Figure S2. In addition, significant positive correlations were obtained between whole blood Tac concentrations and intracellular Tac concentrations either following morning dose or night dose (Figures 2C,D).
The CN activity-time profiles in PBMCs after morning and night Tac doses are shown in Figure 3A. Similar to whole blood and intracellular PK profiles, there were clear differences in CN activity profiles regarding day and night times. Indeed, more fluctuation occurred after the morning dose. The morning dose also showed a statistically significant lower Inadir, indicating higher CN inhibition, than the night dose (Table 4). Although a significantly higher Itrough was observed after the night dose with respect to morning dose, the ratio of Itrough/Inadir was still significantly higher after the morning dose. Moreover, no differences in Tnadir were found between both Tac doses (Table 4). The morning dose showed a comparable AUE Imin and AUE Inadir to the night dose when compared to AUC in whole blood or intracellular PK (Table 4).
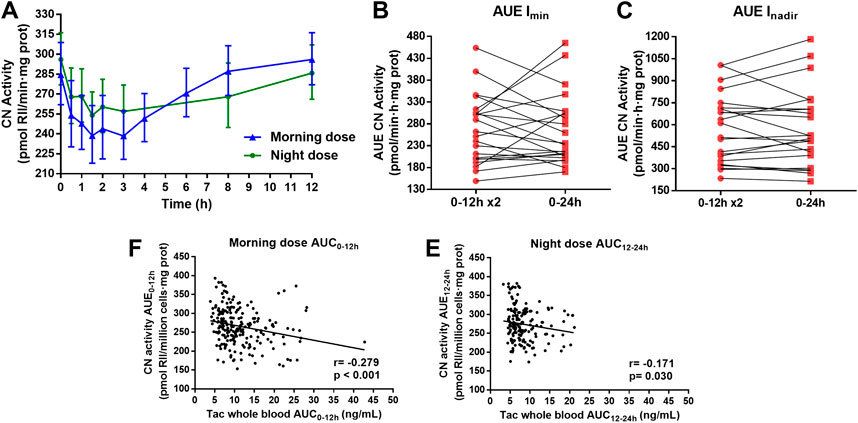
FIGURE 3. (A) Pharmacodynamic calcineurin (CN) activity-time profiles along 12 h dose interval after the administration of morning and night dose of twice-daily Tac. (B) Estimation of the total daily CN inhibition using Imin as baseline (AUE0–24 h Imin) (red square) by doubling the inhibition after the morning Tac dose (AUE0–12 Imin x2) (red round) and (C), estimating the inhibition using Inadir as baseline, AUE0–24 h Inadir (red square) and AUE0–12 h Inadir x2 (red round). Each point joined by a line represented one patient. Paired t-test between both estimations was applied. (D,E) Correlations between all whole blood Tac concentrations and CN activities sampling after morning and night dose, respectively. Pearson test of Ln transformed data were performed for correlation analysis.
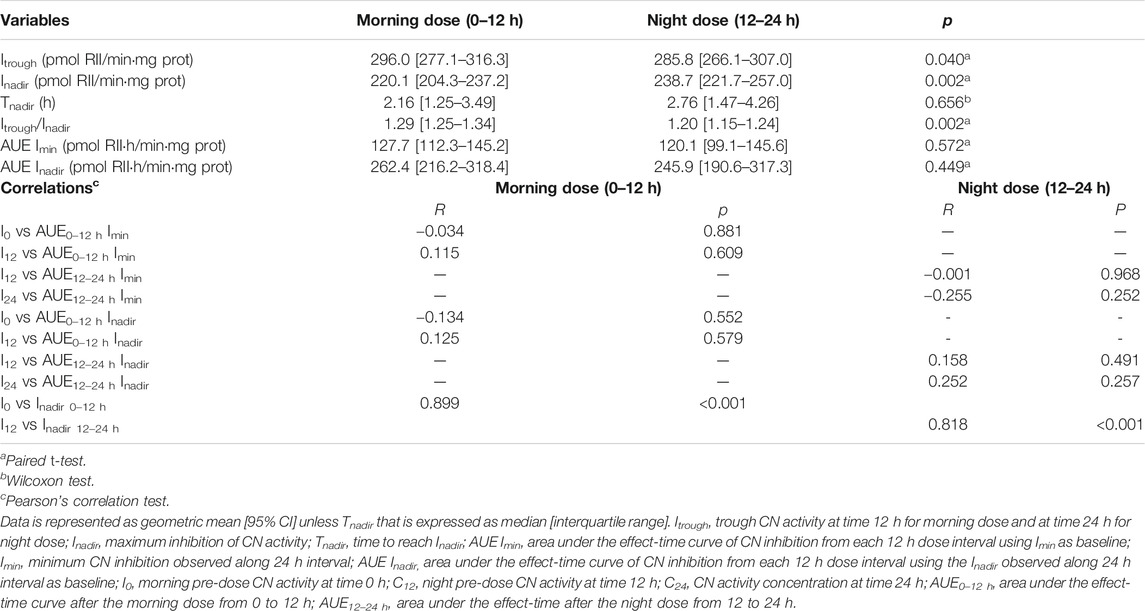
TABLE 4. Comparison of pharmacodynamic variables measured as calcineurin (CN) activity and their corresponding correlations after morning tacrolimus dose (0–12 h) and after night Tac dose (12–24 h) of twice-daily tacrolimus formulation.
In contrast to whole and intracellular PK estimation, similar CN inhibition during a 24 h period (AUE0–24 Imin and AUE0–24 Inadir) was obtained when this was assessed by doubling the morning AUE0–12 h (p = 0.972 and 0.826, respectively) (Figures 3B,C). Furthermore, concerning PD, high interpatient variability was observed in this estimation and few patients displayed differences lower than 10% in AUE0–24 Imin (7/22) and in AUE0–24 Inadir (11/22).
No correlations between Itrough (I0, I12, I24) and AUEs were observed either in the morning nor in the night dose. However, in both Tac doses, a strong correlation was observed between I0 and Inadir (r > 0.8) (Table 4). Scatter plots of these correlations are represented in Supplementary Figure S3. In addition, significant inverse weak correlation was observed between CN activities determinations and whole blood Tac concentrations both after morning dose and night dose (Figures 3D,E).
To the best of our knowledge, this is the first study that simultaneously evaluates the 24 h time variation in the pharmacokinetics at steady-state conditions of intracellular and whole blood Tac, after twice-daily administration. While the impact on circadian rhythms on whole blood Tac has previously been documented (Min et al., 1996; Tada et al., 2003; Iwahori et al., 2005; Park et al., 2007; Satoh et al., 2008; Gustavsen et al., 2020), data regarding intracellular Tac has yet to be reported. Here, we show the influence of circadian rhythms on intracellular PK after twice-daily Tac administration and their corresponding PD profiles in kidney transplant recipients. Notably, we also describe the differences in PK and PD profiles between the morning and night administration doses in a standard immunosuppressive regimen based on a twice-daily Tac formulation.
Our results show different whole blood PK profiles between the morning and the night Tac doses. Achieved exposures (AUC) following the night dose were approximately 25% lower than those achieved following the morning dose. Fluctuations of whole blood concentrations were also much lower during the 12–24 h dose intervals rather than after the morning dose. These results suggest 24 h variations in both the extent and rate of absorption due to physiological rhythms. Tac is a highly lipophilic drug with poor aqueous solubility. This is one of the factors contributing to its low and variable oral bioavailability, but also cytochrome P450 (CYP3A) mediated metabolism or multidrug-resistance associated protein-mediated efflux should be considered. Indeed, a day-dependent variability has been reported for CYP3A gene expression and mediated metabolism of other several drugs (Martin et al., 2003; Tomalik-Scharte et al., 2014). In this context, the lower Tac exposure after night dose could be due to an enhanced CYP3A enzymatic activity during night-time compared to day-time. This could lead to higher pre-systemic loss of Tac with lower fraction reaching the bloodstream and, in turn, to higher CL/F values at the 12–24 h dose interval with respect to the morning drug intake (19.66 and 15.74 mg·l/ng·h, respectively). In our study we found lower doses in patients who expressed CYP3A∗3/∗3 SNP compared with expressors of CYP3A∗1/∗3. However, no differences were observed when AUC/Dose was compared for each individual SNP between morning and night dose. The study should be performed with a larger sample size to describe the impact of genotypes on circadian rhythms. Preclinical studies in different murine models (Murakami et al., 2008; Okyar et al., 2019) and in non-humans primates (Iwasaki et al., 2015) have also shown the influence of circadian variation on the expression and activity of the Tac extrusion transporter Pgp, in the intestine due to its regulation by Clock genes. A higher Pgp activity during the night period also may have contributed to the differences between morning and night Tac administrations observed. Tamura et al. (2003) reported a Tac permeability two times greater in the upper part of the intestine (jejunum) than in the ileum of rats. By contrast, Pgp activity was dominant in ileum compared to the jejunum. Considering Tac twice-daily as an immediate release formulation, major Tac uptake would be expected in the jejunum. At this point, circadian changes on CYP3A enzymatic activity would play a more important key role in the different exposures observed between morning and night administrations than Pgp extrusion. Our results are in line with those of Prado-Velasco et al. (2020) in the pediatric population describing the effect of circadian rhythms on CL.
We also found significantly lower fluctuation values in whole blood Tac concentrations following the night dose when compared to the morning dose (PTF, 40.6 and 112.3%; SFI, 46.5 and 161.6%, respectively). These results suggest a lower absorption rate during the night-time as it was described in the model of Prado-Velasco et al. (2020). This was also confirmed by a trend to larger Tmax values at night with respect to the morning dose (1.87 and 1.52 h, respectively). Differences between Ctrough/AUC ratios were also observed. Lower values of this ratio were observed in the morning compared to the night dose interval, as should be expected when a faster absorption process takes place (0.058 and 0.065, morning and night respectively). Differences in the absorption rate could be explained by distinct fasting conditions before drug administration or reduced gastric emptying rate due to physiologically slower enterokinetics in the evening with respect to the day time. Indeed, food intake, especially after high-fat meals, diminished Tac levels and also slowed the absorption process as previously reported by Bekersky et al. (2001). Interestingly, Gustavsen et al. (2020), recently described that the daily circadian PK variations were largely affected by the fasting conditions at the time of drug intake showing lower Cmax and AUC0–12 in non-fasting conditions after morning Tac dose. In this context, the different eating habits in relation to morning and evening doses should be considered as eating habits could influence Tac exposure. The significantly higher Cmax, Cmax/Ctrough, and AUC observed following morning Tac dose compared to night dose were in accordance with some previous reports (Min et al., 1996; Iwahori et al., 2005; Park et al., 2007; Gustavsen et al., 2020), although other studies did not find these PK differences (Tada et al., 2003; Satoh et al., 2008; Gustavsen et al., 2020). However, in the vast majority of these studies the morning Tac dose intake was undertaken after breakfast and not in fasting conditions, which differs to our study (Tada et al., 2003; Satoh et al., 2008).
To our knowledge, our study is the first showing the role of circadian rhythms on intracellular Tac PK. In this study, whole blood and intracellular exposures revealed pharmacokinetic profiles with a similar pattern. Both intracellular and whole blood concentrations were determined under steady-state conditions, and kinetic equilibrium between whole blood and PBMC (intracellular) compartment should have been achieved. Certainly, peak concentrations were observed at similar times for whole blood and intracellular Tac. As in whole blood, the morning dose resulted in a higher exposure than that of the night dose (601.4 and 477.3 pg·h/million cells, respectively). Intracellular peak concentrations were also higher at the 0–12 h interval than the 12–24 h interval (95.0 and 61.9 pg/million cells, respectively) resulting in higher fluctuation (PTF, 125.8 and 66.1%; SFI, 223.1 and 81.9%, respectively). Results obtained after the morning Tac dose from the first AUC0–12 h were in accordance with previous studies (Lemaitre et al., 2015; Klaasen et al., 2018). The lower Cmax/Ctrough ratio, especially after the morning dose, achieved intracellularly compared to whole blood suggests a restricted entrance of Tac molecules inside the cells. It is known that ABCB1 polymorphisms affect the intracellular Tac exposure in PBMCs (Capron et al., 2010; Tron et al., 2020). However, no literature has been published to describe the role of circadian rhythms and Pgp on intracellular Tac exposure.
A specular PD/PK profile (whole blood or intracellular) was shown in our study after either the morning or night Tac dose. Thus far, the PD analysis measuring CN activity has only been studied following the morning dose of twice-daily Tac formulation, but no data has reported the PD effect after the night dose. Our data showed that despite a lower Inadir following the morning Tac dose, this was not translated into higher CN activity inhibition during the first 12 h, thus showing comparable AUE0–12 h and AUE12–24 h. This may be explained by the transient PD profile observed after morning Tac dose characterized by a rapid return to pre-dose levels once the Inadir was reached, which differs to the more sustained inhibition after the Inadir, which was noticed following night dose. Previous studies also showed this rapid recovery of CN activity to pre-dose levels after the morning Tac dose (Koefoed-nielsen and Gesualdo, 2002; Koefoed-Nielsen et al., 2006; Iwasaki et al., 2018; Fontova et al., 2021). Other studies investigating lymphocyte activation have shown circadian rhythms displaying higher proinflammatory cytokine secretion during night time (Benedict et al., 2007; Fortier et al., 2011).
Until now, most studies analyzing the PK and the PD properties of twice-daily Tac formulation described the morning AUC0–12 h as 50% of the total daily dose. The introduction of new once-daily Tac formulations was brought in to assess AUC0–24 h even when it was compared with twice-daily Tac (Tsuchiya et al., 2013; Tremblay et al., 2017; Marquet et al., 2018). Despite the differences observed after night Tac dose in fasting conditions, some reports doubled the analysis of the first AUC0–12 h to illustrate total daily dose exposure to compare once-and twice-daily Tac formulations (Iwasaki et al., 2018). Our results showed that by doubling the AUC0–12 h after morning Tac dose, the AUC0–24 h was overestimated either in whole blood or intracellular. High interpatient variability was observed in PD, which suggests that this estimation should be avoided. Therefore, the best approach to evaluate real AUC0–24 h for twice-daily Tac is to measure both AUCs and not using extrapolations.
The TDM of Tac is based on measuring the whole blood morning Ctrough levels (Wallemacq et al., 2009; Brunet et al., 2019). Even though measuring the morning C0 also showed good correlation with AUC0–12 h, it does not reflect the differences observed between morning and night AUC and Cmax. Intracellular results also reinforced these observations (Tron et al., 2020). Furthermore, our results showed that the I0, I12, and I24 did not correlate with their previous or posterior AUEs, suggesting that only measuring pre-dose CN activity is not sufficient to predict the total CN inhibition after twice-daily Tac dose.
In conclusion, our data proves that despite a clear impact of circadian rhythms on whole blood and intracellular Tac PK, ultimately this effect has a modest impact on Tac PD evaluated as the degree of CN inhibition. Our study may provide a conceptual basis for a better understanding of PD/PK Tac properties of twice-daily Tac formulation in recipients of renal transplantation.
The raw data supporting the conclusions of this article will be made available by the authors, without undue reservation.
The studies involving human participants were reviewed and approved by the Bellvitge University Hospital. The patients/participants provided their written informed consent to participate in this study.
Conceptualization: PF, HC, JG, OB, and NL. Analysis: PF, HC, RR, LM, AV, JG, OB, and NL. Methodology: PF, RR, LM, AV, and NL. Patient inclusion: NM, EM, MM, AM, JC, JT, and OB. Supervision: HC, JG, OB, and NL. Writing: PF, HC, RR, LM, AV, JT, JG, OB, and NL. All authors contributed to the article and approved the submitted version.
The present study was supported by an unrestricted grant from Chiesi España SA and grants from Instituto de Salud Carlos III and Ministerio de Sanidad y Consumo (PI18/01740), REDinREN RD16/0009/0003, Sociedad Española de Nefrologia (17PSJ026) and Fondo Europeo de Desarrollo Regional (FEDER) cofounded by FEDER funds/European Regional Development Fund (ERDF) a way to Build Europa.
The authors declare that the research was conducted in the absence of any commercial or financial relationships that could be construed as a potential conflict of interest.
The authors are especially grateful to Gema Cerezo of Nephology laboratory team and to Scientific and Technologic centers (CCiTUB) team from the University of Barcelona (Esther Castaño and Bea Barroso) for the technical support. We thankfully acknowledge the Biochemistry department technicians from Bellvitge University Hospital, specially Mercedes Sanjuás-Iglesias and Gloria Pérez-Fernández for the crucial technical assistance in this study. We are thankful to the transplant nurses’ team of Bellvitge University Hospital (Ma Jesús Gonzalez and Yurema Martínez). We also acknowledge the Transplant assistant, Carmen Fernández-Gámiz, for her support in clinical data base variables. We thank CERCA Programme/Generalitat de Catalunya for institutional support.
The Supplementary Material for this article can be found online at: https://www.frontiersin.org/articles/10.3389/fphar.2021.636048/full#supplementary-material.
FIGURE S1 | Cortical hemodynamic results. A and B. Correlation between whole blood pre-dose concentrations (C0 and C12) and their corresponding maximum peak-concentration (Cmax; Cmax 0-12h and Cmax 12-24h). C and D. Correlation between whole blood trough concentrations (C0 and C12) and their corresponding posterior area under the curve (AUC; AUC0-12h and AUC12-24h). E and F. Correlation between whole blood trough concentrations (C12 and C24) and their corresponding previous AUC (AUC0-12h and AUC12-24h). For correlation analysis, Pearson test of Ln transformed data were used.
FIGURE S2 | Cortical hemodynamic results. A and B. Correlation between intracellular pre-dose concentrations (C0 and C12) and their corresponding maximum peak-concentration (Cmax; Cmax 0-12h and Cmax 12-24h). C and D. Correlation between intracellular trough concentrations (C0 and C12) and their corresponding posterior area under the curve (AUC; AUC0-12h and AUC12-24h). E and F. Correlation between intracellular trough concentrations (C12 and C24) and their corresponding previous AUC (AUC0-12h and AUC12-24h). For correlation analysis, Pearson test of Ln transformed data were used.
FIGURE S3 | Cortical hemodynamic results. A and B. Correlation between trough CN activities (I0 and I12) and their corresponding posterior AUE Imin (AUE0-12h Imin and AUE12-24h Imin). C and D. Correlation between trough CN activities (I12 and I24) and their corresponding previous AUE Imin (AUE0-12h Imin and AUE12-24h Imin). E and F. Correlation between trough CN activities (I0 and I12) and their corresponding posterior AUE Inadir (AUE0-12h Inadir and AUE12-24h Inadir). G and H. Correlation between trough CN activities (I12 and I24) and their corresponding previous AUE Inadir (AUE0-12h Inadir and AUE12-24h Inadir). I and J. Correlation between pre-dose CN activities (I0 and I12) and their corresponding maximum peak-inhibition (Inadir; Inadir 0-12h and Inadir 12-24h). For correlation analysis, Pearson test of Ln transformed data were used.
RRI, resource rdentification initiative.
Andreu, F., Colom, H., Elens, L., van Gelder, T., van Schaik, R. H. N., Hesselink, D. A., et al. (2017). A new CYP3A5*3 and CYP3A4*22 cluster influencing tacrolimus target concentrations: a population approach. Clin. Pharmacokinet. 56, 963–975. doi:10.1007/s40262-016-0491-3
Baraldo, M., and Furlanut, M. (2006). Chronopharmacokinetics of ciclosporin and tacrolimus. Clin. Pharmacokinet. 45, 775–788. doi:10.2165/00003088-200645080-00002
Bekersky, I., Dressler, D., and Mekki, Q. A. (2001). Effect of low- and high-fat meals on tacrolimus absorption following 5 mg single oral doses to healthy human subjects. J. Clin. Pharmacol. 41, 176–182. doi:10.1177/00912700122009999
Benedict, C., Dimitrov, S., Marshall, L., and Born, J. (2007). Sleep enhances serum interleukin-7 concentrations in humans. Brain Behav. Immun. 21, 1058–1062. doi:10.1016/j.bbi.2007.04.004
Brunet, M., van Gelder, T., Asberg, A., Haufroid, V., Hesselink, D. A., Langman, L., et al. (2019). Therapeutic drug monitoring of tacrolimus-personalized therapy: second consensus report. Ther. Drug Monit. 41, 261–307. doi:10.1097/FTD.0000000000000640
Capron, A., Lerut, J., Latinne, D., Rahier, J., Haufroid, V., and Wallemacq, P. (2012). Correlation of tacrolimus levels in peripheral blood mononuclear cells with histological staging of rejection after liver transplantation: preliminary results of a prospective study. Transpl. Int. 25, 41–47. doi:10.1111/j.1432-2277.2011.01365.x
Capron, A., Mourad, M., De Meyer, M., De Pauw, L., Eddour, D. C., Latinne, D., et al. (2010). CYP3A5 and ABCB1 polymorphisms influence tacrolimus concentrations in peripheral blood mononuclear cells after renal transplantation. Pharmacogenomics 11, 703–714. doi:10.2217/pgs.10.43
Fontova, P., Colom, H., Rigo-Bonnin, R., Bestard, O., Vidal-Alabró, A., van Merendonk, L., et al. (2021). Sustained inhibition of calcineurin activity with a Melt-Dose Once-daily Tacrolimus formulation in renal transplant recipients. Clin. Pharmacol. Ther. 1178. doi:10.1002/cpt.2220
Fontova, P., Rigo-Bonnin, R., Vidal-Alabró, A., Cerezo, G., Bestard, O., Cruzado, J. M., et al. (2019). Measurement of calcineurin activity in peripheral blood mononuclear cells by ultra-high performance liquid chromatography-tandem mass spectrometry. renal transplant recipients application (pharmacodynamic monitoring). Clin. Chim. Acta 495, 287–293. doi:10.1016/j.cca.2019.04.079
Fortier, E. E., Rooney, J., Dardente, H., Hardy, M.-P., Labrecque, N., and Cermakian, N. (2011). Circadian variation of the response of T cells to antigen. J. Immunol. 187, 6291–6300. doi:10.4049/jimmunol.1004030
Francke, M. I., Hesselink, D. A., Li, Y., Koch, B. C. P., Wit, L. E. A., Schaik, R. H. N., et al. (2020). Monitoring the tacrolimus concentration in peripheral bLood mononuclear cells of kidney transplant recipients. Br. J. Clin. Pharmacol. doi:10.1111/bcp.14585
Gustavsen, M. T., Midtvedt, K., Robertsen, I., Woillard, J. B., Debord, J., Klaasen, R. A., et al. (2020). Fasting status and circadian variation must be considered when performing AUC-based therapeutic drug monitoring of tacrolimus in renal transplant recipients. Clin. Transl. Sci. 13, 1327–1335. doi:10.1111/cts.12833
Han, S. S., Yang, S. H., Kim, M. C., Cho, J. Y., Min, S. Il., Lee, J. P., et al. (2016). Monitoring the intracellular tacrolimus concentration in kidney transplant recipients with stable graft function. PLoS One 11, e0153491. doi:10.1371/journal.pone.0153491
Hesselink, D. A., van Gelder, T., and van Schaik, R. H. N. (2005). The pharmacogenetics of calcineurin inhibitors: one step closer toward individualized immunosuppression?. Pharmacogenomics 6, 323–337. doi:10.1517/14622416.6.4.323
Hoffmeyer, S., Burk, O., Von Richter, O., Arnold, H. P., Brockmöller, J., Johne, A., et al. (2000). Functional polymorphisms of the human multidrug-resistance gene: multiple sequence variations and correlation of one allele with P-glycoprotein expression and activity in vivo. Proc. Natl. Acad. Sci. U. S. A. 97, 3473–3478. doi:10.1073/pnas.050585397
Iwahori, T., Takeuchi, H., Matsuno, N., Johjima, Y., Konno, O., Nakamura, Y., et al. (2005). Pharmacokinetic differences between morning and evening administration of cyclosporine and tacrolimus therapy. Transpl. Proc. 37, 1739–1740. doi:10.1016/j.transproceed.2005.02.104
Iwasaki, M., Koyanagi, S., Suzuki, N., Katamune, C., Matsunaga, N., Watanabe, N., et al. (2015). Circadian modulation in the intestinal absorption of P-glycoprotein substrates in monkeys. Mol. Pharmacol. 88, 29–37. doi:10.1124/mol.114.096735
Iwasaki, M., Yano, I., Fukatsu, S., Hashi, S., Yamamoto, Y., Sugimoto, M., et al. (2018). Pharmacokinetics and pharmacodynamics of once-daily tacrolimus compared with twice-daily tacrolimus in the early stage after living donor liver transplantation. Ther. Drug Monit. 40, 675–681. doi:10.1097/FTD.0000000000000551
Klaasen, R. A., Bergan, S., Bremer, S., Daleq, L., Andersen, A. M., Midtvedt, K., et al. (2018). A longitudinal study of tacrolimus in lymphocytes during the first year after kidney transplantation. Ther. Drug Monit. 40, 558–566. doi:10.1097/FTD.0000000000000539
Koefoed-nielsen, P. B., and Gesualdo, M. B. (2002). Blood tacrolimus levels and calcineurin phosphatase activity early after renal transplantation. Am. J. Transpl. 2, 173–178. doi:10.1034/j.1600-6143.2002.020209.x
Koefoed-Nielsen, P. B., Karamperis, N., Højskov, C., Poulsen, J. H., and Jørgensen, K. A. (2006). The calcineurin activity profiles of cyclosporin and tacrolimus are different in stable renal transplant patients. Transpl. Int. 19, 821–827. doi:10.1111/j.1432-2277.2006.00359.x
Labrecque, G., and Bélanger, P. M. (1991). Biological rhythms in the absorption, distribution, metabolism and excretion of drugs. Pharmacol. Ther. 52, 95–107. doi:10.1016/0163-7258(91)90088-4
Lemaitre, F., Blanchet, B., Latournerie, M., Antignac, M., Houssel-debry, P., Verdier, M., et al. (2015). Pharmacokinetics and pharmacodynamics of tacrolimus in liver transplant recipients : inside the white blood cells. Clin. Biochem. 46, 406–411. doi:10.1016/j.clinbiochem.2014.12.018
Marquet, P., Albano, L., Woillard, J. B., Rostaing, L., Kamar, N., Sakarovitch, C., et al. (2018). Comparative clinical trial of the variability factors of the exposure indices used for the drug monitoring of two tacrolimus formulations in kidney transplant recipients. Pharmacol. Res. 129, 84–94. doi:10.1016/j.phrs.2017.12.005
Martin, C., Dutertre-Catella, H., Radionoff, M., Debray, M., Benstaali, C., Rat, P., et al. (2003). Effect of age and photoperiodic conditions on metabolism and oxidative stress related markers at different circadian stages in rat liver and kidney. Life Sci. 73, 327–335. doi:10.1016/S0024-3205(03)00271-6
Min, D. I., Chen, H.-Y., Fabrega, A., Ukah, F., Wu, Y.-M., Corwin, C., et al. (1996). Circadian variation of tacrolimus disposition in liver allograft recipients. Transplantation 62, 1190–1192. doi:10.1097/00007890-199610270-00031
Murakami, Y., Higashi, Y., Matsunaga, N., Koyanagi, S., and Ohdo, S. (2008). Circadian clock-controlled intestinal expression of the multidrug-resistance gene mdr1a in mice. Gastroenterology 135, 1636–1644. doi:10.1053/j.gastro.2008.07.073
Ohdo, S. (2007). Chronopharmacology focused on biological clock. Drug Metab. Pharmacokinet. 22, 3–14. doi:10.2133/dmpk.22.3
Okyar, A., Kumar, S. A., Filipski, E., Piccolo, E., Ozturk, N., Xandri-Monje, H., et al. (2019). Sex-, feeding-, and circadian time-dependency of P-glycoprotein expression and activity - implications for mechanistic pharmacokinetics modeling. Sci. Rep. 9, 1–15. doi:10.1038/s41598-019-46977-0
Park, S. I., Felipe, C. R., Pinheiro-Machado, P. G., Garcia, R., Tedesco-Silva, H., and Medina-Pestana, J. O. (2007). Circadian and time-dependent variability in tacrolimus pharmacokinetics. Fundam. Clin. Pharmacol. 21, 191–197. doi:10.1111/j.1472-8206.2007.00468.x
Prado-Velasco, M., Borobia, A., and Carcas-Sansuan, A. (2020). Predictive engines based on pharmacokinetics modelling for tacrolimus personalized dosage in paediatric renal transplant patients. Sci. Rep. 10, 1–18. doi:10.1038/s41598-020-64189-9
Rigo-Bonnin, R., Arbiol-Roca, A., de Aledo-Castillo, J. M. G., and Alía, P. (2015). Simultaneous measurement of cyclosporine A, everolimus, sirolimus and tacrolimus concentrations in human blood by UPLC–MS/MS. Chromatographia 78, 1459–1474. doi:10.1007/s10337-015-2981-0
Satoh, S., Kagaya, H., Saito, M., Inoue, T., Miura, M., Inoue, K., et al. (2008). Lack of tacrolimus circadian pharmacokinetics and CYP3A5 pharmacogenetics in the early and maintenance stages in Japanese renal transplant recipients. Br. J. Clin. Pharmacol. 66, 207–214. doi:10.1111/j.1365-2125.2008.03188.x
Staatz, C. E., and Tett, S. E. (2004). Clinical pharmacokinetics and pharmacodynamics of tacrolimus in solid organ transplantation. Clin. Pharmacokinet. 43, 623–653. doi:10.2165/00003088-200443100-00001
Tada, H., Satoh, S., Iinuma, M., Shimoda, N., Murakami, M., Hayase, Y., et al. (2003). Chronopharmacokinetics of tacrolimus in kidney transplant recipients: occurrence of acute rejection. J. Clin. Pharmacol. 43, 859–865. doi:10.1177/0091270003254797
Tamura, S., Tokunaga, Y., Ibuki, R., Amidon, G. L., Sezaki, H., and Yamashita, S. (2003). The site-specific transport and metabolism of tacrolimus in rat small intestine. J. Pharmacol. Exp. Ther. 306, 310–316. doi:10.1124/jpet.103.050716
Tomalik-Scharte, D., Suleiman, A. A., Frechen, S., Kraus, D., Kerkweg, U., Rokitta, D., et al. (2014). Population pharmacokinetic analysis of circadian rhythms in hepatic CYP3A activity using midazolam. J. Clin. Pharmacol. 54, 1162–1169. doi:10.1002/jcph.318
Tremblay, S., Nigro, V., Weinberg, J., Woodle, E. S., and Alloway, R. R. (2017). A steady-state head-to-head pharmacokinetic comparison of all FK-506 (tacrolimus) formulations (ASTCOFF): an open-label, prospective, randomized, two-arm, three-period crossover study. Am. J. Transpl. 17, 432–442. doi:10.1111/ajt.13935
Tron, C., Woillard, J. B., Houssel-Debry, P., David, V., Jezequel, C., Rayar, M., et al. (2020). Pharmacogenetic—whole blood and intracellular pharmacokinetic—pharmacodynamic (PG-PK2-PD) relationship of tacrolimus in liver transplant recipientsogenetic. PLoS One 15, e0230195. doi:10.1371/journal.pone.0230195
Tsuchiya, T., Ishida, H., Tanabe, T., Shimizu, T., Honda, K., Omoto, K., et al. (2013). Comparison of pharmacokinetics and pathology for low-dose tacrolimus once-daily and twice-daily in living kidney transplantation: prospective trial in once-daily versus twice-daily tacrolimus. Transplantation 96, 198–204. doi:10.1097/TP.0b013e318296c9d5
van Merendonk, L. N., Fontova, P., Rigo-Bonnin, R., Colom, H., Vidal-Alabró, A., Bestard, O., et al. (2020). Validation and evaluation of four sample preparation methods for the quantification of intracellular tacrolimus in peripheral blood mononuclear cells by UHPLC-MS/MS. Clin. Chim. Acta 503, 210–217. doi:10.1016/j.cca.2019.11.033
Keywords: tacrolimus, pharmacodynamic, pharmacokinetics, circadian rhythm, kidney transplantation, immunosuppression
Citation: Fontova P, Colom H, Rigo-Bonnin R, van Merendonk LN, Vidal-Alabró A, Montero N, Melilli E, Meneghini M, Manonelles A, Cruzado JM, Torras J, Grinyó JM, Bestard O and Lloberas N (2021) Influence of the Circadian Timing System on Tacrolimus Pharmacokinetics and Pharmacodynamics After Kidney Transplantation. Front. Pharmacol. 12:636048. doi: 10.3389/fphar.2021.636048
Received: 30 November 2020; Accepted: 05 February 2021;
Published: 17 March 2021.
Edited by:
Bente Jespersen, Aarhus University Hospital, DenmarkReviewed by:
Muhammad Usman, University of Veterinary and Animal Sciences, PakistanCopyright © 2021 Fontova, Colom, Rigo-Bonnin, van Merendonk, Vidal-Alabró, Montero, Melilli, Meneghini, Manonelles, Cruzado, Torras, Grinyó, Bestard and Lloberas. This is an open-access article distributed under the terms of the Creative Commons Attribution License (CC BY). The use, distribution or reproduction in other forums is permitted, provided the original author(s) and the copyright owner(s) are credited and that the original publication in this journal is cited, in accordance with accepted academic practice. No use, distribution or reproduction is permitted which does not comply with these terms.
*Correspondence: Nuria Lloberas, bmxsb2JlcmFzQHViLmVkdQ==; Helena Colom, aGVsZW5hLmNvbG9tQHViLmVkdQ==
Disclaimer: All claims expressed in this article are solely those of the authors and do not necessarily represent those of their affiliated organizations, or those of the publisher, the editors and the reviewers. Any product that may be evaluated in this article or claim that may be made by its manufacturer is not guaranteed or endorsed by the publisher.
Research integrity at Frontiers
Learn more about the work of our research integrity team to safeguard the quality of each article we publish.