 Peile Wang1,2
 Tongwen Sun
 Jing Yang
95% of researchers rate our articles as excellent or good
Learn more about the work of our research integrity team to safeguard the quality of each article we publish.
Find out more
ORIGINAL RESEARCH article
Front. Pharmacol. , 05 June 2020
Sec. Drug Metabolism and Transport
Volume 11 - 2020 | https://doi.org/10.3389/fphar.2020.00829
Polymyxin B is used as a last therapeutic option for the treatment of multidrug-resistant Gram-negative bacterial infections. This study aimed to develop a population pharmacokinetic model and limited sampling strategy, a method to estimate the area under the concentration curve (AUC) by using a limited number of samples, to assist therapeutic drug monitoring of polymyxin B in Chinese patients. Population pharmacokinetic analysis was performed using Phoenix® NLME with data obtained from 46 adult patients at steady state. Various demographic variables were investigated as potential covariates for population pharmacokinetic modeling. The limited sampling strategies based on the Bayesian approach and multiple linear regression were validated using the intraclass correlation coefficient and Bland-Altman analysis. As a result, the data was described by a two-compartment population pharmacokinetic model. Through the modeling, creatinine clearance was found to be a statistically significant covariate influencing polymyxin B clearance. The limited sampling strategies showed the two-point model (C0h and C2h) could predict polymyxin B exposure with good linear relativity (r2 > 0.98), and the four-point model (C1h, C1.5h, C4h, and C8h) performed best in predicting polymyxin B AUC (r2 > 0.99). In conclusion, this study successfully developed a population pharmacokinetic model and limited sampling strategies that could be applied in clinical practice to assist in therapeutic drug monitoring of polymyxin B in Chinese patients.
Polymyxin B, a polypeptide antibiotic obtained from the fermentation products of Paenibacillus polymyxa, was first used clinically in the 1950s but was largely abandoned in the 1970s due to nephrotoxicity and neurotoxicity. Recently, with the prevalence of multidrug-resistance (MDR) Gram-negative bacterial infections, polymyxin B has been re-introduced to clinical practice against these challenging infections. It is currently considered as the last drug resort for MDR Gram-negative bacterial infections (Velkov et al., 2013; Nation et al., 2015).
Despite being used clinically for decades, few pharmacokinetic/pharmacodynamics (PK/PD) data is available for polymyxin B (Tam et al., 2005; Bergen et al., 2012; Tsuji et al., 2016; Lakota et al., 2018; Landersdorfer et al., 2018). These studies found the area under the concentration-time curve to minimum inhibitory concentration ratio (fAUC: MIC), as the PK/PD index, appeared to be a good efficacy predictor for polymyxin B. Accordingly, a global multidisciplinary panel of infectious diseases and pharmacotherapy experts recommended therapeutic drug monitoring (TDM) was required to optimize the clinical use of polymyxin B. An AUC across 24 hours at steady state (AUCss,24 hr) target of 50 to 100 mgċh/L, corresponding to a Css,avg of 2 to 4 mg/L, might be acceptable for polymyxin B therapy (Tsuji et al., 2019). However, the guidelines also noted that data were lacking for PK properties and AUCss,24 hr targets of polymyxin B, and the recommended therapeutic target largely based on in vitro and animal data rather than clinical outcome (Alosaimy et al., 2019). In China, polymyxin B is only commercially available since 2017, there is almost no PK data on polymyxin B from Chinese patients. Therefore, it is necessary to assess the population PK of polymyxin B in Chinese patients.
In addition, to calculate AUC, it requires multiple blood draws during a dosing interval to get a full pharmacokinetic curve. This is not only time-consuming and expensive but also a huge burden to patients, and therefore unfeasible in clinical practice. To solve this problem, the limited sampling strategy (LSS), estimating AUC with one or a few samples, would be suitable in the clinic (David and Johnston, 2000). It has been proposed for TDM of many drugs, such as mycophenolate mofetil and colistin (Zhang et al., 2018; Kim et al., 2019; Van Der Galiën et al., 2020). However, no LSS report is available for polymyxin B at present.
Therefore, this study aimed to develop and validate a population PK model, along with clinically feasible LSS for TDM of polymyxin B in Chinese patients with MDR Gram-negative bacterial infections.
A single-center clinical trial was conducted between April 2018 and November 2019 at the First Affiliated Hospital of Zhengzhou University. The study protocol was approved by the hospital ethics committee review board, and all participating subjects signed the informed consent (Zhengzhou University Medical Research and Ethics Committee, No. L2018K129).
Patients who were ≥ 18 years of age, received intravenous polymyxin B (sulfate; polymyxin B injection, Shanghai First Biochemical Pharmaceutical Co., Ltd., China) for ≥ 72 hours, and were documented MDR Gram-negative bacterial infections were included. Patients with renal replacement therapy were excluded. Demographic characteristics (age, sex, and body weight), polymyxin B therapy, and laboratory data before polymyxin B TDM were collected from electronic medical records, including alanine aminotransferase (ALT), aspartate aminotransferase (AST), glutamyl transpeptidase (GGT), alkaline phosphatase (ALP), urea nitrogen, serum creatinine (Scr), serum uric acid, serum proteins, serum albumin, total bilirubin (TBIL), direct bilirubin (DBIL), and creatinine clearance (CrCL). CrCL was calculated using the Cockcroft-Gault equation with body weight (Janmahasatian et al., 2005).
According to the Chinese package insert, the maintenance dose of polymyxin B was 50 to 100 million units (1 million units equal to 1 mg) twice daily. The loading dose was 100 to 150 million units in clinical practice. The recommended infusion time was one hour but could be lengthened as needed. Polymyxin B treatment including dose, infusion time, and duration of therapy depended on the medical teams.
Blood samples were obtained after 3 days of therapy. On day 4, one blood sample (2 ml, C0h) was collected immediately at pre-dose, and five to seven blood samples (mainly C0.5h, C1h, C1.5h, C2h, C4h, C6h, and C8h) were collected at pre-next dose into EDTA tubes for each patient. To calculate AUC0–12h, C0h was regarded as C12h for those who hid not obtained C0h. All samples were centrifuged at 3,500×g for 10 min. The supernatant was collected and stored at −80°C until analysis.
Plasma concentrations of polymyxin B were determined using liquid chromatography-tandem mass spectrometry (LC-MS/MS) in the hospital laboratory. The method was previously described by our group (Wang et al., 2020). In brief, the calibration curves showed acceptable linearity over 0.2 to 10 µg/ml for polymyxin B1and 0.05 to 2.5 µg/ml for polymyxin B2. The upper limit of quantification was extended to 20 µg/ml for polymyxin B1 and 5.0 µg/ml for polymyxin B2 after four-fold dilution. For precision and accuracy, the intra- and inter-day imprecision of polymyxin B1 and B2 was less than 13.93%, and the inaccuracy ranged from −10.87 to 11.13%. Since polymyxin B1 and B2 had similar structures, molecular weight, pharmacological activities, and pharmacokinetic characteristics, the plasma concentration of polymyxin B was summed to derive the total polymyxin B1 and B2 concentrations (Tam et al., 2011; Manchandani et al., 2016a).
Based on a previously published study (Avedissian et al., 2019), the PK parameters were determined by one- and two-compartmental models performed using Phoenix® NLME software (v7.0, Pharsight, Mountain View, CA, USA). Initial PK parameters were estimated by the Naive-pooled model. PK models were estimated by the first-order conditional
where Pi is the PK parameters of the ith patient, θ is the population PK pharmacokinetic parameters, and ηi is a normally distributed random variable with a mean of 0 and a variance of ω2. Intra-individual variability (residual error) is described using additive (Cobs = Cpred + ϵ), proportional [Cobs = Cpred × (1+ ϵ)] or mixed (additive + proportional) models, where Cobs and Cpred are the observed and predicted concentrations, and ϵ is an error variable with a mean of 0 and a variance of σ2. Model assessment criteria included precision of parameter estimates (standard error), goodness-of-fit plots, and likelihood ratio test (−2LL). For the one-compartment model, basic PK parameters were the volume of central compartment distribution (V) and central compartment clearance (Cl). For the two-compartment model, there were two additional parameters as the volume of peripheral compartment distribution (V2) and inter-compartmental clearance (Q).
In the process of model development, age, sex, body weight, ALT, AST, GGT, ALP, urea nitrogen, Scr, serum uric acid, serum proteins, serum albumin, TBIL, DBIL, and CrCL were evaluated as the covariates. The covariates selection was evaluated using a stepwise process (a forward-selection process and then a backward-elimination process). By comparing with initial model, the inclusion criteria for covariates was a drop > 3.84 (P = 0.05) of objective function (OFV; −2LL) during forward-selection. Then each selected covariate was re-evaluated by backward-elimination. An increase of OFV > 6.63 (P = 0.01) was required for confirmation.
After covariate selection, the correlations between population PK parameters were graphically examined in the scatter plot. The relevant parameters were introduced to non-diagonal random effects. A drop of OFV > 6.63 (P = 0.01) was retained to obtain the final model.
Model validation was assessed by using plots of observed concentrations (DV) versus population predicted concentrations (PRED) or individual predicted concentrations (IPRED), and conditional weighted residuals (CWRES) versus time (IVAR) or PRED. Additionally, the model performance was evaluated by a prediction-corrected visual predictive check (VPC). The 5th, 50th, and 95th quantiles and the 90% confidence intervals (CIs) of 5th, 50th, and 95th quantiles (200 replicates) were developed from the final model parameters. The model stability was assessed using bootstrap analysis (1,000 bootstrap samples). The median, standard error (SE), and coefficient of variation (CV%) were calculated from the empirical bootstrap distribution and compared estimates with the original dataset.
For optimal dose selection, the plasma concentration-time profile of 1,000 individuals was simulated using the final population PK model. The following dose regimens were evaluated: 100 mg loading dose with 50 mg maintenance dose twice daily, 150 mg loading dose with 75 mg maintenance dose twice daily, and 150 mg loading dose with 100 mg maintenance dose twice daily. The infusion rate was set as 50 mg/h. The covariate of CrCL was selected as 31.3, 105.9, and 315.2 ml/min. which were the low, medium, and high values from the sample of patients.
The AUC0-12h of polymyxin B was calculated by the linear-up-log-down method. LSSs were investigated with Bayesian analysis and linear regression analysis. By using the Bayesian approach, Polymyxin B predicted concentrations were estimated from limited point values with the final population PK model. The observed and predicted AUC0-12h were analyzed using the Pearson correlation coefficient (r). The linear regression analysis was performed on IBM SPSS Statistics (v24.0, SPSS Inc., Chicago, USA). The stepwise forward multiple regression method was used to investigate the correlation between AUC0-12h and polymyxin B concentrations at different time points. The determination coefficient (r2) evaluated the regression level of the equation. Good regression equations were selected for model validation.
The model was internally validated by the Jackknife method. One sample was removed from the original sample at a time, then regression analysis of the remaining sample was performed to obtain a new equation and calculate the AUC0-12h of the removed one sample. Prediction error (PE, Equ. 2) and root mean square error (RMSE, Equ. 3) were used to evaluate the accuracy and precision of the model. The acceptance criteria of RMSE < 15 and r2 > 0.95 (Van den Elsen et al., 2018).
The consistency between the measured and predicted value of AUC0-12h was evaluated by intraclass correlation coefficient (ICC), and Bland-Altman (BA) analysis. The BA analysis was expressed by the scatter diagram and limits of agreement. The lower limit of 95% CI < 0.9 and the limits of agreement within ±15% were acceptable for the clinic (Zhang et al., 2018). The best model was selected based on the values of r2, PE, RMSE, ICC, and BA analysis.
A total of 46 patients contributed to 331 plasma samples were enrolled in this study. The patients' demographic and clinical information were listed in Table 1. Among them, pathogenic bacteria cultures results showed that sputum was the most common primary site of infection, along with blood, cerebrospinal fluid, and puncture fluid, etc. MDR Acinetobacter baumannii and Klebsiella pneumoniae were the major causative agent of the infections, and 6 patients were infected with two kinds of MDR Gram-negative bacterial.
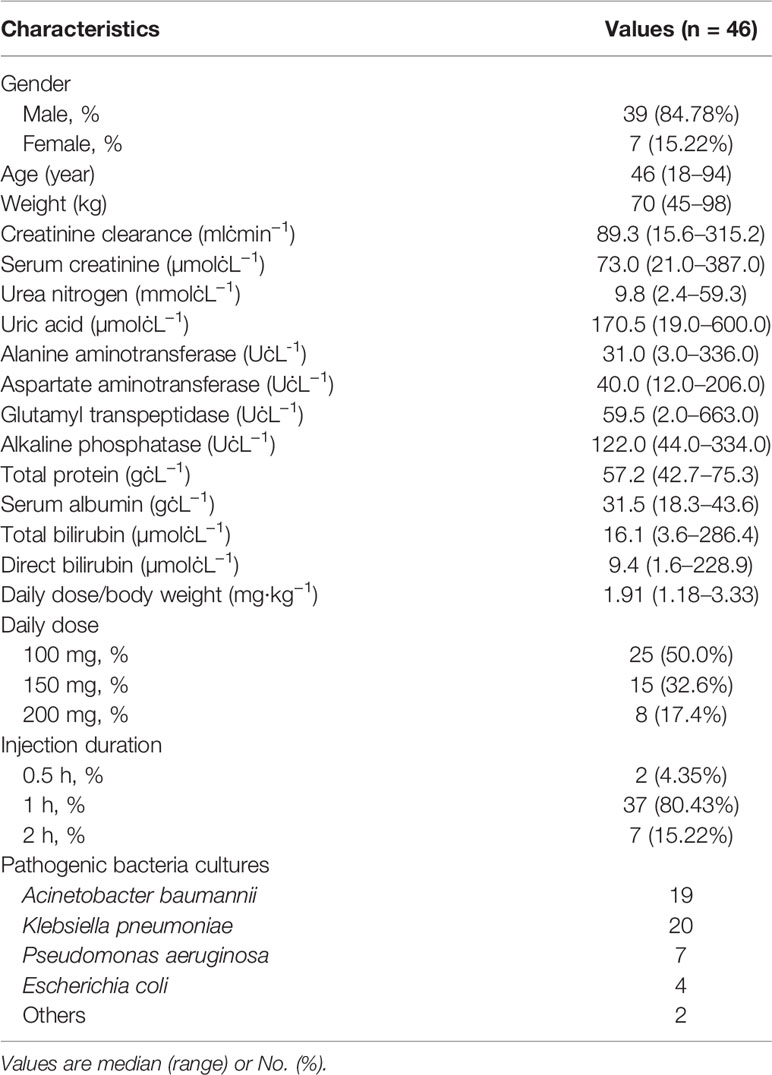
Table 1 Demographic characteristics of patients.
Preliminary analysis of base model showed the OFVs of one- and two-compartmental models were 1062.13 and 694.63, respectively. Based on OFV, CV values, and diagnostic scatter plots, a two-compartment model with a proportional option was chosen as the base model. In the next step, covariate model building identified CrCL as the covariate for Cl (ΔOFV = 8.26, P < 0.01). Age, gender, and other laboratory data had no significant effect on population PK parameters. Furthermore, a strong correlation between Cl, Cl2, and V was observed, and then incorporated it into non-diagonal random effects (ΔOFV = 30.60, P < 0.01). The correlations between V-Cl, V-V2, and Cl-V2 were 0.713, 0.667, and 0.571, respectively. Accordingly, the final PK model was shown in Equ. 4 to 7, where 105.9 ml/min was the median of CrCL.
The goodness-of-fit plots for the final model were shown in Figure 1. The observed concentrations were consistent with PRED and IPRED, and the plots of CWRES vs time and PRED were normally distributed. The estimated covariates and bootstrap replicates were shown in Table 2, which indicated the final model had qualified stability. In prediction corrected-VPC (Figure 2), most of the observed plots were distributed within the 90% CIs of predicted corresponding quantiles, which indicated the prediction of simulated data matched the observed plots.
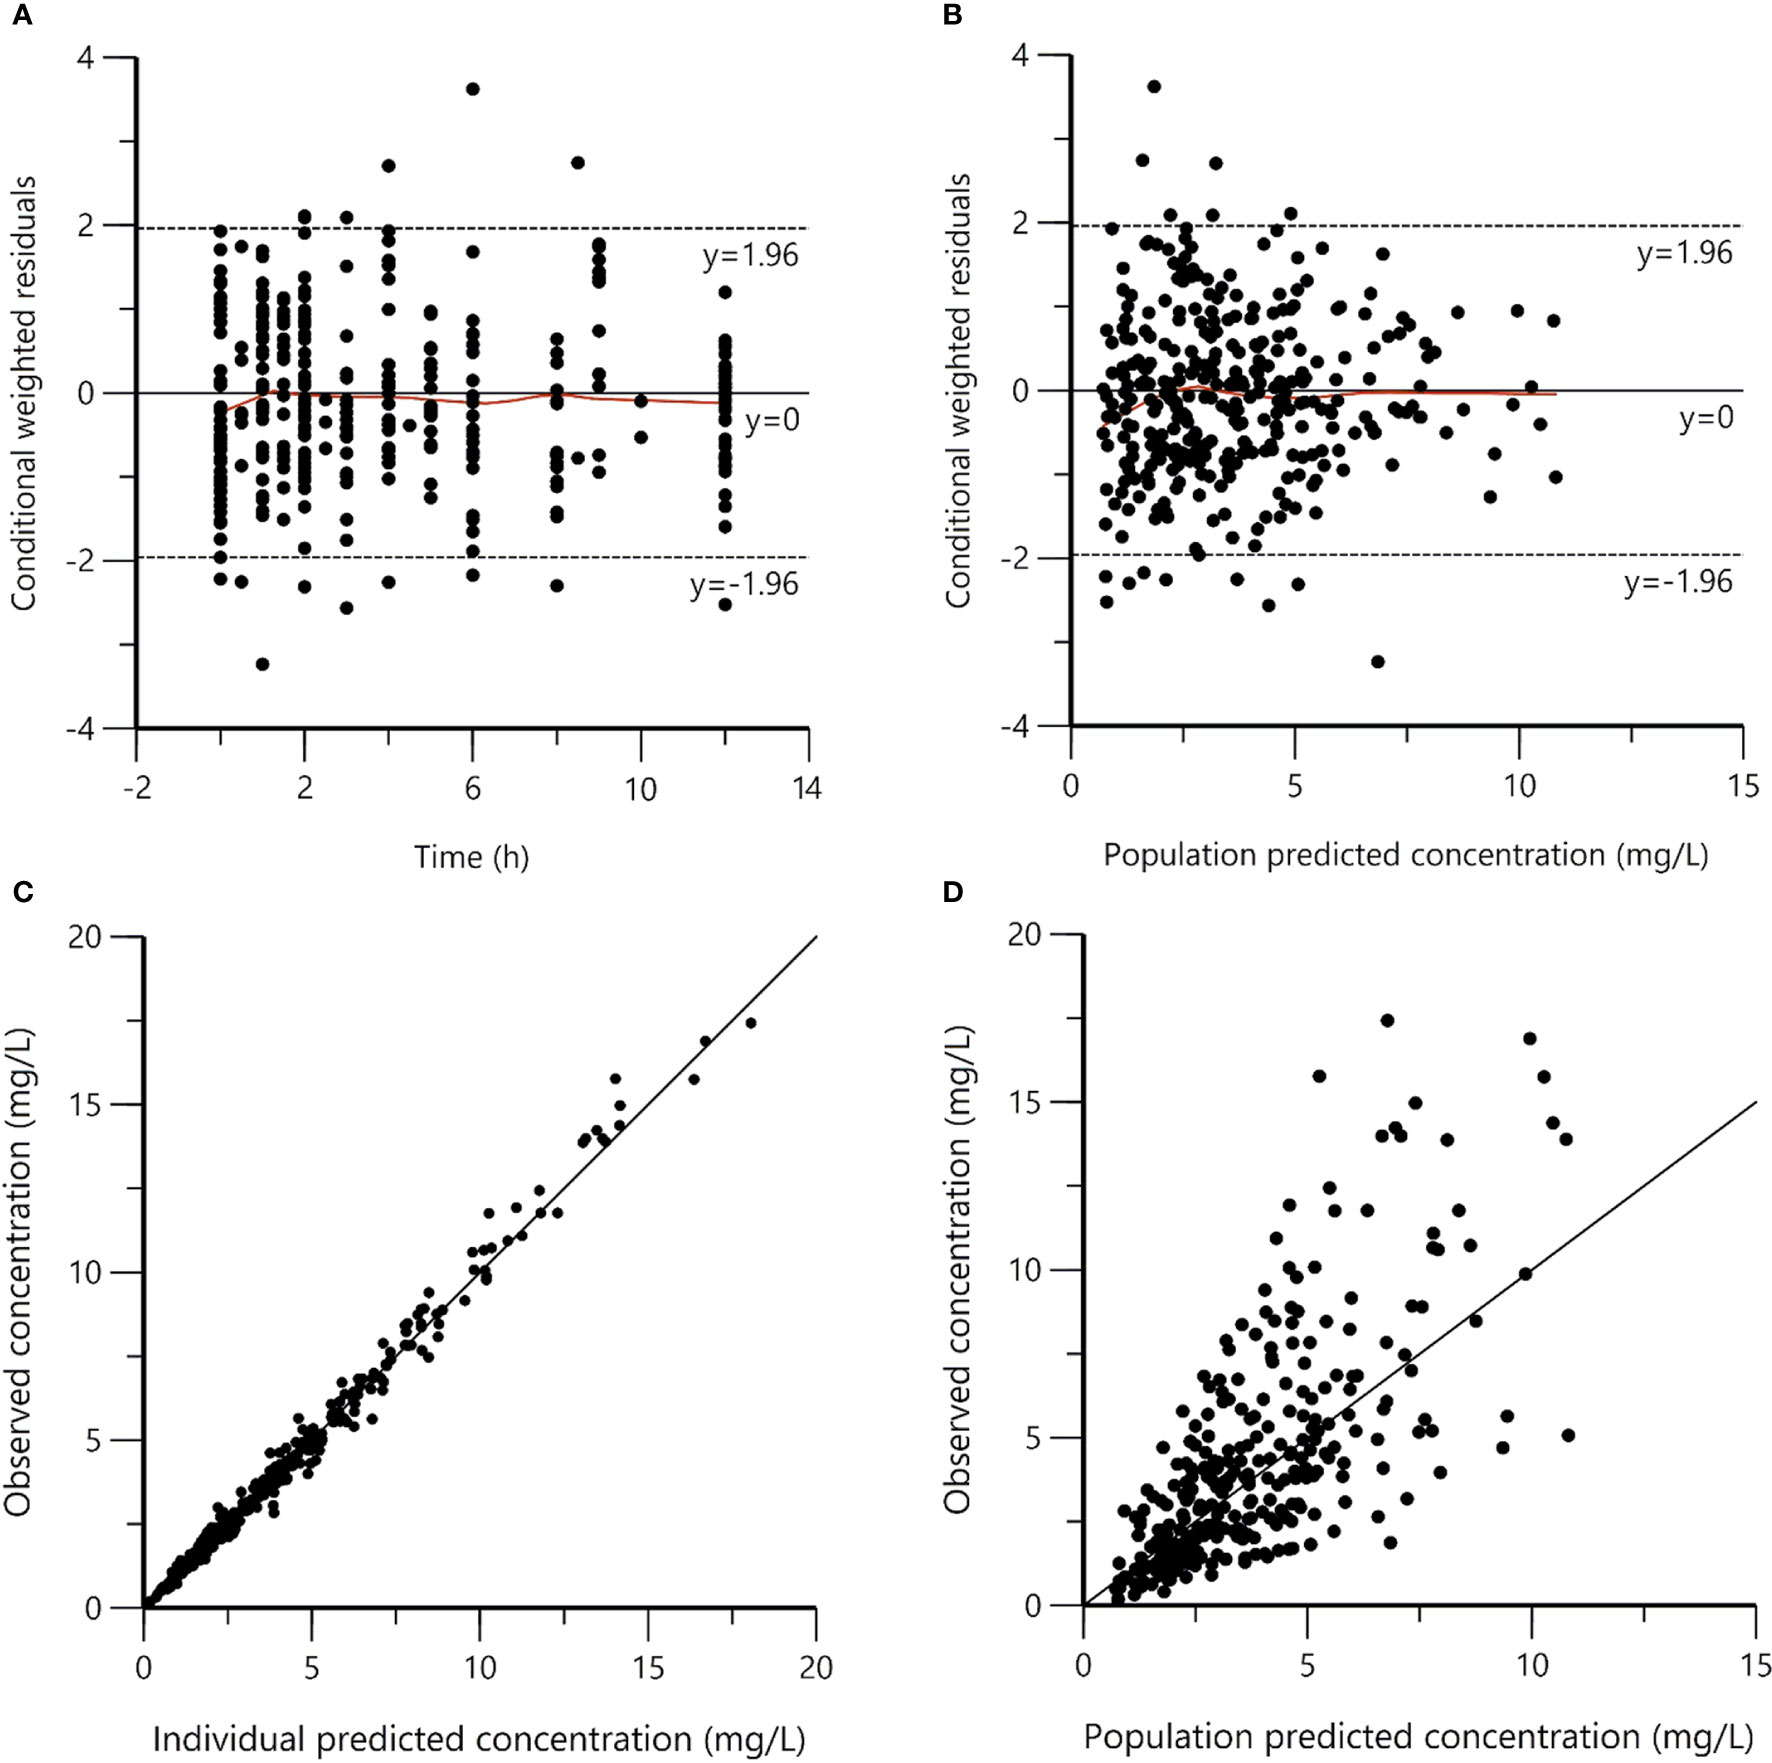
Figure 1 Goodness-of-fit plots for the final population pharmacokinetic model. (A) Conditional weighted residuals versus time (CWRES vs. IVAR); (B) Conditional weighted residuals versus population predicted concentrations (CWRES vs. PRED); (C) Observed versus individual predicted concentrations (DV vs. IPRED); (D) Observed versus population predicted concentrations (DV vs. PRED). The reds lines in panels (A, B) represent smoothed regression lines.
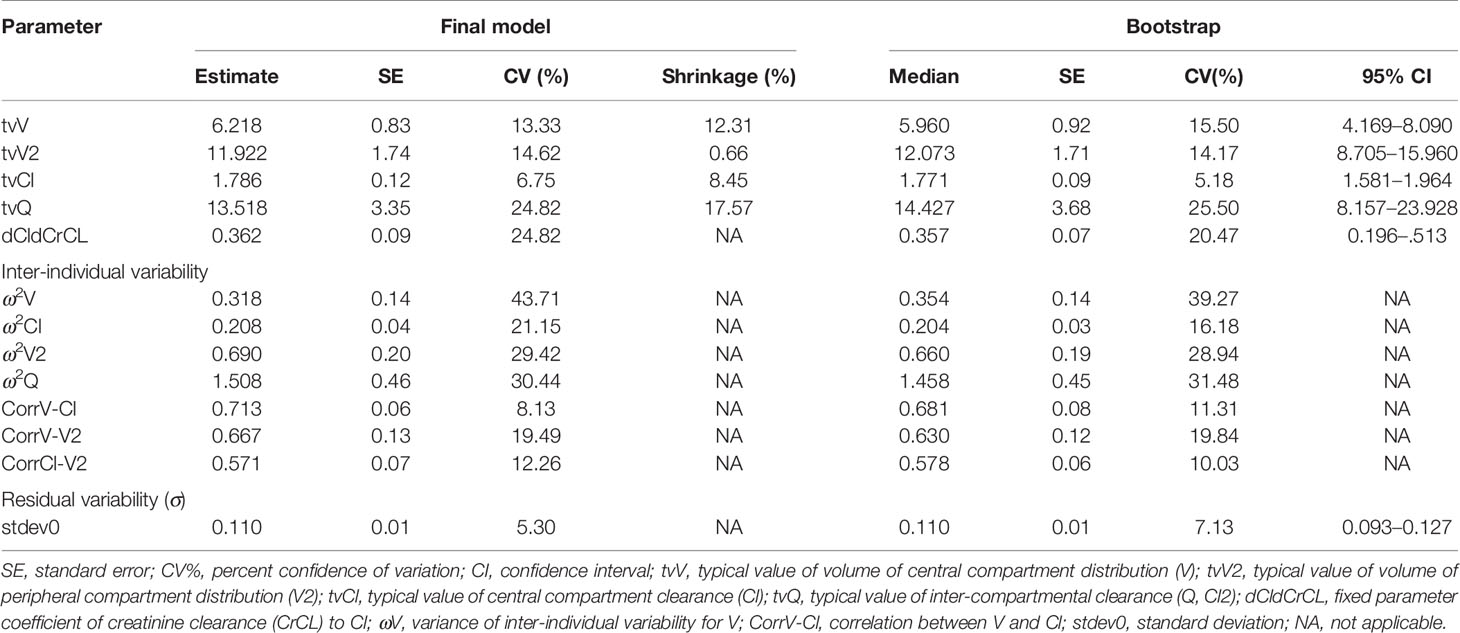
Table 2 Parameter estimates and bootstrap results of the final population pharmacokinetic model.
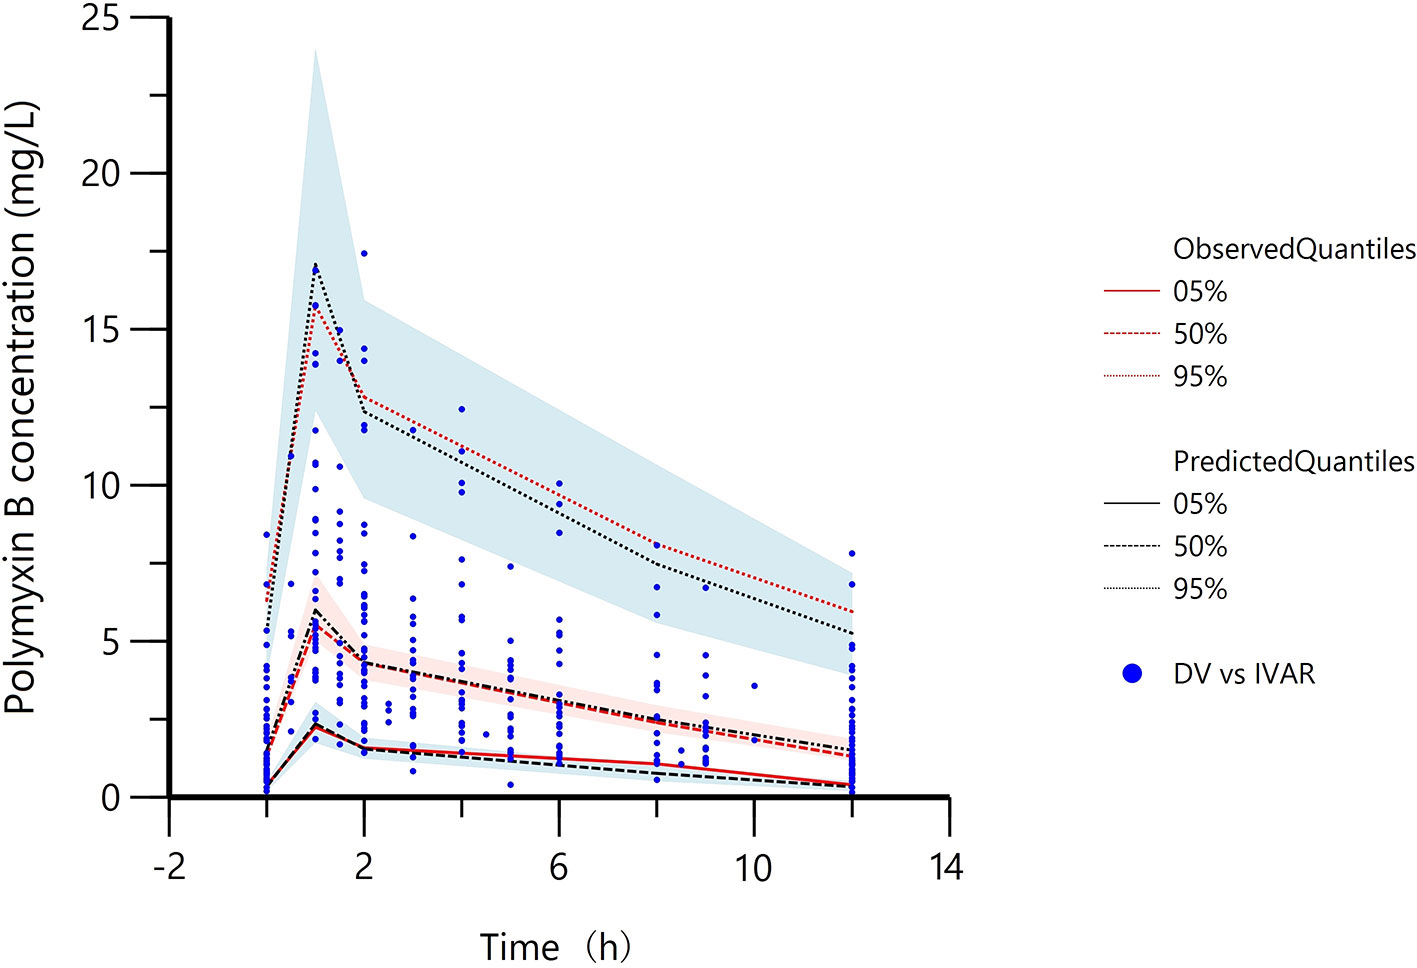
Figure 2 Prediction corrected-visual predictive check of the final model. Red lines represent the 5th, 50th, and 95th percentiles of the observed concentrations; the shaded areas represent the 90% confidence intervals of the 5th, 50th, and 95th percentiles of the simulated concentrations, respectively; the dots represent the observed data; DV, observed concentration; IVAR, Time.
The median simulated plasma concentration-time profiles of polymyxin B based on different doses and CrCL values were displayed in Figure 3, and the simulated AUC24h and Css,avg of polymyxin B on day four was quantified in Table 3.
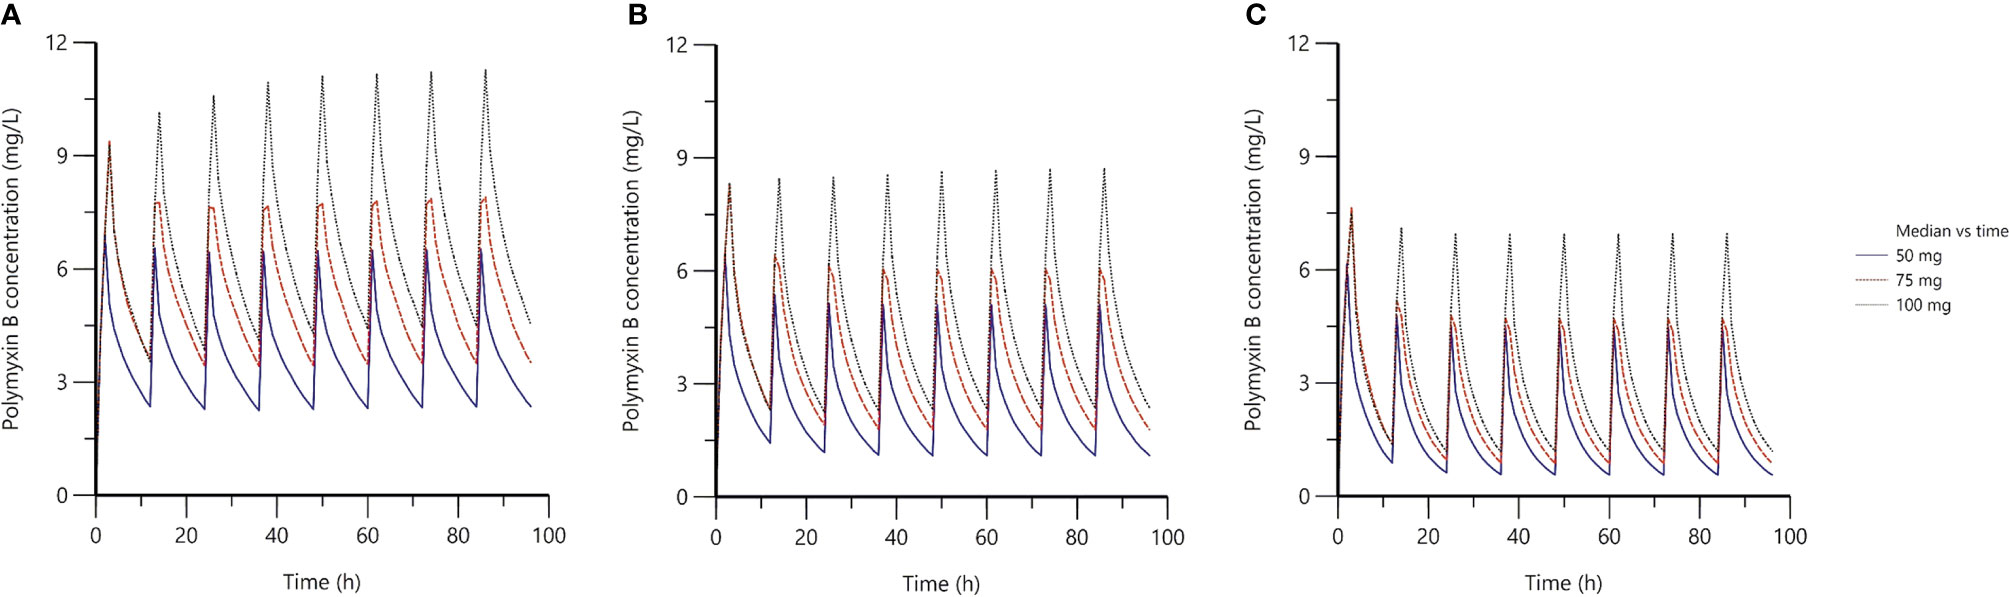
Figure 3 The median simulated plasma concentration-time profiles based on the final population PK model. (A) the creatinine clearance (CrCL) of 31.3 ml/min; (B) the CrCL of 105.9 ml/min; (C) the CrCL of 315.2 ml/min; the blue solid lines represented 100 mg loading dose with 50 mg maintenance dose twice daily; the red dash solid lines represented 150 mg loading dose with 75 mg maintenance dose twice daily; the black dot lines represented 150 mg loading dose with 100 mg maintenance dose twice daily.
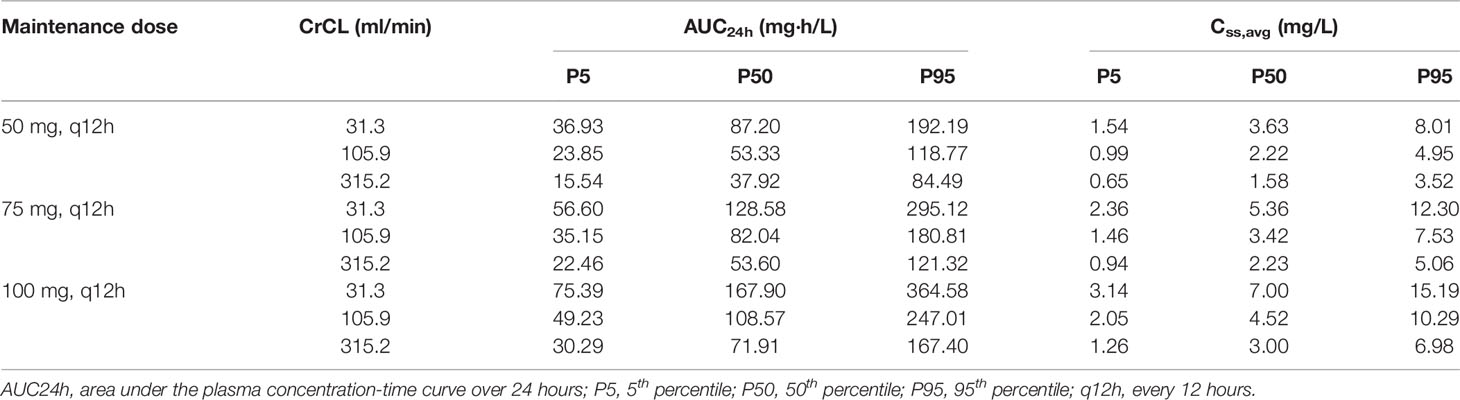
Table 3 The simulated AUC24h of polymyxin B on day four based on the final population pharmacokinetic model.
The AUC0-12 h of 46 patients was 43.64 ± 27.68 mg·h/L with a range of 8.50 to 122.84 mg·h/L. In this study, the infusion time of 37 patients was one hour, and that of others was half an hour or two hours. To ensure the accuracy of the results, only 37 patients contributed 275 plasma samples were enrolled in LSS analysis.
Ten best-performing strategies using the Bayesian approach were displayed in Table 4. The steady-state trough concentration (C0h) and peak concentration (C1h) showed a medium correlation with AUC0-12h (r2 = 0.862 and 0.846). While C2h and C4h both had a good correlation with AUC0-12h (r2 = 0.922 and 0.976). For the two, three, and four-point samples, all models showed a good agreement with the AUC0-12h (r2 ≥ 0.98). With the increase of sample points, the PE% range was narrowed down and RMSE value became small, which was consistent with the ICC and limits of agreement results. In BA analysis plots of models 6 and 10 (Figure 4), all points were within ±10% of the limits of agreement.
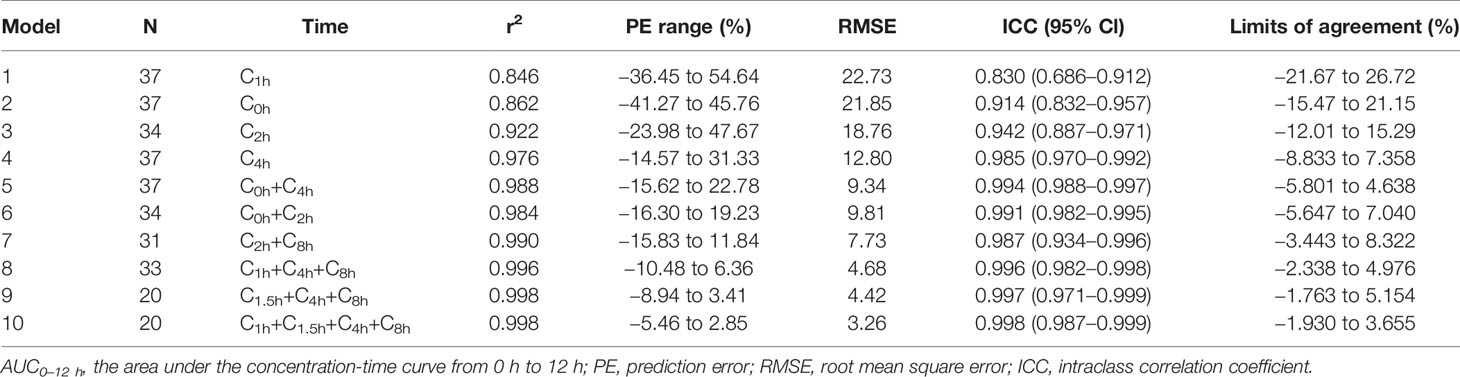
Table 4 The Bayesian approach of AUC0–12h.
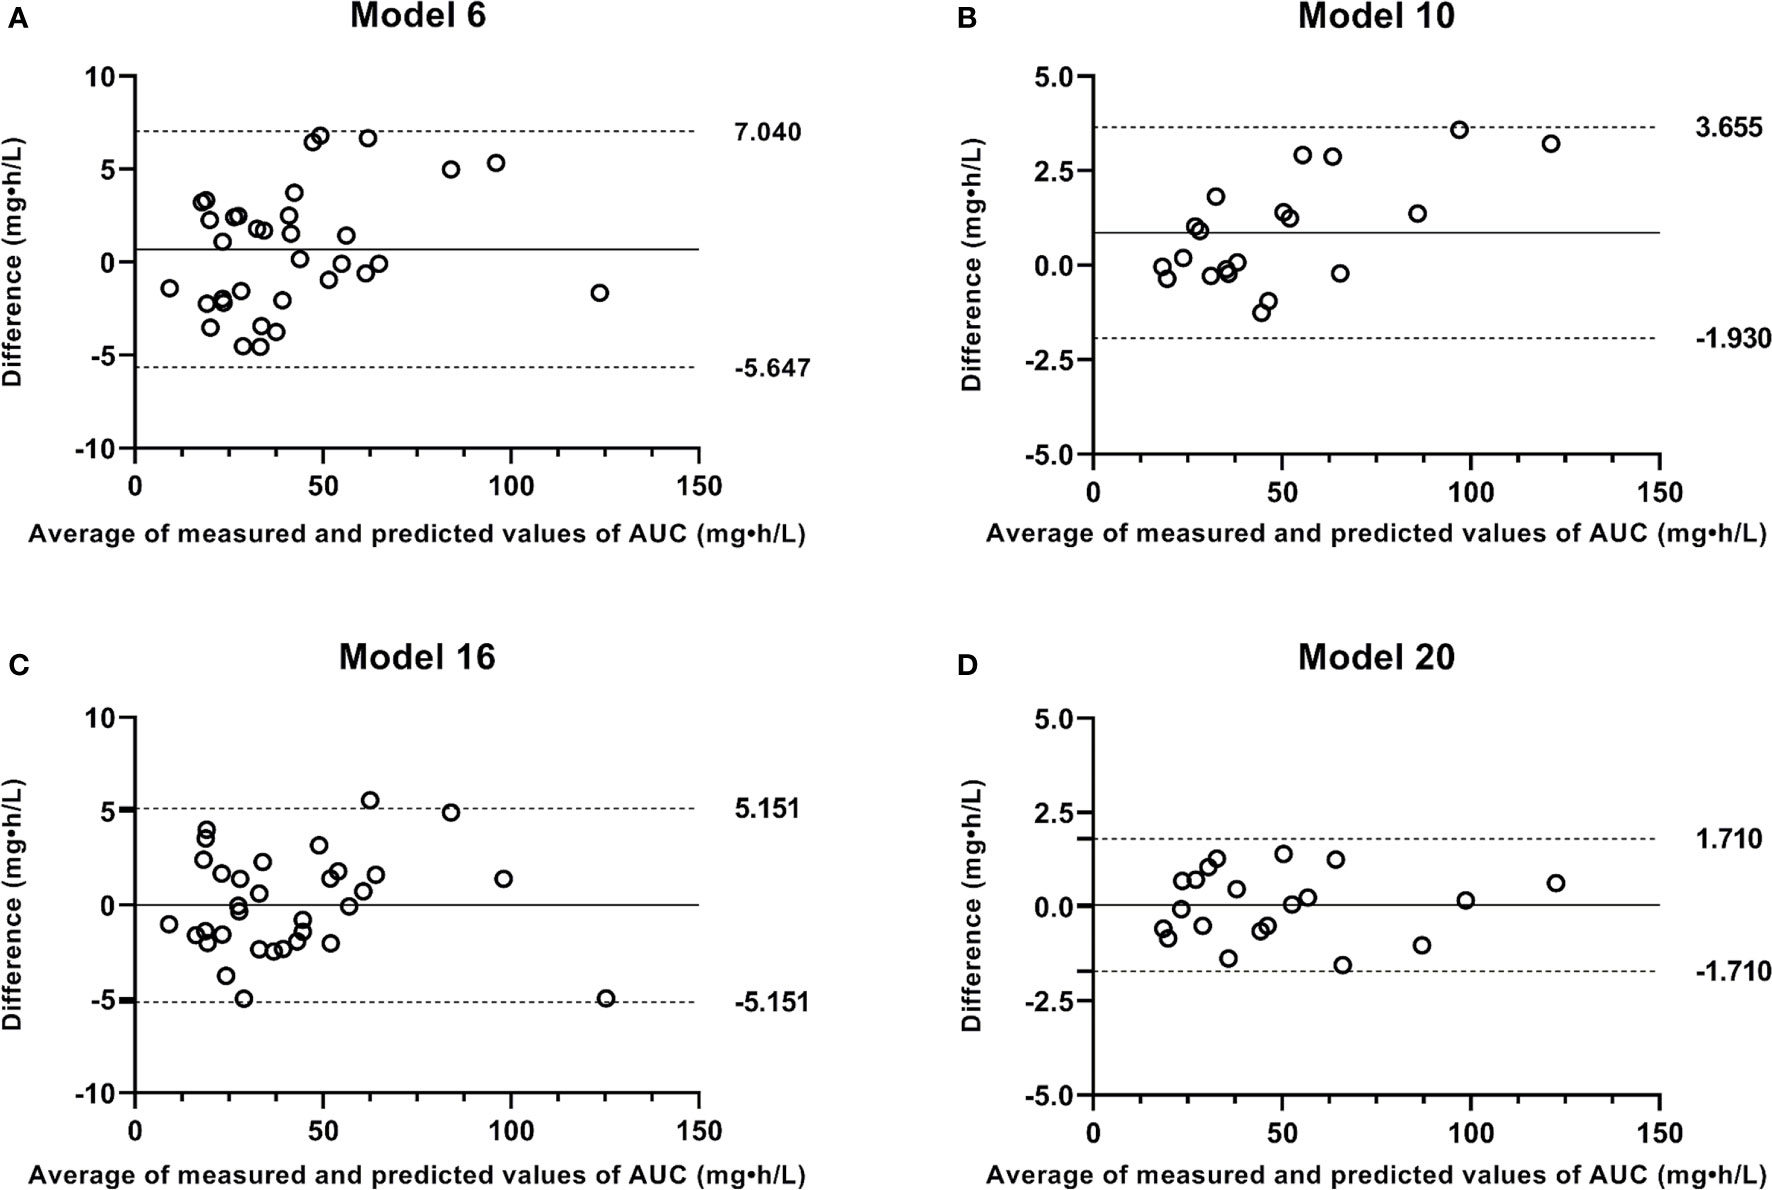
Figure 4 Bland-Altman plots of measured AUC versus predicted AUC values by Bayesian approach and limited sampling strategy. (A) model 6; (B) model 10; (C) model 16; (D) model 20.
The simple and multiple regression equations for estimating AUC0-12h with good correlation r2 were shown in Table 5. C2h model and all models using two to four samples met the acceptance criteria (Van den Elsen et al., 2018; Zhang et al., 2018). With the increase of sample points, the linear correlations between predicted and measured AUC0-12h were improved. In BA analysis plots of models 16 and 20 (Figure 4), all points were within ±10% of the limits of agreement. Based on the above analysis, all two, three, and four-point models met the criteria for acceptability in the clinic, and the four-point strategy was the best LSS.

Table 5 The linear regression analysis of AUC0–12h.
To date, few studies have been conducted on population PK of polymyxin B (Kwa et al., 2008; Sandri et al., 2013; Kubin et al., 2018; Manchandani et al., 2018; Miglis et al., 2018). To our best knowledge, this study included the largest samples and most covariates from acutely-ill patients, aimed at evaluating the population PK of polymyxin B and identifying potential factors influencing the PK variability. The result indicated a two-compartment model adequately described population PK of polymyxin B in Chinese patients. Although there were studies performed using the one-compartment model (Kwa et al., 2008; Kubin et al., 2018; Manchandani et al., 2018), which may be due to limited blood points collected at distribution and elimination phases. This study showed that the median polymyxin B CL was 1.786 L/h, which was less than those reported previously (range, 1.87–2.5 L/h). For V estimate, the median was 6.218 L, closed to 6.35 L reported by Sandri et al. (2013), and was quite different from 20.39 to 33.77 L reported by Avedissian et al. (2018) and Thamlikitkul et al. (2017). With regard to V2 and Q estimates, the values were variant in different literature, probably because variability in population PK parameter estimates was high, with CV% often >30% (20.6–73.3%) (Sandri et al., 2013; Avedissian et al., 2018; Miglis et al., 2018; Avedissian et al., 2019).
The impact of clinical variables on population PK models of polymyxin B was always inconsistent, especially the influence of body weight and CrCL on polymyxin B clearance. FDA package inserts suggested polymyxin B dose reduction in patients with renal insufficiency, which was inconsistent with the recommendation provided by international consensus guidelines for the optimal use of polymyxins (Li et al., 2019; Tsuji et al., 2019). With a low correlation coefficient (Supplementary Figure 1), this study found CrCL was a statistical covariate of polymyxin B clearance (Equ. 6), which was in agreement with other studies (Avedissian et al., 2018; Manchandani et al., 2018). However, Manchandani et al. (2018) indicated the effect was clinically insignificant. Furthermore, by comparing the clearance and exposure of polymyxin B in normal renal function patients (CrCL ≥ 80 ml/min) and renal insufficient patients (CrCL < 80 ml/min), Thamlikitkul et al. (2017) reported the exposure of polymyxin B was similar between two groups (P = 0.8) after standardizing AUC for the daily dose. The clearance value of renal insufficient group was lower than that of normal function group (2.0 L/h vs. 2.5 L/h, P = 0.06), but there was no statistical difference. This might be because renal clearance of polymyxin B was only a minor elimination pathway in both critically ill patients and animals (Zavascki et al., 2008; Abdelraouf et al., 2012; Manchandani et al., 2016b). Taken together, given the limited cases, a small number of samples collected from each patient, and different compartment models, most of the studies, including ours, found a borderline effect of CrCL on polymyxin B clearance, the correlation needed further investigation.
As for body weight, no correlation between total body weight and clearance was observed in this study. This might be because the body weight range (45–98 kg) was narrow. With a wide range of body weight (41–250 kg), Sandri et al. (2013) demonstrated that total body weight influenced the PK parameters of polymyxin B and total body clearance, and suggested loading and maintenance doses of polymyxin B were best scaled by total body weight. Further research reported the adjusted body weight rather than the total body weight may be a better factor in influencing polymyxin B exposure (Miglis et al., 2018).
Based on the 50th percentile of simulated AUC24h, after administration of three dosage regimens, the AUC24h for patients with normal renal function and renal hyperfunction was ranged from 37.92 to 108.57 mg·h/L, which was quite different from patients with renal insufficiency (87.20–167.90 mg·h/L). Accordingly, for patients with normal renal function and renal hyperfunction, a regime of 75 to 100 mg maintenance dose twice daily would be sufficient to reach the therapeutic window (AUCss,24 hr of 50–100 mgċhour/L; Tsuji et al., 2019). While, as for patients with renal dysfunction, the regime of 50 mg maintenance dose twice daily would be a better option. These observations were in agreement with a previous study, although it did not provide a dosing recommendation for patients with renal dysfunction by using a one-compartment model (Manchandani et al., 2018).
Since obtaining a full concentration-time curve to calculate the AUC is not always feasible in the clinic, LSS offers a practical approach to estimating the AUC. As shown in Tables 4 and 5, the results of single-time point model by Bayesian method were more accurate than that of linear regression analysis, and the results of multiple-time point models obtained by the two methods were similar. In single time-point models, C4h showed a better ability to predict polymyxin B AUC than C0h, C1h, and C2h in both methods. It was likely that C0h, C1h, and C2h were obtained in elimination, absorption, and distribution phases; while, C4h was obtained between distribution and elimination phases, which could better predict polymyxin B exposure. In multiple time-point models, all models (Tables 4 and 5) displayed a good agreement with the measured AUC0-12 h (r2 ≥ 0.98), which was acceptable for polymyxin B TDM. The 4-point models (C1h, C1.5h, C4h, and C8h), which included the absorption, distribution, and elimination phases, were the best predictor of polymyxin B AUC0-12h. Additionally, it was reported a 2-point model including C0h, and C2h was appropriate for colistin TDM (r2 = 0.98) because the C0h sample had an association with renal toxicity and the C2h sample was essential to monitor efficacy (Kim et al., 2019). This result was in agreement with that of model 16 in this study. Accordingly, models 5 to 10 and 15 to 20 all can be recommended for polymyxin B TDM, especially C0h-C2h and C1h-C1.5h-C4h-C8h models.
Our study has several limitations. Firstly, this study enrolled a relatively small number of patients, leading to a lack of external validation of the population PK model and LSS. Future studies should evaluate the PK of polymyxin B with a larger population. Second, since patients with diverse underlying conditions, drug-drug interactions, and co-administration of other antibiotics were not included in the population PK model. Third, individual PK parameters may change during therapy occasions. Through the modeling, ignoring inter-occasion variability may lead to a big bias in parameter estimates, especially for drugs with large intra-individual variability that require TDM (Karlsson and Sheiner, 1993; Abrantes et al., 2019). However, since all data were collected on day four, whether this population PK model is suitable for other occasions is still unknown. Fourth, the LSS results were only applicable to patients who intravenously infused polymyxin B for one hour. Finally, the efficacy and toxicity thresholds based on clinical outcomes were not investigated in this study, which was the next work of our group.
In conclusion, a two-compartment population PK model was successfully established to characterize the PK parameters of polymyxin B in Chinese patients with MDR Gram-negative bacterial infections. Furthermore, as far as we know, this is the first study to develop and validate the LSS of polymyxin B. The results suggested 2-point model (C0h and C2h) and 4-point model (C1h, C1.5h, C4h, and C8h) performed well in predicting polymyxin B AUC, which could be applied in clinical practice to assist TDM of polymyxin B.
All datasets generated for this study are included in the article/Supplementary Material.
The studies involving human participants were reviewed and approved by Zhengzhou University Medical Research and Ethics Committee. The patients/participants provided their written informed consent to participate in this study.
PW and JY designed the research. QZ performed the experiments. ZZ analyzed the results. MF, TS, and XZ supervised the research and revised the manuscript. All authors approved the final manuscript.
This work was supported by the National Natural Science Foundation of China (Grant No. 81703799 and 81803638).
The authors declare that the research was conducted in the absence of any commercial or financial relationships that could be construed as a potential conflict of interest.
The Supplementary Material for this article can be found online at: https://www.frontiersin.org/articles/10.3389/fphar.2020.00829/full#supplementary-material
Abdelraouf, K., He, J., Ledesma, K. R., Hu, M., Tam, V. H. (2012). Pharmacokinetics and renal disposition of polymyxin B in an animal model. Antimicrob. Agents Ch. 56, 5724–5727. doi: 10.1128/AAC.01333-12
Abrantes, J. A., Jönsson, S., Karlsson, M. O., Nielsen, E. I. (2019). Handling interoccasion variability in model-based dose individualization using therapeutic drug monitoring data. Brit J. Clin. Pharmaco. 85, 1326–1336. doi: 10.1111/bcp.13901
Alosaimy, S., Jorgensen, S. C., Rybak, M. J. (2019). The optimal use of the polymyxins before their time is up. Pharmacotherapy 39, 7–9. doi: 10.1002/phar.2207
Avedissian, S. N., Miglis, C., Kubin, C. J., Rhodes, N. J., Yin, M. T., Cremers, S., et al. (2018). Polymyxin B pharmacokinetics in adult cystic fibrosis patients. Pharmacotherapy 38, 730–738. doi: 10.1002/phar.2129
Avedissian, S. N., Liu, J., Rhodes, N. J., Lee, A., Pais, G. M., Hauser, A. R., et al. (2019). A review of the clinical pharmacokinetics of polymyxin B. Antibiotics 8, 31. doi: 10.3390/antibiotics8010031
Bergen, P. J., Landersdorfer, C. B., Zhang, J., Zhao, M., Lee, H. J., Nation, R. L., et al. (2012). Pharmacokinetics and pharmacodynamics of ‘old' polymyxins: what is new? Diagn. Micr. Infec. Dis. 74, 213–223. doi: 10.1016/j.diagmicrobio.2012.07.010
David, O., Johnston, A. (2000). Limited sampling strategy. Clin. Pharmacokinet. 39, 311–311. doi: 10.2165/00003088-200039040-00006
Janmahasatian, S., Duffull, S. B., Ash, S., Ward, L. C., Byrne, N. M., Green, B. (2005). Quantification of lean bodyweight. Clin. Pharmacokinet. 44, 1051–1065. doi: 10.2165/00003088-200544100-00004
Karlsson, M. O., Sheiner, L. B. (1993). The importance of modeling interoccasion variability in population pharmacokinetic analyses. J. Pharmacokinet. Biop. 21, 735–750. doi: 10.1007/BF01113502
Kim, E. J., Oh, J., Lee, K., Yu, K. S., Chung, J. Y., Hwang, J. H., et al. (2019). Pharmacokinetic characteristics and limited sampling strategy for therapeutic drug monitoring of colistin in patients with multidrug-resistant Gram-negative bacterial infections. Ther. Drug Monit. 41, 102–106. doi: 10.1097/FTD.0000000000000572
Kubin, C. J., Nelson, B. C., Miglis, C., Scheetz, M. H., Rhodes, N. J., Avedissian, S. N., et al. (2018). Population pharmacokinetics of intravenous polymyxin B from clinical samples. Antimicrob. Agents Ch. 62, e01493–e01417. doi: 10.1128/AAC.01493-17
Kwa, A. L., Lim, T. P., Low, J. G., Hou, J., Kurup, A., Prince, R. A., et al. (2008). Pharmacokinetics of polymyxin B1 in patients with multidrug-resistant Gram-negative bacterial infections. Diagn. Micr. Infec. Dis. 60, 163–167. doi: 10.1016/j.diagmicrobio.2007.08.008
Lakota, E. A., Landersdorfer, C. B., Nation, R. L., Li, J., Kaye, K. S., Rao, G. G., et al. (2018). Personalizing polymyxin B dosing using an adaptive feedback control algorithm. Antimicrob. Agents Ch. 62, e00483–e00418. doi: 10.1128/AAC.00483-18
Landersdorfer, C. B., Wang, J., Wirth, V., Chen, K., Kaye, K. S., Tsuji, B. T., et al. (2018). Pharmacokinetics/pharmacodynamics of systemically administered polymyxin B against Klebsiella pneumoniae in mouse thigh and lung infection models. J. Antimicrob. Chemoth. 73, 462–468. doi: 10.1093/jac/dkx409
Li, J., Coulthard, K., Nation, R. L. (2019). “Labelling conventions and product package insert of parenteral polymyxins: factors causing potential medication errors and impeding optimal clinical use,” in Polymyxin Antibiotics: From Laboratory Bench to Bedside, vol. 1145. (Cham: Springer), 133–141. doi: 10.1007/978-3-030-16373-0_10
Manchandani, P., Dubrovskaya, Y., Gao, S., Tam, V. H. (2016a). Comparative pharmacokinetic profiling of different polymyxin B components. Antimicrobial. Agents Chemother. 60, 6980–6982. doi: 10.1128/AAC.00702-16
Manchandani, P., Zhou, J., Ledesma, K. R., Truong, L. D., Chow, D. S. L., Eriksen, J. L., et al. (2016b). Characterization of polymyxin B biodistribution and disposition in an animal model. Antimicrob. Agents Ch. 60, 1029–1034. doi: 10.1128/AAC.02445-15
Manchandani, P., Thamlikitkul, V., Dubrovskaya, Y., Babic, J. T., Lye, D. C., Lee, L. S., et al. (2018). Population pharmacokinetics of polymyxin B. Clin. Pharmacol. Ther. 104, 534–538. doi: 10.1002/cpt.981
Miglis, C., Rhodes, N. J., Avedissian, S. N., Kubin, C. J., Yin, M. T., Nelson, B. C., et al. (2018). Population pharmacokinetics of polymyxin B in acutely ill adult patients. Antimicrob. Agents Ch. 62, e01475–e01417. doi: 10.1128/AAC.01475-17
Nation, R. L., Li, J., Cars, O., Couet, W., Dudley, M. N., Kaye, K. S., et al. (2015). Framework for optimisation of the clinical use of colistin and polymyxin B: the Prato polymyxin consensus. Lancet Infect. Dis. 15, 225–234. doi: 10.1016/S1473-3099(14)70850-3
Sandri, A. M., Landersdorfer, C. B., Jacob, J., Boniatti, M. M., Dalarosa, M. G., Falci, D. R., et al. (2013). Population pharmacokinetics of intravenous polymyxin B in critically ill patients: implications for selection of dosage regimens. Clin. Infect. Dis. 57, 524–531. doi: 10.1093/cid/cit334
Tam, V. H., Schilling, A. N., Vo, G., Kabbara, S., Kwa, A. L., Wiederhold, N. P., et al. (2005). Pharmacodynamics of polymyxin B against Pseudomonas aeruginosa. Antimicrob. Agents Ch. 49, 3624–3630. doi: 10.1128/AAC.49.9.3624-3630.2005
Tam, V. H., Cao, H., Ledesma, K. R., Hu, M. (2011). In vitro potency of various polymyxin B components. Antimicrob. Agents Ch. 55, 4490–4491. doi: 10.1128/AAC.00119-11
Thamlikitkul, V., Dubrovskaya, Y., Manchandani, P., Ngamprasertchai, T., Boonyasiri, A., Babic, J. T., et al. (2017). Dosing and pharmacokinetics of polymyxin B in patients with renal insufficiency. Antimicrob. Agents Ch. 61, e01337–e01316. doi: 10.1128/AAC.01337-16
Tsuji, B. T., Landersdorfer, C. B., Lenhard, J. R., Cheah, S. E., Thamlikitkul, V., Rao, G. G., et al. (2016). Paradoxical effect of polymyxin B: high drug exposure amplifies resistance in Acinetobacter baumannii. Antimicrob. Agents Ch. 60, 3913–3920. doi: 10.1128/AAC.02831-15
Tsuji, B. T., Pogue, J. M., Zavascki, A. P., Paul, M., Daikos, G. L., Forrest, A., et al. (2019). International consensus guidelines for the optimal use of the polymyxins: endorsed by the American College of Clinical Pharmacy (ACCP), European Society of Clinical Microbiology and Infectious Diseases (ESCMID), Infectious Diseases Society of America (IDSA), International Society for Anti-infective Pharmacology (ISAP), Society of Critical Care Medicine (SCCM), and Society of Infectious Diseases Pharmacists (SIDP). Pharmacotherapy 39, 10–39. doi: 10.1002/phar.2209
Van den Elsen, S. H., Sturkenboom, M. G., Van't Boveneind-Vrubleuskaya, N., Skrahina, A., van der Werf, T. S., Heysell, S. K., et al. (2018). Population pharmacokinetic model and limited sampling strategies for personalized dosing of levofloxacin in tuberculosis patients. Antimicrob. Agents Ch. 62, e01092–e01018. doi: 10.1128/AAC.01092-18
Van Der Galiën, R., Van't Boveneind-Vrubleuskaya, N., Peloquin, C., Skrahina, A., Touw, D. J., Alffenaar, J.-W. C. (2020). Pharmacokinetic modeling, simulation, and development of a limited sampling strategy of cycloserine in patients with multidrug-/extensively drug-resistant tuberculosis. Clin. Pharmacokinet., 1–12. doi: 10.1007/s40262-020-00860-8
Velkov, T., Roberts, K. D., Nation, R. L., Thompson, P. E., Li, J. (2013). Pharmacology of polymyxins: new insights into an ‘old' class of antibiotics. Future Microbiol. 8, 711–724. doi: 10.2217/fmb.13.39
Wang, P. L., Zhang, Q. W., Qin, Z. F., Xing, H., Xu, M., Pei, H., et al. (2020). A simple and robust LC-MS/MS analytical method for therapeutic drug monitoring of plasma and cerebrospinal fluid polymyxin B1 and B2. Ther. Drug Monit. Accepted. doi: 10.1097/FTD.0000000000000754
Zavascki, A. P., Goldani, L. Z., Cao, G., Superti, S. V., Lutz, L., Barth, A. L., et al. (2008). Pharmacokinetics of intravenous polymyxin B in critically ill patients. Clin. Infect. Dis. 47, 1298–1304. doi: 10.1086/592577
Keywords: polymyxin B, population pharmacokinetics, limited sampling strategy, therapeutic drug monitoring, multidrug-resistant Gram-negative bacterial infection
Citation: Wang P, Zhang Q, Zhu Z, Feng M, Sun T, Yang J and Zhang X (2020) Population Pharmacokinetics and Limited Sampling Strategy for Therapeutic Drug Monitoring of Polymyxin B in Chinese Patients With Multidrug-Resistant Gram-Negative Bacterial Infections. Front. Pharmacol. 11:829. doi: 10.3389/fphar.2020.00829
Received: 17 March 2020; Accepted: 20 May 2020;
Published: 05 June 2020.
Edited by:
Thomas Dorlo, The Netherlands Cancer Institute (NKI), NetherlandsReviewed by:
Lena Friberg, Uppsala University, SwedenCopyright © 2020 Wang, Zhang, Zhu, Feng, Sun, Yang and Zhang. This is an open-access article distributed under the terms of the Creative Commons Attribution License (CC BY). The use, distribution or reproduction in other forums is permitted, provided the original author(s) and the copyright owner(s) are credited and that the original publication in this journal is cited, in accordance with accepted academic practice. No use, distribution or reproduction is permitted which does not comply with these terms.
*Correspondence: Jing Yang, amluZ3lhbmdfMDEwMUAxNjMuY29t; Xiaojian Zhang, emhhbmd4ajY2ODZAMTYzLmNvbQ==
Disclaimer: All claims expressed in this article are solely those of the authors and do not necessarily represent those of their affiliated organizations, or those of the publisher, the editors and the reviewers. Any product that may be evaluated in this article or claim that may be made by its manufacturer is not guaranteed or endorsed by the publisher.
Research integrity at Frontiers
Learn more about the work of our research integrity team to safeguard the quality of each article we publish.