
95% of researchers rate our articles as excellent or good
Learn more about the work of our research integrity team to safeguard the quality of each article we publish.
Find out more
ORIGINAL RESEARCH article
Front. Pharmacol. , 30 April 2020
Sec. Drugs Outcomes Research and Policies
Volume 11 - 2020 | https://doi.org/10.3389/fphar.2020.00589
This article is part of the Research Topic Drug Prevention and Treatment of Benign Prostatic Diseases: from Clinical Original to Translational Research View all 8 articles
 Xinyang Liao1†Zhuang Tang2†Jianzhong Ai1†Hang Xu1Shiyu Zhang1Liangren Liu1Shi Qiu1,3Ping Tan1Yu Fan1
 Lu Yang1*
 Qiang Wei1*
Objective: Identifying biomarkers of prostatic inflammation has been a question of great interest in the development of anti-inflammatory pharmacotherapy for lower urinary tract symptoms suggestive of benign prostatic hyperplasia (LUTS/BPH). Systemic inflammation and serum prostate-specific antigen (PSA) have been linked with prostatic inflammation. This study set out to develop a diagnostic model for prostatic inflammation using clinical and laboratory parameters.
Methods: We included LUTS/BPH patients undergoing transurethral resection of the prostate. The severity of prostatic inflammation was determined by pathological review. Clinical manifestations and preoperative laboratory test results were recorded. We used LASSO regression with 10-fold cross-validation to select variables with the most diagnostic value of prostatic inflammation. Furthermore, we used multivariable logistic regression analysis to develop the diagnostic model, presented in a nomogram. The discrimination, calibration of the post-LASSO diagnostic model, and the model supplemented with clinical parameters were assessed. Decision curve analysis was performed.
Results: A total of 164 patients were included. Of all patients, 97 (59.1%) had no or mild prostatic inflammation, and 67 (40.9%) had moderate to severe prostatic inflammation. A higher peripheral white blood cell count, higher peripheral lymphocyte count, lower free/total (f/t) PSA ratio, and acute urinary retention history were associated with a higher risk of moderate to severe prostatic inflammation. Peripheral lymphocyte count and f/t PSA ratio were selected by the LASSO method and entered into the nomogram. The post-LASSO diagnostic model had an AUC of 0.756 (95% CI: 0.684–0.829) and good calibration. The addition of clinical parameters failed to show incremental diagnostic value. The decision curve analysis demonstrated that the post-LASSO laboratory nomogram was clinically useful.
Conclusion: Our findings demonstrated that peripheral lymphocyte count and f/t PSA ratio appear to be reliable diagnostic markers, based on which we build a clinically useful nomogram for prostatic inflammation. This diagnostic model could facilitate the development of anti-inflammatory pharmacotherapy for LUTS/BPH. Before this model is adopted in clinical practice, future validation is needed to determine its clinical utility.
Prostatic inflammation plays a crucial role in the pathogenesis and progression of lower urinary tract symptoms secondary to benign prostatic hyperplasia (LUTS/BPH). It is now well established from a variety of studies that prostatic inflammation is associated with higher International Prostate Symptom Score (IPSS) and prostate volume. (Di Silverio et al., 2003; Nickel et al., 2008; Robert et al., 2009) The inflammatory cells in prostates can give rise to cytokines and growth factors that stimulate the hyper-proliferation of prostatic stromal and epithelial cells. Besides, it has been hypothesized that inflammatory infiltrate could lead to tissue damage, a continuous process of wound healing, and subsequently prostatic enlargement (De Nunzio et al., 2011).
Prostatic inflammation is also demonstrated to be a treatment target for male LUTS/BPH and predictive of treatment response. Previous studies (Addla et al., 2006; Altavilla et al., 2012) have established that anti-inflammatory drugs are effective in the treatment of LUTS/BPH. And a recent meta-analysis of randomized controlled trials (Kahokehr et al., 2013) concluded that non-steroidal anti-inflammatory drugs improved urinary symptom and flow measures. Furthermore, previous research (Kwon et al., 2010) found that a higher grade of prostatic inflammation portends poorer response to medical treatment, including alpha-adrenergic blockers and 5-alpha reductase inhibitors. BPH patients with prostatic inflammation might benefit from anti-inflammatory pharmacotherapy, whereas those without prostatic inflammation might not.
How to identify patients with prostatic inflammation is of interest because of the pivotal role of prostatic inflammation in pathogenesis and management of LUTS/BPH. However, it is a challenging clinical problem. Prostatic inflammation can be pathologically confirmed in patients undergoing prostate biopsies. But the majority of patients bothered by LUTS/BPH do not receive any prostate biopsy. Previous studies explored laboratory biomarkers, including interleukin 8 in seminal plasma (Liu et al., 2009) and inducible T-cell co-stimulator in urine (Robert et al., 2011). These biomarkers can help identify prostatic inflammation. However, neither of these tests are available in clinical practice and can be expensive.
Systemic inflammation contributes to the initiation or progression of prostatic inflammation. Previous research has established that systemic inflammatory markers, including C-reactive protein, soluble tumor necrosis factor-alpha receptor II, interleukin 6 (Schenk et al., 2010), neutrophil-lymphocyte ratio (Ozer et al., 2017), and peripheral white blood cell (WBC) count (Fujita et al., 2014) are correlated with the severity of LUTS/BPH. Besides, some risk factors of LUTS/BPH, including obesity (Parsons et al., 2006), atherosclerosis (Berger et al., 2006), periodontal disease (Wu et al., 2019), and diabetes (Breyer and Sarma, 2014) are associated with systemic inflammation. Taken together, these studies suggest that systemic inflammation may worsen BPH symptoms by inducing prostatic inflammation.
Systemic inflammatory markers obtained from routine admission blood tests can be indicators of systemic inflammation. In addition to systemic inflammation, free/total prostate-specific antigen (f/t PSA) ratio (Jung et al., 1998) and clinical symptoms (Nickel et al., 2008) were also reported to be correlated with prostatic inflammation. This study set out to develop a diagnostic model for prostatic inflammation using clinical and laboratory parameters.
This study was retrospectively carried out at the Department of Urology in West China Hospital from January 1, 2012 to December 31, 2016. All data and specimens were collected anonymously without any identifier. We evaluated 284 male patients who received the transurethral resection of the prostate (TURP) due to LUTS/BPH. Exclusion criteria were any acute infection in one month before TURP, previous surgeries involving the urinary tract, incidental prostate cancer, hematological malignancy or the use of medicine interfering with the peripheral blood parameters in the three months before surgery, which included non-steroidal anti-inflammatory drugs, phosphodiesterase type 5 inhibitors, vitamins, and statin (Figure 1).
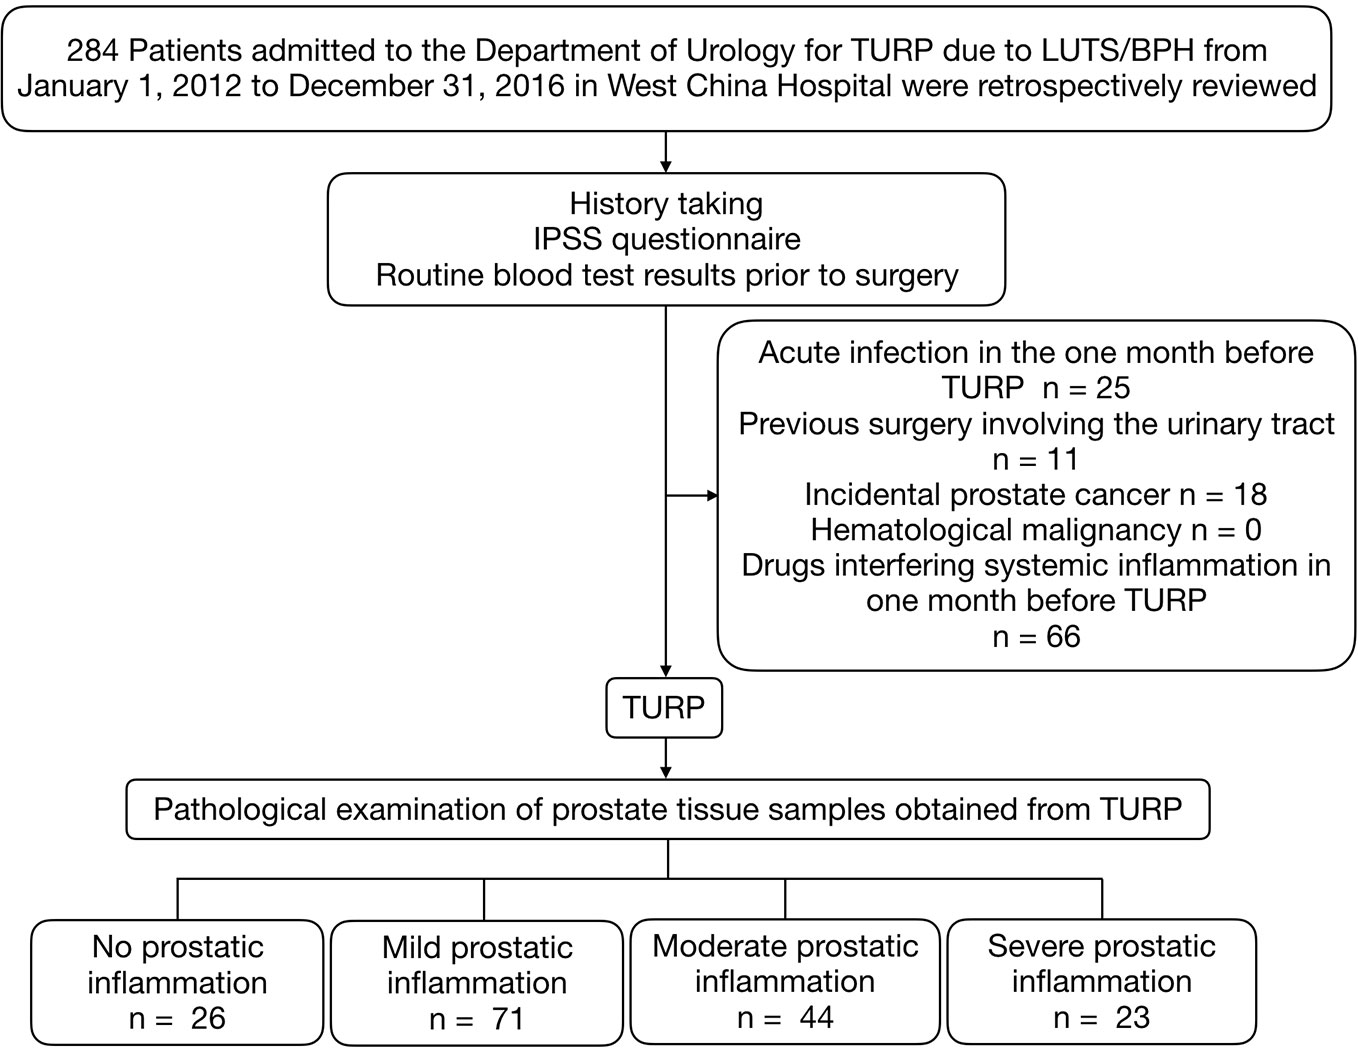
Figure 1 Patients selection process. TURP, transurethral resection of the prostate; IPSS, International Prostate Symptom Score; LUTS/BPH, lower urinary tract symptoms secondary to benign prostatic hyperplasia.
Free and total PSA, IPSS, acute urinary retention (AUR) history, routine admission blood test results including peripheral WBC count, neutrophil count, lymphocyte count, platelet, albumin, fibrinogen, neutrophil-lymphocyte ratio (NLR), platelet to lymphocyte ratio (PLR), and systemic immune-inflammation index (SII) were recorded within one week before surgery. Total and free PSA were measured via automated electrochemiluminescent immunoassays using the Elecsys assay kits from Roche Diagnostics. Prostate volumes (PV) were assessed by transrectal ultrasound, using the Philips HDI 5000 ultrasound system and the standard ellipsoid formula (width × height × length × π/6) as per Rodriguez et al. (2008). IPSS was categorized as “asymptomatic” (0), “mildly symptomatic” (1–7), “moderately symptomatic” (8–19), and “severely symptomatic” (20–35). Prostatic inflammation of TURP specimen was individually graded by XL and ZT, according to the criteria recommended by North American Chronic Prostatitis Collaborative Research Network (CPCRN) and International Prostatitis Collaborative Network (IPCN) (Nickel et al., 2001) (Figure 2). Divergences were resolved by QW.
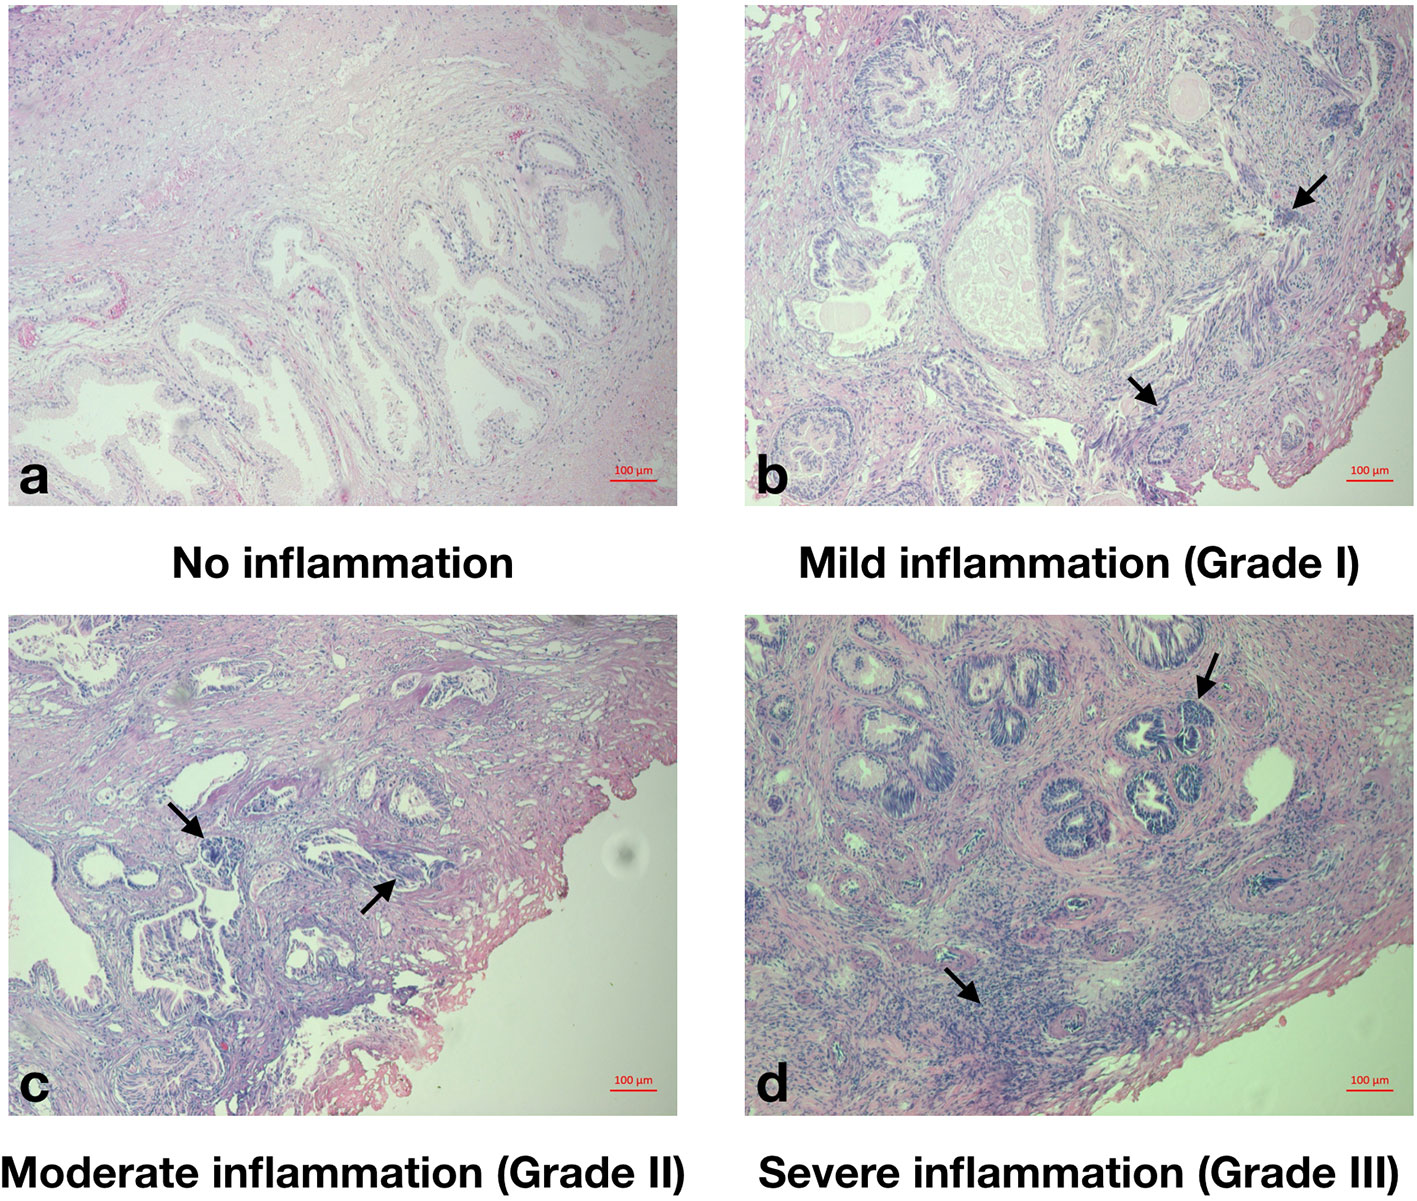
Figure 2 Histopathological grade of prostatic inflammation. (A), No prostatic inflammation. There was no inflammatory cell. (B), Mild prostatic inflammation (Grade I). There were scattered inflammatory cells infiltrate within the stroma. (C), Moderate prostatic inflammation (Grade II). There were non-confluent lymphoid nodules. (D), Severe prostatic inflammation (Grade III). There were large inflammatory areas with confluence of infiltrate.
Categorical variables were described by frequencies and percentages. Continuous variables were described by means and standard deviations. We compared patient characteristics of two groups (no or mild prostatic inflammation group vs. moderate or severe prostatic inflammation group) using the Student's t-test for continuous variables and the Chi-squared test for categorical variables. The univariate logistic regression model was used to evaluate the associations between patient characteristics and the grade of prostatic inflammation.
By the least absolute shrinkage and selection operator (LASSO) method with 10-fold cross-validation, the optimal tuning parameter lambda (λ) was chosen as the highest λ for which the mean-squared error was within one standard deviation of the minimum (Hastie et al., 2009). With the optimal λ identified, variables with non-zero coefficients were the ones with most diagnostic value, thus selected into the diagnostic nomogram. We used a multivariable binary logistic regression model of selected variables to develop the nomogram. We assessed the model discrimination by the receiver-operating characteristic (ROC) curve and reported the area under the curve (AUC). We determined the optimal cutoff by Youden's index and calculated the sensitivity and specificity. AUCs of the post-LASSO model and the model supplemented by clinical parameters were compared. The calibration curve with the bootstrap approach (the number of bootstrap repetitions B = 500) was plotted to assess the calibration of the nomogram, accompanied by the Hosmer-Lemeshow test in which a significant p-value indicates the model doesn't calibrate perfectly. Decision curve analysis was conducted. We conducted all the analyses using R software version 3.4.1 (http://www.r-project.org). Statistical significance was defined as a two-tailed p-value <0.05. The data collected and analyzed in this study is publicly available from Figshare (DOI: 10.6084/m9.figshare.10033253.v1). The R script of data analysis was available as Supplementary Material.
A total of 164 LUTS/BPH patients who underwent TURP with a mean age of 69.9 years were included in the study. Of all patients, 26 patients (15.9%) had no prostatic inflammation, while 71 (43.3%) patients had mild, 44 (26.8%) had moderate, and 23 (14.0%) had severe prostatic inflammation (Table 1). In the entire cohort of LUTS/BPH patients, 9 (5.49%) individuals were mildly symptomatic, 83 (50.61%) individuals were moderately symptomatic, and 72 (43.90%) individuals were severely symptomatic. Patients with moderate to severe prostatic inflammation had higher peripheral WBC counts, higher peripheral lymphocyte counts, lower f/t PSA ratios and lower NLRs, and were more likely to have a history of AUR (p < 0.05).
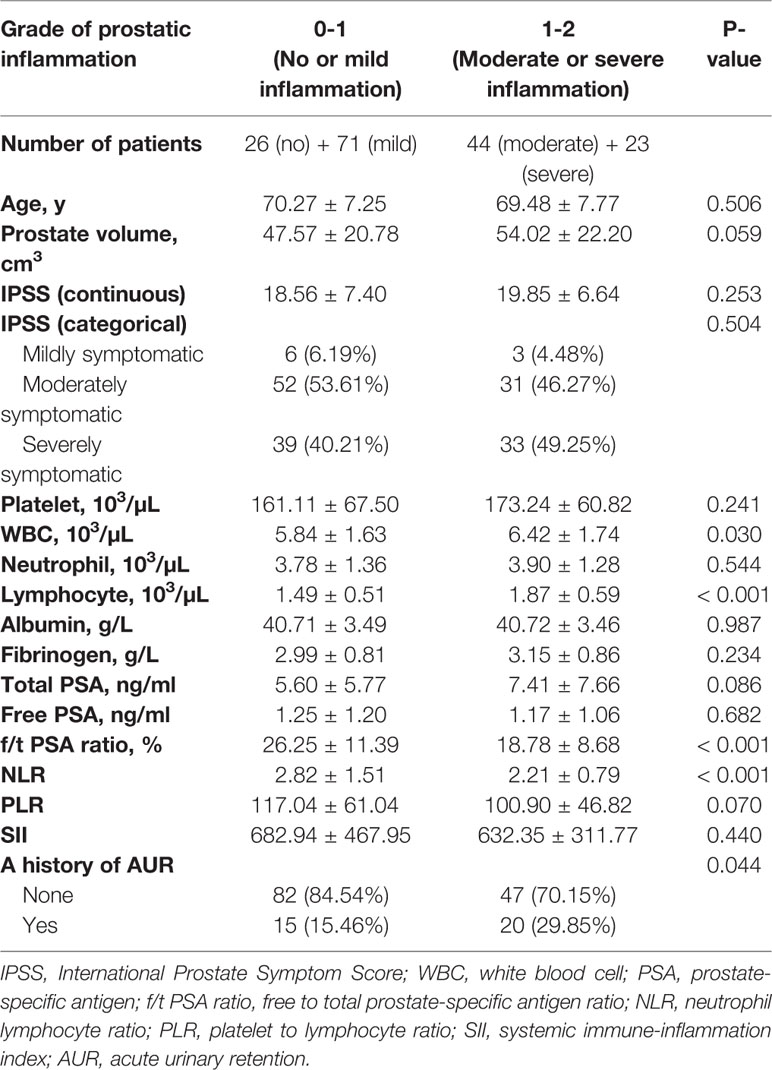
Table 1 Baseline characteristics of patients.
In the univariate logistic analysis, associated with a higher risk of mild to severe prostatic inflammation were acute urinary retention history (OR = 1.84, 95% CI: 1.09–2.62, p = 0.03), a lower f/t PSA ratio (OR = 0.93, 95% CI: 0.89–0.96, p < 0.01), a higher peripheral lymphocyte count (OR = 2.26, 95% CI: 1.66–2.92, p < 0.01), a higher WBC count (OR = 1.21, 95% CI: 1.02–1.48, p = 0.03) and a lower NLR (OR = 0.53, 95% CI: 0.18–0.83, p < 0.01). And it's noteworthy that prostate volume was also correlated with a higher risk of moderate to severe prostatic inflammation and trended towards statistical significance (OR = 1.01, 95% CI: 1.00–1.03, p = 0.06) (Table 2).
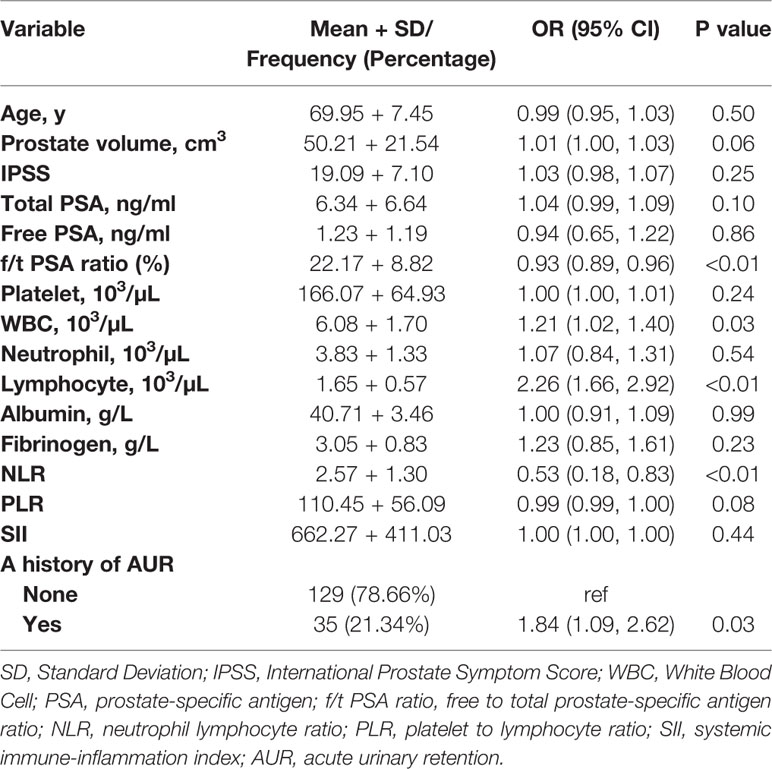
Table 2 Univariate analysis on the associations of clinical and laboratory parameters with moderate to severe prostatic inflammation.
By LASSO regression with 10-fold cross-validation and the one-standard-error rule, the optimal λ was 0.094. Among all 16 variables, the peripheral lymphocyte count and f/t PSA ratio had nonzero coefficients, thus selected in the final diagnostic model (Figure 3). The diagnostic model was built by multivariate logistic regression, and the nomogram of this model was shown in Figure 4.
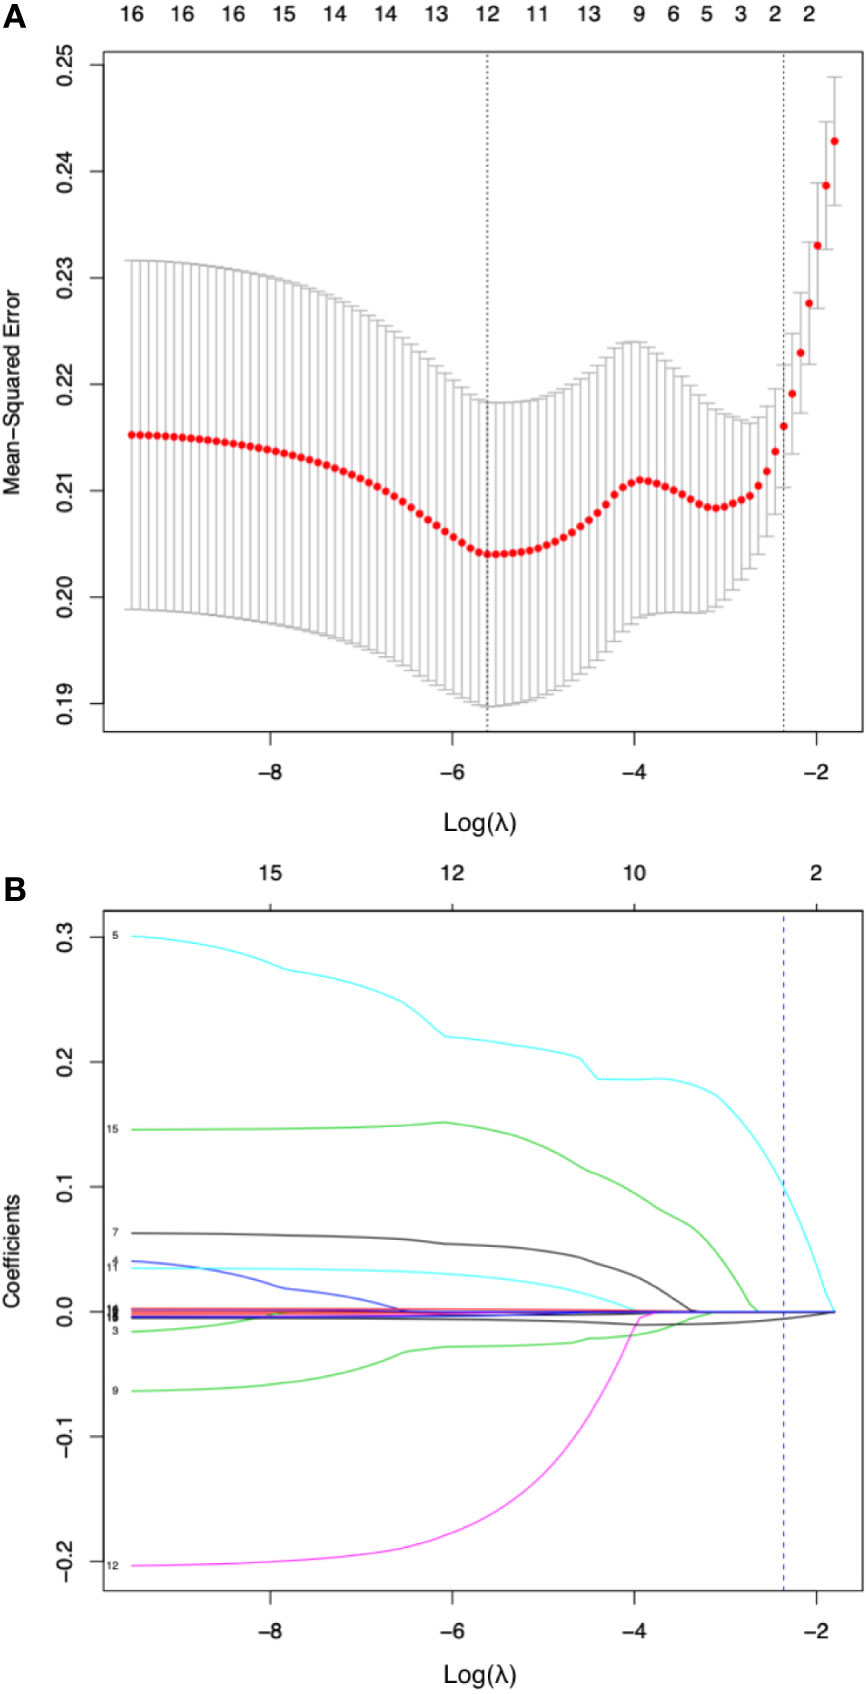
Figure 3 Diagnostic variable selection by the least absolute shrinkage and selection operator (LASSO) method. (A).Tuning parameter lambda (λ) selection in the LASSO model with 10-fold cross validation and one-standard-error rule (the highest λ for which the mean-squared error was within one standard deviation of the minimum was chose as the optimal λ). The mean-squared error was plotted versus log(λ). Dotted vertical lines were drawn at the log (λ) with minimum mean-squared error (left one) or the optimal log(λ) by one-standard-error rule (right one). A λ value of 0.094 with log (λ) being -2.360 was chosen as optimal. (B) coefficient of the 16 clinical or laboratory parameters plotted against log(λ) sequence. Each curve corresponds to a variable; the dotted vertical blue line indicates the optimal value of log(λ) by one-standard-error rule at which two variables, the peripheral lymphocyte count and f/t PSA ratio had nonzero coefficients and the most diagnostic value.
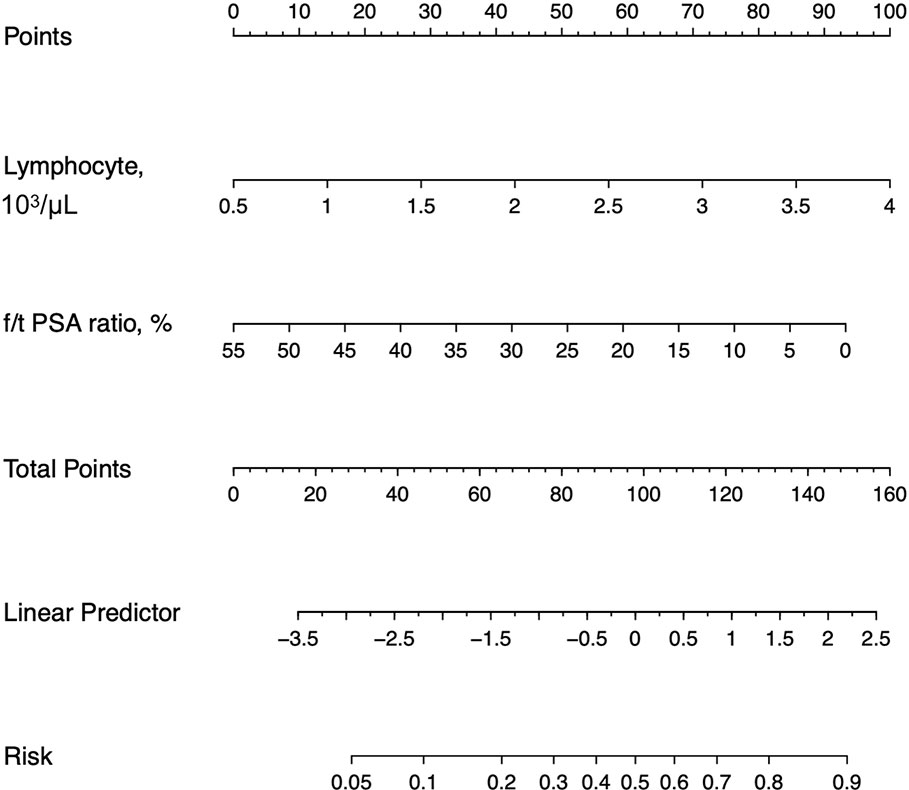
Figure 4 Nomograms for the laboratory model. f/t PSA ratio = free to total prostate-specific antigen ratio.
The discrimination of the post-LASSO simpler model and the model supplemented by clinical parameters was accessed by the AUC of ROC curves (Figure 5A). The post-LASSO model had an AUC of 0.76 (0.68–0.83), while the model supplemented with clinical parameters including prostate volume and history of AUR, and IPSS had an AUC of 0.77 (0.70–0.84) (Table 3). The calibration curve of the post-LASSO nomogram for prostatic inflammation demonstrated good agreement between prediction and observation (Figure 5B). The Hosmer-Lemeshow test yielded a nonsignificant statistic (P = 0.432). The decision curve analysis of the post-LASSO model and the one supplemented with clinical parameters were presented in Figure 5C. The decision curve showed that if the threshold probability is between 8 to 63%, using the laboratory test nomogram to predict prostatic inflammation brings more benefit than either the treat-all-patients scheme or the treat-none scheme. Within this range, two model lines overlap each other, which suggest net benefit was comparable between the post-LASSO laboratory test nomogram and the model with clinical parameters.
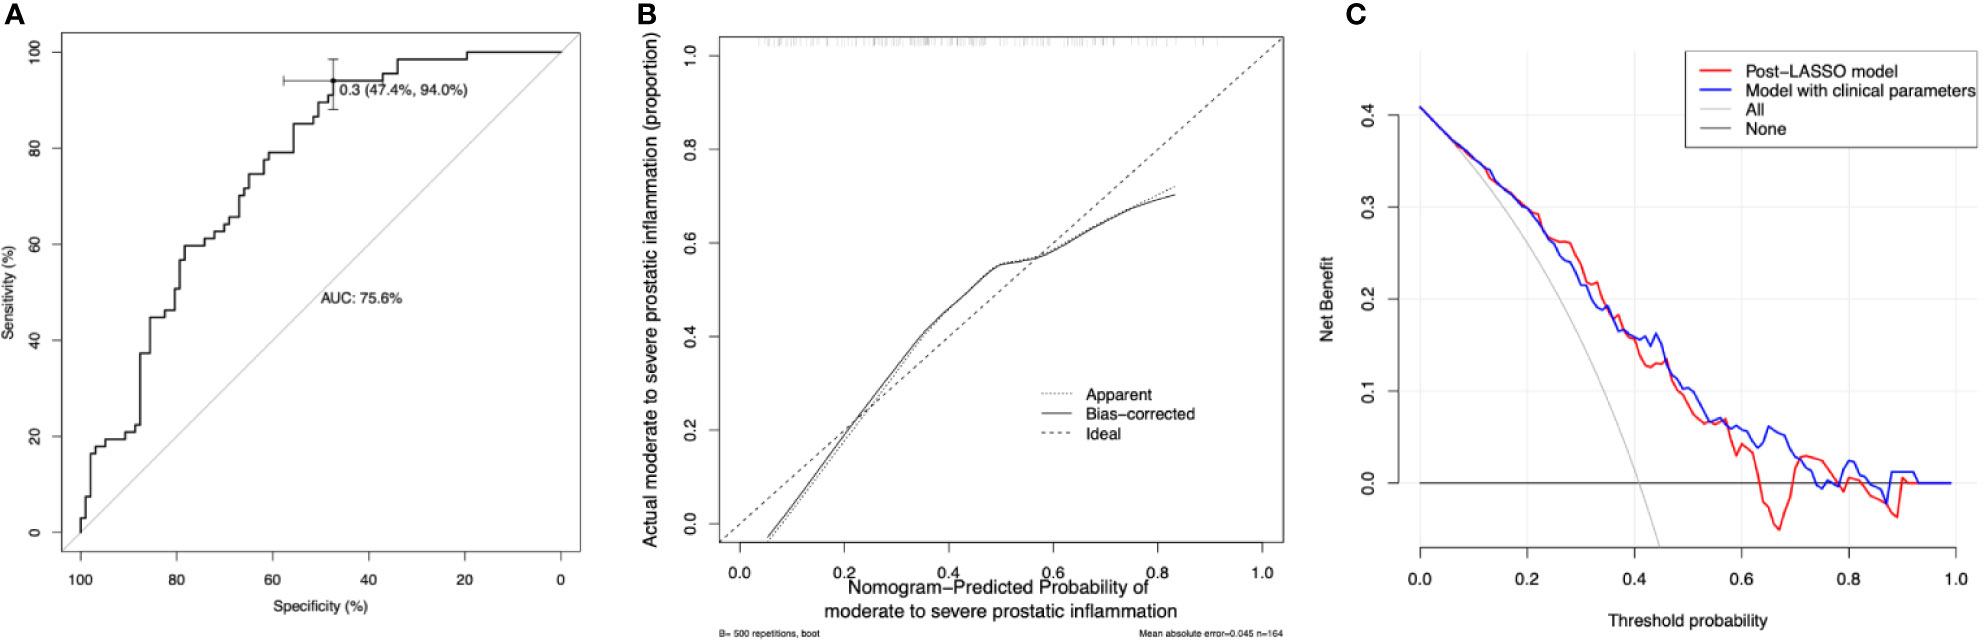
Figure 5 Model discrimination, calibration, and decision curve analysis. (A) Receiver operating characteristic curves (ROCs) for the diagnostic models. AUC = the area under the ROC curve. The laboratory model had an AUC of 0.756 (95% confidence interval 0.684–0.829) the optimal cutoff is 0.3, with the sensitivity of 0.94 and specificity of 0.47. (B) Calibration curve of the post-LASSO diagnostic nomogram accompanied by the bootstrap approach (the number of bootstrap repetitions B = 500). Calibration curve depicts the calibration of in terms of the agreement between the predicted risks of prostatic inflammation and observed prostatic inflammation. The y-axis represents the actual prostatic inflammation. The x-axis represents the predicted prostatic inflammation. The diagonal dashed line represents a perfect prediction by an ideal model. The dotted (apparent) and solid (bootstrap bias corrected) line represents the performance of the nomogram, of which a closer fit to the diagonal dashed line represents a better prediction. (C) Decision curve analysis for the post-LASSO simpler nomogram and the model supplemented with clinical parameters. The y-axis measures the net benefit. The x-axis is the risk threshold probability that changes from 0 to 1. The red line represents the post-LASSO nomogram. The blue line represents the model with clinical parameters. The grey line represents the assumption that all patients have prostatic inflammation. The black line represents the assumption that no patients have prostatic inflammation. The decision curve analysis yielded a range of thresholds (8 to 63%) at which using the post-LASSO model to diagnose prostatic inflammation adds more benefit than the treat-all-patients scheme or the treat-none scheme.
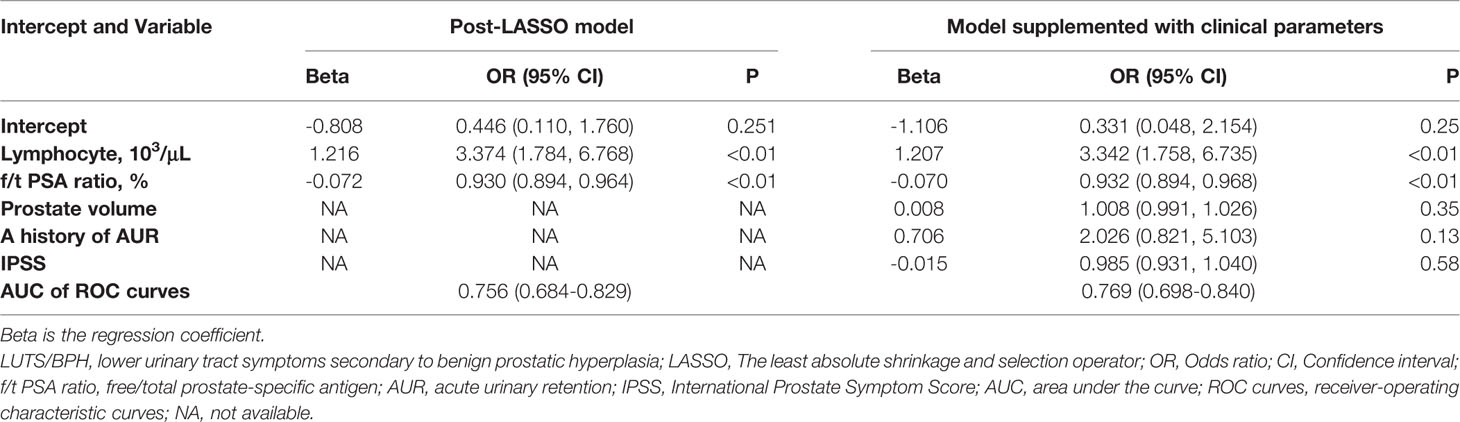
Table 3 Risk factors for prostatic inflammation in patients with LUTS/BPH.
In this study, we found that f/t PSA ratio and peripheral WBC count had great diagnostic value for prostatic inflammation. And we developed a new diagnostic model for prostatic inflammation in LUTS/BPH based on these two variables. The diagnostic model had good discrimination, calibration, and clinical benefit. The addition of other clinical parameters failed to bring incremental diagnostic value.
It's noteworthy that this study was conducted solely for LUTS/BPH patients, and we even excluded patients with incidental prostate cancer to reduce bias. Therefore, we do not know whether this model would apply to cancer patients. Using our model to identify prostatic inflammation would be useful for the management and pharmacotherapy development of LUT/BPH due to the strong association between prostatic inflammation and LUTS/BPH. (Zlotta et al., 2014) But whether prostatic inflammation is correlated with prostate cancer is still a question of debate (Langston et al., 2019).
Interestingly, a lower f/t PSA ratio was associated with a higher risk of more severe prostatic inflammation, and this finding broadly supports the work of Jung's (Jung et al., 1998), which also linked a lower f/t PSA ratio to chronic inflammation of the prostate. A possible explanation for this might be that the production of alpha 1-antichymotrypsin, with which free PSA predominately forms the complex, increases not only in cancer cells but also in hyperplastic cells under inflammatory conditions.
In our study, we found that peripheral WBC count is associated with prostatic inflammation. This finding corroborates the findings of the previous work by Dr. Kazutoshi et al. (Fujita et al., 2014), which demonstrated that peripheral WBC count was associated with the severity of LUTS/BPH. It can thus be suggested that a higher peripheral WBC count is representative of a higher level of systemic inflammatory status, which exacerbates prostatic inflammation and then aggravates LUTS/BPH. Besides, we found that the peripheral lymphocyte count was positively associated with prostatic inflammation, confirming that systemic inflammation and prostatic inflammation are intrinsically correlated.
To our best knowledge, this is the first attempt to develop a diagnostic model for prostatic inflammation using the routine blood test and the PSA test. And our model proved to be clinically useful. However, our study had several limitations. First, our sample size was relatively small due to the stringent eligibility criteria. A larger cohort will be needed to validate our diagnostic model further. Second, we didn't measure the serum levels of interleukins, knowing it can be expensive and unlikely to be integrated into daily practice due to the high cost. At last, we didn't collect urinalysis data, which could be useful to describe our study population.
Despite these limitations, we developed a diagnostic model for prostatic inflammation, which is ready to use and proved to be clinically useful. And our findings demonstrated that peripheral lymphocyte count and f/t PSA ratio appear to be reliable diagnostic markers for prostatic inflammation, suggesting prostatic inflammation is correlated with systemic inflammation and might affect the PSA level.
This study is the first attempt to develop a diagnostic model for prostatic inflammation using the routine blood test and the PSA test. Our findings demonstrated that peripheral lymphocyte count and f/t PSA ratio appear to be reliable diagnostic markers, based on which we build a clinically useful nomogram for prostatic inflammation. This diagnostic model could facilitate the development of anti-inflammatory pharmacotherapy for LUTS/BPH. Before this model is adopted in clinical practice, future validation is needed to determine its clinical utility.
The data collected and analyzed in this study is publicly available from Figshare (DOI: 10.6084/m9.figshare.10033253.v1).
Ethical review and approval were not required for the study on human participants in accordance with the local legislation and institutional requirements. Written informed consent for participation was not required for this study in accordance with the national legislation and the institutional requirements.
XL contributed to analysis and interpretation of data and drafting of the manuscript. ZT contributed to acquisition of data. JA contributed to interpretation of data. HX and SZ contributed to statistical analysis. LL, SQ, YF and PT contributed to critical revision of the manuscript. LY and QW contributed to conception, design, supervision, and obtaining funding.
This research was funded by the National key research and development program of China (Grant No.SQ2017YFSF090096), the Prostate Cancer Foundation Young Investigator Award 2013, the National Natural Science Foundation of China (Grant No. 81300627, 81370855, 81702536, 81770756), Programs from Science and Technology Department of Sichuan Province (Grant No. 2014JY0219 and 2017HH0063), Young Investigator Award of Sichuan University 2017, and a grant from 1.3.5 project for disciplines of excellence, West China Hospital, Sichuan University (ZYGD18011).
The authors declare that the research was conducted in the absence of any commercial or financial relationships that could be construed as a potential conflict of interest.
Thanks to all the research members and their contributions.
The Supplementary Material for this article can be found online at: https://www.frontiersin.org/articles/10.3389/fphar.2020.00589/full#supplementary-material
Addla, S. K., Adeyoju, A. B., Neilson, D., O'Reilly, P. (2006). Diclofenac for treatment of nocturia caused by nocturnal polyuria: a prospective, randomised, double-blind, placebo-controlled crossover study. Eur. Urol 49 (4), 720–725. doi: 10.1016/j.eururo.2005.11.026
Altavilla, D., Minutoli, L., Polito, F., Irrera, N., Arena, S., Magno, C., et al. (2012). Effects of flavocoxid, a dual inhibitor of COX and 5-lipoxygenase enzymes, on benign prostatic hyperplasia. Br. J. Pharmacol. 167 (1), 95–108. doi: 10.1111/j.1476-5381.2012.01969.x
Berger, A. P., Bartsch, G., Deibl, M., Alber, H., Pachinger, O., Fritsche, G., et al. (2006). Atherosclerosis as a risk factor for benign prostatic hyperplasia. BJU Int. 98 (5), 1038–1042. doi: 10.1111/j.1464-410X.2006.06400.x
Breyer, B. N., Sarma, A. V. (2014). Hyperglycemia and insulin resistance and the risk of BPH/LUTS: an update of recent literature. Curr. Urol Rep. 15 (12), 462. doi: 10.1007/s11934-014-0462-x
De Nunzio, C., Kramer, G., Marberger, M., Montironi, R., Nelson, W., Schroder, F., et al. (2011). The controversial relationship between benign prostatic hyperplasia and prostate cancer: the role of inflammation. Eur. Urol 60 (1), 106–117. doi: 10.1016/j.eururo.2011.03.055
Di Silverio, F., Gentile, V., De Matteis, A., Mariotti, G., Giuseppe, V., Luigi, P. A., et al. (2003). Distribution of inflammation, pre-malignant lesions, incidental carcinoma in histologically confirmed benign prostatic hyperplasia: a retrospective analysis. Eur. Urol 43 (2), 164–175. doi: 10.1016/s0302-2838(02)00548-1
Fujita, K., Hosomi, M., Nakagawa, M., Tanigawa, G., Imamura, R., Uemura, M., et al. (2014). White blood cell count is positively associated with benign prostatic hyperplasia. Int. J. Urol 21 (3), 308–312. doi: 10.1111/iju.12243
Hastie, T., Tibshirani, R., Friedman, J. (2009). The elements of statistical learning: data mining, inference, and prediction (Berlin, Germany: Springer Science & Business Media).
Jung, K., Meyer, A., Lein, M., Rudolph, B., Schnorr, D., Loening, S. A. (1998). Ratio of free-to-total prostate specific antigen in serum cannot distinguish patients with prostate cancer from those with chronic inflammation of the prostate. J. Urol. 159 (5), 1595–1598. doi: 10.1097/00005392-199805000-00050
Kahokehr, A., Vather, R., Nixon, A., Hill, A. G. (2013). Non-steroidal anti-inflammatory drugs for lower urinary tract symptoms in benign prostatic hyperplasia: systematic review and meta-analysis of randomized controlled trials. BJU Int. 111 (2), 304–311. doi: 10.1111/j.1464-410X.2012.11559.x
Kwon, Y. K., Choe, M. S., Seo, K. W., Park, C. H., Chang, H. S., Kim, B. H., et al. (2010). The effect of intraprostatic chronic inflammation on benign prostatic hyperplasia treatment. Korean J. Urol 51 (4), 266–270. doi: 10.4111/kju.2010.51.4.266
Langston, M. E., Horn, M., Khan, S., Pakpahan, R., Doering, M., Dennis, L. K., et al. (2019). A Systematic Review and Meta-analysis of Associations between Clinical Prostatitis and Prostate Cancer: New Estimates Accounting for Detection Bias. Cancer Epidemiol. Biomarkers Prev. 28 (10), 1594–1603. doi: 10.1158/1055-9965.EPI-19-0387
Liu, L., Li, Q., Han, P., Li, X., Zeng, H., Zhu, Y., et al. (2009). Evaluation of interleukin-8 in expressed prostatic secretion as a reliable biomarker of inflammation in benign prostatic hyperplasia. Urology 74 (2), 340–344. doi: 10.1016/j.urology.2009.02.064
Nickel, J. C., True, L. D., Krieger, J. N., Berger, R. E., Boag, A. H., Young, I. D. (2001). Consensus development of a histopathological classification system for chronic prostatic inflammation. BJU Int. 87 (9), 797–805. doi: 10.1046/j.1464-410x.2001.02193.x
Nickel, J. C., Roehrborn, C. G., O'Leary, M. P., Bostwick, D. G., Somerville, M. C., Rittmaster, R. S. (2008). The relationship between prostate inflammation and lower urinary tract symptoms: examination of baseline data from the REDUCE trial. Eur. Urol 54 (6), 1379–1384. doi: 10.1016/j.eururo.2007.11.026
Ozer, K., Horsanali, M. O., Gorgel, S. N., Horsanali, B. O., Ozbek, E. (2017). Association between Benign Prostatic Hyperplasia and Neutrophil-Lymphocyte Ratio, an Indicator of Inflammation and Metabolic Syndrome. Urol Int. 98 (4), 466–471. doi: 10.1159/000448289
Parsons, J. K., Carter, H. B., Partin, A. W., Windham, B. G., Metter, E. J., Ferrucci, L., et al. (2006). Metabolic factors associated with benign prostatic hyperplasia. J. Clin. Endocrinol. Metab. 91 (7), 2562–2568. doi: 10.1210/jc.2005-2799
Robert, G., Descazeaud, A., Nicolaiew, N., Terry, S., Sirab, N., Vacherot, F., et al. (2009). Inflammation in benign prostatic hyperplasia: a 282 patients' immunohistochemical analysis. Prostate 69 (16), 1774–1780. doi: 10.1002/pros.21027
Robert, G., Smit, F., Hessels, D., Jannink, S., Karthaus, H. F., Aalders, T., et al. (2011). Biomarkers for the diagnosis of prostatic inflammation in benign prostatic hyperplasia. Prostate 71 (15), 1701–1709. doi: 10.1002/pros.21387
Rodriguez, E., Jr., Skarecky, D., Narula, N., Ahlering, T. E. (2008). Prostate volume estimation using the ellipsoid formula consistently underestimates actual gland size. J. Urol 179 (2), 501–503. doi: 10.1016/j.juro.2007.09.083
Schenk, J. M., Kristal, A. R., Neuhouser, M. L., Tangen, C. M., White, E., Lin, D. W., et al. (2010). Biomarkers of systemic inflammation and risk of incident, symptomatic benign prostatic hyperplasia: results from the prostate cancer prevention trial. Am. J. Epidemiol. 171 (5), 571–582. doi: 10.1093/aje/kwp406
Wu, L., Li, B.-H., Wang, Y.-Y., Wang, C.-Y., Zi, H., Weng, H., et al. (2019). Periodontal disease and risk of benign prostate hyperplasia: a cross-sectional study. Military Med. Res. 6 (1), 34–34. doi: 10.1186/s40779-019-0223-8
Keywords: lower urinary tract symptoms, prostatic hyperplasia, prostate-specific antigen, inflammation, prostatitis
Citation: Liao X, Tang Z, Ai J, Xu H, Zhang S, Liu L, Qiu S, Tan P, Fan Y, Yang L and Wei Q (2020) Detection of Prostatic Inflammation From Peripheral Lymphocyte Count and Free/Total PSA Ratio in Men With LUTS/BPH. Front. Pharmacol. 11:589. doi: 10.3389/fphar.2020.00589
Received: 30 December 2019; Accepted: 16 April 2020;
Published: 30 April 2020.
Edited by:
Xian-Tao Zeng, Zhongnan Hospital, Wuhan University, ChinaReviewed by:
Robert L. Lins, Independent Researcher, Antwerp, BelgiumCopyright © 2020 Liao, Tang, Ai, Xu, Zhang, Liu, Qiu, Tan, Fan, Yang and Wei. This is an open-access article distributed under the terms of the Creative Commons Attribution License (CC BY). The use, distribution or reproduction in other forums is permitted, provided the original author(s) and the copyright owner(s) are credited and that the original publication in this journal is cited, in accordance with accepted academic practice. No use, distribution or reproduction is permitted which does not comply with these terms.
*Correspondence: Lu Yang, d3ljbGVmbHVlQDE2My5jb20=; Qiang Wei, d2VpcWlhbmcxNjMxNjNAMTYzLmNvbQ==
†These authors have contributed equally to this work and share first authorship
Disclaimer: All claims expressed in this article are solely those of the authors and do not necessarily represent those of their affiliated organizations, or those of the publisher, the editors and the reviewers. Any product that may be evaluated in this article or claim that may be made by its manufacturer is not guaranteed or endorsed by the publisher.
Research integrity at Frontiers
Learn more about the work of our research integrity team to safeguard the quality of each article we publish.