- Department of Forestry Engineering, College of Forestry, Northwest A&F University, Yangling, China
Juniperus rigida (J. rigida) which is endemic to East Asia, has traditionally been used as an ethnomedicinal plant in China. This study was undertaken to evaluate the quality of J. rigida samples derived from 11 primary regions in China. Ten phenolic compounds were simultaneously quantified using reversed-phase high-performance liquid chromatography (RP-HPLC), and chlorogenic acid, catechin, podophyllotoxin, and amentoflavone were found to be the main compounds in J. rigida needles, with the highest contents detected for catechin and podophyllotoxin. J. rigida from Jilin (S9, S10) and Liaoning (S11) exhibited the highest contents of phenolic profiles (total phenolics, total flavonoids and 10 phenolic compounds) and the strongest antioxidant and antibacterial activities, followed by Shaanxi (S2, S3). A similarity analysis (SA) demonstrated substantial similarities in fingerprint chromatograms, from which 14 common peaks were selected. The similarity values varied from 0.85 to 0.98. Chemometrics techniques, including hierarchical cluster analysis (HCA), principal component analysis (PCA), and discriminant analysis (DA), were further applied to facilitate accurate classification and quantification of the J. rigida samples derived from the 11 regions. The results supported HPLC data showing that all J. rigida samples exhibit considerable variations in phenolic profiles, and the samples were further clustered into three major groups coincident with their geographical regions of origin. In addition, two discriminant functions with a 100% discrimination ratio were constructed to further distinguish and classify samples with unknown membership on the basis of eigenvalues to allow optimal discrimination among the groups. Our comprehensive findings on matching phenolic profiles and bioactivities along with data from fingerprint chromatograms with chemometrics provide an effective tool for screening and quality evaluation of J. rigida and related medicinal preparations.
Introduction
The evergreen coniferous shrub, Juniperus rigida, is endemic to East Asia, and mainly distributed in the northern hemisphere in cold temperate regions of North and Northeastern China, Korea, and Japan. The berries of J. rigida have been widely used in Korean traditional medicine to treat rheumatoid arthritis and dropsy (Lee et al., 2010) and its branches and leaves utilized in traditional Mongolian medicine in China and as an important raw material to provide essential oil for the chemical industry (Wei and Shibamoto, 2007; Wu and Lin, 2014; Abdel et al., 2015). Chemical and pharmacological research on J. rigida has led to the discovery of bioactive components, such as flavonoids and phenolic compounds that potentially contribute to its antioxidant activity (Robards et al., 1999; Woo et al., 2011; Taviano et al., 2013). Moreover, lignans and flavonoids from J. rigida, such as catechin, podophyllotoxin, and amentoflavone, exert strong biological effects, including anti-inflammatory, anticancer, and antiviral activities (Lee et al., 2008; Gordien et al., 2009; Ryu et al., 2010; Lesjak et al., 2011, 2013, 2014; Jeong et al., 2012).
Despite the widespread application and commercial importance of Juniperus-derived products, evaluation of J. rigida has traditionally been based on morphological characteristics resulting from natural genetic development (e.g., mutation, recombination) of individual species with little consideration of phytochemical components and bioactivities (Li et al., 2014; Liu Q. X. et al., 2016; Sobierajska et al., 2016). These shortcomings have limited the utilization of J. rigida, highlighting the urgent necessity for a simple and flexible approach for quality evaluation.
Chromatographic fingerprint analysis is a widely accepted technique due to its high confidence in quality assessment of agricultural products (EMEA London, 1999; SFDA Beijing, 2000; US Food Drug Administration Rockville, 2000; WHO Geneva, 2000). Chemometric methods, in particular, hierarchical cluster analysis (HCA) and principle component analysis (PCA) that involve the objective collection of chemical profiles, are widely applied in analyzing information from chemical analyses of herbal medicines (Yan et al., 2001; Zhang et al., 2005; Wan et al., 2006; Shi et al., 2008; Wang et al., 2014; Liu W. et al., 2016). However, to our knowledge, fingerprint analysis has not been applied to evaluate the quality of J. rigida to date. In the current study, high-performance liquid chromatography (HPLC) fingerprint associated with chemometrics methods was employed to assess the quality of J. rigida, with a view to optimizing its utility in healthcare and food industries.
The main objectives of this study were to: (1) analyze the variations in phenolic profiles and bioactivities of J. rigida derived from 11 regions in China, (2) establish an effective method to evaluate the quality of J. rigida based on HPLC fingerprint analysis with subsequent HCA, PCA, and discrimination analysis (DA), and (3) provide a theoretical basis for quality evaluation of J. rigida and related medicinal preparations.
Materials and Methods
Plant Materials
Needles of J. rigida were collected from 11 regions covering all primary origins in China (Table 1, Figure 1). The voucher specimen was identified by the professor Dengwu Li and was deposited at Herbarium of the Northwest A&F University, Yangling, China. All materials were air-dried, powdered, and stored in the dark at −20°C until further analysis.
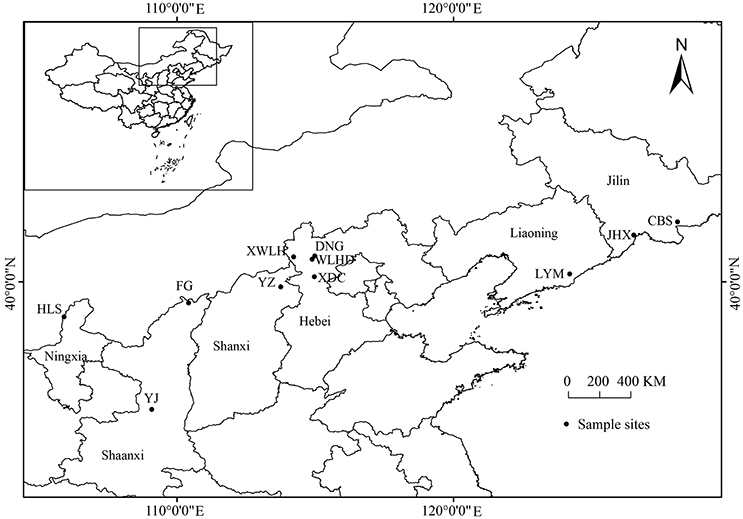
Figure 1. Location of J. rigida samples collected from different regions. Maps were generated using ArcGIS 10.0 (ESRI Inc., 2014).
Instrumentation and Reagents
A HPLC analysis was conducted with an Agilent Series 1260 liquid chromatograph equipped with a quaternary gradient pump system and variable-wavelength detector system connected to a reversed-phase (RP) SB-C 18 column (5 μm, 4.6 × 250 mm, Agilent, USA). Data collection was performed using ChemStation software (Agilent, USA). Chromatograph-grade methanol and acetonitrile were purchased from Sigma-Aldrich Co. Ltd (St. Louis, Missouri, USA).
Folin-Ciocalteus's phenol reagent (Beijing Solarbio Co. Ltd, PR China), 1,1-diphenyl-2-picrylhydrazyl (DPPH), 2,2-azino-bis (3-ethyl-benzothiazoline-6-sulphonic acid) diammonium salt (ABTS), 2,4,6-Tripyridyl-s-triazine (TPTZ), and 6-Hydroxy-2,5,7,8-tetramethylchroman-2-carboxylic acid (Trolox, Sigma-Aldrich Co., St. Louis, Missouri, USA), gallic acid, quercetin, and acetic acid (Tianjin Bodi Chemical Holding Co. Ltd, PR China) were used. All solutions were filtered through 0.22 mm nylon filters before use. Reagents were of analytical grade and dissolved in deionized water (18 MΩ cm).
Preparation of Crude Extracts
The extraction process was optimized using a response surface method considering the impact of various factors. Each powdered sample was treated as described in the optimized extraction process: extraction time (1 h), aqueous ethanol concentration (60%), extraction temperature (70°C), number of extractions (2), liquid-solid ratio (20:1). Filtrates were concentrated via rotary evaporation under vacuum to obtain the crude extracts and stored at −20°C in the dark until further use. All extractions were conducted in triplicate.
Microbial Strains and Culture
Antimicrobial activity was tested against nine bacterial strains provided by the Microbial Culture Collection Center of Guangdong Institute of Microbiology, China. Tests against four gram-positive bacteria (Staphylococcus aurous Rosen Bach ATCC6538, Pseudomonas aeruginosa ATCC29212, Bacillus subtilis ATCC6633, and Listeria monocytogenes ATCC19115) and five gram-negative bacteria (Klebsiella pneumoniae ATCC46117, Salmonella enteritidis ATCC14028, Salmonella typhimurium CMCC50115, Salmonella paratyphi CMCC50093, and Escherichia coli ATCC25922) were conducted. All strains were cultured at 37°C on Mueller-Hinton medium.
Determination of Total Phenolic Content (TPC) and Flavonoid Content (TFC)
The Folin-Ciocalteau colorimetric method was adopted to determine the TPC, with minor modifications (Burcu et al., 2014; Mocan et al., 2014). The phenolic content of all samples was calculated from the gallic acid equivalent based on a calibration curve of gallic acid standard solutions (10, 20, 40, 60, 80, 100, 200, 300, and 400 μg/mL). All values were expressed as millimole gallic acid equivalent per 100 g of dry weight (mmol equiv. GAE/100 g). Data were expressed as means ± SD for three replicates.
The TFC was determined using the sodium borohydride/chloranil-based (SBC) assay developed by He et al. (2008). Sample solutions were diluted to a concentration of 20 mg/mL. A calibration curve was generated using different concentrations of quercetin (0.1–10.0 mM). The total flavonoid content of ethanol extracts of needles of J. rigida was expressed as millimoles of quercetin equivalents per 100 g dry weight (mmol equiv. QUE/100 g). Data were expressed as means± SD for three replicates.
Determination of Antioxidant Activity of J. rigida
The DPPH radical scavenging capacity was measured using the method described by Yen and Chen (1995) with some modifications. Trolox was used as the positive control, and all samples were tested in triplicate. A lower IC50 value indicates higher DPPH radical scavenging activity.
The scavenging effects for the ABTS•+ radical cation were monitored as described in the published literature, with some modifications (Yang et al., 2013; Mocan et al., 2015). Trolox and phosphate-buffered saline (PBS) solutions were used as the standard antioxidant and blank samples, respectively. Data were expressed in terms of micromoles of trolox equivalents per g dry extract weight (μmol eq. trolox/g). All determinations were performed in triplicate.
FRAP activity was determined using the protocol of Benzie and Strain (2008) with some modifications. Trolox was employed as the standard solution and FRAP results were expressed in terms of micromoles Trolox equivalent per gram dry extract weight (mmol equiv. Trolox/ g). All experiments were performed in triplicate.
Determination of Antibacterial Activity of J. rigida
Disc-Diffusion Method
The antibacterial activity of phenolic extracts was evaluated via the paper disc agar diffusion method reported by Özer et al. (2007), with some modifications. The test solution was prepared by dissolving 5 mg/mL crude extracts in dimethyl sulfoxide (DMSO). Penicillin, tetracycline, and chloramphenicol (10 μg/mL) were used as positive controls and DMSO solution as the negative control. The zone of inhibition was measured in millimeters. The diameters of the inhibition zone (DIZ) were ranked as follows: not sensitive (−) for zone diameters equal to 8 mm or below, sensitive (+) for zone diameters between 8 and 14 mm, very sensitive (++) for zone diameters between 14 and 20 mm (Schroeder and Messing, 1949; Ponce et al., 2003). Inhibition zones were calculated as the average values from triplicate experiments.
Minimum Inhibitory Concentration (MIC) and Minimum Bactericidal Concentration (MBC)
MIC and MBC were determined according to the agar dilution method, with minor modifications (Silva et al., 2011; Burcu et al., 2014; Mocan et al., 2014). Briefly, the extract was dissolved in DMSO, and 1.5 mL stock solution incorporated into 13.5 mL Mueller Hinton broth to obtain concentrations of 5, 2.5, 1.25, 0.625, 0.3125, and 0.1563 mg/mL. MIC was taken from the lowest concentration well that visually showed no growth after 24 h while MBC was the lowest concentration showing no visible growth after 48 h. Tests were performed in triplicate to confirm the reproducibility of the results.
Determination of Individual Compounds of J. rigida Needles via Reversed-Phase HPLC Analysis
RP-HPLC Analysis
All sample solutions were filtered through 0.22-mm nylon filters before use and separated via RP-HPLC to obtain chromatograms. The mobile phase consisted of water with 0.5% acetic acid (solvent A) and acetonitrile (solvent B). Flow rate was maintained at 0.8 mL/min and the gradient elution program set as follows: 5% B (0 min), 20% B (0–20 min), 25% B (20–35 min), 40% B (35–40 min), 65% B (40–55 min), 80% B (55–60 min), 100% B (60–70 min). The injection volume was 20 μL and the detection wavelength was 254 nm. Experiments were carried out in triplicate.
Validation of the HPLC Procedure
The HPLC fingerprint assay was adopted to establish a standard for quality evaluation of J. rigida (Wan et al., 2006; Wang et al., 2007; Shi et al., 2008). In a previous study, our group validated the HPLC procedure via analysis of precision, reproducibility and repeatability Liu W. et al. (2016). All relative standard deviation (RSD) of the relative peak areas were <3%, suggesting that the conditions for fingerprint analysis were optimal.
Statistical Analysis
As recommended by the Chinese pharmacopeia Committee, data analysis was performed using Computer Aided Similarity Evaluation System (CASES) software. The correlation coefficients of entire chromatographic patterns among samples were calculated and simulated mean chromatograms as well as characteristic peaks generated using CASES. Based on the correlation coefficient (median), the software was also used to conduct similarity analysis (SA) of different chromatograms. HCA, PCA, and DA were performed using SPSS software (SPSS for Windows 19.0, SPSS Inc., USA) (Duan et al., 2012). HCA was conducted to classify samples with regard to similarities of chemical properties, and the “average linkage between groups” method and cosine applied in the measurements. Three principal components obtained using PCA were applied to assess similarities and differences among the samples (Nyambaka and Ryley, 2004; Pierce et al., 2006). DA analysis facilitated the identification and assortment among the groups and confirmed the results of SA, HCA, and PCA, improving quality evaluation of J. rigida more acceptable.
All measurements were carried out in triplicate, and the results presented as mean values ± SD (standard deviation). Statistical analysis was performed via one-way analysis of variance (ANOVA) followed by Duncan's test. P < 0.05 were considered significant. Data were analyzed using SPSS 19.0 (SPSS Inc., Chicago, IL, USA) for Windows and figures generated using SigmaPlot 12.0 and Photoshop 8.0 for Windows.
Results and Discussion
Total Phenolic and Flavonoid Contents of J. rigida Needles from Different Regions
Among J. rigida derived from the 11 districts, the total phenolic and total flavonoid contents varied significantly (Table 2). Total phenolic compounds were the most abundant in Fengcheng (S11) with contents of 31.64 mmol equiv. GAE/100 g, and lowest in Dabaozhen (S6) with contents of 13.34 mmol equiv. GAE/100 g. Consistent with total phenolic content data, the highest and lowest total flavonoid contents were detected in S11 and S6 (84.53 mmol equiv. QUE/100 g, 39.05 mmol equiv. QUE/100 g, respectively). Overall, abundance of total phenolic and flavonoid contents of J. rigida was in the order: Fengcheng (S11), Changbai Mountain (S10), Yijun (S3), Fugu (S2), Chongli (S5), Xiaosuangou (S7), Jinhua (S9), Datong (S4), Wulahada (S8), Helan Mountain (S1), Dabaozhen (S6). Therefore, among the diverse J. rigida samples, those from Fengcheng and Changbai Mountain were of the highest quality due to their rich phenolic contents. Variations in the total phenolic and flavonoid contents in J. rigida needles were potentially due to differences in the levels, properties, and proportions of their active ingredients, which, in turn, may be attributed to distribution in diverse geological zones, leading to different therapeutic properties of the same species from various growth regions.
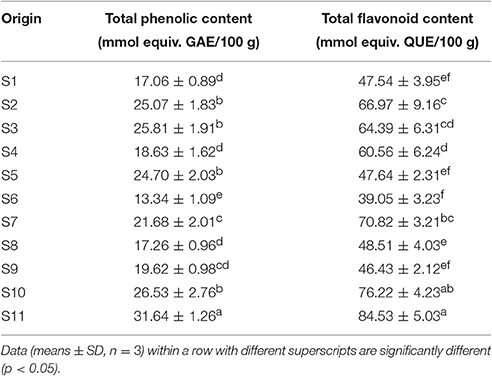
Table 2. Total phenolic and flavonoid contents in phenolic extracts of J. rigida needles from different origins.
Phenolic Compounds of J. rigida Needles
RP-HPLC chromatograms of phenolic compounds in J. rigida needles were analyzed. Based on comparison of retention times with those of the standards, peaks 1, 2, 4, 5, 6, 7, 9, 10, 11, and 13 were identified as chlorogenic acid, catechin, cumaric acid, rutin, hyperoside, ellagic acid, podophyllotoxin, amentoflavone, formononetin, and galangal, respectively (Figure 2, G0). Total contents of the identified compounds varied significantly among the regions (p < 0.05, Table 3), the highest recorded in S2 (746.65 mg/g) followed by S6 (694.02 mg/g) and S3 (666.40 mg/g), and the lowest in S11 (415.27 mg/g) and S8 (411.74 mg/g). In all 11 J. rigida samples, chlorogenic acid, catechin, podophyllotoxin, and amentoflavone were the most abundant phenolic compounds. The contents of these four compounds varied from 53.32 ± 0.17 to 163.38 ± 0.17 mg/g DW, 112.52 ± 0.08 to 288.88 ± 0.38 mg/g DW, 71.11 ± 0.06 to 189.18 ± 0.04 mg/g DW and 57.68 ± 0.01 to 146.16 ± 0.05 mg/g DW, respectively. Ellagic acid and formononetin were the least abundant phenolic compounds, with contents ranging from 2.82 ± 0.02 to 3.01 ± 0.06 mg/g DW and 2.22 ± 0.01 to 5.68 ± 0.02 mg/g DW, respectively.
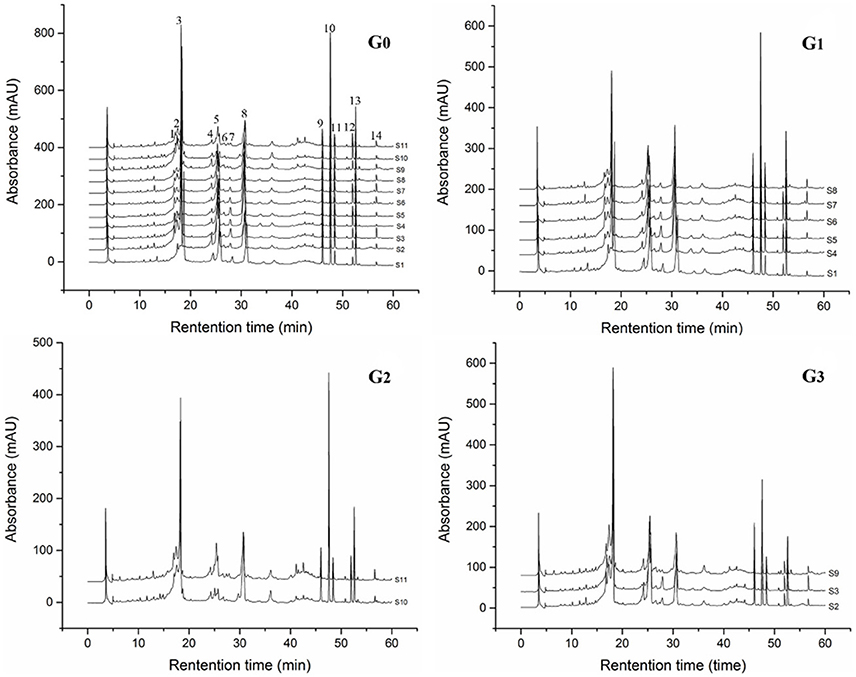
Figure 2. HPLC fingerprinting profiles (G0) and visual assortment of J. rigida from different regions (G1, G2, G3).

Table 3. Contents of 10 phenolic compounds in phenolic extracts of J. rigida needles from different origins.
Chlorogenic acid, catechin, podophyllotoxin, and amentoflavone are well-known human health antioxidants (Harwood et al., 2007; Wang et al., 2013). Previous studies have shown that these active components are abundant in J. rigida and have significant potential for application as natural antioxidants in the food and drug industries. Since the contents of phenolic compounds in J. rigida needles from different geographical sources vary considerably, a standard protocol for effective quality evaluation of J. rigida appears essential.
Antioxidant Activity of J. rigida Needles from Different Regions
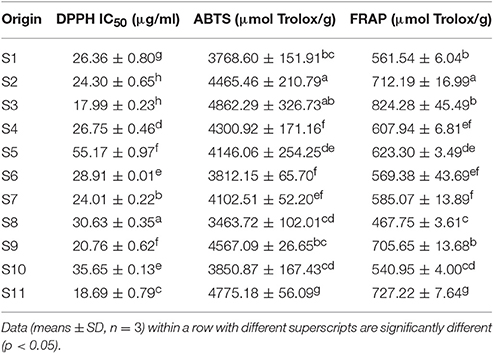
The antioxidant activities of J. rigida needles are presented in Table 4. J. rigida derived from Yijun (S3) possessed the highest DPPH radical scavenging activity with the lowest mean IC50 value (17.99 ± 0.23 μg/mL) while that from Chongli (S5) had the highest mean IC50 value (55.17 ± 0.97 μg/mL), indicative of lowest DPPH radical scavenging activity. ABTS activity data were consistent with those of FRAP analysis. ABTS radical scavenging capacity and ferric reducing power of J. rigida derived from Yijun (S3, 4862.29 ± 326.73 μmol Trolox/g and 824.28 ± 45.49 μmol Trolox/g, respectively) were also the highest. J. rigida derived from Wulahada (S8) displayed the lowest antioxidant activity in both ABTS and FRAP assays with values of 3463.72 ± 102.01 μmol Trolox/g and 467.75 ± 3.61 μmol Trolox/g, respectively. These profiles clearly suggest that the antioxidant ability of J. rigida varies between locations, with samples from Fugu (S2) and Yijun (S3) exhibiting the strongest activities.
These results were consistent with the total contents of 10 phenolic compounds, supporting the theory that active ingredients, such as chlorogenic acid, catechin, podophyllotoxin, and amentoflavone, play important roles in the antioxidant activity of J. rigida. The strong antioxidant activities observed for samples from Fugu (S2) and Yijun (S3) may thus be attributed to the high abundance of chlorogenic acid, catechin and podophyllotoxin. In conclusion, variations in the antioxidant activities of plants from different localities are possibly attributable to the contents, properties, and proportions of their phenolic constituents. Furthermore, geographical factors, such as elevation, latitude, longitude, temperature, light, rainfall, and locations of high altitude and cold climatic conditions may be underlying causes of these variations.
Antibacterial Activity of J. rigida Needles from Different Regions
The antibacterial activities of phenolic extracts of J. rigida were tested against nine strains of bacteria. Two narrow-spectrum antibiotics (penicillin, tetracycline) and one broad-spectrum antibiotic (chloramphenicol) were used as positive controls. DIZ values of phenolic extracts of J. rigida against all tested bacteria strains varied from 6.65 to 14.83 mm (Table 5). The largest DIZ was obtained for K. pneumonia, followed by L. monocytogenes, S. paratyphi, S. enteritidis, P. aeruginosa, and S. typhimurium, and the lowest for S. aurous. J. rigida phenolic extracts exerted antibacterial activity against both gram-positive and -negative bacteria. Among J. rigida from the 11 regions, those derived from Fengcheng (S11) and Changbai Mountain (S10) displayed the highest sensitivity against bacteria, with the greatest inhibition zone diameters for K. pneumonia (13.03 ± 0.12 mm, 12.17 ± 0.62 mm), followed by L. monocytogenes (12.23 ± 0.10 mm, 12.13 ± 0.35 mm), S. paratyphi (11.25 ± 0.26 mm, 10.56 ± 0.30 mm), P. aeruginosa (12.25 ± 1.35 mm, 10.25 ± 0.35 mm) and S. typhimurium (10.87 ± 0.17 mm, 9.00 ± 0.50 mm), clearly indicating strongest antibacterial activity of plants sourced from S11 and S10.
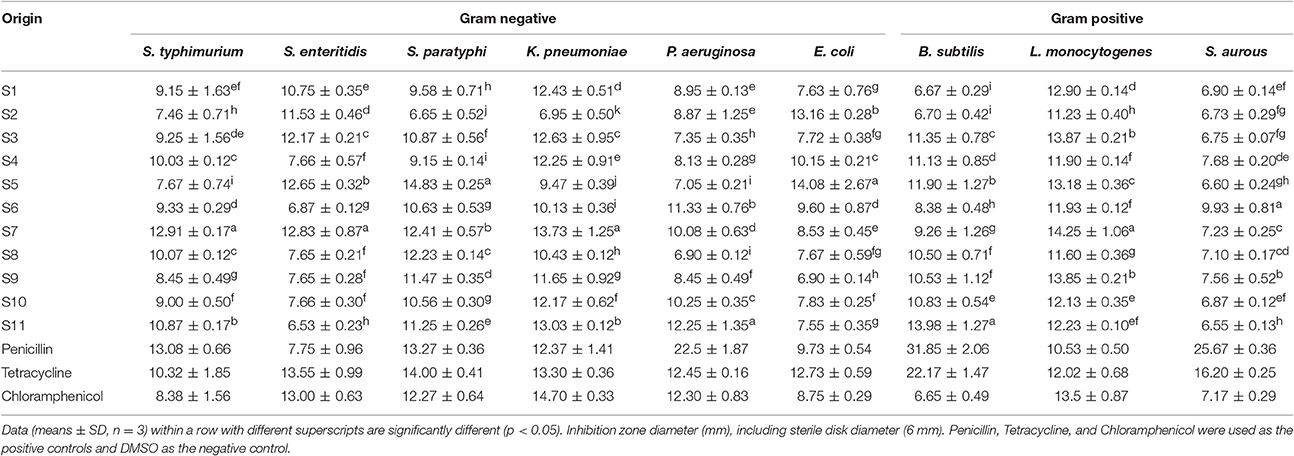
Table 5. Inhibition zone diameter of phenolic extracts of J. rigida needles from different regions against bacteria.
MIC and MBC values of the phenolic extracts were determined for further evaluation of J. rigida quality (Table 6). The MIC and MBC values for all tested bacterial strains ranged from 0.3125 to 10.00 mg/mL. Consistent with DIZ results, J. rigida derived from Fengcheng (S11) and Changbai Mountain (S10) exerted the strongest antibacterial effects with the lowest MIC and MBC values among the 11 J. rigida samples examined.
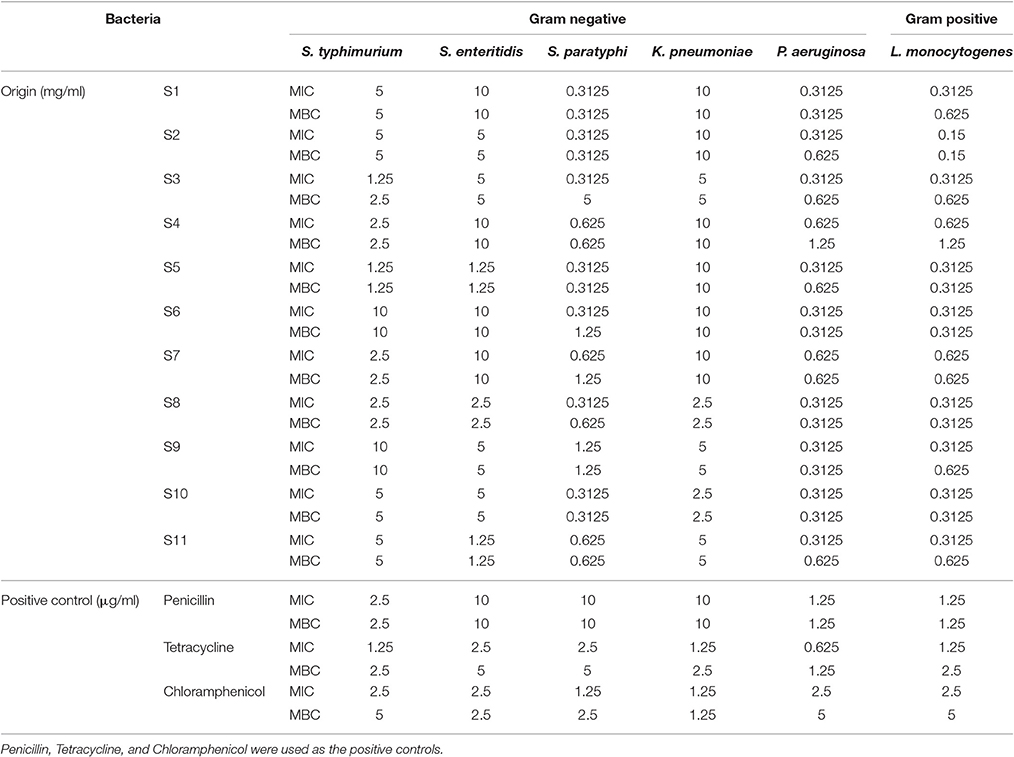
Table 6. MIC and MBC values of phenolic extracts of J. rigida needles from different regions against bacteria.
In conclusion, all the phenolic extracts of J. rigida showed broad-spectrum antibacterial activity, with samples from Fengcheng (S11) and Changbai Mountain (S10) exerting the strongest effects. These results were in keeping with the total phenolic and flavonoid contents of J. rigida, suggesting that antibacterial activity is closely related to the total phenolic constituent levels. Moreover, since J. rigida traditionally achieves its therapeutic effects through strong biological activities, including anti-inflammatory, anticancer, and antiviral properties, antibacterial activity may be considered to possess larger proportion in quality evaluation of J. rigida (Gordien et al., 2009; Ryu et al., 2010; Jeong et al., 2012). J. rigida derived from Fengcheng and Changbai Mountain were therefore of outstanding quality, supporting their utility as effective potential bacterial inhibitors and bactericidal agents.
Similarity Analysis (SA) of HPLC Fingerprints
The J. rigida samples collected from 11 different regions were analyzed to develop a standard fingerprint under the established HPLC conditions. Fourteen common peaks were selected as characteristic, and peak 7 (retention time of 30.71 min) as the reference standard peak (Figure 2). Species of the same origin derived from different areas were tentatively identified based on the chromatograms, and similarities assessed with CASES software. The correlation coefficients of the samples ranged from 0.85 to 0.98 (Table 7). A high degree of similarity was detected among Chongli (S5), Dabaozhen (S6), Xiaosuangou (S7), and Wulahada (S8) samples from Hebei province, suggesting that J. rigida from Hebei are of the same origin with similar chemical constituents. The chromatograms appeared characteristic of the specific phenolic components, supporting disparities among plants derived from different regions.
Hierarchical Clustering Analysis (HCA)
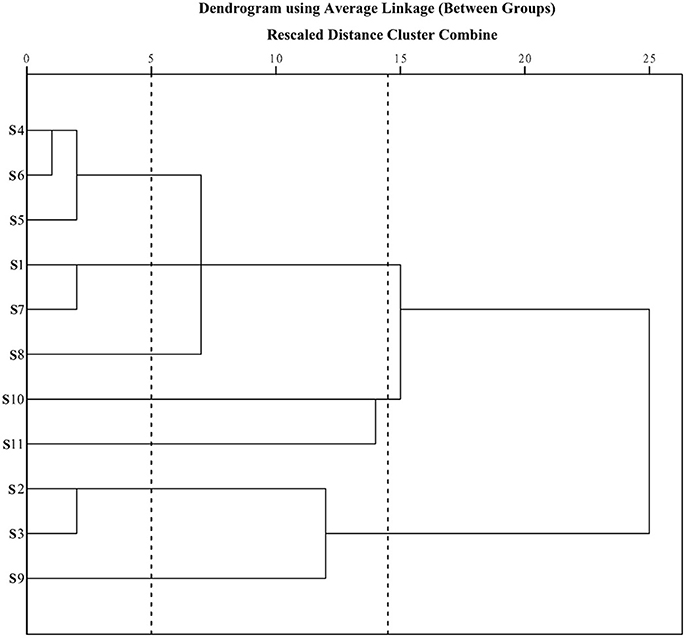
Prior to HCA, data were visually analyzed via overlapping tests using ChemStation software (Agilent, USA), and divided into three distinct patterns (G1, G2, and G3; Figure 3). Due to the subjective and non-quantitative nature of visual comparisons, the HCA assay was selected for quantitative assessment of J. rigida and relative peak areas (RPA) of the 14 common chromatographic peaks determined. A 14 × 11 matrix was formed for HCA using SPSS software, and a dendrogram acquired using average linkage between groups and the cosine method (Figure 3). The 11 samples were assorted into three quality clusters assuming a proper level of distance (14.5), consistent with the subjective results of visual classification. Group 1 included J. rigida derived from Fugu (S2), Yijun (S3), and Jinhua (S9) while Group 2 contained J. rigida from Fengcheng (S11) and Changbai Mountain (S10). Samples from the other six regions, including Helan Mountain (S1), Datong (S4), Chongli (S5), Dabaozhen (S6), Xiaosuangou (S7), and Wulahada (S8), were clustered in Group 3 owing to similarities in their chemical constituents. Group 2 possessed the highest contents of phenolic compounds while Group 1 exhibited the highest antioxidant activity. The quality of J. rigida derived from distinct regions differed due to a number of factors, such as altitude, latitude, longitude, and soil nutrients. Correlation coefficients of chromatograms within Groups 1, 2, and 3 corresponding to the simulated mean chromatograms were generated from the software.
The correlation coefficients of each chromatogram for G1, G2, and G3 are presented in Table 7. Chromatograms were similar within a particular group while significantly distinct between groups. The differences in similarity values for the three groups were consistent with data generated from HCA (Table 8). These results illustrate that HCA can effectively distinguish between J. rigida samples of the same origin from different districts and confirm classification based on morphological characteristics (Table 1).
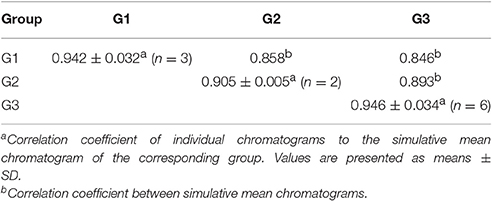
Table 8. Correlation coefficients between individual chromatograms within a group and group simulative mean chromatogram and between group simulative mean chromatograms.
Principal Component Analysis (PCA)
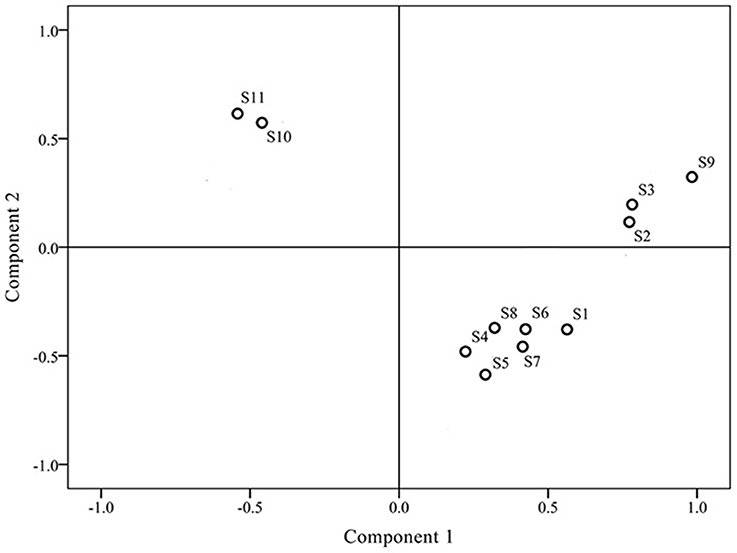
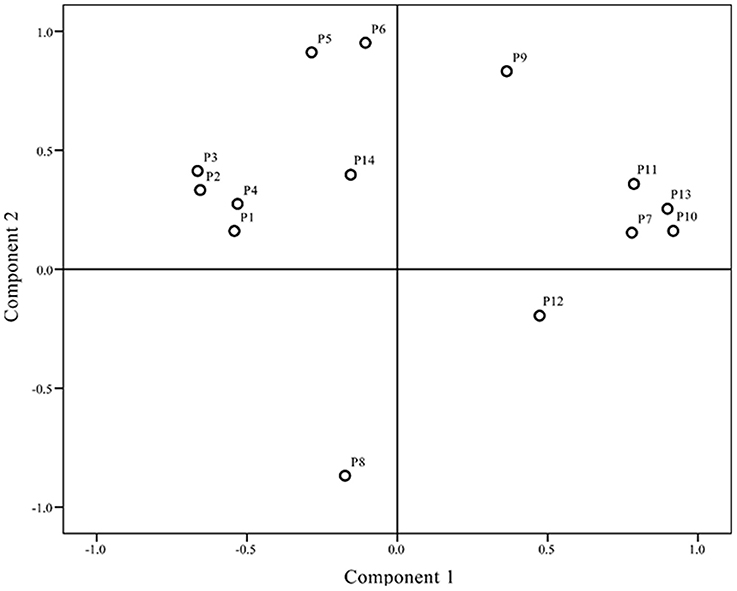
Differences in chromatograms of samples mainly existed due to content variations in the common components. To evaluate the discrimination capacity of the common constituents, PCA was conducted using the RPAs of common peaks using HCA input data. The first two principal components contained the most information of all variables, accounting for 87.51% of total variability. The score plot of the first three principal components, PC1 and PC2, visually revealed a positive influence on quality evaluation of J. rigida from different regions (Figure 4). PCA results were consistent with HCA findings, indicative of different chemical profiles from distinct locations. Analysis of the loading plot of PC1 against PC2 (Figure 5) revealed that peaks contributing to PC1 (7, 9, 10, 11, and 13) influenced the cluster in a top-down order. These were the compounds that distinguished S2, S3 and S9 as Group 1. Peaks 1, 2, 3, 4, 5, 6, and 14 that mainly contributed to PC2 led to the classification of S10 and S11 as Group 3. The remaining samples comprised Group 2. In summary, since PC1 contributing more peaks than PC2, samples on the right side of Figure 5 were presumed to be of higher quality. Accordingly, we concluded that J. rigida collected from Shaanxi province (S2, S3) and Jinhua (S9) were of the highest quality. Data from HCA and PCA supported each other and validated the quality evaluation of J. rigida samples.
Discriminant Analysis (DA)
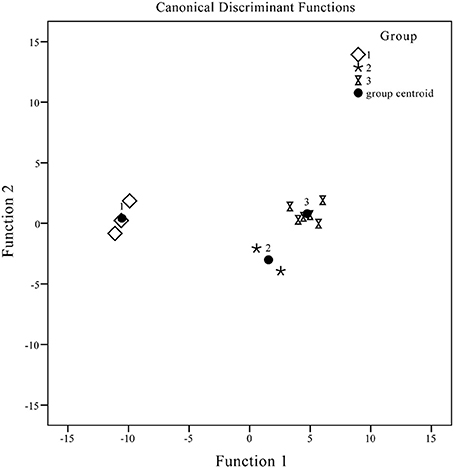
Discriminant analysis was employed to establish a predictive model to facilitate clustering and distinguishing of group members based on observed characteristics. The discriminant function generated on the basis of linear combinations of predictor variables was used to further discriminate and classify the unknown members. These functions were generated from samples with known membership and could be applied to new cases with known values for predictor variables but unknown group membership variables of unknown group membership.
Although 14 peaks were selected as variables from the patterns, not all the variables generated contributed to development of the discriminant function. Only valuable predictor variables may be selected to generate discriminant functions using this procedure. Two types of discriminant functions were acquired using SPSS software.
Canonical discriminant function:
Discrimination standard:
Fisher's discrimination function:
Standard for discriminant: each sample was assigned to a group according to the highest of the three functional values. X represents the variable and G1, G2, and G3 denote samples from Groups 1, 2, and 3, respectively. The variables assigned to the areas of peaks 1–7 were adopted to develop the discriminant functions. The inputted values of the three variables were obtained to form discriminant standard values and classify unknown samples. High-resolution DA plots for the three groups are displayed in Figure 6. The seven variables employed were the most discriminating, so that analytes included in Groups 1, 2, and 3 could be divided with 100% accuracy.
The phenolic components differed significantly among different regions of origin of J. rigida according to HPLC fingerprint analysis. These results were consistent with SA, HCA, PCA, and DA data, clearly indicating that the techniques were effective for quality assessment of J. rigida. The quality of medicinal herbs may contribute to the integrated influence of composite factors, such as environmental or genetic factors, cultivation methods, and collection periods. Therefore, quality evaluation of J. rigida via HPLC fingerprint analysis combined with chemometrics methods may be of vital importance to optimize its future use. Further studies should focus on the collection of samples from various regions of China and other countries for analysis via HPLC fingerprint combined with chemometrics as well as examination of environmental and genetic factors.
Conclusions
HPLC fingerprinting coupled with chemometrics was developed for the quality evaluation of J. rigida collected from different regions of China. All the J. rigida samples investigated possessed distinct phenolic profiles (based on assessment of total phenolic and total flavonoid contents and 10 phenolic compounds) and bioactivities, leading to two main conclusions. Firstly, J. rigida samples derived from Fengcheng (S11) and Changbai Mountain (S10) were of the highest quality in terms of effective bacterial inhibitor and bactericidal activities, attributable to their high total phenolic and total flavonoid contents and antibacterial effects. Secondly, J. rigida samples from Jinhua (S9) and Shaanxi (S2, S3) contained the most active ingredients (10 phenolic compounds) and showed the strongest antioxidant activities. These results provide critical information for quality evaluation of J. rigida samples from different geographical regions. Integrated information from comparisons and analyses revealed that samples of J. rigida collected from Jilin and Liaoning province displayed the highest bioactivity, possibly attributable to the geographical location at high altitudes and cold climatic conditions, followed by samples from Shaanxi province.
Combinations of RP-HPLC fingerprint SA, HCA, PCA, and DA were further adopted to develop an effective method for accurate classification and quantification of J. rigida. Fourteen characteristic peaks were identified, and a standard fingerprint validated for screening and quality evaluation of J. rigida. Furthermore, sample grouping based on HCA and PCA analyses coincided with their geographical regions of origin. Data from DA analysis further facilitated the development of a simple and reliable method with high precision, stability, and repeatability that could be adopted for accurate classification and quality control of samples of J. rigida with unknown membership.
In conclusion, the study have developed a flexible method involving HPLC fingerprint combined with chemometrics to evaluate the quality of traditional Chinese medicine. The accurate classification of J. rigida represents an essential first step in creating a validation system for the development of J. rigida-based health foods and supplements, which should increase consumer confidence in the efficacy and safety of the products and help manufacturers meet current and future quality criteria set by the regulatory authorities. Further research is warranted to clarify the relationship between environmental factors and phytochemical variations of J. rigida from different regions.
Author Contributions
DW and DL conceived and designed the experiments. ZL and SZ performed the experiments and analyzed the data. ZL, DW, and DL wrote the paper. DW critically revised the paper.
Conflict of Interest Statement
The authors declare that the research was conducted in the absence of any commercial or financial relationships that could be construed as a potential conflict of interest.
Acknowledgments
This work was supported by the program from the National Natural Science Foundation of China (No. 31570655) and Fundamental Research Funds for the Central Universities (QN2011077).
References
Abdel, N. E. G., Michele, L., Linda, M., Fabrizio, B., Valentina, V. E., Simona, N., et al. (2015). Chemical composition and antimicrobial activity of essential oil of wild and cultivated Origanum syriacum plants grown in Sinai, Egypt. Ind. Crop. Prod. 67, 201–207. doi: 10.1016/j.indcrop.2015.01.038
Benzie, I. F., and Strain, J. (2008). The ferric reducing ability of plasma (FRAP) as a measure of “antioxidant power”: the FRAP assay. Anal. Biochem. 239, 70–76. doi: 10.1006/abio.1996.0292
Burcu, B., Aysel, U., and Nurdan, S. (2014). Antimicrobial, antioxidant, antimutagenic activities, and phenolic compounds of Iris germanica. Ind. Crop Prod. 61, 526–530. doi: 10.1016/j.indcrop.2014.07.022
Duan, L. X., Chen, T. L., Li, M., Chen, M., Zhou, Y. Q., Cui, G. H., et al. (2012). Use of the metabolomics approach to characterize Chinese Medicinal Material Huangqi. Mol. Plant 5, 376–386. doi: 10.1093/mp/ssr093
EMEA London (1999). European Medicines Agency Final Proposals for Revision of the Note for Guidance on Quality of Herbal Remedies.
Gordien, A. Y., Gray, A. I., Franzblau, S. G., and Seidel, V. (2009). Antimycobacterial terpenoids from Juniperus communis L. (Cuppressaceae). J. Ethnopharmacol. 126, 500–505. doi: 10.1016/j.jep.2009.09.007
Harwood, M., Danielewska-Nikiel, B., Borzelleca, J., Flamm, G., and Williams, G. (2007). A critical review of the data related to the safety of quercetin and lack of evidence of in vivo toxicity, including lack of genotoxic/carcinogenic properties. Food Chem. Toxicol. 45, 2179–2205. doi: 10.1016/j.fct.2007.05.015
He, X., Liu, D., and Liu, R. H. (2008). Sodium borohydride/chloranil-based assay for 566 quantifying total flavonoids. J. Agric. Food Chem. 56, 9337–9344. doi: 10.1021/jf070954+
Jeong, E. J., Seo, H., Yang, H., Kim, J., Sung, S. H., Kim, Y. C. (2012). Anti-inflammatory phenolics isolated from Juniperus rigida leaves and twigs in lipopolysaccharide-stimulated RAW264.7 macrophage cells. J. Enzyme Inhibit. Med. Chem. 27, 875–879. doi: 10.3109/14756366.2011.625025
Lee, S. K., Jun, I. H., and Yoo, H. H. (2008). Characterization of in vitro metabolites of deoxypodophyllotoxin in human and rat liver microsomes using liquid chromatography/tandem mass spectrometry. Rapid Commun. Mass Spectr. 22, 52–58. doi: 10.1002/rcm.3325
Lee, Y. S., Kim, J. H., Kim, H. J., Sohn, E. J., Kim, C. S., Jeong, I. H., et al. (2010). Anti-lipase and lipolytic activities of EtOH extract from Juniperus rigida. Kor. J. Pharmacogn. 41, 216–220. Available online at: http://www.kci.go.kr/kciportal/ci/sereArticleSearch/ciSereArtiView.kci?sereArticleSearchBean.artiId=ART001485198locale=en&refineString=null&SID=Z24EjdP9GhuqH2YHEtp&timeSpan=null
Lesjak, M. M., Beara, I. N., Orcic, D. Z., Anackov, G. T., Balog, K. J., Franciskovic, M. M., et al. (2011). Juniperus sibirica Burgsdorf. as a novel source of antioxidant and anti-inflammatory agents. Food Chem. 124, 850–856. doi: 10.1016/j.foodchem.2010.07.006
Lesjak, M. M., Beara, I. N., Orcic, D. Z., Petar, K. N., Simin, N. D., Emilija, S. D., et al. (2014). Phytochemical composition and antioxidant, anti-inflammatory and antimicrobial activities of Juniperus macrocarpa Sibth. et Sm. J. Funct. Foods 7, 257–268. doi: 10.1016/j.jff.2014.02.003
Lesjak, M. M., Beara, I. N., Orcic, D. Z., Ristic, J. D., Anackov, G. T., Bozin, B. N., et al. (2013). Chemical characterisation and biological effects of Juniperus foetidissima Willd. (1806). LWT Food Sci. Technol. 53, 530–539. doi: 10.1016/j.lwt.2013.03.010
Li, T. B., Zhang, Y. F., Li, D. W., and Wang, C. Y. (2014). Seed germination performance of Juniperus rigida in different regions of the Loess Plateau and its relation with ecological factors. Agric. Res. Arid Areas 33, 139–143. doi: 10.7606/j.issn.1000-7601.2015.03.22
Liu, Q. X., Li, D. W., Wang, W., Wang, D. M., Meng, X. X., and Wang, Y. T. (2016). Chemical composition and antioxidant activity of essential oils and methanol extracts of different parts from Juniperus rigida SIEBOLD & ZUCC. Chem. Biodivers. 13, 1240–1250. doi: 10.1002/cbdv.201600048
Liu, W., Wang, D. M., Liu, J. J., Li, D. W., and Yin, D. X. (2016). Quality evaluation of Potentilla fruticosa L. by high performance liquid chromatography fingerprinting associated with chemometric methods. PLoS ONE. 11:e0149197. doi: 10.1371/journal.pone.0149197
Mocan, A., Crisan, G., Vlase, L., Crisan, O., Vodnar, D. C., Raita, O. et al. (2014). Comparative studies on polyphenolic composition, antioxidant and antimicrobial activities of Schisandra chinensis leaves and fruits. Molecules 19, 15162–15179. doi: 10.3390/molecules190915162
Mocan, A., Vlase, L., Vodnar, D. C., Gheldiu, A., Oprean, R., and Crisan, C. (2015). Antioxidant, antimicrobial effects and phenolic profile of Lycium barbarum L. flowers. Molecules 20, 15060–15071. doi: 10.3390/molecules200815060
Nyambaka, H., and Ryley, J. (2004). Multivariate analysis of the sensory changes in the dehydrated cowpea leaves. Talanta 64, 23–29. doi: 10.1016/j.talanta.2004.02.037
Özer, H., Sökmen, M., Güllüce, M., Adigüzel, A., and Sahin, F., Sökmen, A. (2007). Chemical composition and antimicrobial and antioxidant activities of the essential oil and methanol extract of Hippomarathrum microcarpum (Bieb.) from Turkey. J. Agric. Food Chem. 55, 937–942. doi: 10.1021/jf0624244
Pierce, K. M., Hope, J. L., Hoggard, J. C., and Synovec, R. E. (2006). A principal component analysis based method to discover chemical differences in comprehensive two-dimensional gas chromatography with time-of-flight mass spectrometry (GC×GC-TOFMS) separations of metabolites in plant samples. Talanta 70, 797–804. doi: 10.1016/j.talanta.2006.01.038
Ponce, A. G., Fritz, R., Del Valle, C. E., and Roura, S. I. (2003). Antimicrobial activity of essential oils on native microbial population of organic Swiss Chard. Lebenson Wiss Technol. 36, 679–684. doi: 10.1016/S0023-6438(03)00088-4
Robards, K., Prernzler, P. D., Tucker, G., Swatsitang, P., and Glover, W. (1999). Phenolic compounds and their role in oxidative processes in fruits. Food Chem. 80, 561–566. doi: 10.1016/s0308-8146(99)00093-x
Ryu, Y. B., Jeong, H. J., Kim, J. H., Kim, Y. M., Park, J. Y., Kim, D., et al. (2010). Biflavonoids from Torreya nucifera displaying SARS-CoV 3CLpro inhibition. Bioorg. Med Chem. 18, 7940–7947. doi: 10.1016/j.bmc.2010.09.035
Schroeder, M. P., and Messing, A. M. (1949). Methods for comparing the antibacterial activity of essential oils and other aqueous insoluble compounds. Bull. Nat. Formulary Commun. 17, 213–218.
Shi, X. M., Zhang, J. S., Tang, Q. J., Yang, Y., Hao, R. X., and Pan, Y. J. (2008). Fingerprint analysis of Lingzhi (Ganoderma) strains by high-performance liquid chromatography coupled with chemometric methods. World J. Microbiol. Biotechnol. 24, 2443–2450. doi: 10.1007/s11274-008-9766-7
Silva, F., Ferreira, S., Queiroz, J. A., and Domingues, F. C. (2011). Coriander (Coriandrum sativum L.) essential oil: its antibacterial activity and mode of action evaluated by flow cytometry. J. Med. Microbiol. 60, 1479–1486. doi: 10.1099/jmm.0.034157-0
Sobierajska, K., Boratynska, K., Jasinska, A., Dering, M., Ok, T., Douaihy, B., et al. (2016). Effect of the Aegean Sea barrier between Europe and Asia on differentiation in Juniperus drupacea (Cupressaceae). Bot. J. Linnean Soc. 180, 365–385. doi: 10.1111/boj.12377
Taviano, M. F., Marino, A., and Trovato, A. (2013). Juniperus oxycedrus L. subsp oxycedrus and Juniperus oxycedrus L. subsp macrocarpa (Sibth. & Sm.) Ball. “berries” from Turkey: comparative evaluation of phenolic profile, antioxidant, cytotoxic and antimicrobial activities. Food Chem. Toxicol. 58, 22–29. doi: 10.1016/j.fct.2013.03.049
US Food and Drug Administration Rockville (2000). Food and Drug Administration FDA Guidance for Industry—Botanical Drug Products. US Food and Drug Administration: Rockville.
Wan, J. B., Yang, F. Q., Li, S. P., Wang, Y. T., and Cui, X. M. (2006). Chemical characteristics for different parts of Panax notoginseng using pressurized liquid extraction and HPLC-ELSD. J. Pharm. Biomed. Anal. 41, 1596–1601. doi: 10.1016/j.jpba.2006.01.058
Wang, D. M., He, F. Y., Lv, Z. J., and Li, D. W. (2014). Phytochemical composition, antioxidant activity and HPLC fingerprinting profiles of three Pyrola species from different regions. PLoS ONE 9:e96329. doi: 10.1371/journal.pone.0096329
Wang, J. J., Zhi, X. Y., and Yu, X. (2013). Synthesis and insecticidal activity of new deoxypodophyllotoxin-based phenazine analogues against mythimna separata walker. J. Agric. Food Chem. 61, 6336–6343. doi: 10.1021/jf4011033
Wang, S., Ma, H. Q., Sun, Y. J., Qiao, C. D., Shao, S. J., and Jiang, S. X. (2007). Fingerprint quality control of Angelica sinensis (Oliv.) Diels by high-performance liquid chromatography coupled with discriminant analysis. Talanta 72, 434–436. doi: 10.1016/j.talanta.2006.11.006
Wei, A., and Shibamoto, T. (2007). Antioxidant activities and volatile constituents of various essential oils. J. Agric. Food Chem. 55, 1737–1742. doi: 10.1021/jf062959x
WHO Geneva (2000). World Health Organization General Guidelines for Methodologies on Research and Evaluation of Traditional Medicine. WHO: Geneva.
Woo, K. W., Choi, S. U., Park, J. C., Lee, K. R. (2011). A new lignan glycoside from Juniperus rigida. Arch. Pharm. Res. 34, 2043–2049. doi: 10.1007/s12272-011-1206-9
Wu, S. S., and Lin, Y. (2014). The research of Juniperus rigida leaves in mongolian medicine. J. Med. Pharm. Chinese Minorit. 6, 55–58.
Yan, F., Liang, Z., Jianna, C., Zhengtao, W., Losahan, X., and Zhengxing, Z. (2001). Analysis of Cnidium monnieri fruits in different regions of China. Talanta 53, 1155–1162. doi: 10.1016/S0039-9140(00)00594-4
Yang, L. C., Li, R., Tan, J., and Jiang, Z. T. (2013). Polyphenolics composition of the leaves of Zanthoxylum bungeanum Maxim. grown in Hebei, China, and their radical scavenging activities. J. Agric. Food Chem. 61, 1772–1778. doi: 10.1021/jf3042825
Yen, G. C., and Chen, H. Y. (1995). Antioxidant activity of various tea extracts in relation to their antimutagenicity. J. Agric. Food Chem. 43, 27–32. doi: 10.1021/jf00049a007
Keywords: Juniperus rigida, phenolic profiles, bioactivities, HPLC fingerprint, chemometrics
Citation: Liu Z, Wang D, Li D and Zhang S (2017) Quality Evaluation of Juniperus rigida Sieb. et Zucc. Based on Phenolic Profiles, Bioactivity, and HPLC Fingerprint Combined with Chemometrics. Front. Pharmacol. 8:198. doi: 10.3389/fphar.2017.00198
Received: 20 December 2016; Accepted: 27 March 2017;
Published: 19 April 2017.
Edited by:
Kok Gan Chan, University of Malaya, MalaysiaCopyright © 2017 Liu, Wang, Li and Zhang. This is an open-access article distributed under the terms of the Creative Commons Attribution License (CC BY). The use, distribution or reproduction in other forums is permitted, provided the original author(s) or licensor are credited and that the original publication in this journal is cited, in accordance with accepted academic practice. No use, distribution or reproduction is permitted which does not comply with these terms.
*Correspondence: Dongmei Wang, ZG13bGlAMTYzLmNvbQ==
Dengwu Li, ZGVuZ3d1bGlAMTYzLmNvbQ==
 Zehua Liu
 Dongmei Wang
